• Oil & Gas,Power Utilities,Pipeline
• Oil & Gas,Power Utilities,Pipeline
Federal, state, local: new rules have been coming from all levels in the past months, affecting the energy industry. The EPA is adding new methane rules, and PHMSA set out new guidelines for gathering systems, claiming oversight for a vast majority of infrastructure in basins across the United States. These rules affect upstream and midstream sectors, and utilities will likely be next. Though time will tell how soon these rules go into effect, it does appear that oversight will increase in the coming years.
I can’t speak to the validation or necessity of these regulations, but it is my job to offer insight on what tools are available and how they are being used to get ahead of increasing regulatory oversight.
The satellite data we analyze offers another inspection and monitoring platform to supplement (or in some instances replace) SCADA, aerial, and ground inspections. For example, declining health of small plants and grassy areas sometimes indicates small underground leaks from gathering systems that can go unnoticed by SCADA systems, but not satellites.
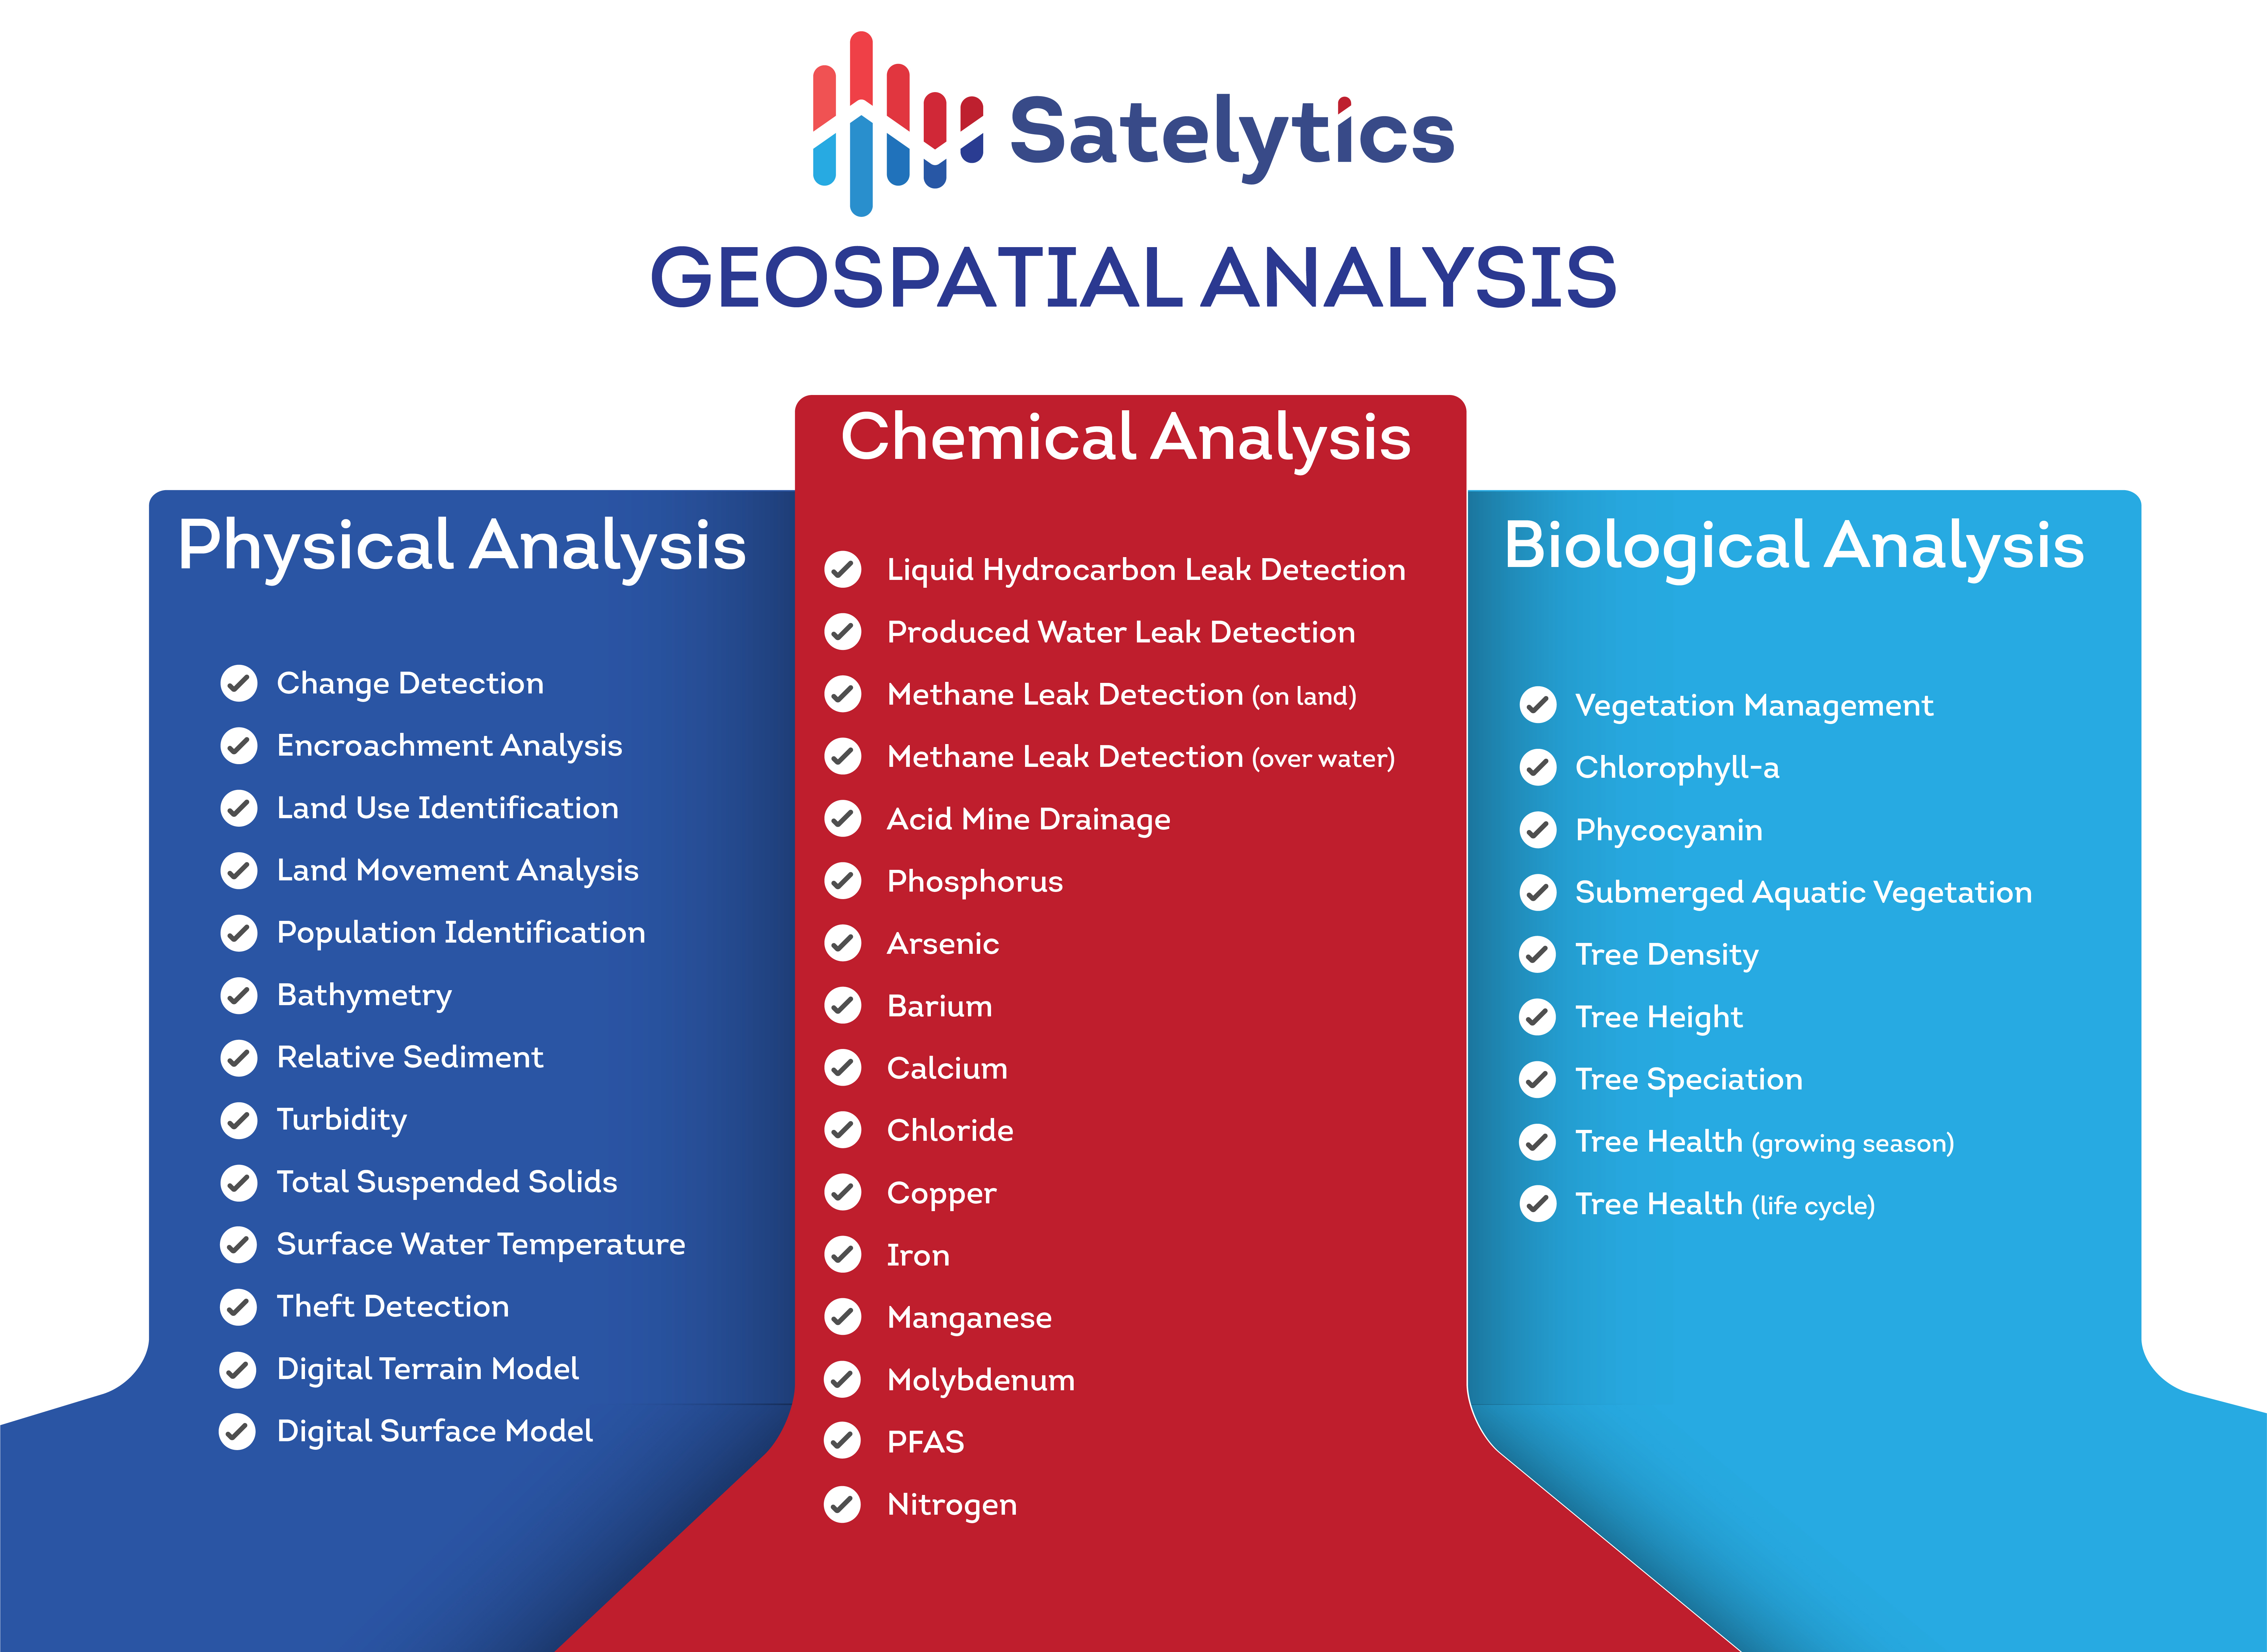
What else can be identified or measured?
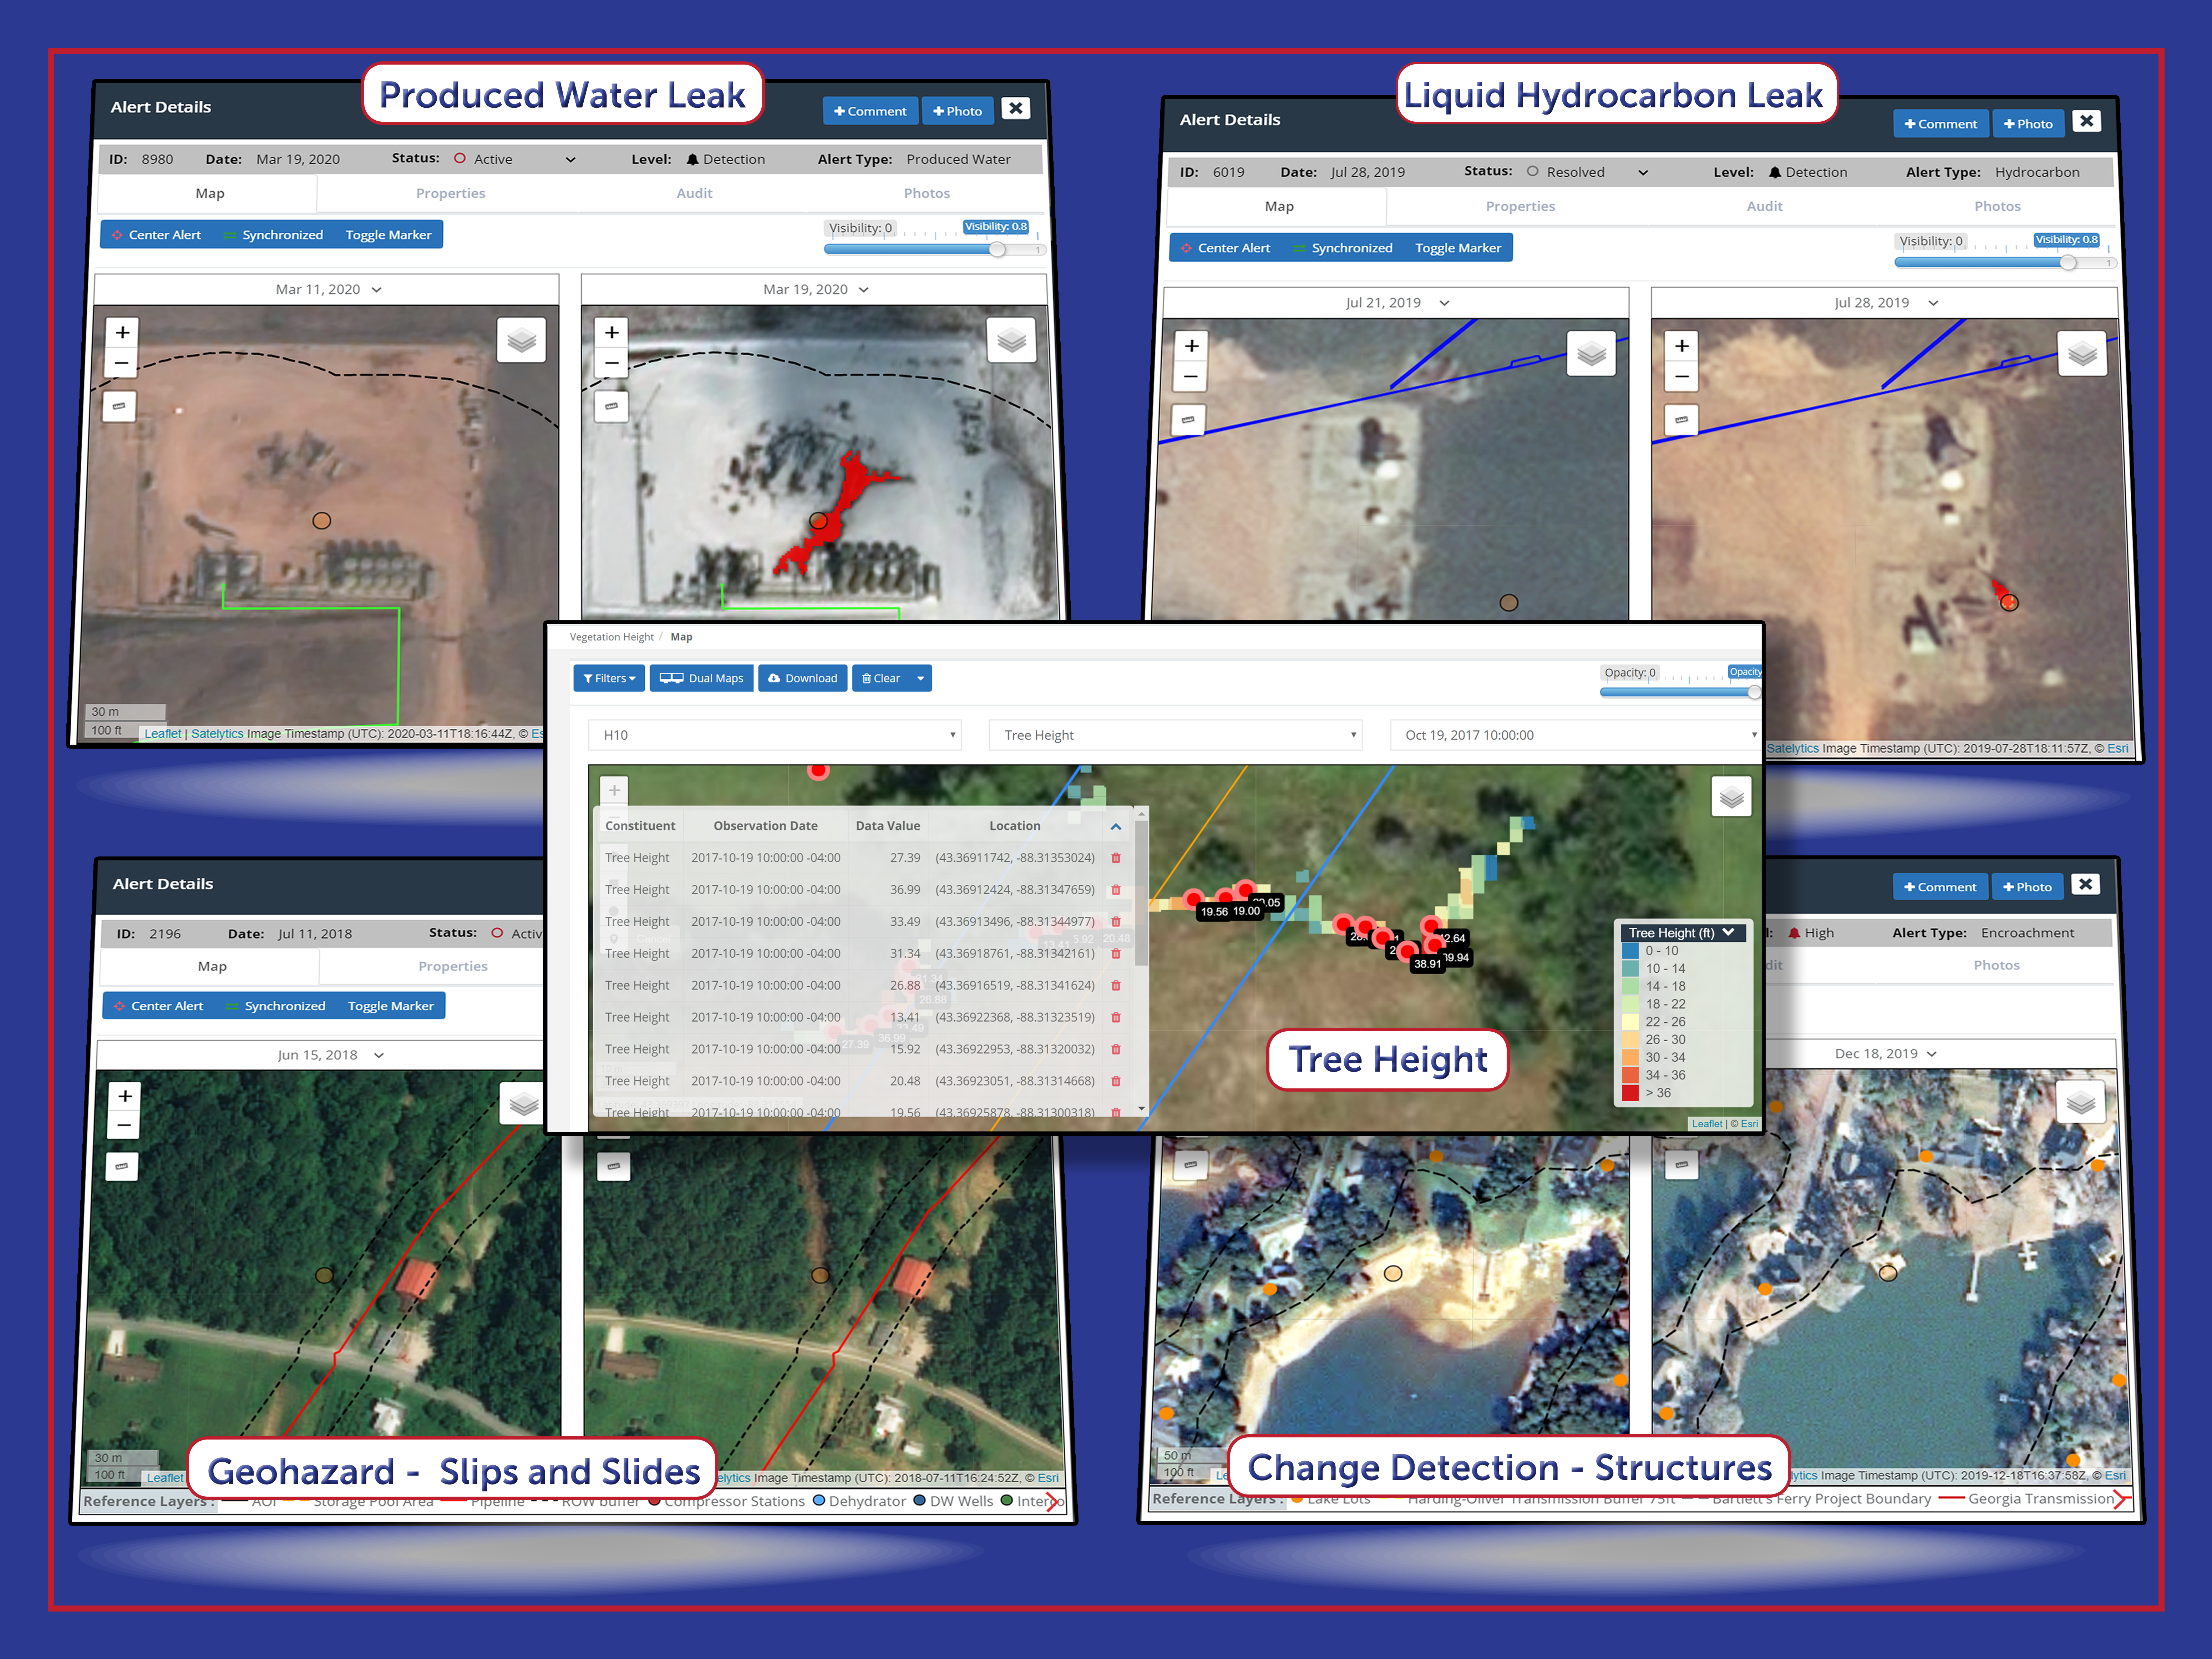
A sampling of the forty+ Satelytics algorithms available
How much can be identified with satellite data?
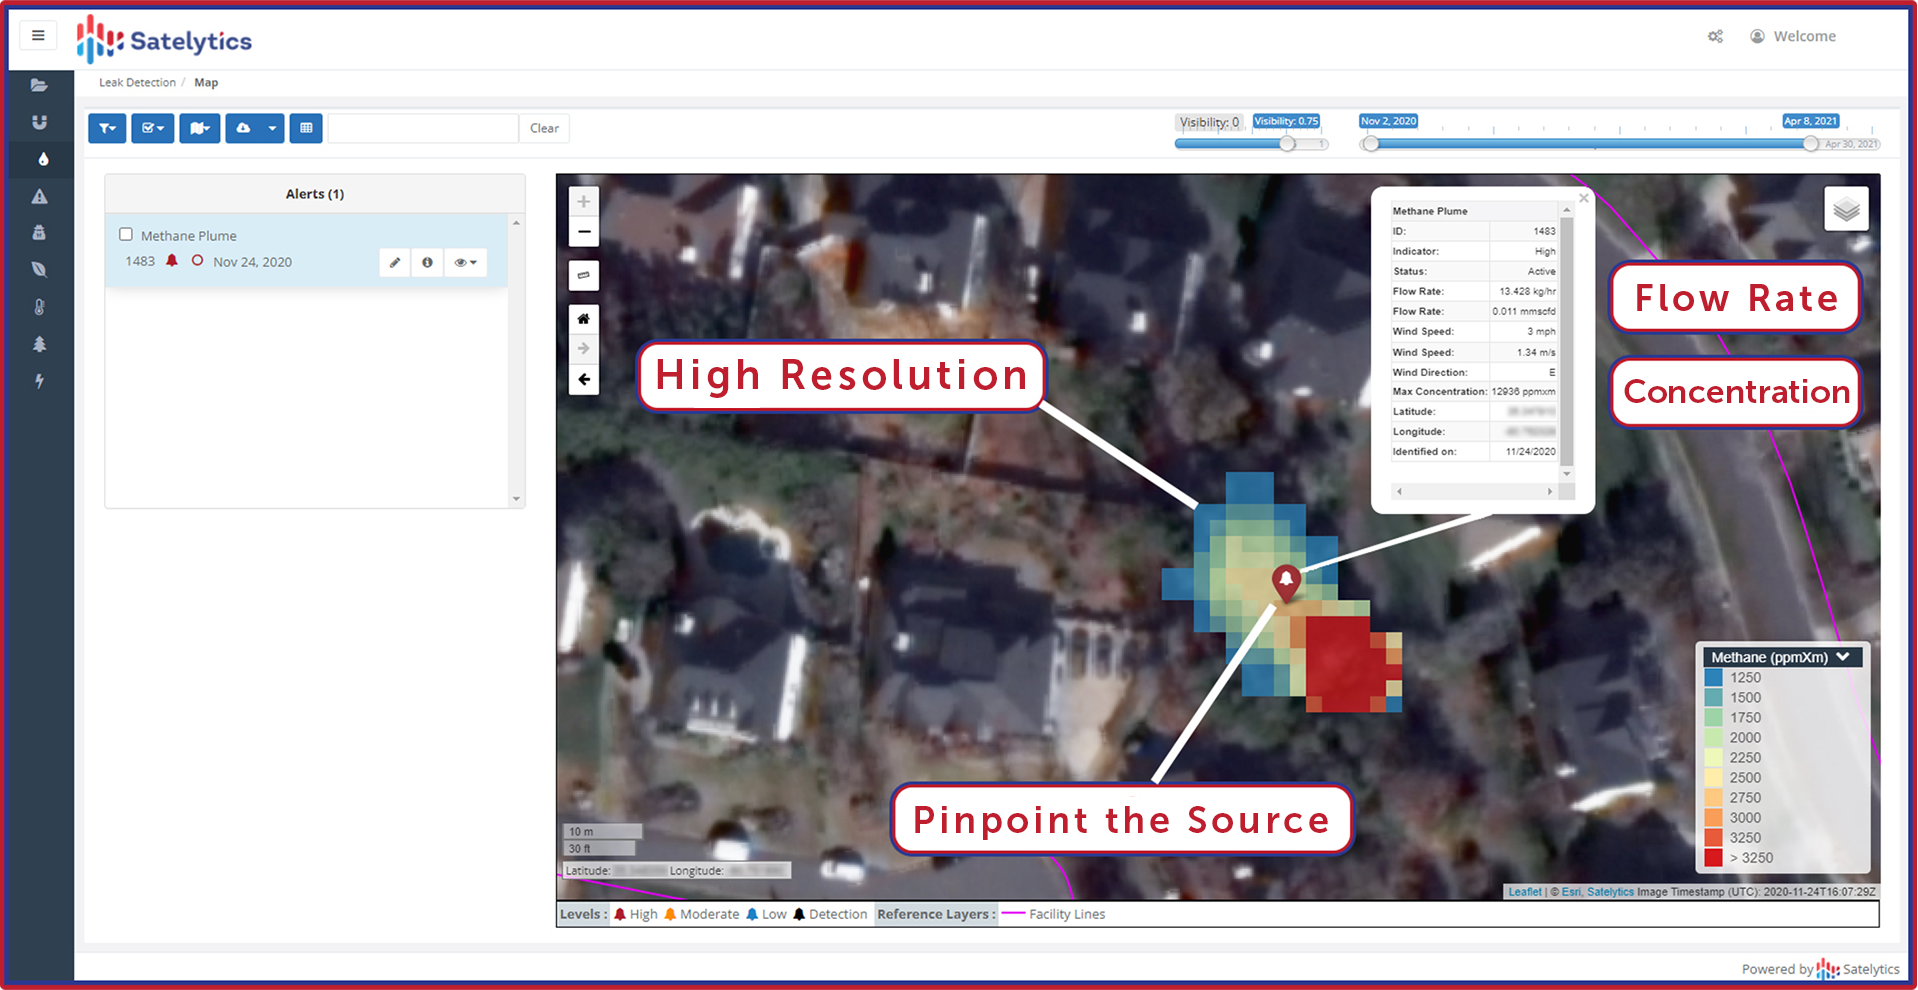
Satelytics processes commercial satellite data with spatial resolution down to the square foot, so our trained algorithms can identify any change, substance, or object larger than that. Satelytics’ methane tool locates plumes within 4 meters of their source. High-resolution images allow for methane quantification, which is being used for compliance reporting — more on this next week.
How often can monitoring occur, and what is the turnaround time for satellite monitoring and geospatial analytics?
High-resolution imagery (0.5-m pixels or less) can be obtained 4-5 times per week. The turnaround time from image capture to the delivery of alerts is hours, not days or weeks. A growing number of Earth observation satellites investments is propelling increased revisit frequencies and data transfer speeds.
What about accuracy?
Our 40+ algorithms have been trained and verified in the field worldwide. When quantification is offered, accuracy is guaranteed within 10% right off the shelf and increases with subsequent analyses. Our customers report false positive alerts lower than 5% as areas are revisited on 3rd and 4th passes.
In the next article of this series, we will touch on the growing acceptance of satellite monitoring and geospatial analytics by regulators.
We use cookies to analyze our web traffic and to enhance your experience. By continuing to view this website, you agree to our use of cookies.
Our Privacy Policy