Eleven major U.S. metros saw rents decline, with the largest drops in Milwaukee, Minneapolis and Baltimore.
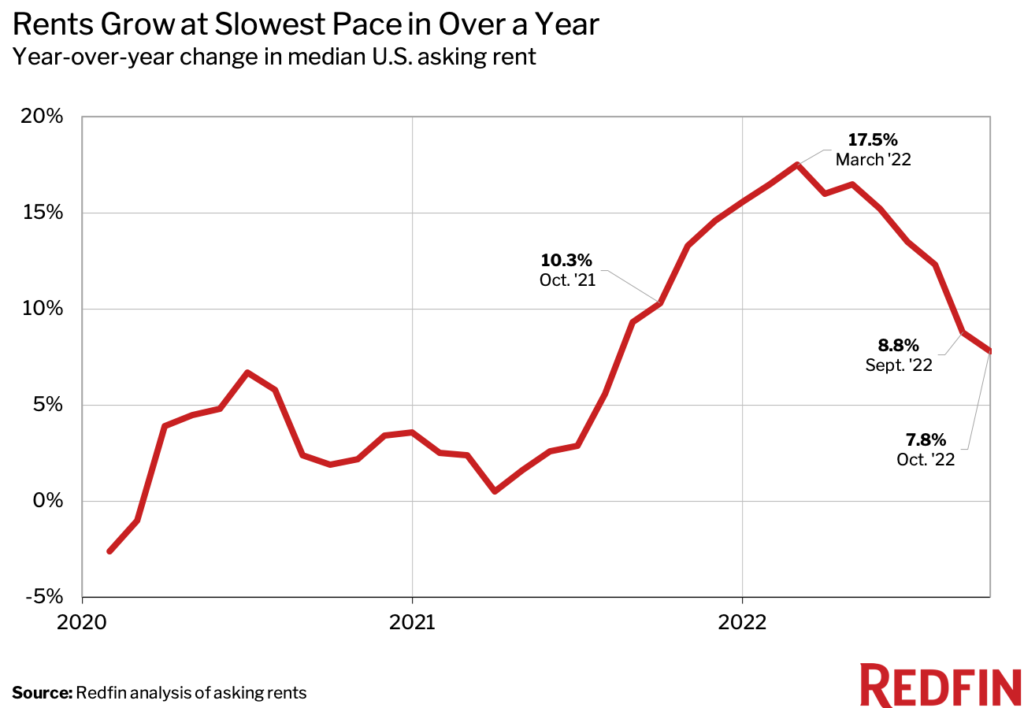
The median U.S. asking rent in October rose 7.8% year over year to $1,983, the smallest annual increase since August 2021. October marked the second-straight month of single-digit rent growth following roughly a year of double-digit gains. It was also the fifth-consecutive month in which annual rent growth decelerated, with rents rising at about half the pace they were six months earlier. Rents declined 0.9% on a month-over-month basis.
“Demand for rentals is slowing because economic uncertainty is prompting many renters to stay put, and persistent inflation is shrinking renter budgets. That’s causing rent growth to cool,” said Redfin Deputy Chief Economist Taylor Marr. “There are signs that inflation is starting to ease, but it will likely be a while before renters see meaningful relief given that rents are still up more than wages.”
| Rental Market Summary | October 2022 | Month-Over-Month | Year-Over-Year |
|---|---|---|---|
| Median Monthly Rent | $1,983 | -0.9% | 7.8% |
Rents Declined in 11 Major U.S. Metros
In Milwaukee, asking rents fell 17.6% year over year in October, the largest drop among the 50 most populous U.S. metropolitan areas. Next came Minneapolis (-7.8%), Baltimore (-3.2%), Seattle (-2.7%) and Boston (-2.5%). Six other metros, including Austin and Atlanta, also experienced rent declines. By comparison, only five metros saw rents fall In September.
- Milwaukee, WI (-17.6%)
- Minneapolis, MN (-7.8%)
- Baltimore, MD (-3.2%)
- Seattle, WA (-2.7%)
- Boston, MA (-2.5%)
- Austin, TX (-2.3%)
- Atlanta, GA (-2.2%)
- Columbus, OH (-1.7%)
- Los Angeles, CA (-1.1%)
- Chicago, IL (-1.1%)
- Houston, TX (-0.8%)
Rents Increased Most in the Midwest, South
In Oklahoma City, rents jumped 31.7% year over year in October, the biggest increase among the 50 most populous metros. It was followed by Raleigh, NC (21%), Cincinnati (17%), Louisville, KY (15.8%) and Indianapolis (15.1%).
- Oklahoma City, OK (31.7%)
- Raleigh, NC (21.0%)
- Cincinnati, OH (17.0%)
- Louisville, KY (15.8%)
- Indianapolis, IN (15.1%)
- Providence, RI (13.6%)
- Salt Lake City, UT (13.6%)
- Nashville, TN (13.2%)
- Pittsburgh, PA (12.8%)
- San Antonio, TX (10.6%)
Median Asking Rents, October 2022
| U.S. Metro Area | Median Asking Rent | Year-Over-Year Change in Median Asking Rent |
| Atlanta, GA | $1,991 | -2.2% |
| Austin, TX | $2,187 | -2.3% |
| Baltimore, MD | $2,008 | -3.2% |
| Birmingham, AL | $1,517 | 9.2% |
| Boston, MA | $3,621 | -2.5% |
| Buffalo, NY | $1,550 | 7.5% |
| Charlotte, NC | $1,920 | 4.9% |
| Chicago, IL | $2,460 | -1.1% |
| Cincinnati, OH | $1,625 | 17.0% |
| Cleveland, OH | $1,502 | 9.4% |
| Columbus, OH | $1,502 | -1.7% |
| Dallas, TX | $2,093 | 3.1% |
| Denver, CO | $2,732 | 7.2% |
| Detroit, MI | $1,613 | 5.6% |
| Hartford, CT | $2,055 | 6.2% |
| Houston, TX | $1,732 | -0.8% |
| Indianapolis, IN | $1,476 | 15.1% |
| Jacksonville, FL | $1,628 | 1.7% |
| Kansas City, MO | $1,468 | 4.1% |
| Las Vegas, NV | $1,826 | 2.5% |
| Los Angeles, CA | $3,416 | -1.1% |
| Louisville, KY | $1,371 | 15.8% |
| Memphis, TN | $1,565 | 10.4% |
| Miami, FL | $3,140 | 8.5% |
| Milwaukee, WI | $1,625 | -17.6% |
| Minneapolisn, MN | $1,748 | -7.8% |
| Nashville, TN | $2,063 | 13.2% |
| New Orleans, LA | $1,695 | 9.4% |
| New York, NY | $4,068 | 9.6% |
| Oklahoma City, OK | $1,301 | 31.7% |
| Orlando, FL | $2,081 | 2.2% |
| Philadelphia, PA | $2,344 | 4.2% |
| Phoenix, AZ | $2,028 | 2.8% |
| Pittsburgh, PA | $1,877 | 12.8% |
| Portland, OR | $2,556 | 8.7% |
| Providence, RI | $2,473 | 13.6% |
| Raleigh, NC | $2,054 | 21.0% |
| Richmond, VA | $1,735 | 3.3% |
| Riverside, CA | $2,728 | 3.6% |
| Sacramento, CA | $2,839 | 7.7% |
| Salt Lake City, UT | $1,931 | 13.6% |
| San Antonio, TX | $1,393 | 10.6% |
| San Diego, CA | $3,371 | 9.6% |
| San Francisco, CA | $3,664 | 9.8% |
| San Jose, CA | $3,546 | 6.5% |
| Seattle, WA | $2,950 | -2.7% |
| St. Louis, MO | $1,584 | 9.5% |
| Tampa, FL | $2,115 | 2.9% |
| Virginia Beach, VA | $1,683 | 3.1% |
| Washington, D.C. | $2,642 | 2.8% |
| National—U.S.A. | 1,983 | 7.8% |
Methodology
Redfin analyzed rent prices from Rent. across the 50 largest U.S. metro areas. This analysis uses data from more than 20,000 apartment buildings across the country.
It is important to note that the prices in this report reflect the current costs of new leases during each time period. In other words, the amount shown as the median rent is not the median of what all renters are paying, but the median cost of apartments that were available for new renters during the report month. Currently, Redfin’s data from Rent. includes only median rent at the metro level. Future reports will compare median rent prices at a more granular geographic level.
 United States
 Canada