Article

Assessing the Fresh–Saline Groundwater Distribution in the Nile Delta Aquifer Using a 3D Variable-Density Groundwater Flow Model

by
Marmar Mabrouk
1,2,*,
Andreja Jonoski
2,
Gualbert H. P. Oude Essink
3,4 and
Stefan Uhlenbrook
2,5,6
1
Ministry of Water Resources and Irrigation, Nile Water Sector, P.O. Box 11471, 11728 Cairo, Egypt
2
IHE Delft, Department of Integrated Water Systems and Governance, P.O. Box 3015, 2601 DA Delft, The Netherlands
3
Deltares, Unit of Subsurface and Groundwater Systems, Daltonlaan 600, P.O. Box 85467, 3584 BK Utrecht, The Netherlands
4
Department of Physical Geography, Utrecht University, Princetonlaan 8a, P.O, Box 85467, 3584 CB Utrecht, The Netherlands
5
Delft University of Technology, Water Resources Section, P.O. Box 5048, 2600 GA Delft, The Netherlands
6
World Water Assessment Programme, UNESCO, Villa La Colombella, Colombella Alta, 06134 Perugia, Italy
*
Author to whom correspondence should be addressed.
Water 2019, 11(9), 1946; https://doi.org/10.3390/w11091946
Submission received: 27 July 2019 / Revised: 12 September 2019 / Accepted: 16 September 2019 / Published: 19 September 2019

Abstract

:
The Nile Delta Aquifer (NDA) is threatened by salt water intrusion (SWI). This article demonstrates an approach for identifying critical salinity concentration zones using a three-dimensional (3D) variable-density groundwater flow model in the NDA. An innovative procedure is presented for the delineation of salinity concentration in 2010 by testing different simulation periods. The results confirm the presence of saline groundwater caused by SWI in the north of the NDA. In addition, certain regions in the east and southwest of the NDA show increased salinity concentration levels, possibly due to excessive groundwater extraction and dissolution of marine fractured limestone and shale that form the bedrock underlying the aquifer. The research shows that the NDA is still not in a state of dynamic equilibrium. The modeling instrument can be used for simulating future scenarios of SWI to provide a sustainable adaptation plan for groundwater resource.

1. Introduction

The Nile Delta is the most fertile land in Egypt, inducing extensive agricultural activities. Since the 1960s, these activities were primarily sustained by surface water from the Nile. In recent decades, however, increasing water demand has brought the situation that the river can no longer provide a sufficient amount of water. Consequently, the Nile Delta Aquifer (NDA) is increasingly being exploited to obtain fresh groundwater. At the same time, these groundwater resources are being jeopardized by salt water intrusion (SWI), a common problem for coastal aquifers around the world, even more when groundwater extraction is substantial [1,2]. In Egypt, SWI has already led to the salinization of groundwater extraction wells in coastal cities such as Alexandria [3]. This situation is expected to become worse, due to combined effects of climate change-induced sea-level rise (SLR) [4], and excessive groundwater extractions for e.g., reclamation development projects [5], especially in El-Buhaira governorate (Figure 1). Overexploitation of fresh groundwater is also likely to occur in the Nile Delta, as the rapidly growing population depends increasingly upon groundwater extraction for domestic water needs [6]. To counteract/manage/anticipate these threats, a better understanding of the present hydrogeological conditions of the NDA is required: Its geological condition, its groundwater dynamics, its relation with the surface water system, and its current salinity concentration distribution.
In recent decades, different aspects of the Nile Delta have been investigated through research on geology [7,8,9], land subsidence and SLR [10,11], geochemistry [12,13], and SWI processes in the NDA and its hydrogeology [14]. Since the 1980s, researchers have used different numerical approaches to delineate fresh and saline groundwater interfaces. Two-dimensional (2D) models have been developed to simulate 2D cross-sections over the delta by [15,16], while [17] used 2D models in a horizontal plane for parts of the NDA.
Modeling approaches for simulating three-dimensional (3D) variable-density groundwater flow have recently shown rapid progress. A comprehensive overview of groundwater SWI situations, including relevant modeling approaches, is given in [2]. For the NDA, most research on quantifying variable-density groundwater flow processes has been carried out using 2D models, which cannot capture the full dynamics of the fresh groundwater–seawater interactions [17]. FEFLOW has been used by [18] to present the concept of equivalent fresh groundwater head in successive horizontal SWI simulations. Simulations in 2D were performed in four horizontal model layers representing different depths of the aquifer. Due to lack of sufficient data, several simplifying assumptions had to be made in that study regarding hydrological stresses, such as an average recharge rate over the entire Nile Delta. Later, [19] developed a 3D model in SEAWAT, using 28 vertical model layers, but most of the assumptions about hydrogeological stresses remained the same as in their previous work [18]. Followed by [20], who used SEAWAT to delineate the fresh and saline groundwater in the Nile Delta. They found that groundwater fluxes in the deep layers of NDA approach the sea, which helps to retain the old brine in deeper zones. They used measured salinity concentrations as initial conditions and high longitudinal dispersivities (more than 1 km, whereas normal values on delta scale are in order of tens of meters or lower). The acceptable bandwidth of dispersivity is comprehensively discussed in [21], as well as previously reported modeling cases of regional coastal aquifer systems [22,23,24]. Later, [25] investigated and proposed different strategies to protect the eastern NDA from SWI, but did not study the entire NDA. He found that the extraction of brackish groundwater provides a very high reduction of SWI. However, the combination of decreasing extraction, increasing recharge, and extracting brackish groundwater scenarios provides the highest reduction of SWI.
Although previous studies have shown the applicability of variable-density groundwater flow modeling as a useful instrument, development of a reliable regional 3D model for variable-density groundwater flow that can serve as a tool for analyzing future scenarios and potential adaptation measures is still lacking. One obstacle in this development is the lack of a sufficient amount of reliable hydrogeological data to be used for model setup, as well as for validating model outputs with monitored conditions of the groundwater resources in the NDA. In this article, we present the development of a 3D variable-density groundwater flow model for the NDA using existing, as well as new, more reliable data that have not been used before for similar purposes. The model has been developed to capture the situation in the year 2010 (representing present conditions), since, for this year, most data are available. Various types of reliable hydrogeological data have been collected from different departments and research institutions belonging to the Egyptian Ministry of Water Resources and Irrigation, as well as data from private sector organizations.
In addition to the contribution regarding the use of a rich dataset for the model development, this article also presents a straightforward but innovative modeling procedure for determining the present 3D salinity concentration distribution (in the year 2010). First, the model was set up with structure and parametrization based on available data and expert judgment. Assuming that these were representative enough, the procedure tested nine models with different simulation periods, always starting with a completely fresh groundwater distribution in the entire NDA. The model that provided the best match between modeled and observed salinity concentration data in the year 2010 was then chosen as most reliable. Unlike some previous research aimed at developing fully-fledged transient models, e.g., [26,27,28], our procedure solely uses transient simulation models with the objective to capture best the salinity concentration distribution in the year 2010, without a classical calibration approach of testing and adjusting different parameter values. The developed model can continue to be improved, but the obtained results indicate that it can already be used to assess the impacts of future SLR and groundwater extraction. From there, the effectiveness of adaptation and mitigation measures can be tested in future.
After this introduction, Section 2 presents an overview of the physical settings of the NDA. It is followed by Section 3 with a brief description of SEAWAT [29], the 3D code used in this study. This section includes the model setup, boundary conditions, hydrogeological parameters, hydrological stresses, as well as the innovative procedure to determine the salinity concentration distribution. In Section 4, the salinity concentration distribution and the groundwater characteristics within the NDA are discussed, followed by Section 5 with conclusions and recommendations.

2. Physical Settings
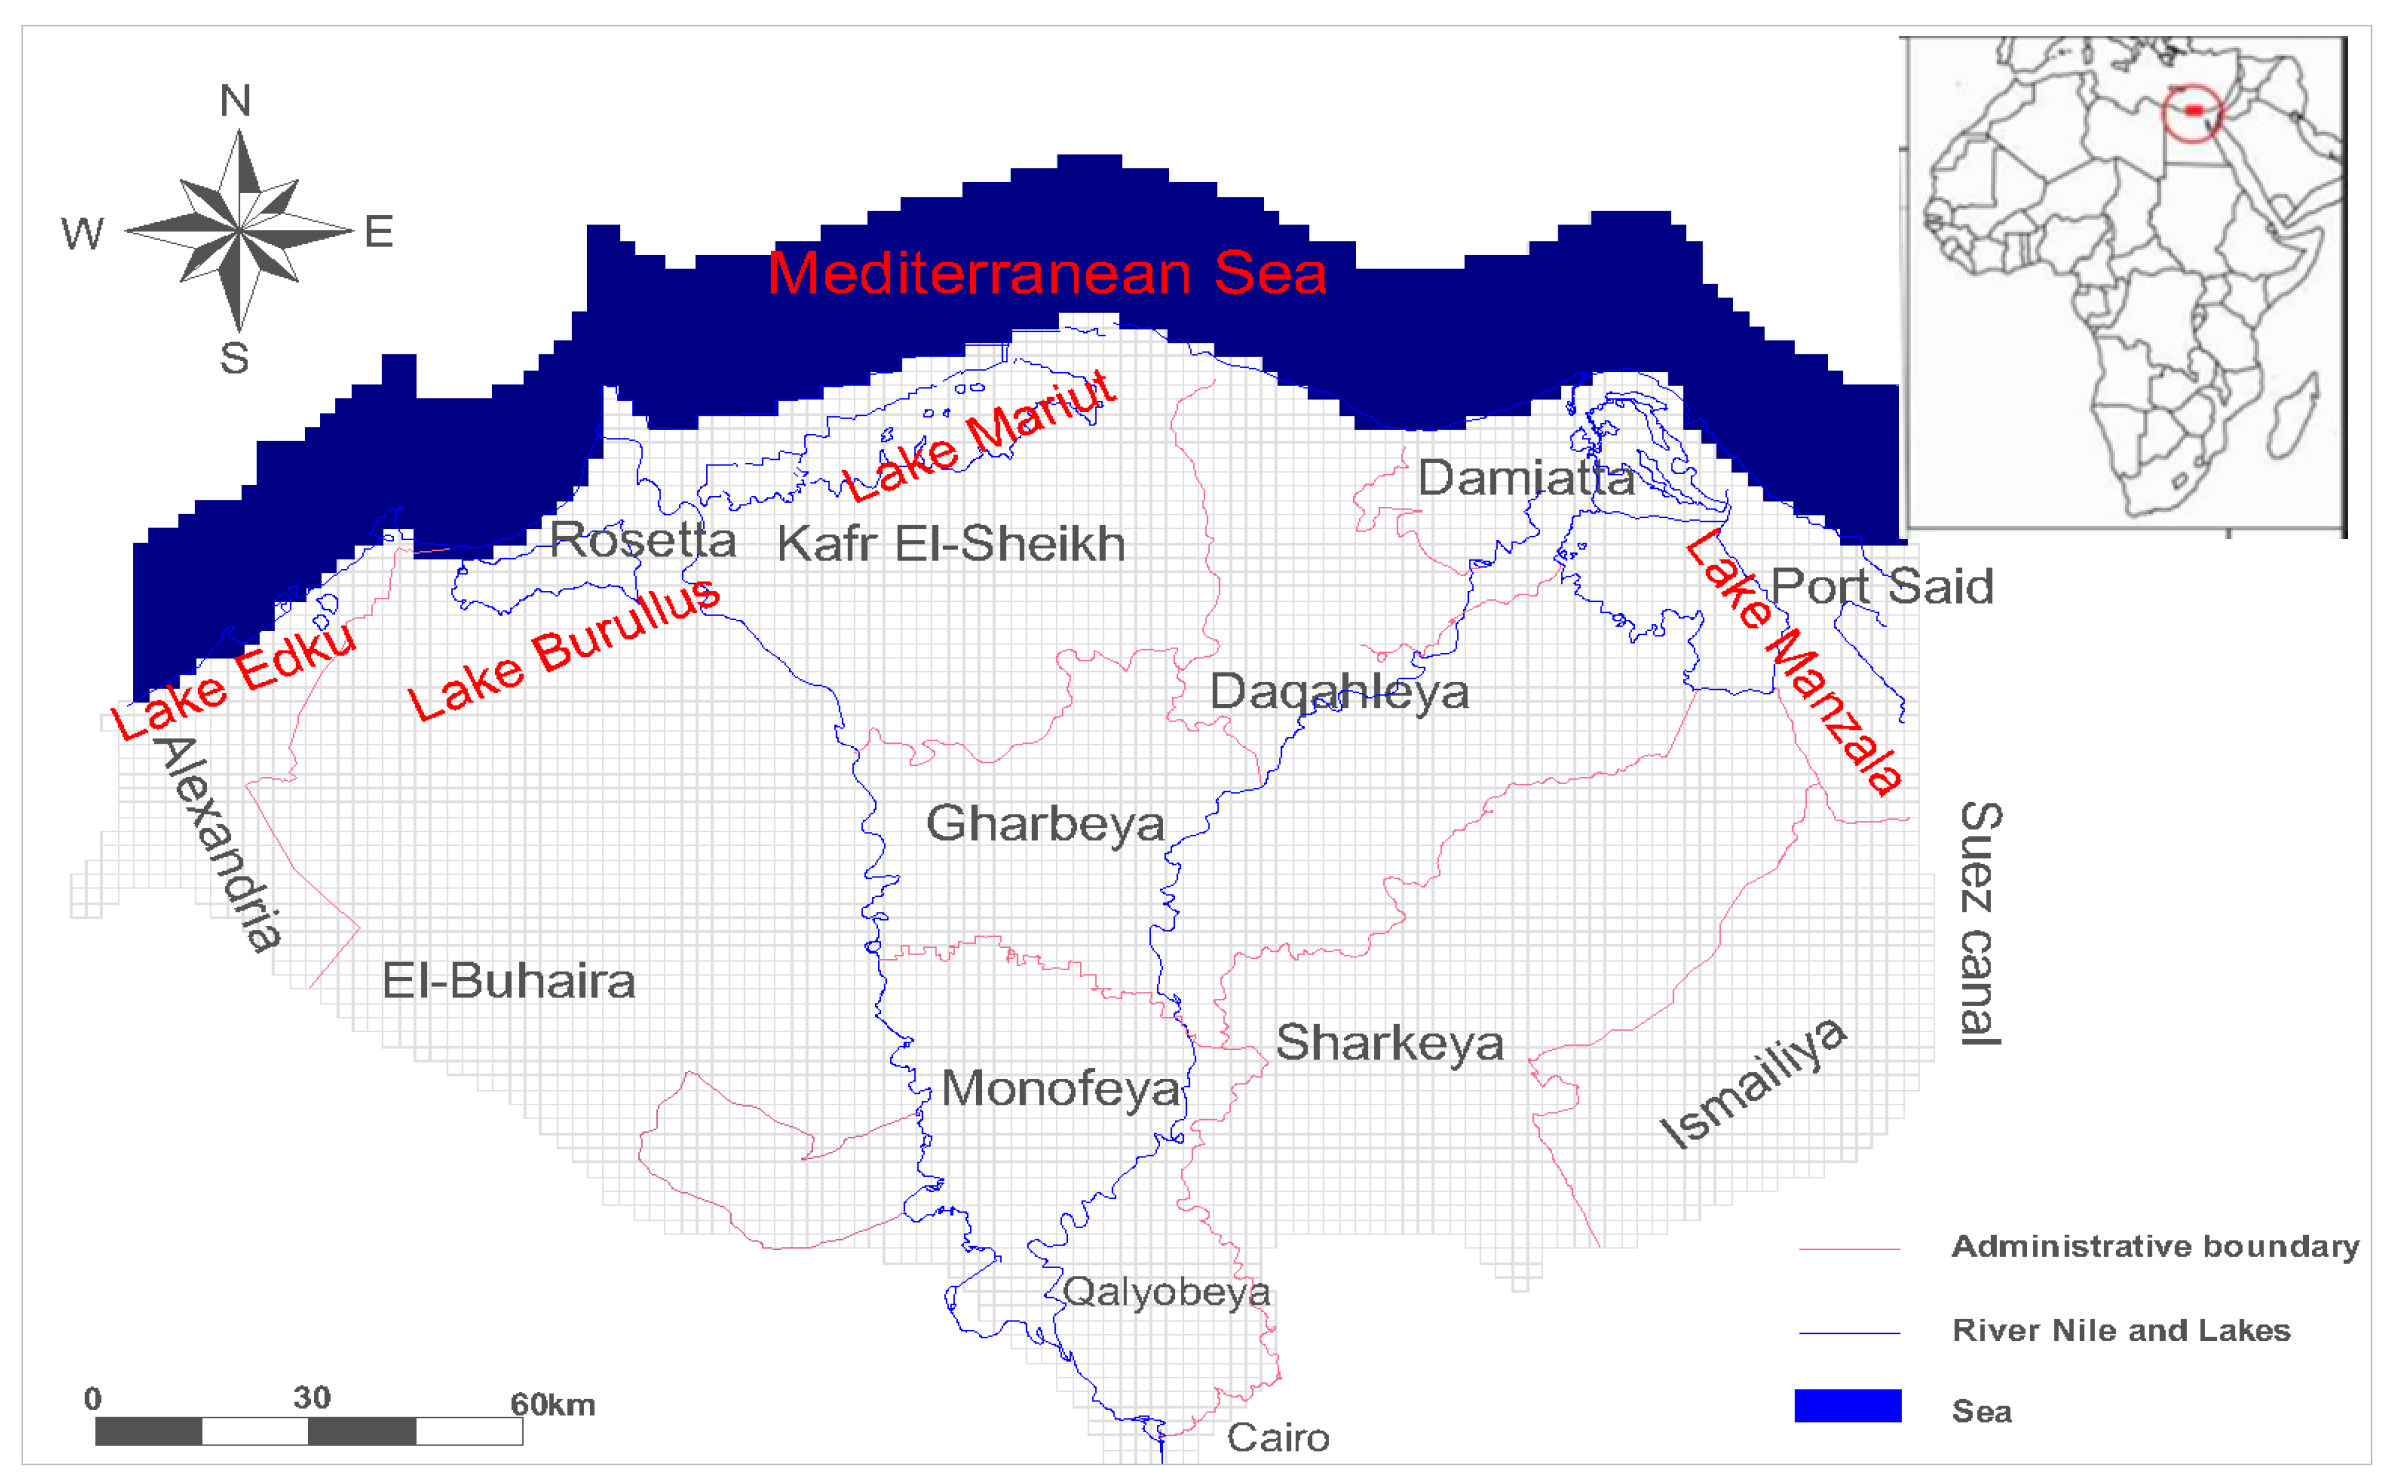
2.1. Study Area

The modeled area shown in Figure 1 covers the Nile Delta, which has a triangular shape with an apex southwards near Cairo and with the Mediterranean Sea at its base. At the apex of the Delta, the Nile divides into two main branches: Damietta and Rosetta. The Suez Canal runs to the east of the Delta, entering Lake Manzala in the northeast of the Delta. Figure 2a shows the different elevations of the study area. The Nile Delta is the most populated region in Egypt, with an average population density of 1724 persons/km2 [30]. It comprises a number of governorates with high economic and agricultural value (Figure 1).

2.2. Geology and Aquifer Characterization

The NDA is a semi-confined groundwater system, containing a huge groundwater reservoir [9]. It comprises Quaternary deposits that are classified in two main layers: The Holocene and the Pleistocene [31]. The Holocene deposit is composed of medium to fine-grained silt, with clay and peat in some regions [32]. It has a thickness of 50 m close to the sea [10] and vanishes towards the delta fringes in the south (Figure 2b). Groundwater exists in this geological layer at shallow depths ranging from 1.0 to 1.5 m below ground surface. The specific yield of the Holocene is very low, with low permeability of the clay and silt formations [31]. It is directly recharged by surface water infiltration from the River Nile, irrigation canals and drains, and also by excess of irrigation water. The lithology and the thickness variations of the Holocene affect the degree of the hydraulic connection between the surface water and groundwater systems.
The Pleistocene is the main aquifer of the entire NDA. It is a highly productive aquifer covering the entire Nile Delta. Its thickness varies from 200 m in the south up to 1000 m in the north (Figure 2c). The Pleistocene is composed of sand and gravel with occasional clay lenses. The sand and gravel are more common in the southern and middle regions of the Nile Delta. The clay lenses are more present in the north. Its underlying Pliocene formations are composed of shallow marine limestone and shale, characterized by low permeability [31].

3. Methodology and Model Setup

3.1. Code Description
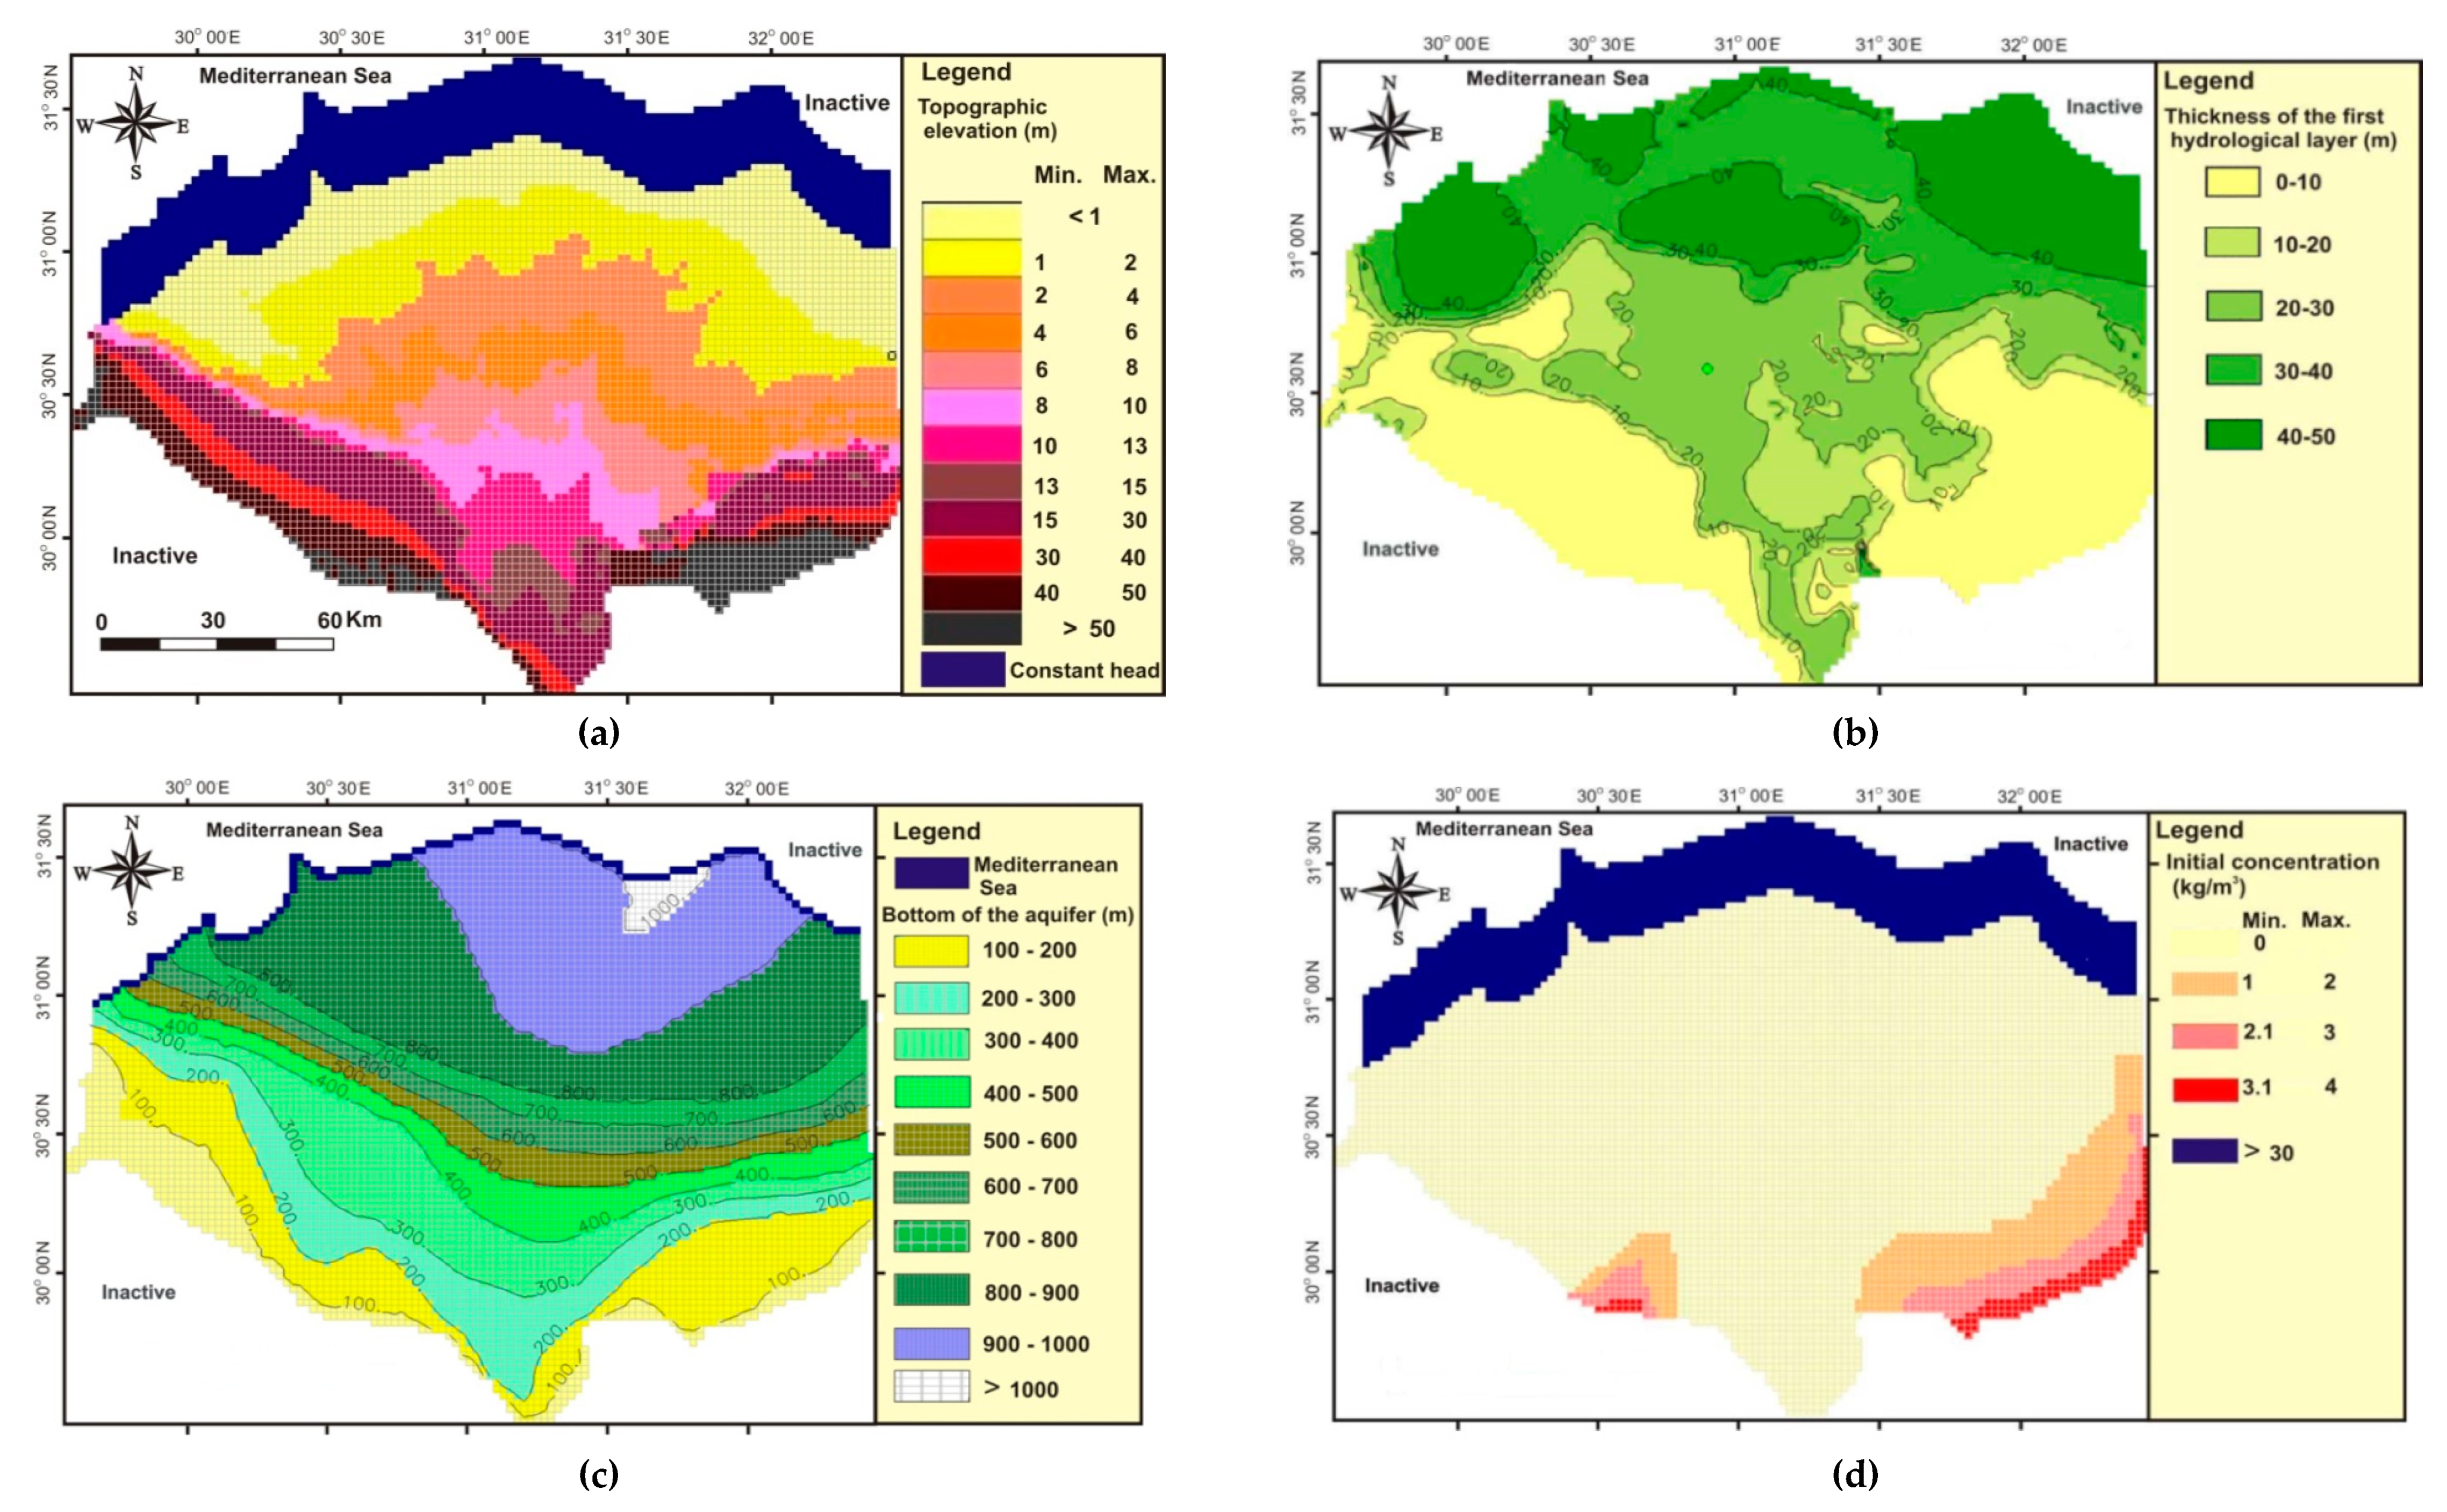
We based the regional numerical model of the Nile Delta on the conceptual groundwater aquifer system, geology, and existing hydrological studies and data (Table 1). SWI is calculated by a variable-density groundwater flow model [29]. We used PMWIN (Processing Modflow for Windows, Simcore Software 2010) for pre- and post-processing. For the governing equations, please consulted the official SEAWAT manual for all relevant information (www.usgs.gov), as well as [29]. We selected SEAWAT as it had successfully been applied before in modeling numerous previous regional SWI studies.
SEAWAT, being based on the widely used MODFLOW and MT3DMS families, is available as a free/open source, has a clear structure, and is supported by pre- and post-processors and additional tools that facilitate the development of models. SEAWAT supports different numerical methods for solving the solute transport equations such as TVD, FD, MOC, HMOC, and MMOC; for more information, see [33]. In this work, the advection term of the advection–dispersion equation was solved using the third-order Total-Variation Diminishing (TVD) method, based on the ULTIMATE algorithm (universal limiter for transient interpolation modeling of the advective transport equations) [33], while the generalized conjugate gradient (GCG) solver was used for the non-advective terms.

3.2. Model Setup

Spatial Discretization

The NDA model contains two main geological layers, the Holocene and the Pleistocene. The thickness of both aquifers is determined based on data collected from 2687 bore logs located in different governorates [34], combined with existing hydrogeological data [35]. The topography of the Nile Delta is quite flat, varying from 0 m mean sea level (MSL) at the sea coast to about 3 m MSL in the middle of the Delta, and rising to elevations of about 40–50 m MSL at the southern fringes (Figure 2a). In the 3D model, the topography of the ground surface is specified using a topographic map of the Nile Delta on a scale of 1:50,000 [36].
On the horizontal plane, the model is discretized using 100 rows and 150 columns, and using model cell sizes of about 2 × 2 km2. The total area of the active model cells covered by the model is about 35,000 km2. Vertically, the model is discretized with 21 model layers to simulate the fresh–brackish–saline groundwater dynamics on a regional scale. The top model layer represents the Holocene, followed by 19 model layers with equal thickness representing the Pleistocene. The last model layer represents the thin layer of the Pliocene formation that underlies the Pleistocene. This last model layer is introduced to make it possible to represent the dissolution of some salts and minerals from the underlying Pliocene formation (as will be further elaborated in the next section), see Figure 2d.

3.3. Boundary Conditions

In the northern part of the model area, the Mediterranean Sea is represented as a constant head and constant salinity concentration boundary. The Mediterranean Sea is represented by 10 constant head and salinity concentration model cells (over a distance of 20 km) north from the present coastline (Figure 2a). We intentionally insert a significant portion offshore of the Mediterranean Sea into the model to have better representation of the boundary condition, as we assume the boundary condition affects the onshore groundwater system, especially when SLR is considered [37]. The decision to shift the constant head boundary condition 20 km offshore was determined by a rule of thumb: For a semi-confined aquifer, the influence of a fixed boundary could be considered negligible at a distance of three times the leakage factor λ, being:
λ = D 1 K h D 2 K v
where D1 is the thickness of the Pleistocene [L], Kh is the horizontal hydraulic conductivity of the same coastal aquifer [LT−1], D2 is the thickness of the Holocene [L], and Kv is the vertical hydraulic conductivity of Holocene [LT−1] [38]. Assuming average values of D1 = 1000 m, D2 = 25 m, and Kv = 0.025 m/day, Kh = 0.25 m/day, λ = 7071 m. Proper boundary conditions are set when influences from that boundary do not propagate more than 5% into the semi-confined aquifer that is modeled. From the groundwater flow equation for semi-confined aquifer, which has an exponential form and includes the leakage factor λ, this condition is met when the distance between the boundary condition and the area of interest is set to 3 lambda (3λ), which is about 21 km (around 10 model cells) [38].
A constant salinity concentration boundary is also assigned at all model cells representing the Mediterranean Sea (35 kg/m3). The eastern boundary of the model corresponds to the Suez Canal and is considered a no-flow boundary. A no-flow boundary is also specified at the bottom of the Pliocene, which is the last model layer in vertical direction from ground surface. This model layer is introduced to represent the salinity concentration arising from the dissolution of marine deposits that underlie the Pleistocene aquifer (Figure 2d). The locations and actual concentration values representing these processes are determined based upon a number of isotope studies. These studies have consistently agreed that the water type in the assigned locations is paleo-groundwater from ancient times [39,40,41,42,43,44,45]. Using radioactive 14C isotope, [46] proved the existence of paleo-groundwater in the south eastern region around the Ismailia canal, and attributed the salinity concentration of the groundwater to the dissolution of Pliocene minerals. Furthermore, [39,40] proved, using tritium (3H), that the southwest region salinity concentration can be attributed to the terrestrial salts up-coning from the Pliocene formation. To take this phenomenon into account in the model, we assigned to the bottom model layer in the southwest and southeast (locations detected in the isotopes studies) a constant concentration ranging between 1–4 kg/m3 (Figure 2d).

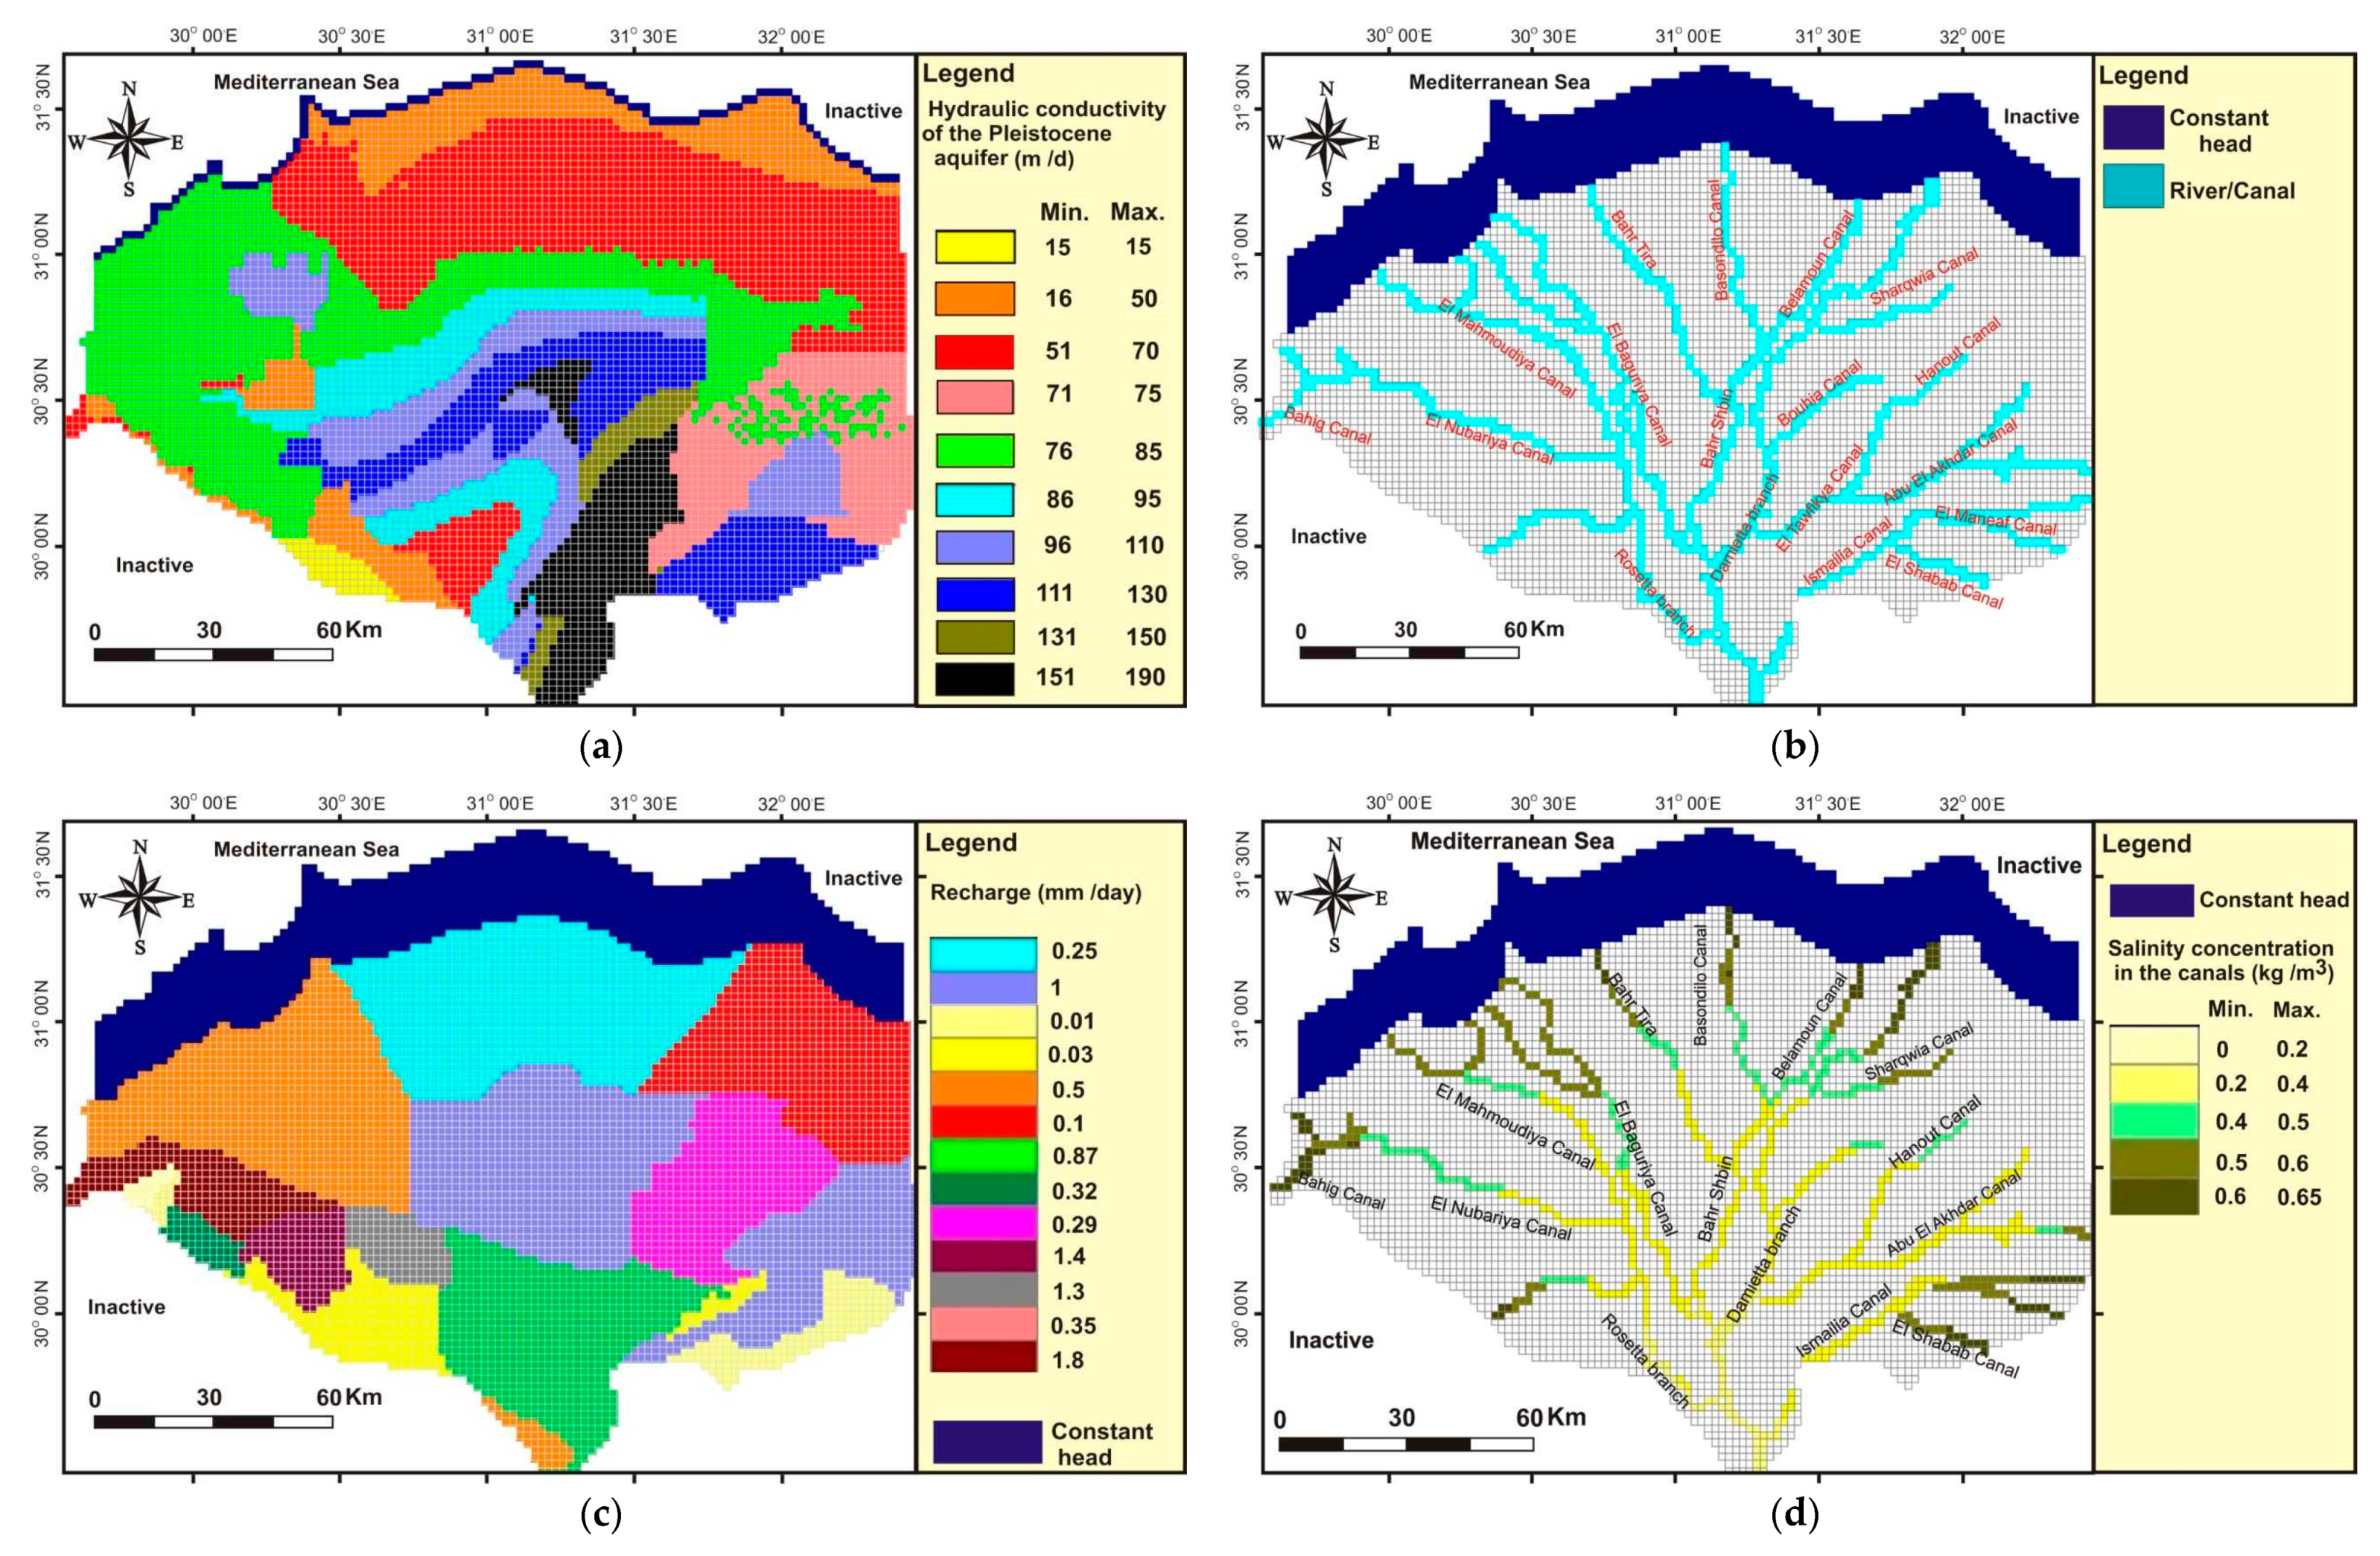
3.4. Hydrogeological Parameters

Reports from a number of hydrogeological studies carried out in the Nile Delta were used to determine the hydrogeological parameters [8,9]. The information required to identify and characterize the groundwater system was collected from the Research Institute of Groundwater (RIGW), the General Authority for Educational Buildings [34], and the Coca Cola Company (Table 1). The primary source for the geological parameters and the lithological units of the NDA is a geotechnical database containing the results of a number of pumping tests carried out at different wells allocated throughout the Nile Delta governorates [34]. GAEB used the GWW (Ground Water for Windows) modeling tool to determine the parameters: Hydraulic conductivity, safe yield, and efficiency. All available data were collected and digitized, interpolated, and converted into formats required by the model. The pumping test data were used as a primary source for specifying the values of horizontal hydraulic conductivity.
The first model layer (representing the Holocene) is specified to have a constant horizontal hydraulic conductivity of 0.25 m/day [5]. This layer consists predominantly of silt, mixed with some clay and sand lenses, but due to lack of data about spatially varying hydraulic conductivity, we used spatially uniform value. For all the following nineteen model layers, representing the Pleistocene, horizontal hydraulic conductivity values vary from a minimum of about 15 m/day in the southwest, through a gradual increase from 50 m/day near the Mediterranean Sea to 130 m/day [34] in the middle of the Delta (Figure 3a). At some locations in the middle of the delta and in the southeast, horizontal hydraulic conductivity even reaches 150 m/day [8]. In the last model layer, representing the Pliocene, a horizontal hydraulic conductivity of 0.03 m/day [47] and 12.7 m/day [48] were assigned at their pre-determined locations in the southeast and southwest (shale and fractured marine limestone), respectively. The vertical hydraulic conductivity is assigned as 10% of the horizontal hydraulic conductivity [49]. Spatially varying effective porosity for the Pleistocene is specified in the range of 12% near the Mediterranean Sea up to 28% in the south [34], with an average porosity value of 24% [8]. In the Holocene, the porosity is specified with a constant value of 40%. The porosity values were measured in the Faculty of Engineering labs, Cairo University, using bulk volume measurements, under the GAEB Project.

3.5. Hydrological Stresses

Data on hydrological stresses on the NDA were collected from The Ministry of Water Resources in Egypt and the national plan of groundwater of each governorate. In this subsection, a summary is given.

3.5.1. Irrigation Canals and Drains

The irrigation and drainage networks in Egypt are extensive. We included the main canals and the second degree branch canals, such as El-Nubariya, Bustan, Ismaillia, El-Baguriya, and El-Mahmudiya, using the river package of MODFLOW/SEAWAT (Figure 3b). The water levels and different cross sections of the canals for the year 2010 were taken from the Canal Distribution Sector, Ministry of Water Resources and Irrigation in Egypt [50]. All main and branch canals were divided into four or five segments, according to the measurement points available along the canal, for more accurate simulation (Figure 3b). Moreover, different water levels were also specified before and after weirs location along the canals. The average water level, bottom level, and conductance were assigned for each segment [50]. To represent the small branch drains, a mesh representation of drains was specified using the drainage package, and was incorporated into the model (except for desert areas) in the first model layer, using a drain conductance of 2000 m2/day.

3.5.2. Recharge

The main source of recharge in the NDA is infiltration from irrigation canals and excess agricultural irrigation water. Recharge from actual rainfall is very small, as precipitation varies from 200 mm/year along the Mediterranean Sea to 25 mm/year near Cairo [51]. In addition, with the high evaporation rate, the precipitation is negligible.
A land use map shows the Nile Delta to be covered principally by old traditionally cultivated land that is very fertile. Rice is the dominant crop in the coastal area. At the eastern and western fringes of the Nile Delta, new land with active reclamation projects is planned. The recharge values used in the model are based on data of [52], updated by [5]. They were obtained using hydrological budget calculations of the groundwater system and in situ measurements using infiltrometer rings in various Delta governorates. The Nile Delta recharge rate was classified according to the irrigation type (basin, sprinkler, central pivot, and drip irrigation), crop type (vegetables, barley, alfalfa, maize, and fruits), soil type and structure, availability of artificial drainage, and source of irrigation. Later, [5] used multi temporal Landsat imagery from 1992 Thematic Mapper (TM), 2005 TM and Google Earth Landsat 2008 of the Nile Region. She linked the image data with field studies, reports, and topographic maps and determined the recharge rate for each governorate. Figure 3c shows the average recharge rates that are used in the model in different sectors of the Nile Delta. It shows that the value of the recharge rate varies from 0.01 mm/day in the desert to 1.1 mm/day in the south, and even 1.9 mm/day in some western areas. Relatively high recharge rates are measured when irrigation is used in sandy soils: Between 1.0 and 2.5 mm/day. In the northern part of the delta, the recharge rate is about 0.25 mm/day, increasing in the middle of the delta to 1 mm/day. Where drip irrigation is used, the recharge rates are much lower, ranging from 0.1–0.5 mm/day [5].

3.5.3. Salinity Concentrations Canals and Recharge

Canal water in the Nile Delta is not completely fresh. Dissolved salts are introduced because of soil salinity and inefficient irrigation methods. The salinity concentration is incorporated into the model through the sink/source package. The salinity concentration data for the canals are obtained from a number of studies dealing with surface water quality: [53,54,55]. Spatially varying salinity of rivers/canals and recharge was specified to the model to ensure that the groundwater entering the domain of the model has a proper salinity concentration. This approach has not been used in models developed in previous studies of the NDA.
Most canal water shows salinity concentrations of up to 0.3 kg/m3. The salinity concentration of the main river branches, Rosetta and Damietta, start near Cairo with a value of 0.04 kg/m3. Towards the north, canal water becomes more saline, especially near the Mediterranean, reaching up to 0.65 kg/m3 where the soil salinity is very high (Figure 3d). Some regions show increased salinity due to irrigation methods, e.g., flood irrigation for rice fields [5]. The salinity concentration in infiltration recharge ranges from 0.1 to 0.7 kg/m3 [54].

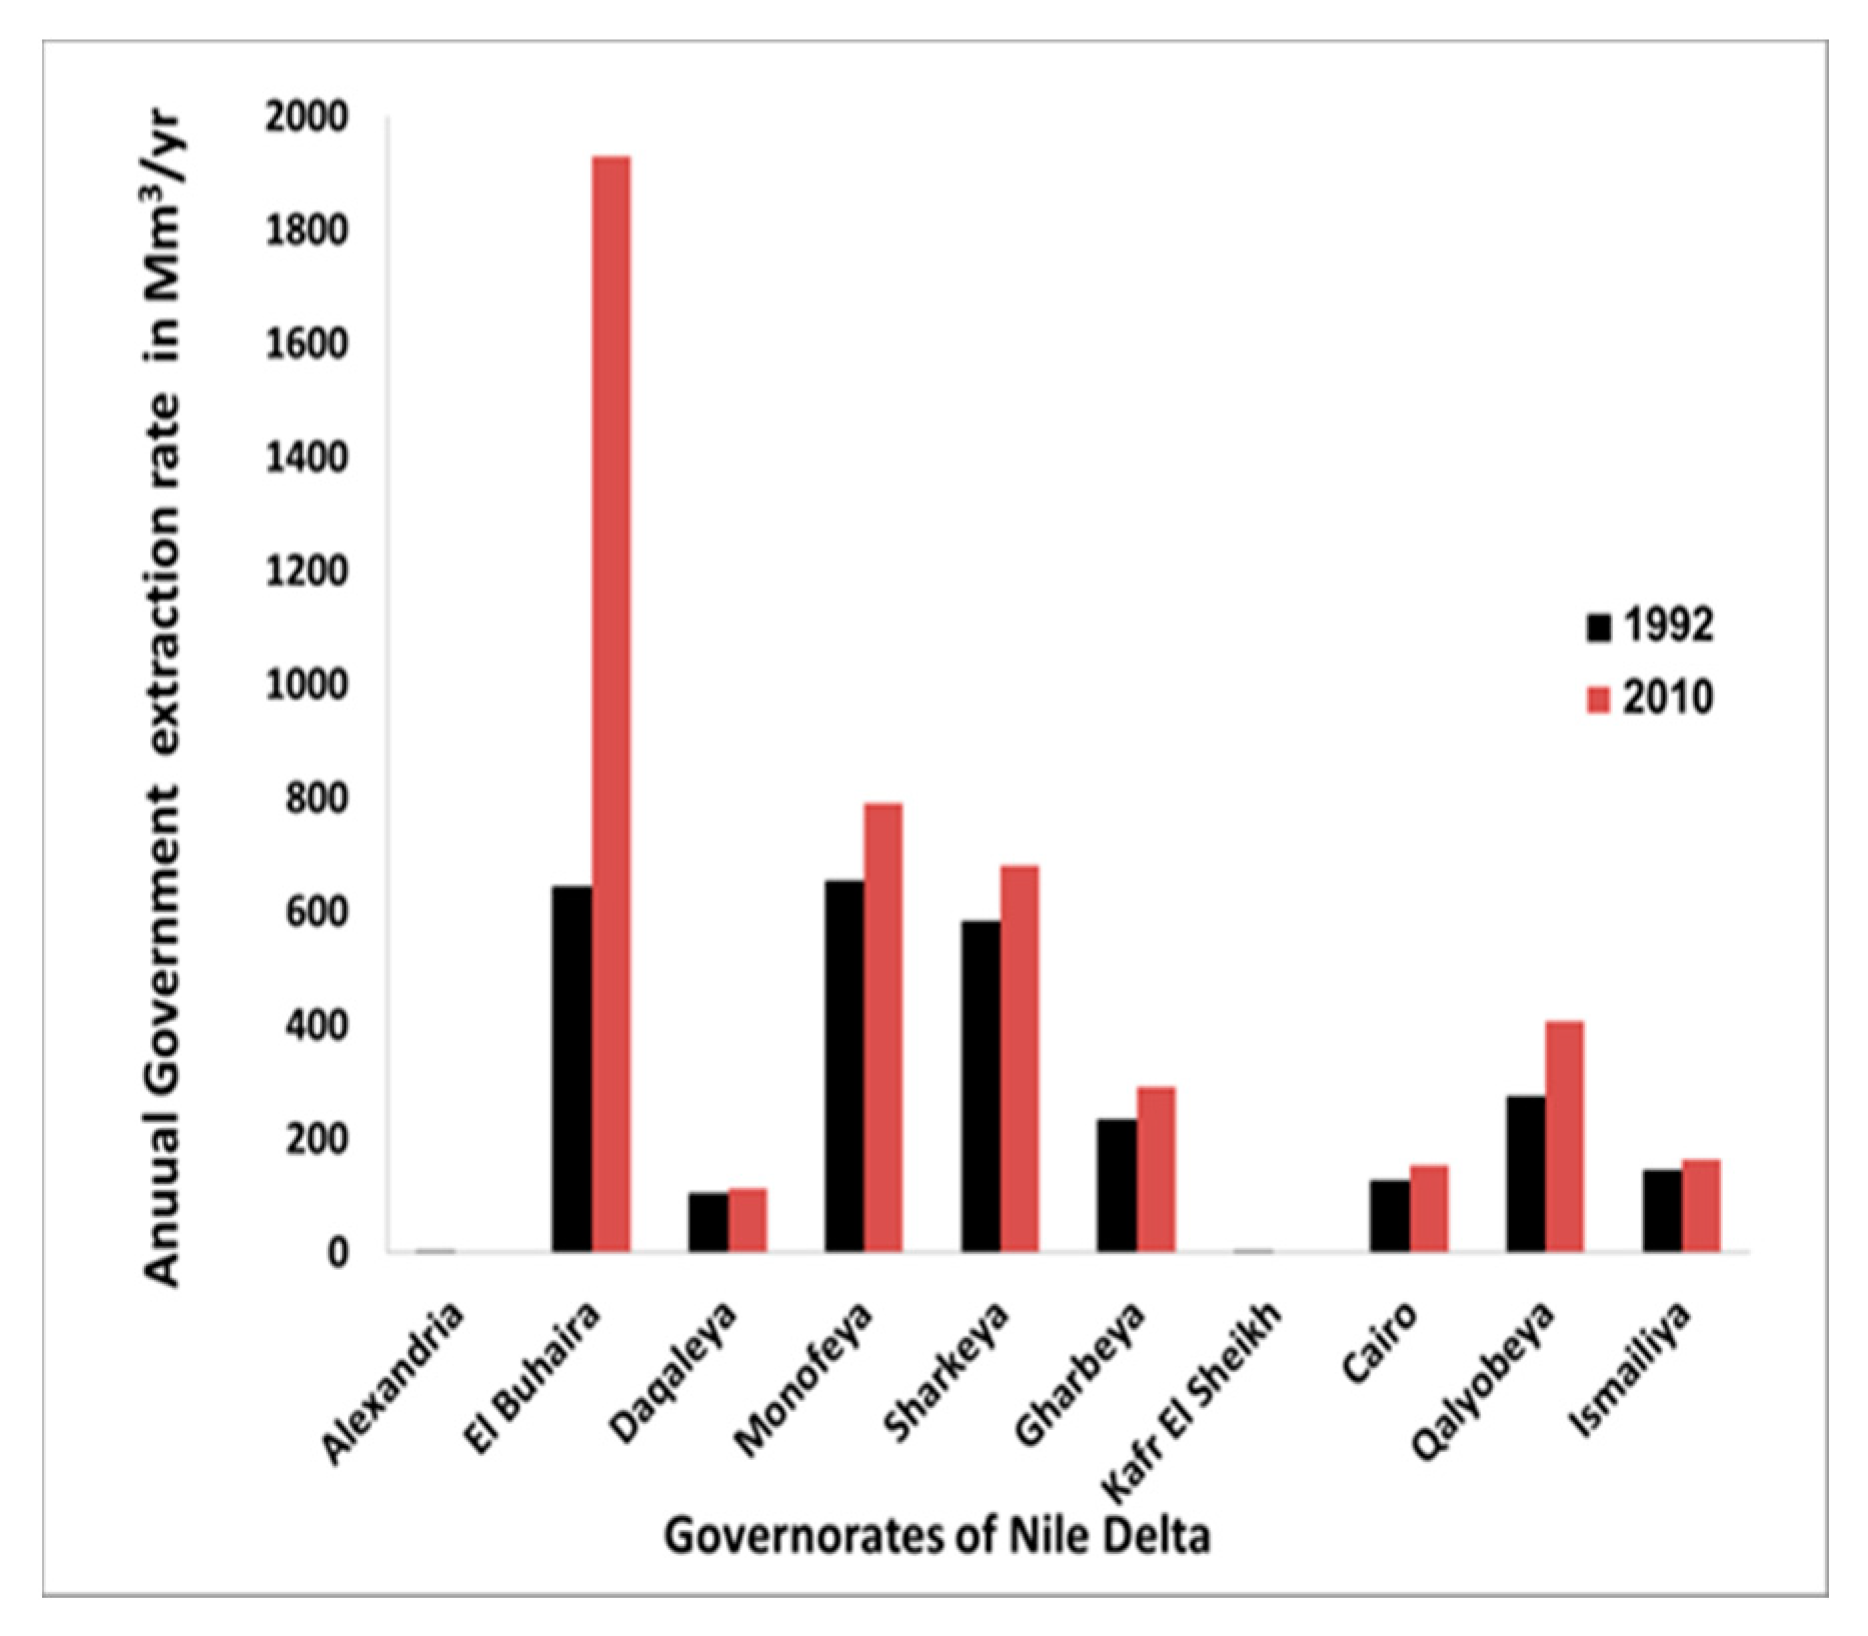
3.5.4. Extraction Wells

Groundwater extraction from wells is a critical activity in the Nile Delta. However, estimating the extraction amount is difficult. For instance, severe unauthorized extraction activities took place in the period from 1992–2008 [5]. In fact, overall groundwater extraction from the entire NDA in the year 2010 is estimated to have been at about 4.9 × 10⁹ m3/year compared to 3 × 10⁹ m3/year in 1992 [5]. The extraction wells used in the model represent both drinking water supply and irrigation wells. Due to the relatively coarse grid of this model, each model cell may represent the sum of a number of clustered wells in that model cell. The wells were distributed in different model layers according to their depth, which varied from between 45 m and 180 m below ground surface, meaning that most wells were placed in model layers six to fourteen. We collected extraction wells data from RIGW, the national plan for the year 2010 for each governorate [34], and the Coca Cola Company (Technical sheets and field reports 2011).
El Buhaira and Monofeya governorates in the western part of the delta have the maximum extraction rates, due to the uncontrolled increase in reclamation projects (Figure 4). The western region of the delta is characterized by rapid development in agriculture using groundwater. These extensive extraction rates are causing severe lowering of the water table and increased salinity concentration of the extracted groundwater. In addition, most of the wells north of the delta in Kafr El-Sheikh (30 wells) and Alexandria governorates have already been closed due to high salinity concentrations [5].

3.5.5. Solute Transport Characteristics

Advection and hydrodynamic dispersion processes for conservative salt transport were considered in the modeling. The longitudinal dispersivity is 1.0 m; the transversal horizontal dispersivity is 0.1 m and the transversal vertical dispersivity is 0.01 m. These relatively low values were assigned as acceptable estimates for the longitudinal dispersivities in the study of [21], as well as previously modeled cases of regional coastal aquifer systems, e.g., [23].

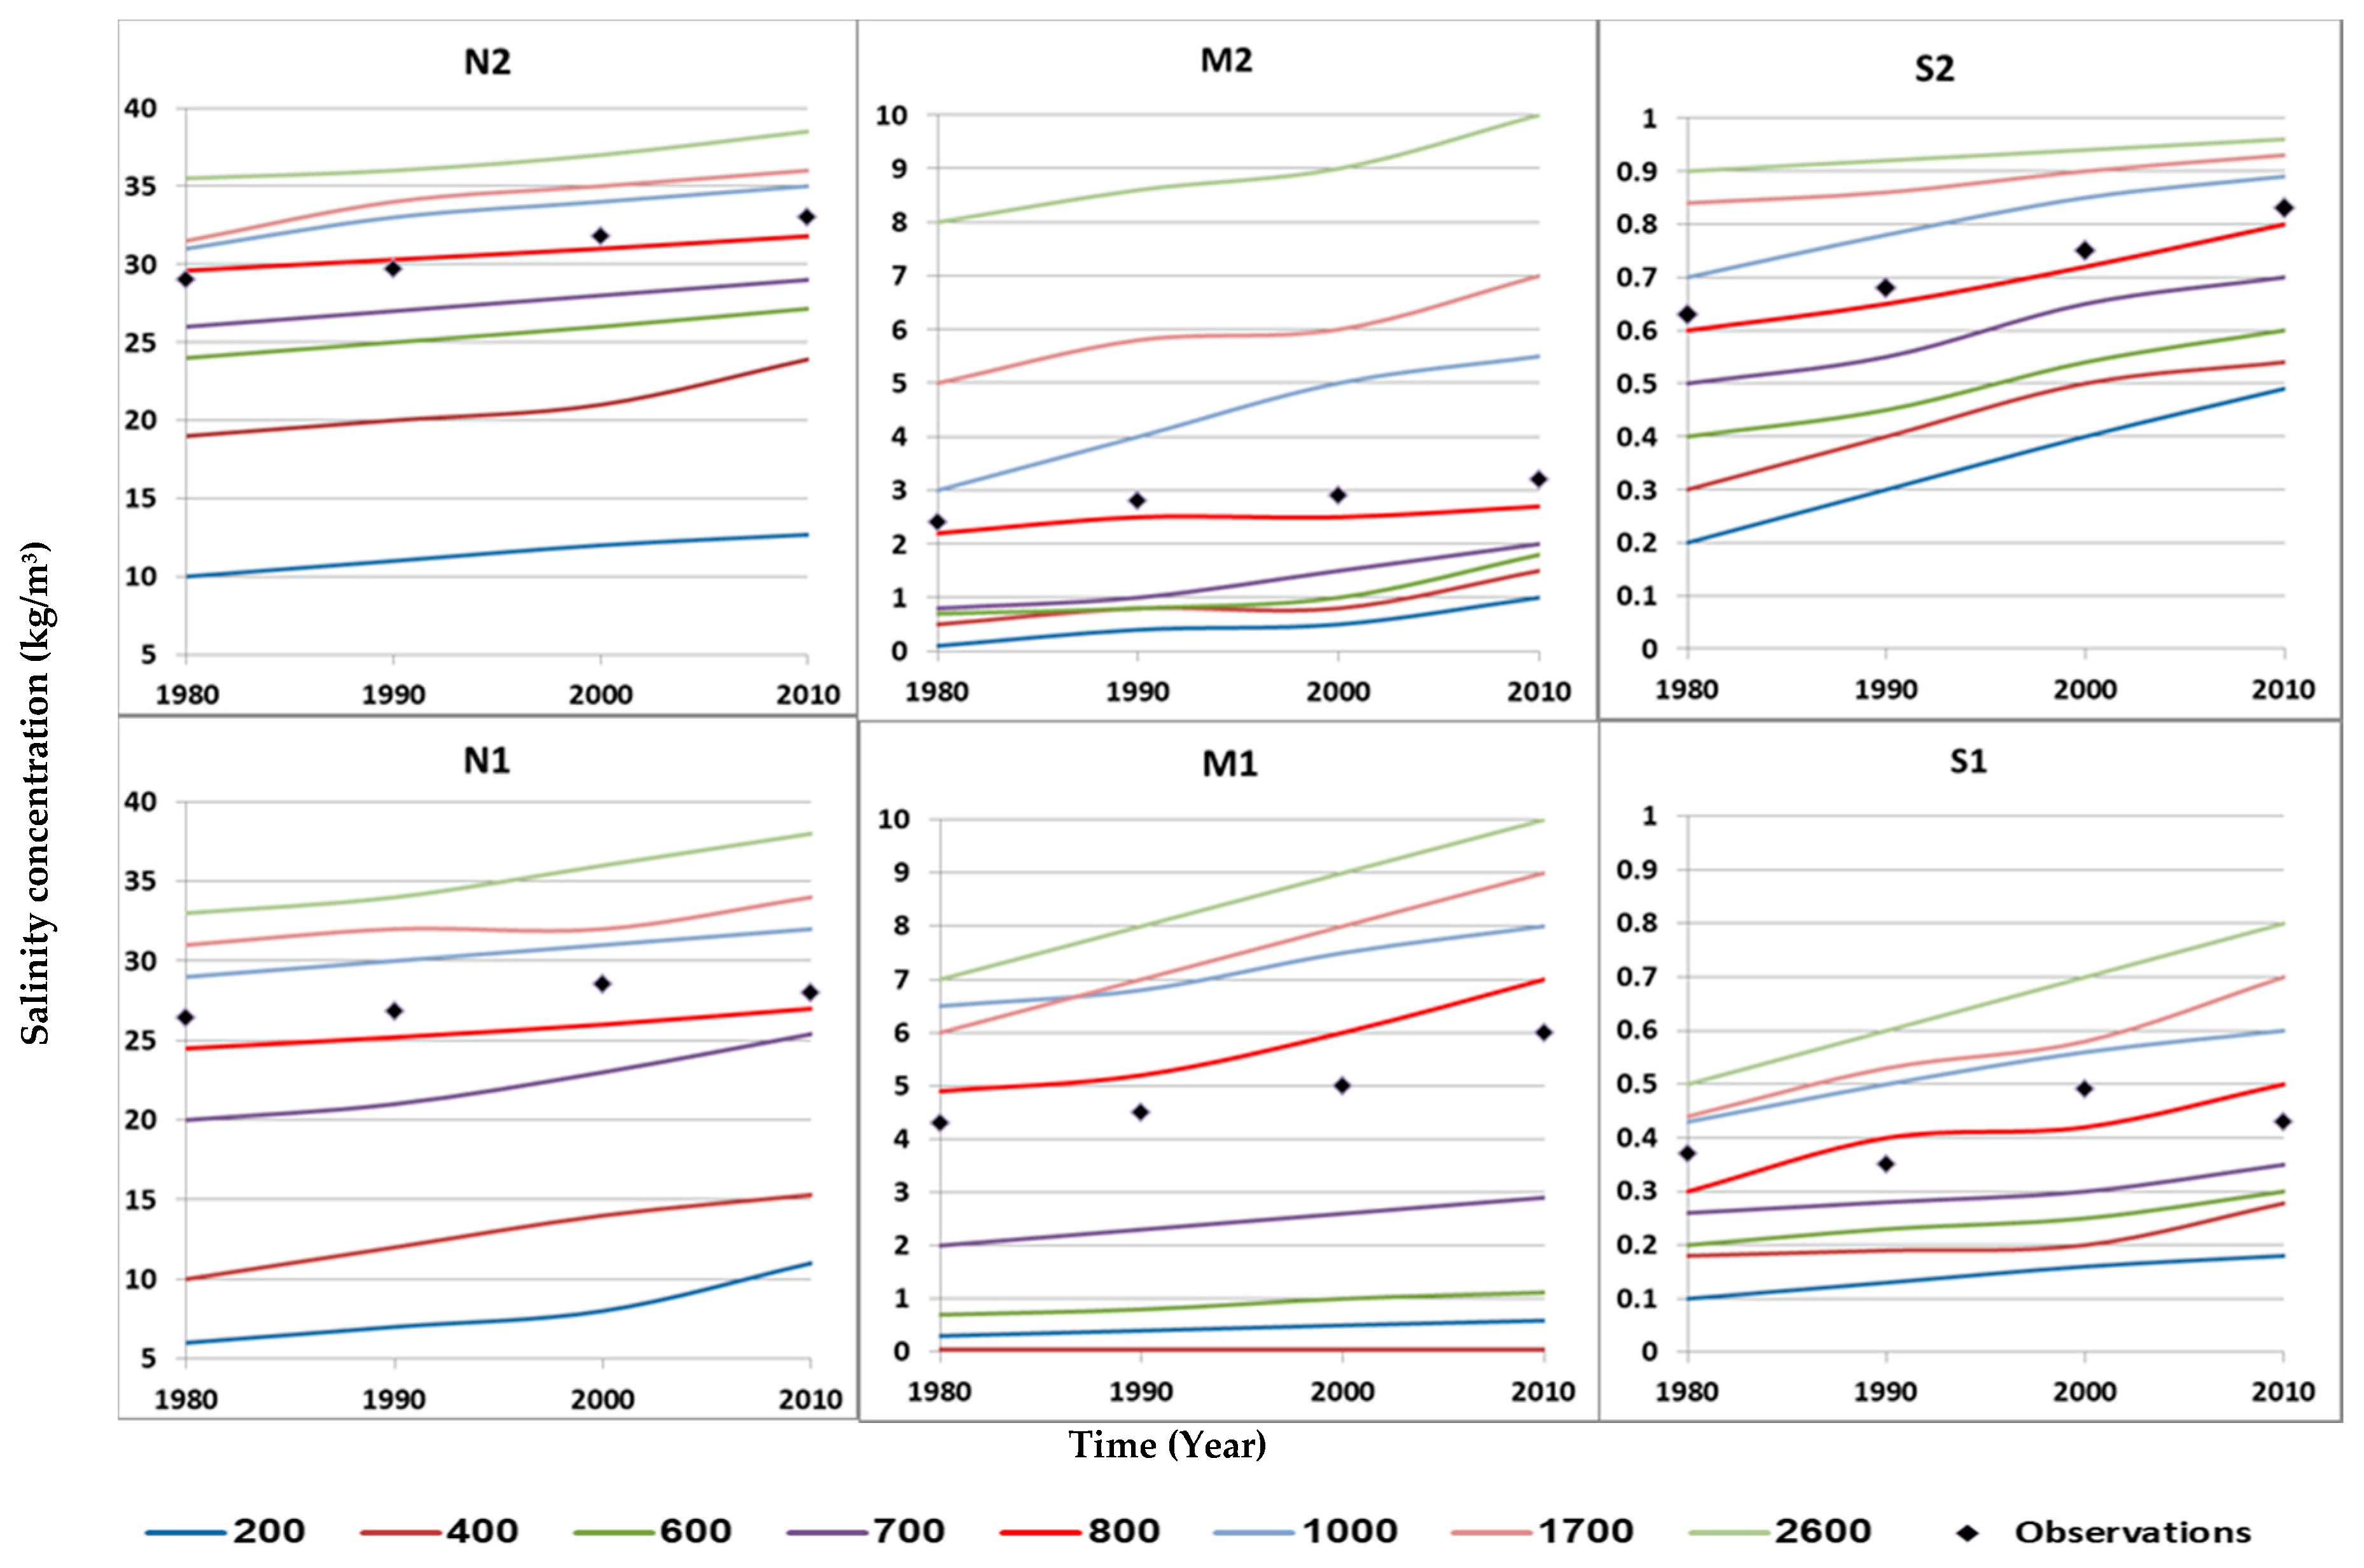
3.6. Determining Salinity Concentration Distribution of the Year 2010

The constructed 3D model was used to get a salinity concentration distribution that best fits the observed salinity concentration data. We designated the year 2010 as the reference year, as the most data are available for this year. Normally, two approaches are customarily used to determine the salinity concentration distribution: (1) Using all existing observation wells for salinity concentration, and inter- and extrapolating geo-statistically the salinity values into a 3D salinity concentration distribution, or (2) starting with a completely saline or fresh distribution and then simulating salt transport for a very long time until the groundwater system reaches dynamic equilibrium. The first approach can only be considered when enough data are available, which is seldom the case. With the second approach, there is more evidence now that especially huge groundwater systems like the NDA are not in a state of dynamic equilibrium, considering Palaeo-reconstructions and offshore fresh-to-brackish groundwater [56,57,58,59,60]. In our research, we introduced an approach that combines both options. The initial salinity concentration distribution of the model of the NDA is completely fresh with only saline concentration (35 kg/m3) boundaries at the Mediterranean seaside. These boundary conditions might not always be feasible in other deltaic areas around the world. Our target was solely to determine the appropriate simulation period which provides the best match between the modeled and observed salinity concentration data.
In this approach, all simulations initially started without groundwater extraction. However, as groundwater extractions during the last 50 years have increased spectacularly, we took them into account assuming linear increase over this period. Thus, each simulation started without groundwater extractions, but the last 50 years (assuming to represent 2060–2010) include linearly increasing groundwater extraction, from 0 to the value of 4.9 × 10⁹ m3/year. All other hydrogeological stresses were kept constant in the model simulations. We carried out model simulations for nine simulation periods, varying from 200 to 2600 years, in order to determine the best match of the salinity distribution compared to the year 2010. This approach also allowed checking whether the NDA reached the state of dynamic equilibrium.

4. Results and Discussion

All nine simulation periods show, as expected, that the salinity front from the sea is rapidly progressing towards the southern NDA. Starting from an initial fresh groundwater distribution, the volume of saline groundwater increased with time in all simulated models. The larger the length of the simulation period, the longer the model is simulating SWI from the Mediterranean Sea, the more groundwater becomes salinized.

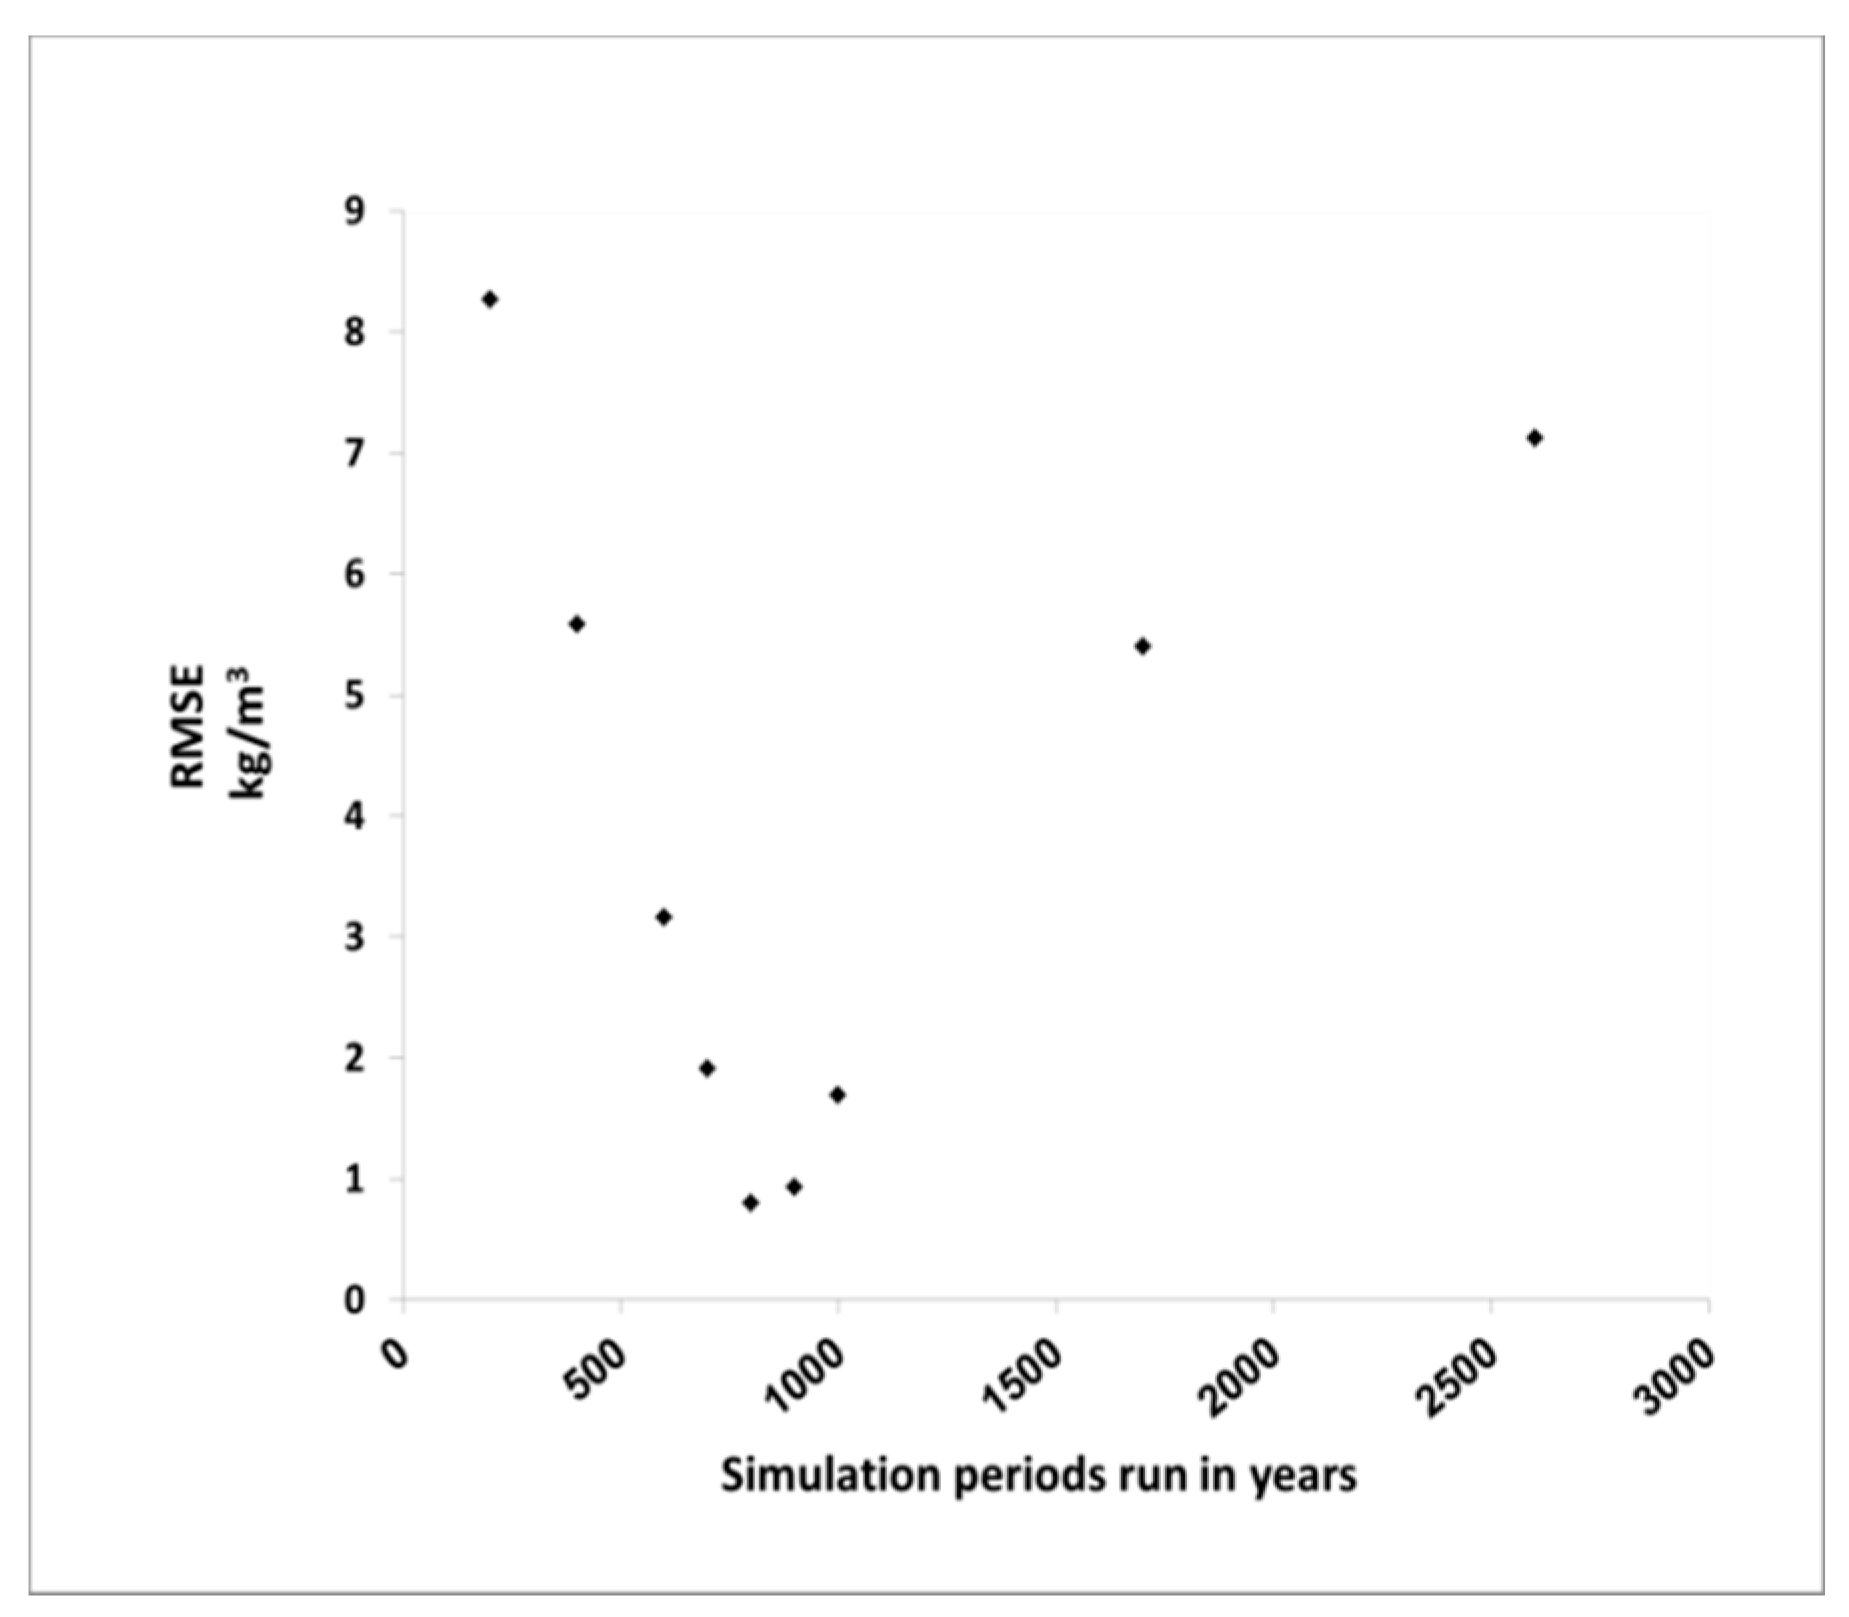
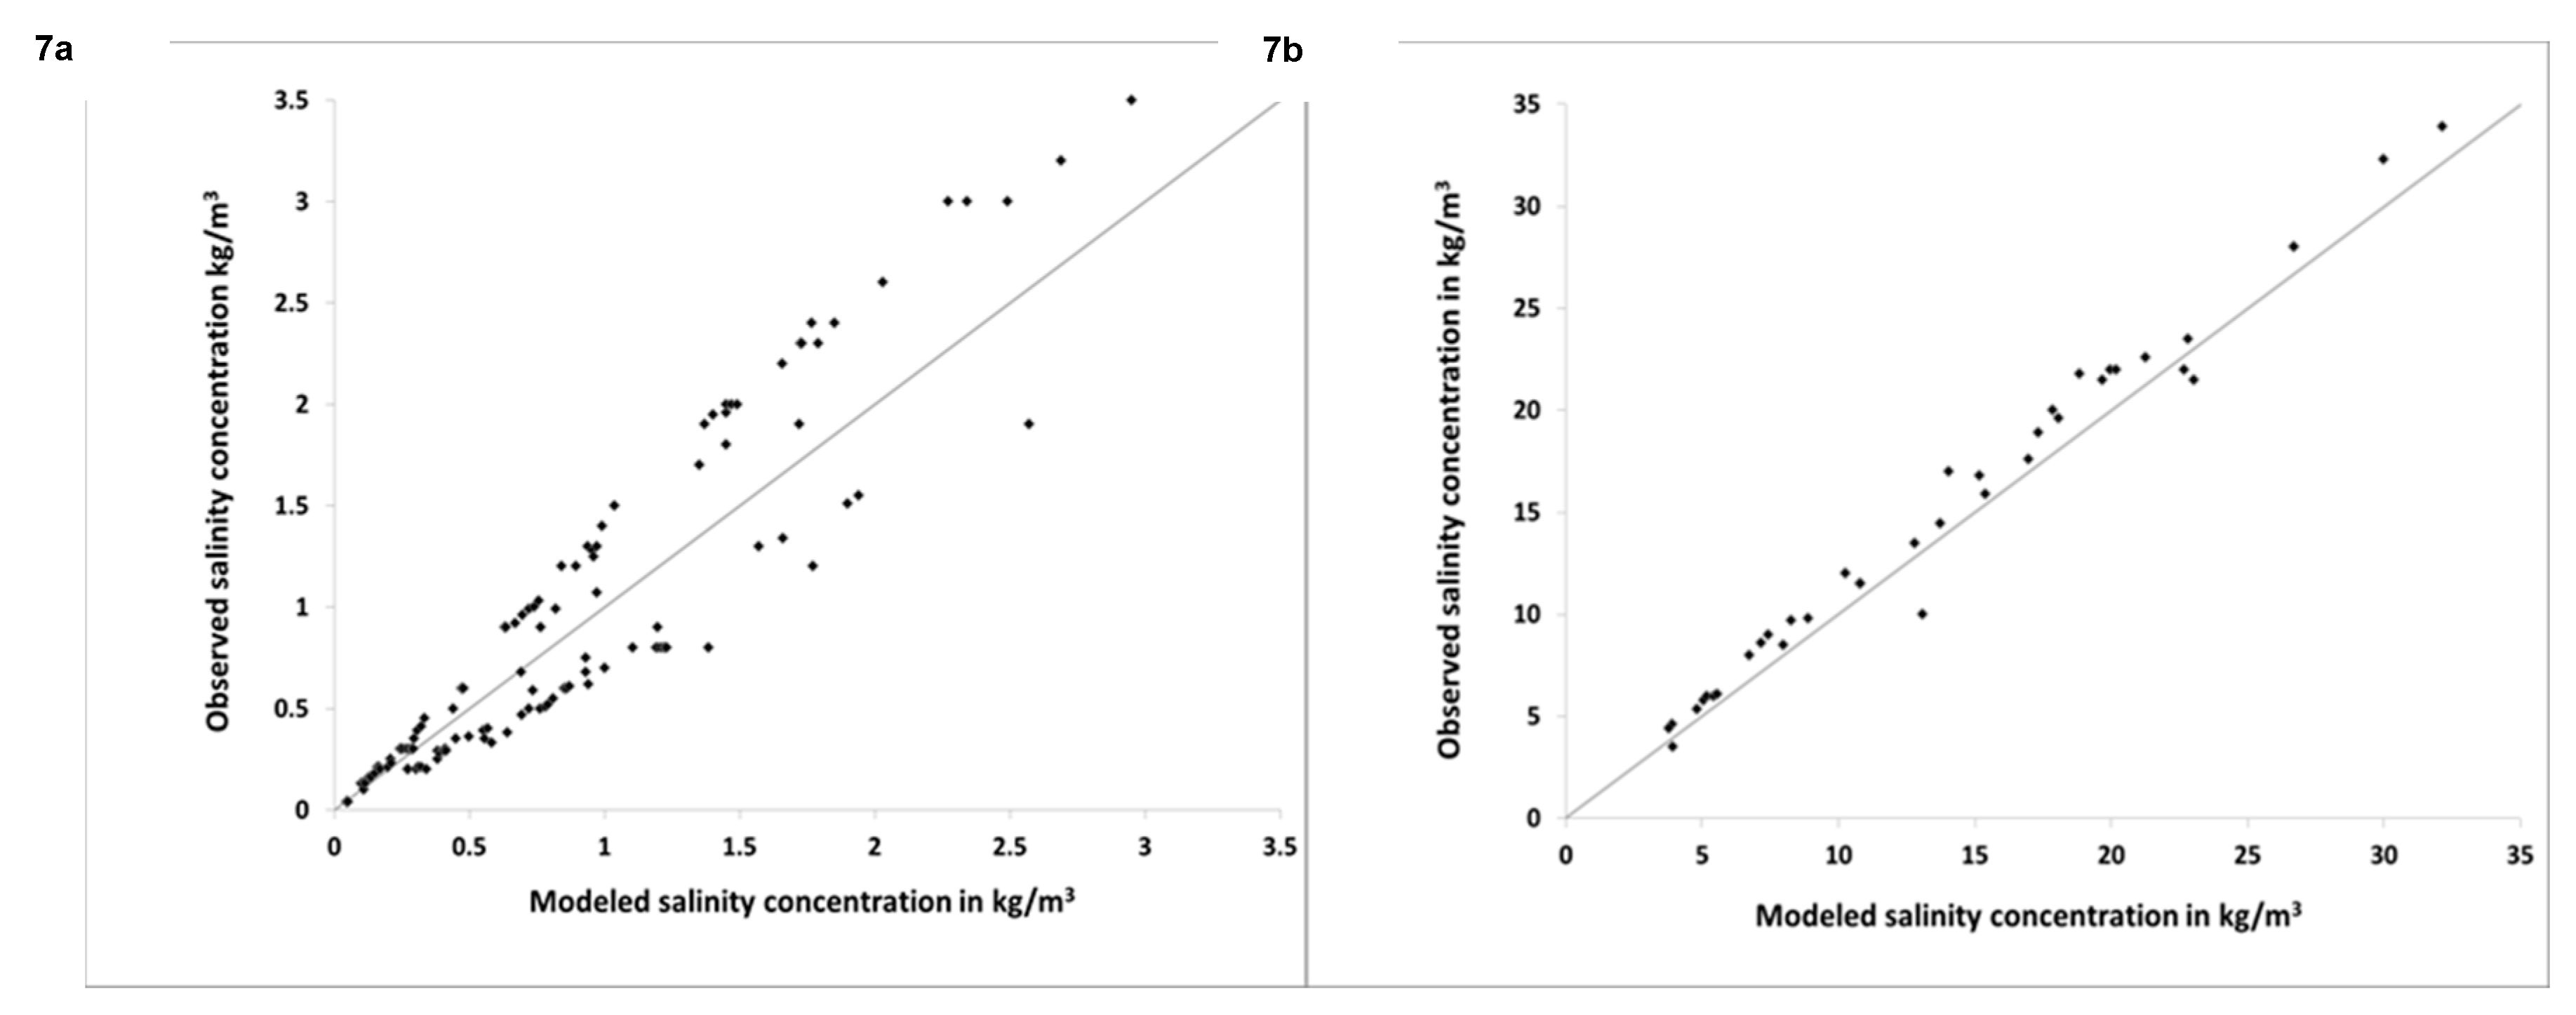
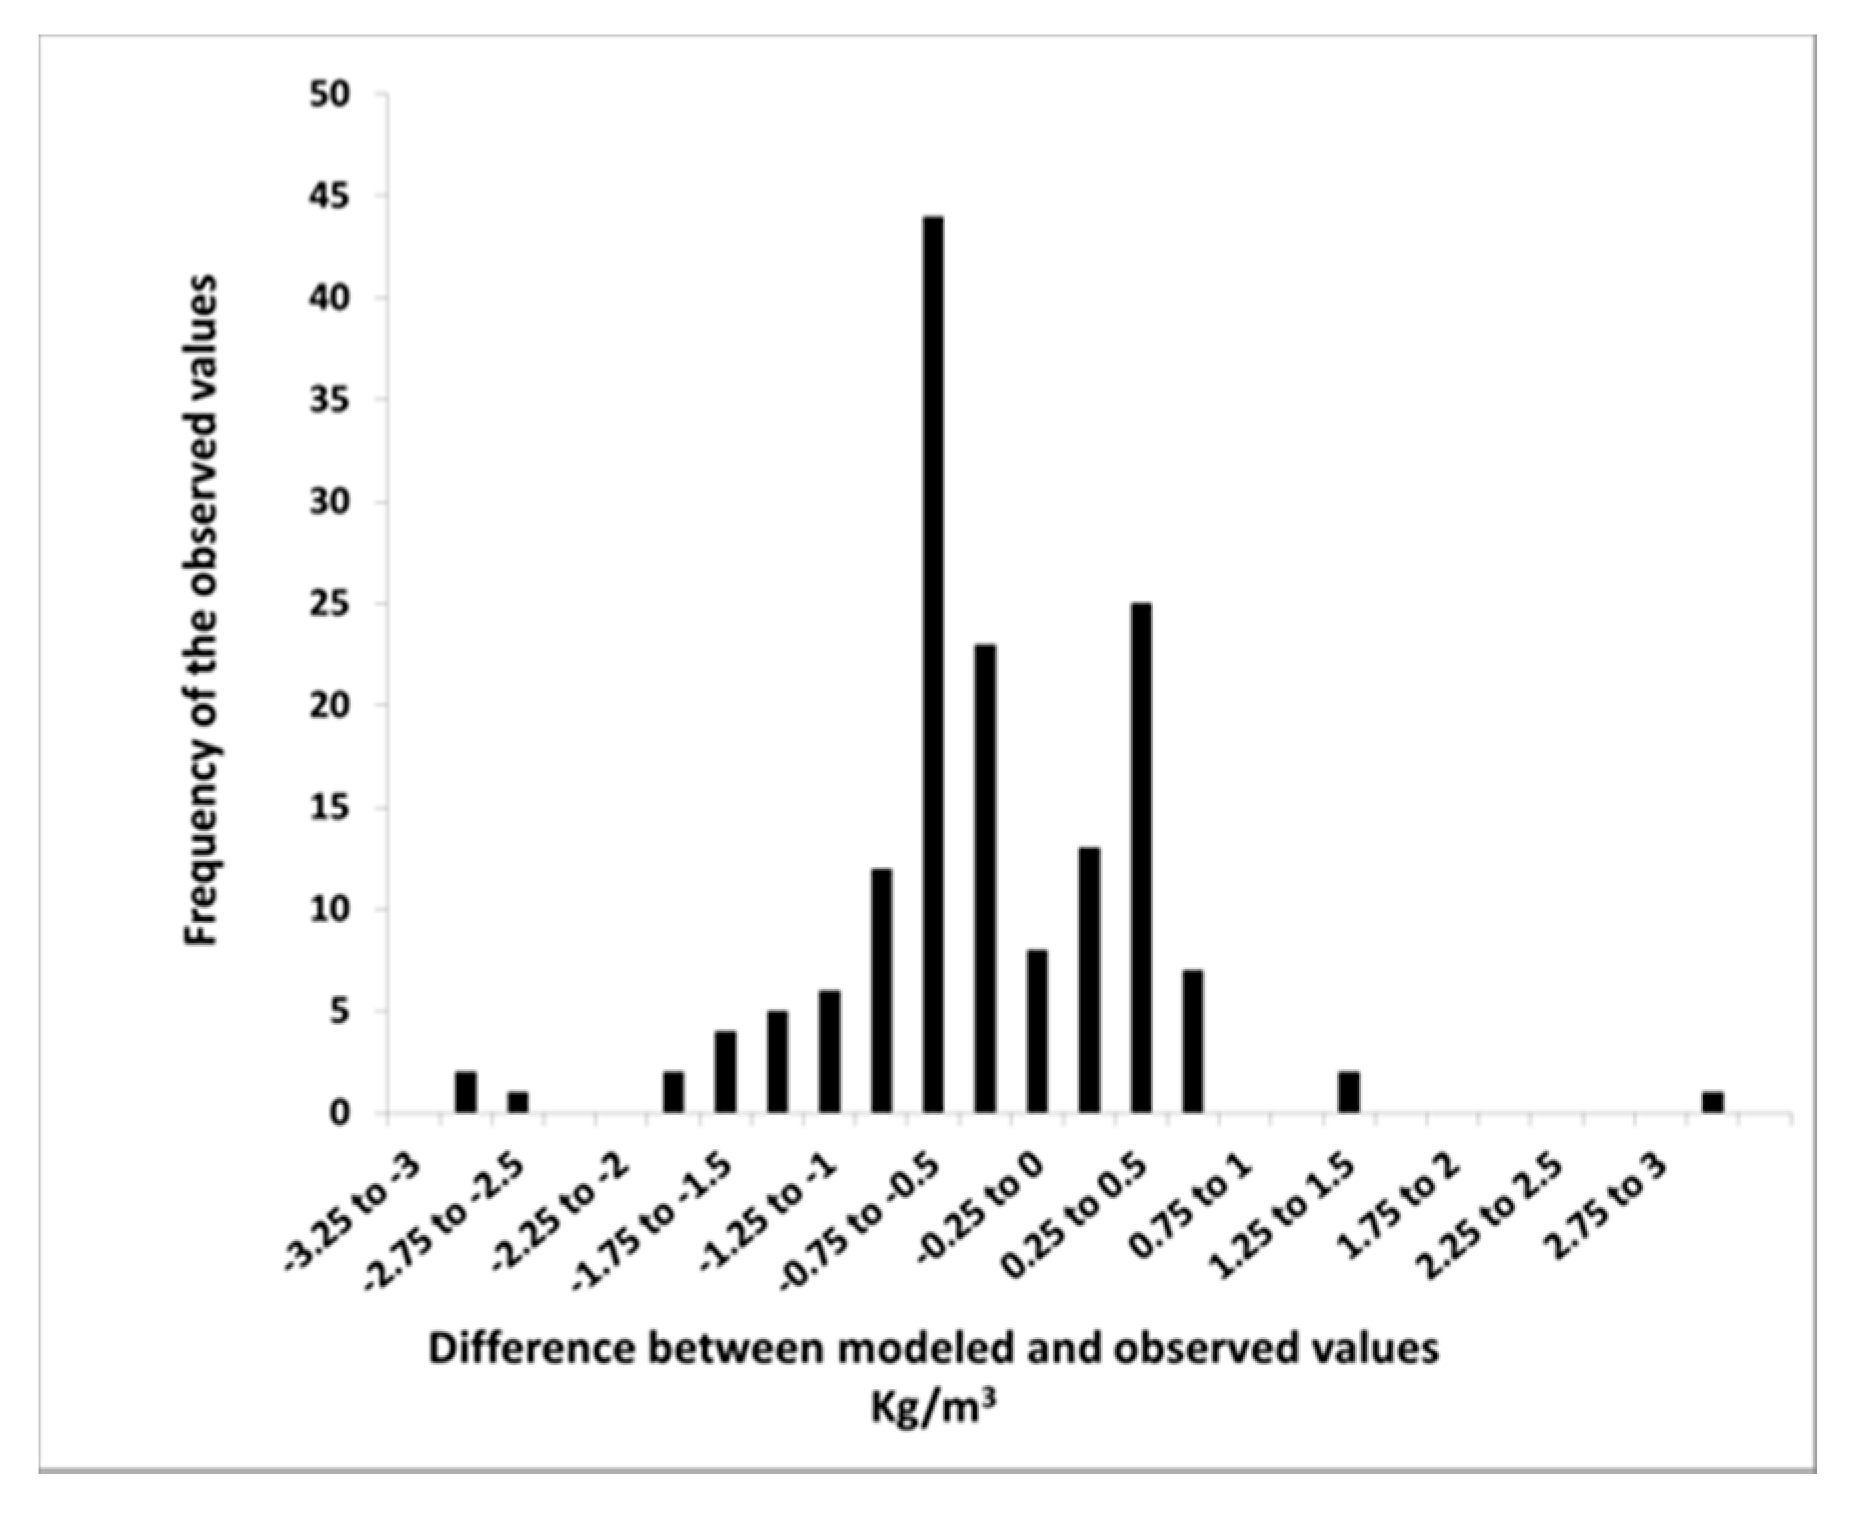
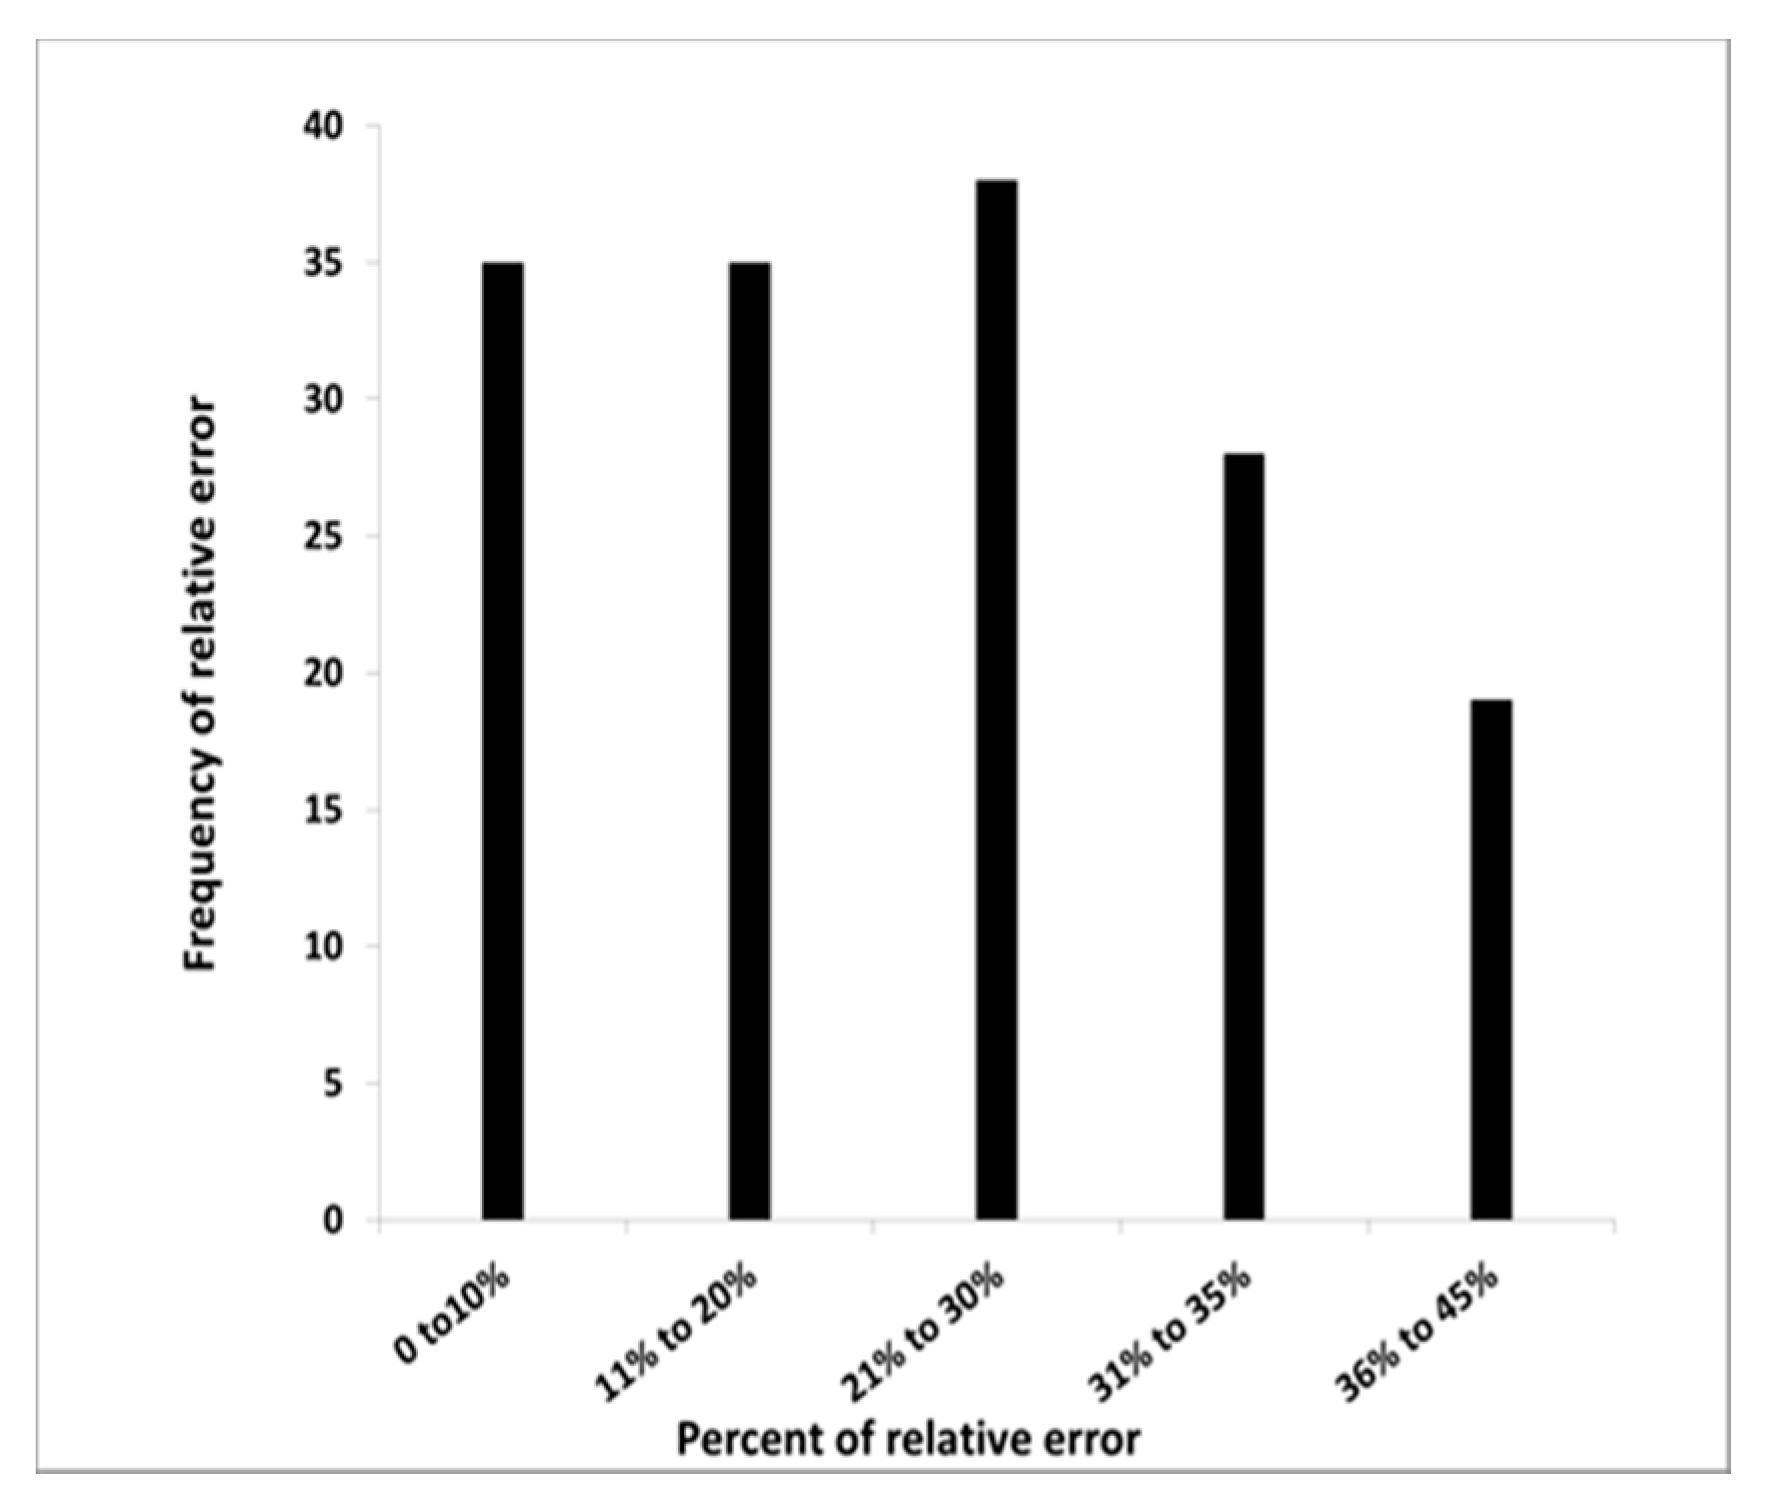
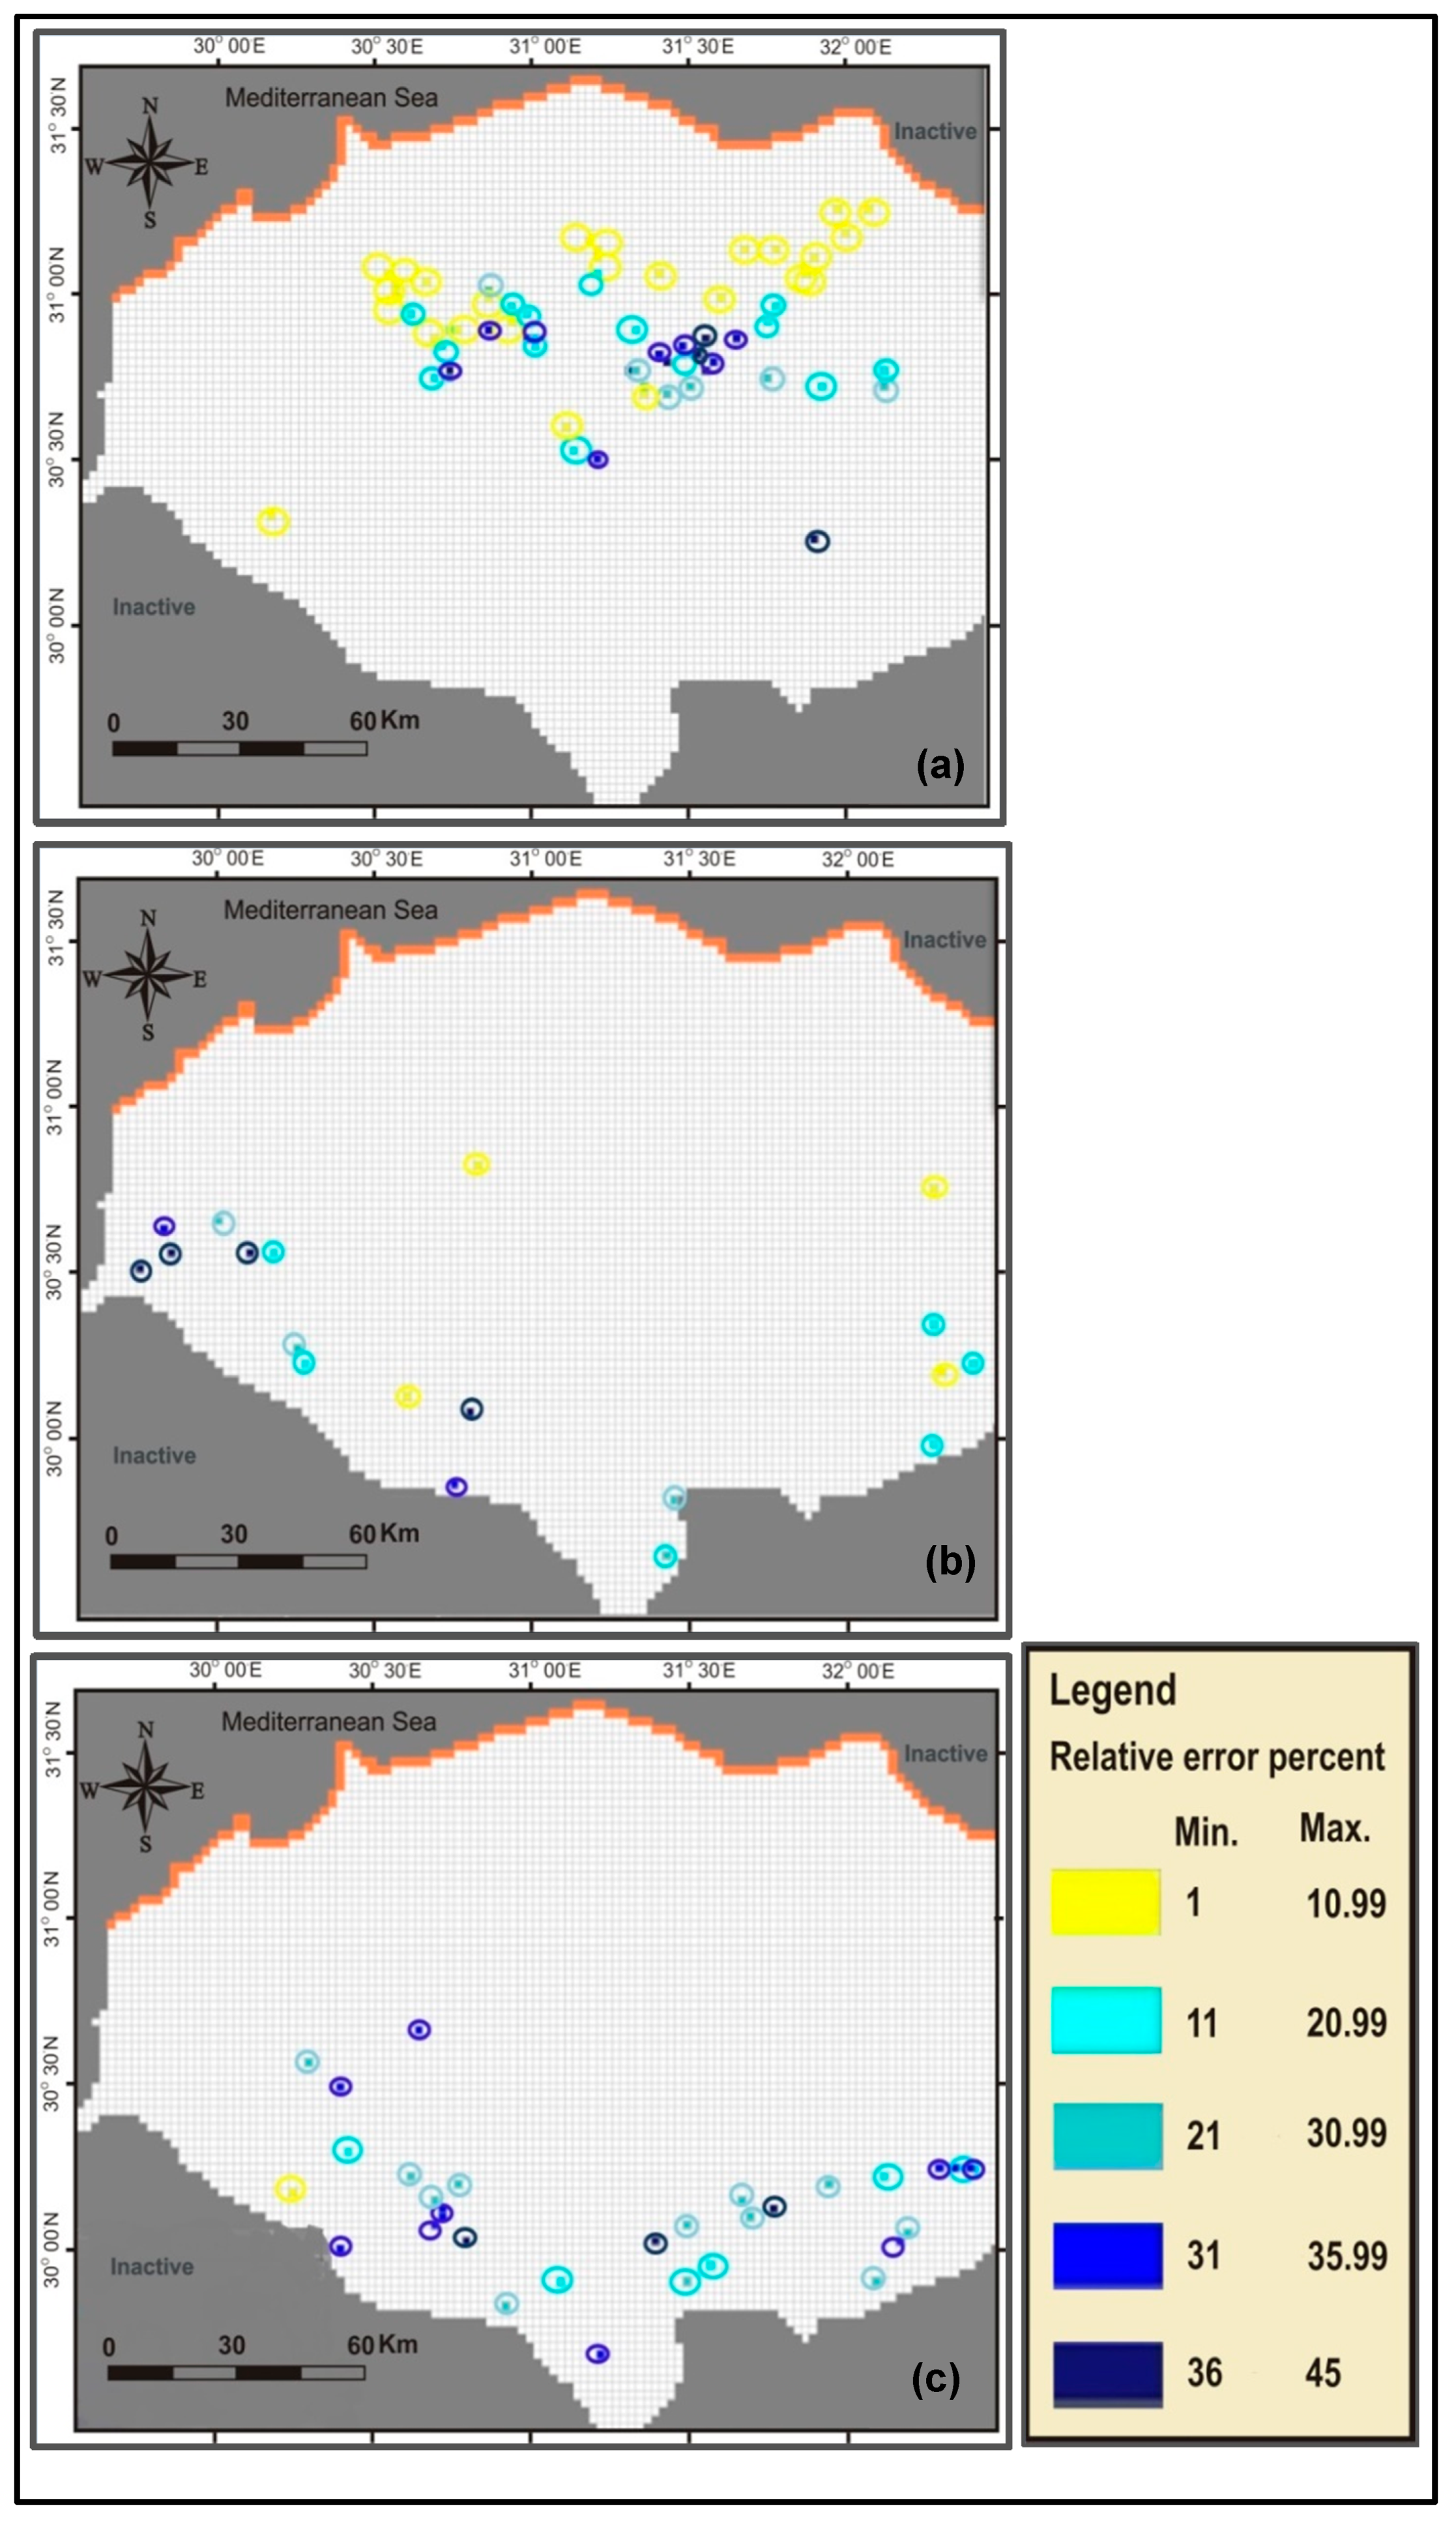
4.1. Comparing Modeling Results and Observed Salinity Data for Different Simulation Periods

To choose the best simulation period for the model, we compared the model results for salinity concentration with the observed salinity concentration data, and calculated the Root Mean Square Error (RMSE) for all nine model simulations with different simulation periods. The comparison between modeled and observed salinity concentration is based upon observed concentration data from 2010 of 155 wells located throughout the NDA. We then determined as most reliable the model with the lowest RMSE value. Figure 5 shows the different RMSE values for all nine simulation periods. The model with a simulation period of 800 years produced the lowest RMSE value. Hence, the salinity concentration distribution at the end of this simulation period with this model was selected.
Figure 6 shows some limited transient results (for the period that data is available) of modeled salinity concentration results of six observation wells that were selected per regions, as follows: Two in the north, two in the middle, and two in the south of the NDA. For each region, one point with best results was selected, and another point with worst results. These results are presented for the period 1980–2010. A comparison between the values of the observed salinity concentration data with different simulation periods also indicates that the 800-year simulation period provides the best results. This is further confirmed with the results presented in Table 2 containing modeled and observed salinity concentrations for these six points in the year 2010.
The simulations show that, at present, the NDA has not yet reached a state of dynamic equilibrium, as indicated by the gradient of the salinity concentration lines in Figure 6. This might be attributable to the substantial size of the groundwater system of the Nile Delta, which needs a very long time to achieve steady state conditions. In addition, stresses such as the increasing rate of groundwater pumping cause additional non steady-state circumstances. The large size of the NDA, in combination with Holocene characterized with lower permeability, retards the interaction between the groundwater and the surface water system. In addition, the fact that salt transport is a slow process causes that the present state of the NDA is in non-equilibrium from a salinity concentration point of view. This condition has also been postulated by [19].
Figure 7a,b shows the modeled versus observed salinity concentrations for the model with a simulation period of 800 years. The southern/middle part (a) and the northern part (b) are separated into two figures for clearer presentation. The absolute salinity concentration values are very small in the southern and middle parts of the NDA and large in the northern part. Figure 8 shows the frequency of the differences between modeled and observed concentration values. It shows that most of the frequency differences are between −0.75 and −0.5 kg/m3. This implies that the differences are overall quite small, which increases the reliability of the results of the simulation.
The RMSE values in the south are smaller than the RMSE values in the north, because the RMSE depends on the absolute values of differences between observed and modeled values. Modeled for fairer comparison of these values, Figure 9 shows the frequency of relative error (in percentage) of modeled salinization concentration. Although for most observations the relative error is relatively low (up to 30%), it is clear that for about one third of observations, the relative error is quite high (30–45%). It should be noted, however, that when we further analyze these results, together with results presented in Figure 7, Figure 8 and Figure 10 (see below), most of these high relative errors are for observations in the south and middle of NDA, where the absolute values of saline concentrations are very low. Figure 10 shows the relative error for observations in modeled different model layers. Note that observations from different layers are brought together to give better visualization of the distribution of the relative error. The dark blue dots represent observations belonging to the class of highest relative error (36–45%). Most of the dark blue dots in Figure 10 are scattered in the south, where the concentration of the infiltrated water varies significantly, and where absolute salinity values are very small, not exceeding 1 kg/m3. In the north (which is very sensitive to SWI), the absolute values of salinity go up to 30 kg/m3. In that part, the relative error never exceeds 10%, as is shown in Figure 10 (represented by the distribution of yellow dots). This indicates that the large volume of reliable hydrogeological data used for the model set up results in low RMSE in this part of the model and in more reliable salinity distribution. Considering the regional scale of the NDA model and the wide range of salinity concentration values (0.045–35 kg/m3), it can be concluded that these obtained relative errors are within acceptable range, but the model simulates the impact of SWI in the northern part better, compared to the middle and southern parts.
The water budget terms have also been analyzed for the model. The huge irrigation network in the Nile Delta has had a great influence on the groundwater system. The main components of inflow are the net recharge due to excess irrigation water (around 5.3 × 10⁹ m3/year). Downward infiltration of surface water from the Nile and the main canals are minor in comparison: About 0.2 × 10⁹ m3/year. There is additional recharge in some regions due to groundwater recharge in reclamation areas, such as in El-Buhaira governorate in the western Nile Delta. The main outflow component is the extensive groundwater extraction (around 4.9 × 10⁹ m3/year), especially in the southern part of the eastern Nile Delta.

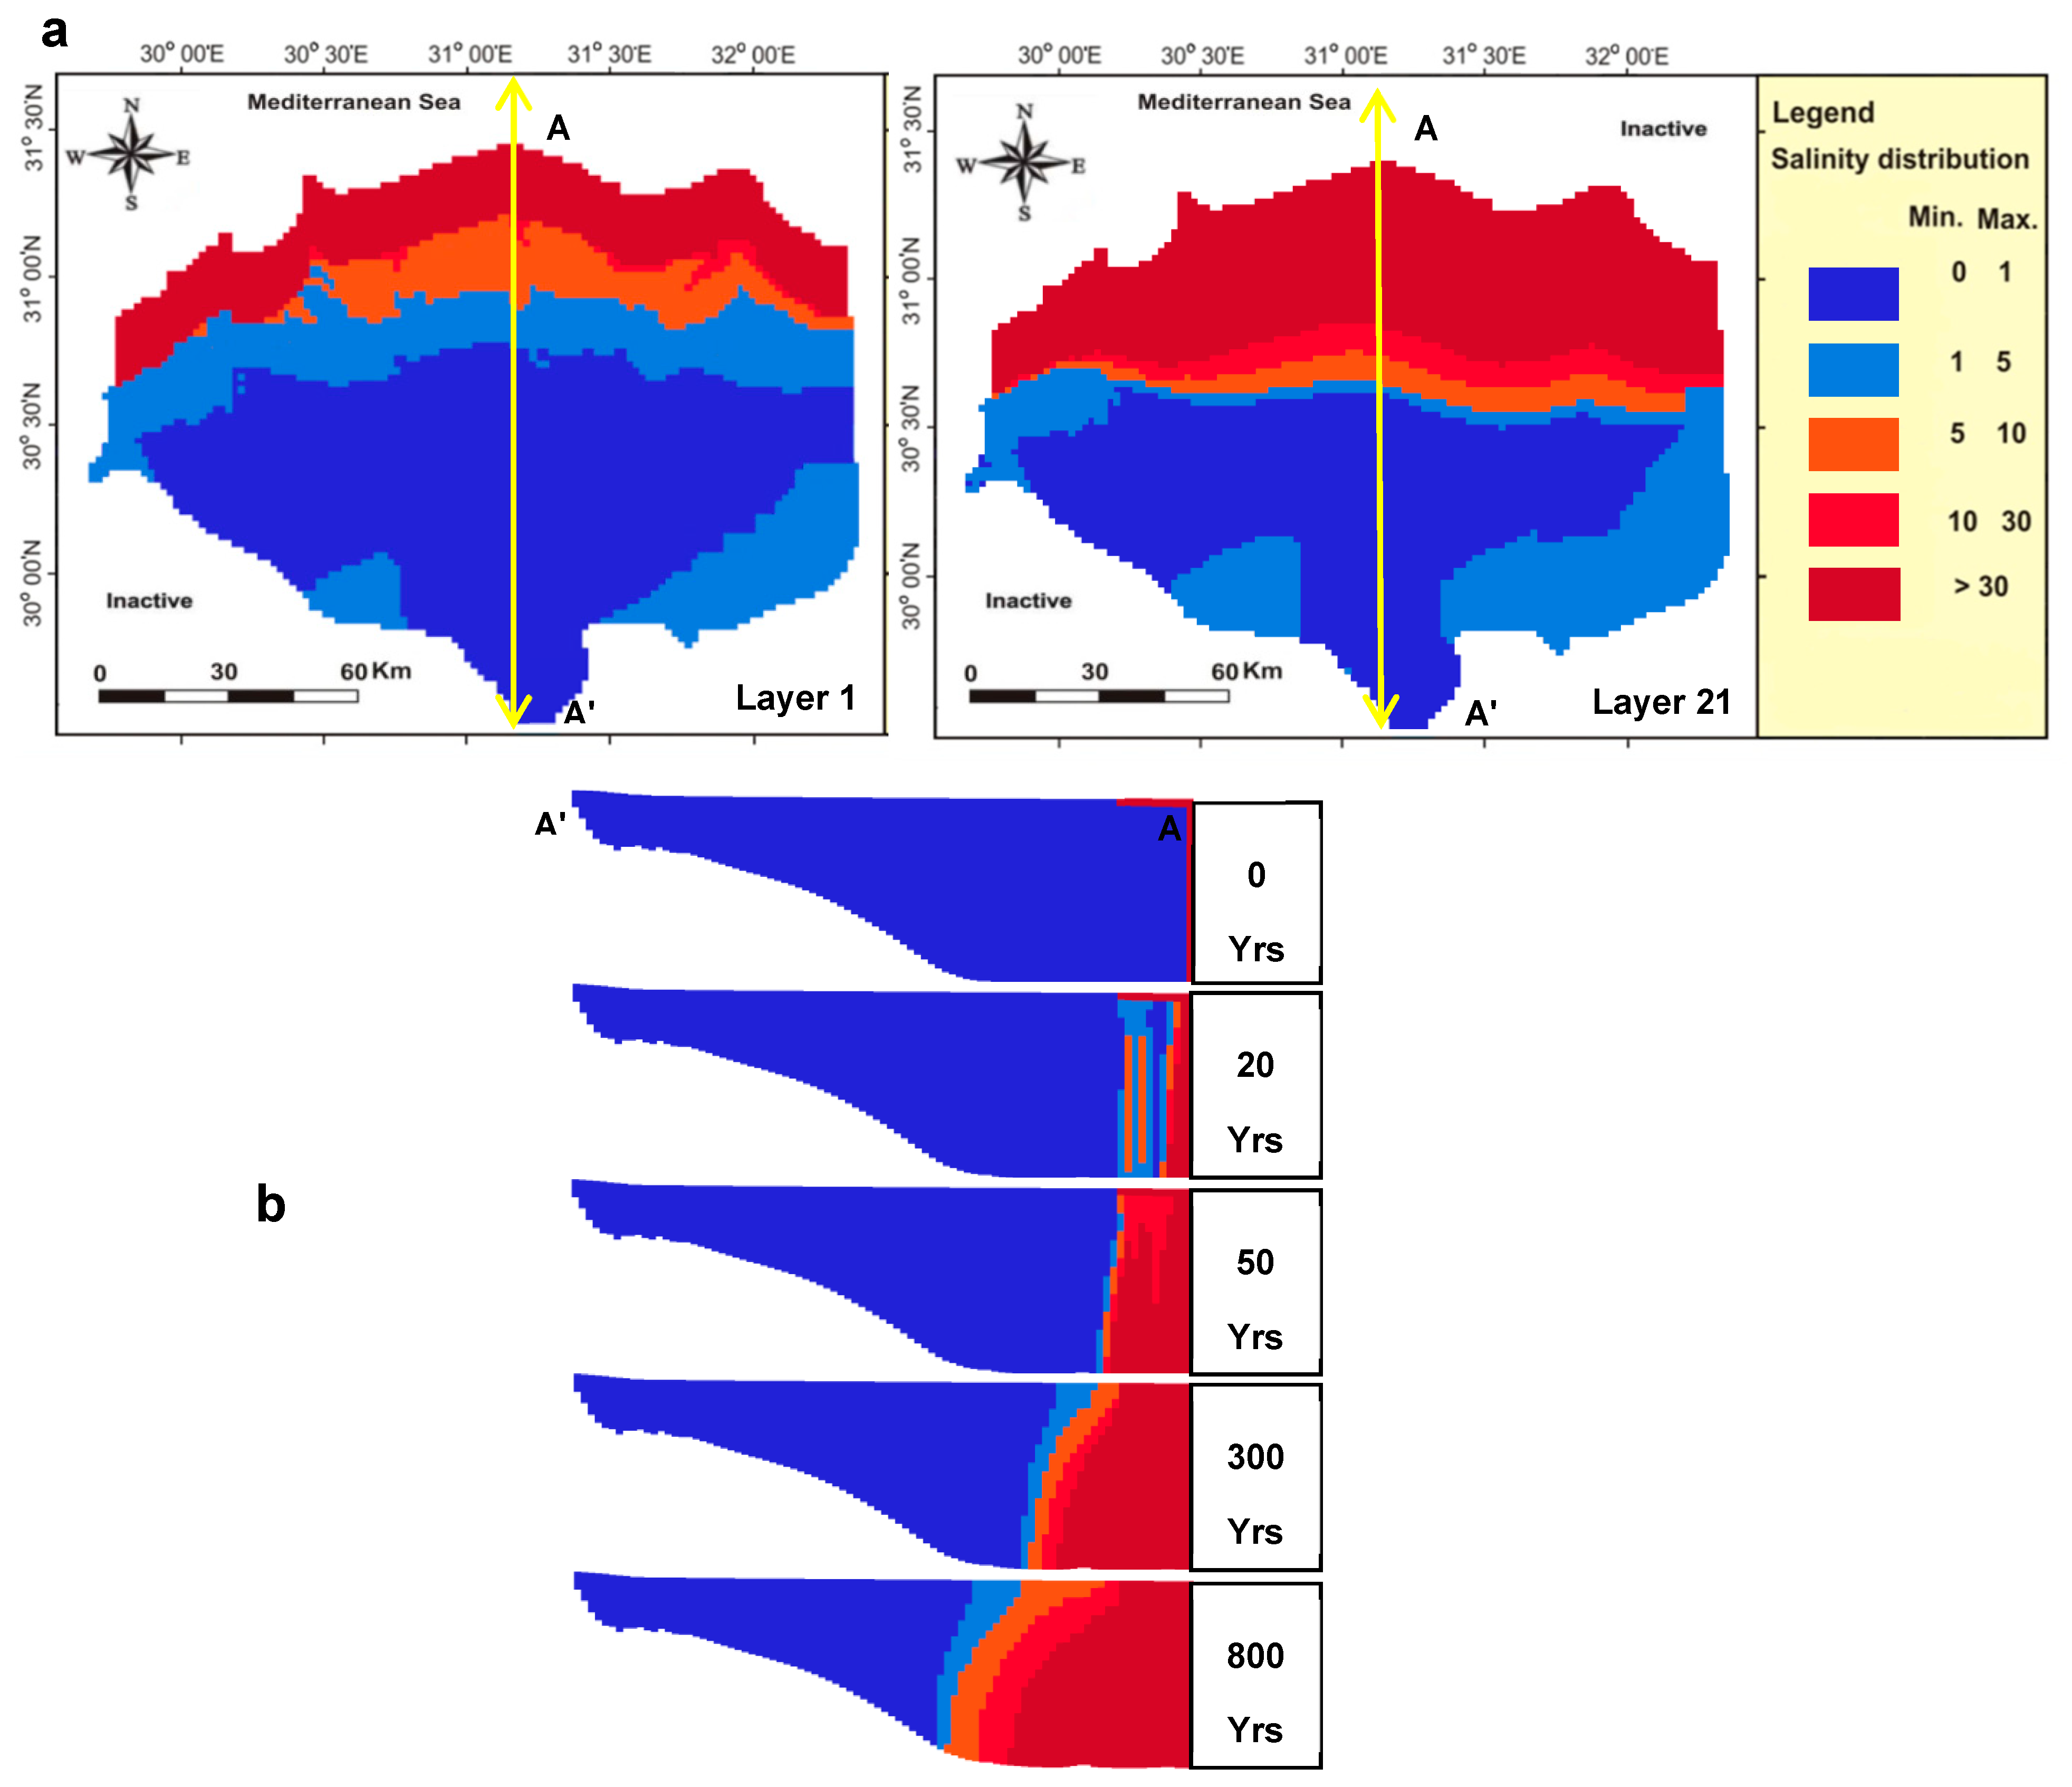
4.2. Salinity Concentration Distribution

Figure 11a,b shows the salinity distribution results for horizontal and vertical directions in the variable-density groundwater flow model with the simulation period of 800 years. Figure 11a presents the final salinity distribution in horizontal direction in model layers 1 and 21 at the end of the simulation period (representing the situation in the year 2010). We also present how SWI increased with the progress of simulation time in a vertical cross-section across all model layers by using several selected time steps (Figure 11b). The new reliable data included in the model improved performance and more reliable salinity distribution maps were obtained, when compared to previous studies. The south-eastern region of the delta has been adequately represented, and this is clearly reflected in the salinity distribution results and the RMSE values, unlike former studies that have always showed this region as completely fresh [18].
These results initially indicate that the salinization process takes a long time. However, fingers of saline groundwater infiltrate rapidly into the fresh NDA (although, with the model cell sizes, only lumped vertical saline plumes can be simulated). Regarding the results obtained at the end of the simulation period, which represent the situation in the year 2010, it is clear that groundwater quality has already deteriorated. The salinity concentration varies from higher than 30 kg/m3 to 10 kg/m3 in the north. It decreases to about 1 kg/m3 in Gharbeya governorate in the middle of the NDA (see for its location, see Figure 1 again). The salinity concentration in the southern region is very low, with values of less than 0.05 kg/m3. The saline groundwater has spread in the north and northeast more widely than in the northwest, possibly because of the presence of a geological formation with higher hydraulic conductivities. Groundwater in the southern and middle regions is virtually fresh, being far distant from SWI introduced at the Mediterranean Sea boundary. All of the above results have been obtained due to the use of the 3D modeling approach, which, when compared to previous 2D models [17] of the same area, gives a clear overall salinity distribution in different layers of the NDA and captures the full dynamics of the fresh groundwater–seawater interactions.
The region in the east around Sharkeya governorate contains light brackish groundwater (see salinity concentration contour of 1 kg/m3 in Figure 11a,b). This also occurs in the southwest around El-Buhaira governorate. Although the model results at individual points in this region are with larger errors, the overall higher salinity is still captured. As the infiltration rate has a lower value (0.01 mm/year) than other governorates, the source of saline groundwater in this region probably comes from dissolution of deeper marine deposits, i.e., fractured marine limestone and shale, which was included in the last modeling layer. Isotope analysis and age dating tests discussed before have confirmed that water samples taken from these two regions contain paleo-water, probably from the underlying Pliocene formation [44]. This is, however, combined with severe abstraction due to extensive reclamation activities in El-Buhaira governorate which increase the salinity concentration of water drawn up from the deeper parts of the NDA.

5. Conclusions and Recommendations

Earlier research on the fresh and saline groundwater system in the NDA under the pressure of SWI using numerical models has mainly focused on 2D simulations, which do not fully imply the complex nature of the NDA in three dimensions. 3D numerical modeling studies have been executed before, but lacked sufficient hydrogeological data or with different parametrization. In this research, a fully 3D variable-density groundwater flow model was constructed to simulate the current situation of salinization in the NDA. This NDA model incorporates hydrogeological data from many sources. An innovative procedure was performed without classical calibration. It used physically sound model parameters, starting from completely fresh ground water in the NDA and set up several different simulations periods to obtain the best salinity concentration distribution in the year of 2010. After simulation, the 3D fresh–saline distribution that best fits the observed salinity data was chosen. Future studies need to address the influence of different parametrization on modeling results, in combination with the proposed approach here. This is beyond the scope of the current paper but could be done within existing frameworks for sensitivity and uncertainty analyses of groundwater models. The developed 3D model represents well the salinity distribution in the NDA. The comparison between numerous (spatially varying) groundwater salinity concentration observations and modeled results shows that the model is capable of representing the current salinity distribution in the NDA, taking the year 2010 as the reference year. Therefore, we believe the model can be used with increasing confidence for future predictions. The model can be considered reliable, but that there are areas in the south where the error is always quite high. When performing forecasting simulations, it may be useful to further improve the model by means of a validation process based on new data collected. The validation process with data collected after 2010 could also confirm the innovative procedure used.
The model results indicate that specific regions in the east (Sharkeya governorate) and southwest (El-Buhaira governorate) likely suffer from salinization due both to dissolution of marine deposits and excessive extraction. Both governorates have great economic agricultural value in Egypt, especially in commodities export. Further study on fresh water needs and methods of extraction in these governorates might impact both conservation efforts and economic development planning with a view to conservation of the fresh groundwater resources in the NDA.
The model serves as a tool for assessing areas of the groundwater system vulnerable to salinization due to combined stresses, such as increased groundwater extraction, different irrigation practices, and SLR. It can be used to track the movement of fresh, brackish, and saline groundwater in the NDA, and for testing future adaptation/mitigation measures for the NDA. Such effective use of the model, however, critically depends on data availability. More salinity concentration data are especially needed, especially from greater depths. Future monitoring campaigns must also better control the salinity sampling process due to its effect on observed sample biases. Multi-level monitoring samplers should be used, especially when lateral SWI and up-coning processes are taking place. These aspects have not been sufficiently controlled in past sampling procedures, which may impact modeling results and, consequently, future predictions. Although collecting reliable monitoring data is costly, monitoring programs are strongly recommended for deep wells, as fresh groundwater resources are of imminent importance for Egypt. Fortunately, faster and more reliable salinity monitoring techniques have become more efficient in the last decade. The Airborne Electromagnetic (AEM) geophysical methods look especially promising [61,62,63,64,65]. The availability of more data will be a keystone for further development in the potential of this model, and will extend the horizon of research in the NDA for different water perspectives.
Finally, the experiences from the developed model, and from the procedure proposed for obtaining a more reliable model setup, could also be used and tested in aquifer systems in different deltas of the world where groundwater resources are deteriorating due to SWI. In spite of differences in geometry and their hydrological parameters, most deltaic areas face similar development and climate stresses.

Author Contributions

The study is part of a PhD research conducted by M.M., under supervision of A.J., G.O.E., and S.U. The paper is conducted as a joint effort of all authors. Conceptualization, M.M., A.J., and G.O.E.; methodology, M.M., A.J., and G.O.E.; software, M.M.; validation, M.M.; formal analysis, M.M., A.J., and G.O.E.; resources, M.M.; data curation, M.M.; writing—original draft preparation, M.M.; writing—review and editing, M.M., A.J., and G.O.E.; supervision, A.J., G.O.E., and S.U.

Funding

This work has been supported financially by IHE Delft Institute for Water Education, Delft, The Netherlands.

Acknowledgments

We would like to thank the Research Institute of Groundwater (RIGW), the Ministry of Water Resources and Irrigation, the General Educational Building Authority (GAEB), and the Coca Cola Company in Egypt for providing us with groundwater data. Special thanks to Dimitri Solomatine, Sameh Sakr, M. Abdel El Atty (The Minister of the Water Resources and Irrigation in Egypt).

Conflicts of Interest

The authors declare no conflicts of interest.

References

  1. Custodio, E. Aquifer overexploitation: What does it mean? Hydrogeol. J. 2002, 10, 254–277. [Google Scholar] [CrossRef]
  2. Werner, A.D.; Bakker, M.; Post, V.E.A.; Vandenbohede, A.; Lu, C.; Ataie-Ashtiani, B.; Simmons, C.T.; Barry, D.A. Seawater intrusion processes, investigation and management: Recent advances and future challenges. Adv. Water Res. J. 2013, 51, 3–26. [Google Scholar] [CrossRef]
  3. El Raey, M.; Nasr, S.; Frihy, O.; Desouki, S.; Dewidar, K. Potential Impacts of Accelerated sea-level rise on Alexandria Governorate, Egypt. Coast. Res. J. 1995, 14, 190–204. [Google Scholar]
  4. IPCC; Field, C.B.; Barros, V.R.; Dokken, D.J.; Mach, K.J.; Mastrandrea, M.D.; Bilir, T.E.; Chatterjee, M.; Ebi, K.L.; Estrada, Y.O.; et al. Climate Change 2014. Impacts, Adaptation, and Vulnerability. Part A: Global and Sectoral Aspects; Contribution of Working Group II to the Fifth Assessment Report of the Intergovernmental Panel on Climate Change; Cambridge University Press: Cambridge, UK, 2014. [Google Scholar]
  5. Morsy, W.S. Environmental Management to Groundwater Resources for Nile Delta Region. Ph.D. Thesis, Faculty of Engineering, Cairo University, Cairo, Egypt, 2009. [Google Scholar]
  6. Mabrouk, M.B.; Jonoski, A.; Solomatine, D.; Uhlenbrook, S. A Review of Seawater Intrusion in the Nile Delta Groundwater System—The basis for Assessing Impacts due to Climate Changes, Sea Level Rise and Water Resources Development. Nile Water Sci. Eng. J. 2017, 10, 46–61. [Google Scholar]
  7. Pennington, B.T.; Sturt, F.; Wilson, P.; Rowland, J.; Brown, A.G. The fluvial evolution of the Holocene Nile Delta. Quat. Sci. Rev. J. 2017, 170, 212–231. [Google Scholar] [CrossRef] [Green Version]
  8. Dahab, K. Hydrogeological Evaluation of the Nile Delta after High Dam Construction. Ph.D. Thesis, Faculty of Science, Menoufia University, Menoufia, Egypt, 1993. [Google Scholar]
  9. Farid, M.S. Management of Groundwater System in the Nile Delta. Ph.D. Thesis, Faculty of Engineering, Cairo University, Cairo, Egypt, 1980. [Google Scholar]
  10. Stanley, J.; Clemente, P.L. Increased Land Subsidence and Sea-Level Rise are Submerging Egypt’s Nile Delta Coastal Margin. Geol. Soc. Am. J. 2017, 27, 5–doi10. [Google Scholar] [CrossRef]
  11. Stanley, D.J. Subsidence in the northeastern Nile delta: Rapid rates, possible causes, and consequences. Sci. J. 1988, 240, 497–500. [Google Scholar] [CrossRef] [PubMed]
  12. Geriesh, M.H.; Balke, K.D.; El-Rayes, A.E.; Mansour, B.M. Implications of climate change on the groundwater flow regime and geochemistry of the Nile Delta, Egypt. Coast. Conserv. J. 2015, 19, 589–608. [Google Scholar] [CrossRef]
  13. Abd-ElMoati, M.A.R.; El-Sammak, A.A. Man-made impact on the geochemistry of the Nile Delta Lakes. A study of metals concentrations in sediments. Water Air Soil Pollut. J. 1997, 97, 413. [Google Scholar] [CrossRef]
  14. Abd-Elhamid, H.F.; Javadi, A.A.; Abd-Elaty, I.; Sherif, M.M. Simulation of seawater intrusion in the Nile Delta aquifer under the conditions of climate change. Hydrol. Res. J. 2016, 47, 1198–1210. [Google Scholar] [CrossRef]
  15. Darwish, M.M. Effect of Probable Hydrological Changes on the Nile Delta Aquifer System. Ph.D. Thesis, Cairo University, Cairo, Egypt, 1994. [Google Scholar]
  16. Sherif, M.M.; Singh, V.P. Effect of climate change on sea water intrusion in coastal aquifers. Hydrol. Process. J. 1999, 13, 1277–1287. [Google Scholar] [CrossRef]
  17. Nosair, A. Climatic Change and Their Impacts on Groundwater Occurrence in Eastern Part in Nile Delta. Master’s Thesis, Faculty of Science, Zagazig University, Zagazig, Egypt, 2011. [Google Scholar]
  18. Sherif, M.M.; Sefelnasr, A.; Javad, A. Incorporating the concept of equivalent freshwater head in successive horizontal simulations of seawater intrusion in the Nile Delta aquifer, Egypt. Hydrogeol. J. 2012, 464, 186–198. [Google Scholar] [CrossRef]
  19. Sefelnasr, A.; Sherif, M.M. Impacts of seawater rise on seawater intrusion in the Nile Delta aquifer, Egypt. Groundw. J. 2014, 52, 264–276. [Google Scholar] [CrossRef] [PubMed]
  20. Nofal, E.R.; Amer, M.A.; El-Didy, S.M.; Fekry, A.M. Delineation and modeling of seawater intrusion into the Nile Delta Aquifer: A new perspective. Water Sci. J. 2015, 29, 156–166. [Google Scholar] [CrossRef] [Green Version]
  21. Gelhar, L.W.; Welty, C.; Rehfeldt, K.R. A Critical Review of Data on Field-Scale Dispersion in Aquifers. Water Resour. Res. J. 1992, 28, 1955–1974. [Google Scholar] [CrossRef]
  22. Werner, A.D.; Gallagher, M.R. Characterization of sea-water intrusion in the Pioneer Valley, Australia using hydrochemistry and three-dimensional numerical modelling. Hydrogeol. J. 2006, 14, 1452–1469. [Google Scholar] [CrossRef]
  23. Oude Essink, G.H.P.; Van Baaren, E.S.; De Louw, P.G.B. Effects of climate change on coastal groundwater systems: A modeling study in the Netherlands. Water Resour. Res. J. 2010, 46, 10. [Google Scholar] [CrossRef]
  24. Zeghici, R.M.; Oude Essink, G.H.P.; Hartog, N.; Sommer, W. Integrated assessment of variable density–viscosity groundwater flow for a high temperature mono-well aquifer thermal energy storage (HT-ATES) system in a geothermal reservoir. Geotherm. J. 2015, 55, 58–68. [Google Scholar] [CrossRef]
  25. Abd-Elhamid, H.F. Investigation and control of seawater intrusion in the Eastern Nile Delta aquifer considering climate change. Water Sci. Technol. Water Supply J. 2017, 17, 311–323. [Google Scholar] [CrossRef]
  26. Yang, J.; Graf, T.; Ptak, T. Impact of climate change on freshwater resources in a heterogeneous coastal aquifer of Bremerhaven, Germany: A three-dimensional modeling study. Contam. Hydrol. J. 2015, 177, 107–121. [Google Scholar] [CrossRef]
  27. Gingerich, S.B.; Voss, C.I. Three-dimensional variable-density flow simulation of a coastal aquifer in southern Oahu, Hawaii, USA. Hydrogeol. J. 2005, 13, 436–450. [Google Scholar] [CrossRef]
  28. Schulz, S.; Walther, M.; Michelsen, N.; Rausch, R.; Dirks, H.; Al-Saud, M.; Merz, R.; Kolditz, O.; Schüth, C. Improving large-scale groundwater models by considering fossil gradients. Adv. Water Res. J. 2017, 103, 32–43. [Google Scholar] [CrossRef]
  29. Langevin, C.D.; Thorne, D.T.; Thorne, D.T., Jr.; Sukop, A.M.; Guo, W. SEAWAT Version 4: A Computer Program for Simulation of Multi-Species Solute and Heat Transport: U.S. Geological Survey Techniques and Methods; Geological Survey (U.S.): Leston, VA, USA, 2008; p. 39. [Google Scholar]
  30. CAPMAS. Central Agency for Public Mobilization and Statistics Egypt. 2017. Available online: www.capmas.gov.eg (accessed on 1 February 2017).
  31. Sestini, G. Nile Delta: A review of depositional environments and geological history. Geol. Soc. J. 1989, 41, 99–127. [Google Scholar] [CrossRef]
  32. Said, R. The Geologic Evolution of the River Nile; Springer: New York, NY, USA, 1981. [Google Scholar]
  33. Zheng, C.; Wang, P.P. MT3DMS: A Modular Three-Dimensional Multispecies Transport Model for Simulation of Advection, Dispersion and Chemical Reactions of Contaminants in Groundwater Systems; Documentation and User’s Guide, Strategic Environmental Research and Development Program; US Army Corps of Engineers: Boston, MA, USA, 1999. [Google Scholar]
  34. GAEB. Geotechnical Encyclopedia of Egypt; General Authority for Educational Buildings Publishing Unit: Cairo, Egypt, 2011; ISBN 977-6079-23-7. [Google Scholar]
  35. RIGW (Research Institute for Groundwater); Ministry of Water Resources and Irrigation. Hydrogeology Map of the Nile Delta, Scale 1: 50000000, 1st ed.; MWRI Publishing Unit: Cairo, Egypt, 1992. [Google Scholar]
  36. EGSA. Egyptian General Survey and Mining, Topographical Map Cover Nile Delta, Scale 1:2.000.000; Alameria Publishing Unit: Cairo, Egypt, 1997. [Google Scholar]
  37. Walther, M.; Graf, T.; Kolditz, O.; Liedl, R.; Post, V. How significant is the slope of the sea-side boundary for modelling seawater intrusion in coastal aquifers? Hydrol. J. 2017, 551, 648–659. [Google Scholar] [CrossRef]
  38. Huisman, L. Groundwater Recovery; Besleys Books: Blyburgate, UK, 1972. [Google Scholar]
  39. Aly, A.I.M.; Simpson, H.J.; Hamza, M.S.; White, J.W.C.; Nada, A.; Awad, M.A. Use of environmental isotopes in the quantification of the water budget of the Nile Delta, Egypt. Isot. Radiat. Res. J. 1991, 21, 31–40. [Google Scholar]
  40. Awad, M.A.; Nada, A.A.; Aly, A.I.M.; Farid, M.S. Tritium content of groundwater aquifer in western Nile Delta. Isot. Environ. Health Stud. J. 1993, 28, 167–173. [Google Scholar] [CrossRef]
  41. Awad, M.A.; Farid, M.S.; Hamza, M.S. Studies on the recharge of the aquifer systems in the southern portion of the Nile Delta. Isot. Radiat. Res. J. 1994, 26, 21–25. [Google Scholar]
  42. Awad, M.A.; Sadek, M.A.; Salem, W.M. Use of mass balance and statistical correlation for geochemical and isotopic investigation of the groundwater in the quaternary aquifer of the Nile Delta, Egypt. Arab J. Nucl. Sci. Appl. J. 1999, 32, 43–58. [Google Scholar]
  43. Hamza, M.S.; Aly, A.I.M.; Swailem, F.M.; Nada, A. Environmental stable isotopes indicate possible sources of groundwater recharge in eastern Nile Delta. Isot. Radiat. Res. J. 1987, 19, 7–14. [Google Scholar]
  44. Salem, W.M.; Sadek, M.A. Chemical and isotopic signature for mapping zones of seawater intrusion and residual saline pockets in coastal aquifers of the Egyptian Nile Delta. Arab Nucl. Sci. Appl. J. 2006, 39, 111–127. [Google Scholar]
  45. Shohaib, R. A Study of Environmental Isotopes and Trace Elements Abundance in Egyptian Water. Ph.D. Thesis, Faculty of Science, Cairo University, Cairo, Egypt, 1980. [Google Scholar]
  46. Salem, W.M.M. Application of environmental isotopes and hydrochemical modelling to study groundwater in tenth of Ramadan city, Egypt. Isot. Radiat. Res. J. 2001, 33, 243–259. [Google Scholar]
  47. Webster, D.S.; Procter, J.R.; Marine, J.W. Two-Well Tracer Test in Fractured Crystalline Rock; USGS: Leston, VA, USA, 1970. [Google Scholar]
  48. Segol, G.; Pinder, G.F. Transient simulation of saltwater intrusion in southeastern Florida. Water Resour. Res. J. 1976, 12, 65–70. [Google Scholar] [CrossRef]
  49. Bear, J. Hydraulics of Groundwater; Dover Publications: Mineola, NY, USA, 2007; ISBN 0-486-45355-3. [Google Scholar]
  50. CDS (Canal Distribution Sector). Ministry of Water Resources and Irrigation in Egypt, National Yearly Report; MWRI Publishing Unit: Cairo, Egypt, 2010; Volume 10. [Google Scholar]
  51. El-Sadek, A.; El Kahloun, M.; Meire, P. Ecohydrology for integrated water resources management in the Nile Basin. Ecohydrol. Hydrobiol. J. 2008, 8, 77–84. [Google Scholar] [CrossRef]
  52. RIGW/IWACO. Environmental Management of Groundwater Resources (EMGR); Final Technical Report TN/70.0067/WQM/97/20; Kanater: El-Khairia, Egypt, 1999. [Google Scholar]
  53. Azab, A. Surface Water Quality Management in Irrigated Watersheds. Ph.D. Thesis, Delft University of Technology, Delft, The Netherlands, 2012. [Google Scholar]
  54. Elewa, H.H.; El Nahry, H. Hydro-Environmental Status and Soil Management of the River Nile Delta, Egypt. Environ. Geol. J. 2009, 57, 759–774. [Google Scholar] [CrossRef]
  55. Taha, A.A.; El-Mahmoudi, A.S.; El-Haddad, I.M. Pollution sources and related environmental impacts in the new communities southeast Nile Delta, Egypt. Emir. J. Eng. Res. J. 2004, 9, 35–49. [Google Scholar]
  56. Delsman, J.R.; Hu-a-ng, K.R.M.; Vos, P.C.C.; De Louw, P.G.B.; Oude Essink, G.H.P.; Stuyfzand, P.J.; Bierkens, M.F.P. Paleo-modeling of coastal saltwater intrusion during the Holocene: An application to the Netherlands. Hydrol. Earth Syst. Sci. J. 2014, 18, 3891–3905. [Google Scholar] [CrossRef]
  57. Meisler, H.; Leahy, P.P.; Knobel, L.L. Effect of Eustatic Sea-Level Changes on Saltwater-Freshwater in the Northern Atlantic Coastal Plain; USGS Water Supply Paper 2255; USGS: Leston, VA, USA, 1984. [Google Scholar]
  58. Misut, P.E.; Voss, C.I. Freshwater-saltwater transition zone movement during aquifer storage and recovery cycles in Brooklyn and Queens, New York City, USA. Hydrol. J. 2007, 337, 87–103. [Google Scholar] [CrossRef]
  59. Post, V.E.A.; Groen, J.; Kooi, H.; Person, M.; Ge, S.; Edmunds, W.M. Offshore fresh groundwater reserves as a global phenomenon. Nat. J. 2013, 504, 71–78. [Google Scholar] [CrossRef]
  60. Larsen, F.; Tran, L.V.; Van Hoang, H.; Tran, L.T.; Christiansen, A.V.; Pham, N.Q. Groundwater salinity influenced by Holocene seawater trapped in incised valleys in the Red River delta plain. Nat. Geosci. J. 2017, 10, 376–381. [Google Scholar] [CrossRef] [Green Version]
  61. Delsman, J.; Van Baaren, E.S.; Siemon, B.; Dabekaussen, W.; Karaoulis, M.C.; Pauw, P.; Vermaas, T.; Bootsma, H.; De Louw, P.G.B.; Gunnink, J.L.; et al. Large-scale, probabilistic salinity mapping using airborne electromagnetics for groundwater management in Zeeland, the Netherlands. Environ. Res. J. 2018. [Google Scholar] [CrossRef]
  62. Faneca Sànchez, M.; Gunnink, J.L.; Van Baaren, E.S.; Oude Essink, G.H.P.; Auken, E.; Elderhorst, W.; De Louw, P.G.B. Modelling climate change effects on a Dutch coastal groundwater system using airborne electromagnetic measurements. Hydrol. Earth Syst. Sci. J. 2012, 16, 4499–4516. [Google Scholar] [CrossRef] [Green Version]
  63. Jorgensen, F.; Scheer, W.; Thomsen, S.; Sonnenborg, T.O.; Hinsby, K.; Wiederhold, H.; Schamper, C.; Burschil, T.; Roth, B.; Kirsch, R. Transboundary geophysical mapping of geological elements and salinity distribution critical for the assessment of future sea water intrusion in response to sea level rise. Hydrol. Earth Syst. Sci. J. 2012, 16, 1845–1862. [Google Scholar] [CrossRef] [Green Version]
  64. Rasmussen, P.; Sonnenborg, T.O.; Goncear, G.; Hinsby, K. Assessing impacts of climate change, sea-level rise, and drainage canals on saltwater intrusion to coastal aquifer. Hydrol. Earth Syst. Sci. J. 2013, 17, 421–443. [Google Scholar] [CrossRef]
  65. Siemon, B.; Christiansen, A.V.; Auken, E. A review of helicopter-borne electromagnetic methods for groundwater exploration. Near Surf. Geophys. J. 2009, 7, 629–646. [Google Scholar] [CrossRef]
Figure 1. Location map of different governorates in the Nile Delta Aquifer (NDA).
Water 11 01946 g001
Figure 2. (a) Elevations of the study area specified in the first modeling layer. (b) Thickness of the first hydrological layer (Holocene). (c) The bottom of the second hydrological layer (Pleistocene). (d) Salinity concentration in kg/m3 of the boundary condition in the deepest modeling layer, modified from data used in [5].
Water 11 01946 g002
Figure 3. (a) The hydraulic conductivity of the Pleistocene aquifer of the Nile Delta. (b) Irrigation network. (c) Zones with different recharge rates in the Nile Delta. (d) The salinity concentration in kg/m3 the river package, modified from data used in [5].
Water 11 01946 g003
Figure 4. The distribution of the abstraction wells.
Water 11 01946 g004
Figure 5. Root Mean Square Error (RMSE) of salinity values for different simulation periods.
Water 11 01946 g005
Figure 6. The salinity concentration values in kg/m3 for six points (S1, S2, M1, M2, N1, and N2) in the period 1980–2010, compared to their observed salinity concentration values for different simulation periods.
Water 11 01946 g006
Figure 7. Modeled versus observed salinity concentrations in: (a) The southern and the middle parts of the NDA (RMSE = 0.8, Abs. Diff. = 0.52, Stan Dev. = 0.61 kg/m3). (b) The northern parts of the NDA year 2010 (RMSE = 0.2, Abs. Diff. = 0.14, Stan Dev. = 0.11 kg/m3).
Water 11 01946 g007
Figure 8. The histogram for the frequency of the modeled and observed concentrations.
Water 11 01946 g008
Figure 9. The frequency of relative error of modeled salinization concentrations with respect to observed concentrations. The total number of observations is 155.
Water 11 01946 g009
Figure 10. The relative error percent with respect to the modeled salinity concentration value. (a) Layers 3, 4, 5, 6, 7; (b) Layers 8, 9, 10; (c) Layers 11, 12, 13, 14, 15, 16.
Water 11 01946 g010
Figure 11. (a) The salinity concentration distribution in kg/m3 in first and last layers for 2010AD (last time step of the model with simulation period of 800 years). (b) Salinity concentration distribution along the cross section of the NDA versus time (A–A’).
Water 11 01946 g011
Table 1. An overview of main data sets and its sources.
CategoryVariable Source
HydrogeologyHydraulic conductivity
Effective porosity
Salinity concentration
Groundwater extraction wells
MWRI 1 (RIGW 2)
Literature review
CCC 3
GAEB 4
EGSM 5
ClimateMeteorological data (rain)Literature review
Land useAgricultural zones
Model boundaries
FAO 6
Literature review
IrrigationMain canals and drains
Discharge and water balance component
MWRI (CDS 7)
Literature review
1 MWRI: Ministry of Water Resources and Irrigation. 2 RIGW: Research Institute for Groundwater. 3 CCC: Coca Cola Company in Egypt. 4 GAEB: Geotechnical Authority for Educational Buildings. 5 EGSM: Egyptian Geological Survey and Mining. 6 FAO: Food and Agriculture organization. 7 CDS: Canal Distribution Sector.
Table 2. The salinity modeled concentration values in kg/m3 for six points (S1, S2, M1, M2, N1, and N2) in 2010, compared to their observed salinity concentration values for different simulation periods.
Time Interval of Model Simulation Periods (years)Salinity Modeled Concentration in 2010
S1S2M1M2N1N2
2000.180.490.5911112.68
4000.280.540.051.515.323.9
6000.30.61.1161.822.927.15
7000.350.72.9225.429
8000.50.872.72731.8
10000.60.8985.53235
17000.70.93973436
26000.80.9610103838.5
Observed salinity concentration0.430.8363.22833

