Examination of Nutrient Sources and Transport in a Catchment with an Audubon Certified Golf Course


1
Department of Earth and Environmental Sciences, California State University East Bay, Hayward, CA 94542, USA
2
Nuclear and Chemical Science Division, Lawrence Livermore National Laboratory, Livermore, CA 94550, USA
3
East Bay Regional Park District, Oakland, CA 94605, USA
*
Author to whom correspondence should be addressed.
†
Now at the Department of Earth and Planetary Sciences, University of California Santa Cruz, Santa Cruz, CA 95064, USA.
Water 2019, 11(9), 1923; https://doi.org/10.3390/w11091923
Submission received: 5 August 2019
/
Revised: 9 September 2019
/
Accepted: 11 September 2019
/
Published: 14 September 2019
(This article belongs to the Special Issue Processes Influencing Water Quality in Surface Catchments in the Context of the Local and Global Distribution of Pollutants)
Abstract
:Water bodies in the East Bay Regional Park District (EBRPD), California, United States, provide aesthetic value and critical ecosystem services, but are often adversely affected by the activities and infrastructure of the intensely urban environment that surrounds the parks. EBRPD leases a golf course (Tilden Golf Course (TGC)) in Tilden Regional Park, one of its most popular parks located in the Berkeley Hills, which was certified as an Audubon Cooperative Sanctuary in 2013. Nonetheless, application of nutrients and pesticides (fungicides, plant growth regulators and herbicides) are commonly used to maintain turf systems and may be transported via surface runoff or through subsurface drainage to surface waters, leading to the concern that golf courses are a major contributor to water pollution. We studied the possible contribution of nutrients (NO3-N and PO4-P) and pesticides transported via storm-generated surface runoff and via groundwater from TGC to the primary drainage in the watershed, Wildcat Creek. Lake Anza, a popular open water swimming lake, is located downstream from TGC and experiences occasional nutrient-driven algal blooms that have caused swim beach closures. Measured NO3-N and PO4-P in the stream, at times, exceeded concentration limits of 1 mg/L (as N) and 0.05 mg/L (as P), respectively, considered protective of aquatic ecosystems by the United States Environmental Protection Agency (1986). We found that phosphorous likely has a dominant natural source, but nitrogen is primarily derived from a golf course fertilizer source and its concentration increases in the stream during runoff events, while other soluble species decrease. Analyses of pesticides in water reveal the presence of Azoxystrobin in stream water at the golf course, but with concentrations well below the regulatory limit. These results indicate that all other pesticides applied on TGC are not likely transported to the stream, suggesting future reactive transport research must treat contaminant species independently based on their specific transport behaviors.
1. Introduction
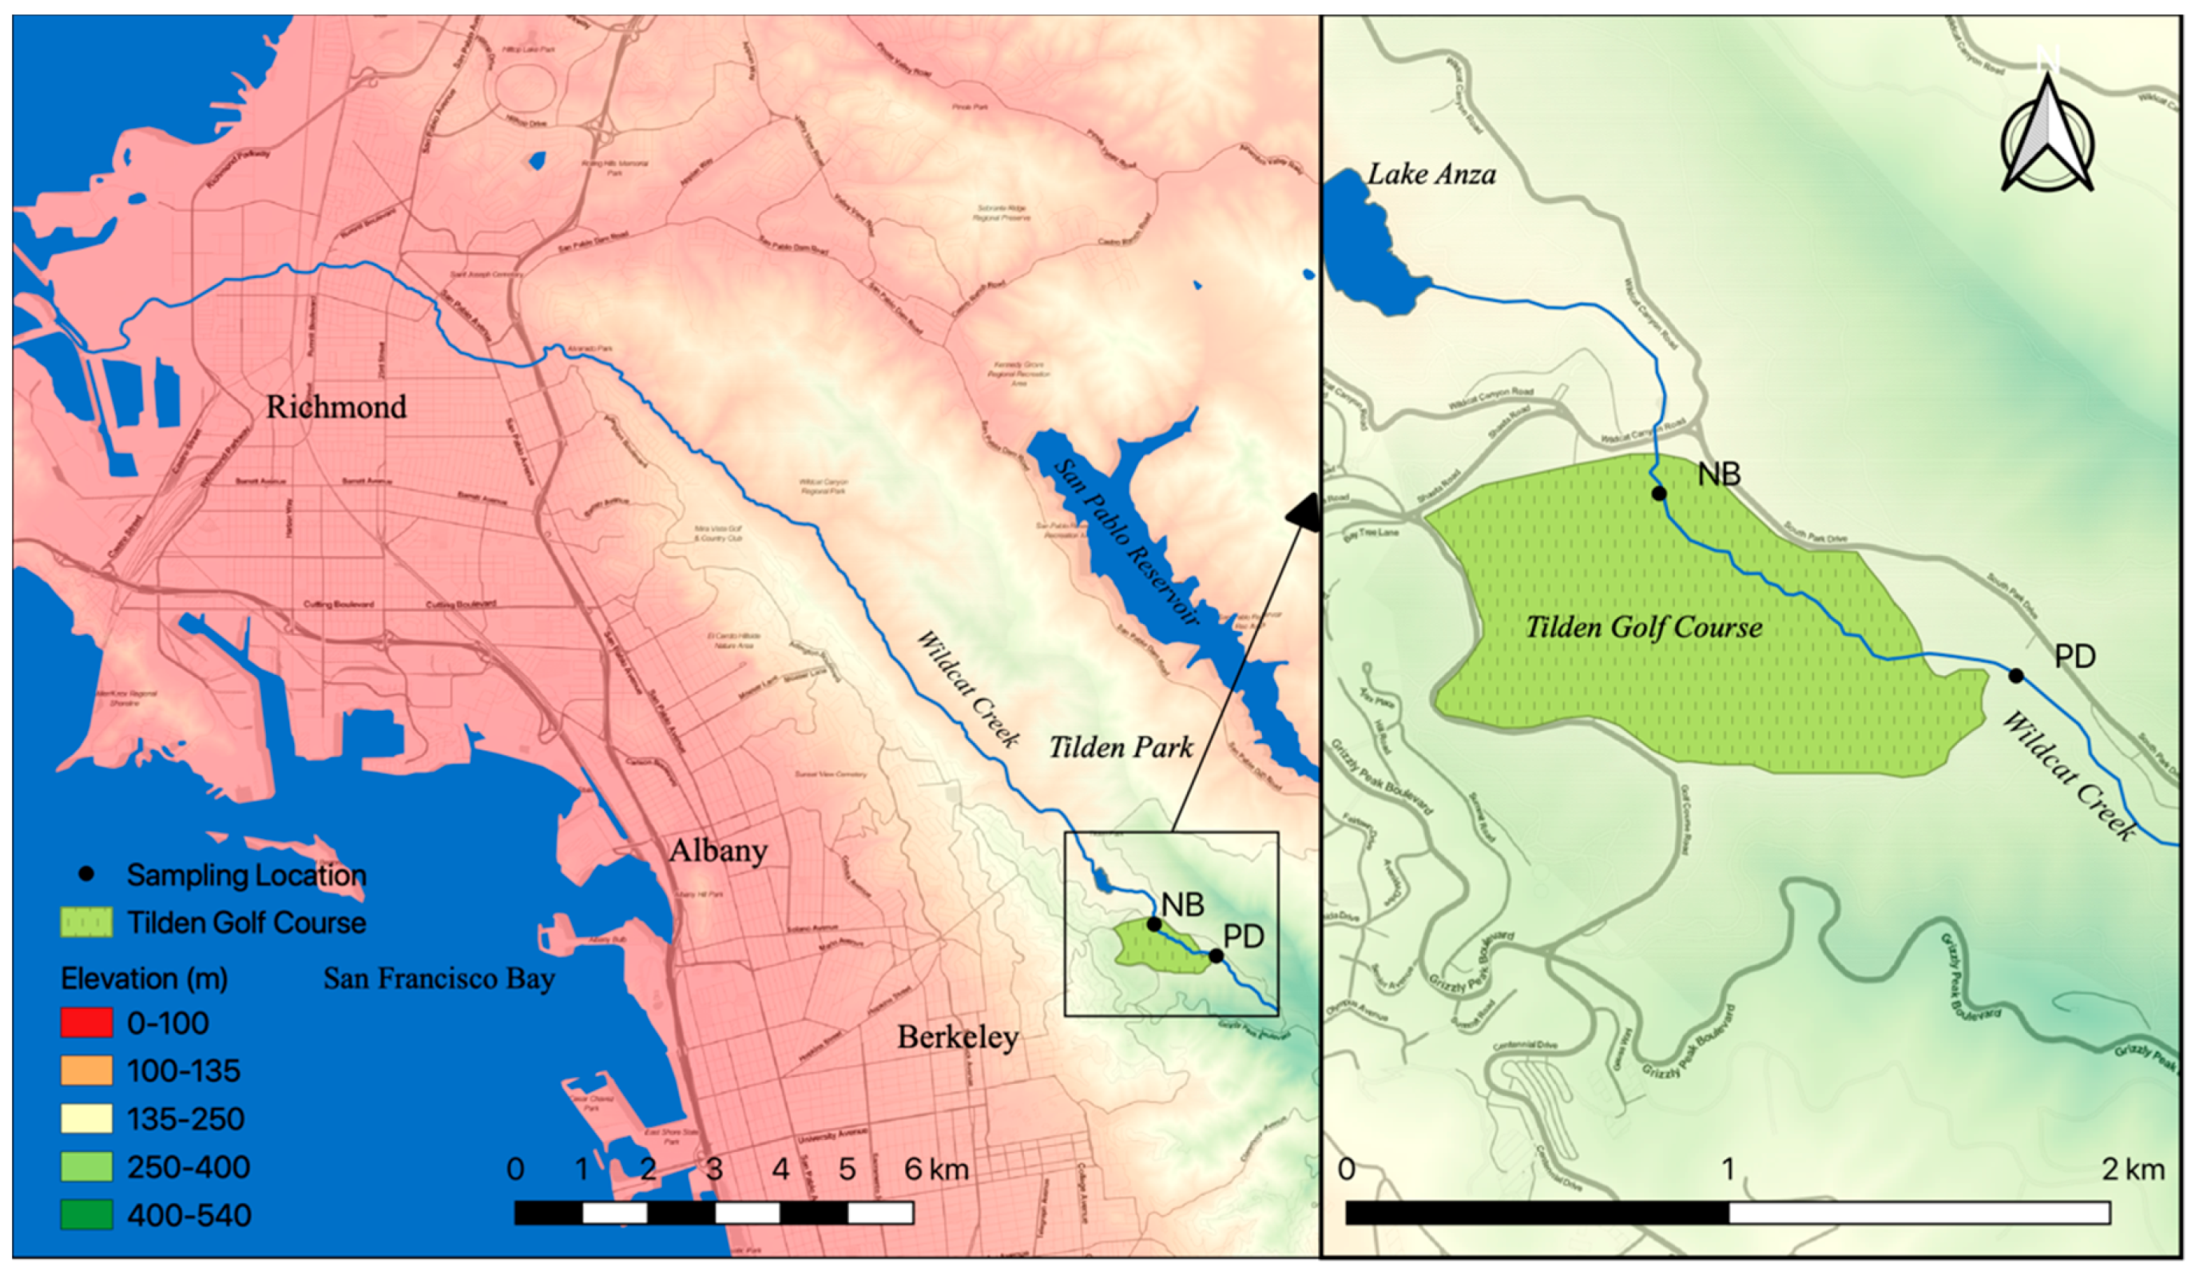
An increased occurrence of eutrophication and cyanobacteria in surface waters has led to the need for a greater understanding of potential sources of nutrient contributions to water resources [1]. Recent studies in the water bodies of the East Bay Regional Park District (EBRPD) [2] have focused on cyanobacteria blooms in Lake Temescal, Oakland, California; such blooms have also occurred in Lake Anza, Berkeley, California. The latter is part of the Wildcat Creek hydrologic system and downstream from the reach that is the subject of this research (Figure 1). The Wildcat Creek catchment has not been studied extensively, but is of great importance due to the diverse land use occurring within its perimeter. For instance, Tilden Golf Course (TGC), run by a private concessionaire, is an important recreational resource that is traversed by Wildcat Creek, a perennial stream that provides essential ecosystem services.
The goal of this research was to quantify nutrients, specifically nitrate and phosphate (NO3-N, and PO4-P), transport in storm-generated surface runoff and groundwater from TGC into Wildcat Creek, and to evaluate the effect of pesticides and fungicides applied on TGC to surface water quality. TGC became a certified Audubon Cooperative Sanctuary in 2013. This management certification incorporates land management goals that include chemical use reduction, water quality management and conservation, and habitat enhancement for wildlife [3]. Specific enhancements at TGC include conversion of fairways to naturalized roughs (no irrigation, fertilization or pesticides) adjacent to creek banks, reduction of chemical inputs and safer product choices, reduction of irrigation footprints, irrigation upgrades, sediment pond construction, riparian restoration and enhancements in downstream reaches. However, due to the frequent use of fertilizers and pesticides to maintain turf systems, golf courses can be contributors of water pollution [4,5], particularly, golf courses have been described to increase total phosphorous concentration in stream water [6]. Nitrogen and phosphorus are essential plant nutrients that are applied to golf courses, where they have been detected in leachate and surface runoff [1]. Surface water concentrations of phosphorus as low as 0.025 mg/L and nitrogen concentrations as low as 1 mg/L have been associated with increased algal growth [1,7]. Using these guidelines to control eutrophication, in 1986 the United States Environmental Protection Agency (EPA) established water quality criteria that limit total phosphorus concentration to 0.025 mg/L for lakes or reservoirs, 0.05 mg/L for streams draining into lakes or reservoirs [8]. Current recommended limits of total phosphorus (as P) concentration in lakes and reservoirs have been set for California and neighboring states (Ecoregion III) at 0.017 mg/L for most lakes and reservoirs [9]. Specific limits have also been listed by the EPA on California, ranging from 0.008 to 0.3 mg/L and 0.005 to 0.25 mg/L for specific lakes and streams, respectively, where most values are more stringent than 0.025 mg/L [10]. Phosphorus concentrations generally increase with increasing discharge and decrease with increasing event duration [11]; other studies have reported that transport of most of the phosphorus from agricultural areas to surface waters occurs during a few large runoff events [12], while another [7] found that most of the nutrient loading into surface water in urban environments comes from a small number of landscapes. The off-site transport of phosphorus in runoff from croplands tends to occur with soil particles, and the dissolved forms are more common in runoff from turf, because sediment loss is insignificant [7]. Shuman (2002) [13] observed that the mass of phosphorus in runoff from a golf course fairway turf was directly related to the fertilizer application rate, where the initial runoff event contained the highest concentration of transported phosphorus.
Mallin and Wheeler (2000) [14], in a study in North Carolina, found that the nitrate concentration in stream water increased while passing through golf courses. Nutrient concentrations in golf course ponds and nearby streams have been found to be higher than in other surrounding areas [15]. Alternatively, King et al. (2007) [4], formulated the hypothesis that nutrient losses in storm event runoff from a well-managed turfgrass golf course does not pose an environmental risk. Therefore, this research examines the possible contribution of nutrients to Wildcat Creek due to turf management of TGC and evaluates the total mass of nutrients transported by the creek for a significant storm event.
2. Materials and Methods
2.1. Site Description
Wildcat Creek is a perennial stream that bisects Tilden Golf Course (TGC), flows through Lake Anza and drains into northern San Francisco Bay, California. The subject of this study is the section of Wildcat Creek that intersects TGC upstream from Lake Anza (Figure 1). The area is characterized by a Mediterranean climate with the water year extending from late October to April. The average annual precipitation within the watershed is 720 mm [16] and the mean annual temperature is 14 °C [17]. Under these climatic conditions, perennial flow is sustained by groundwater.
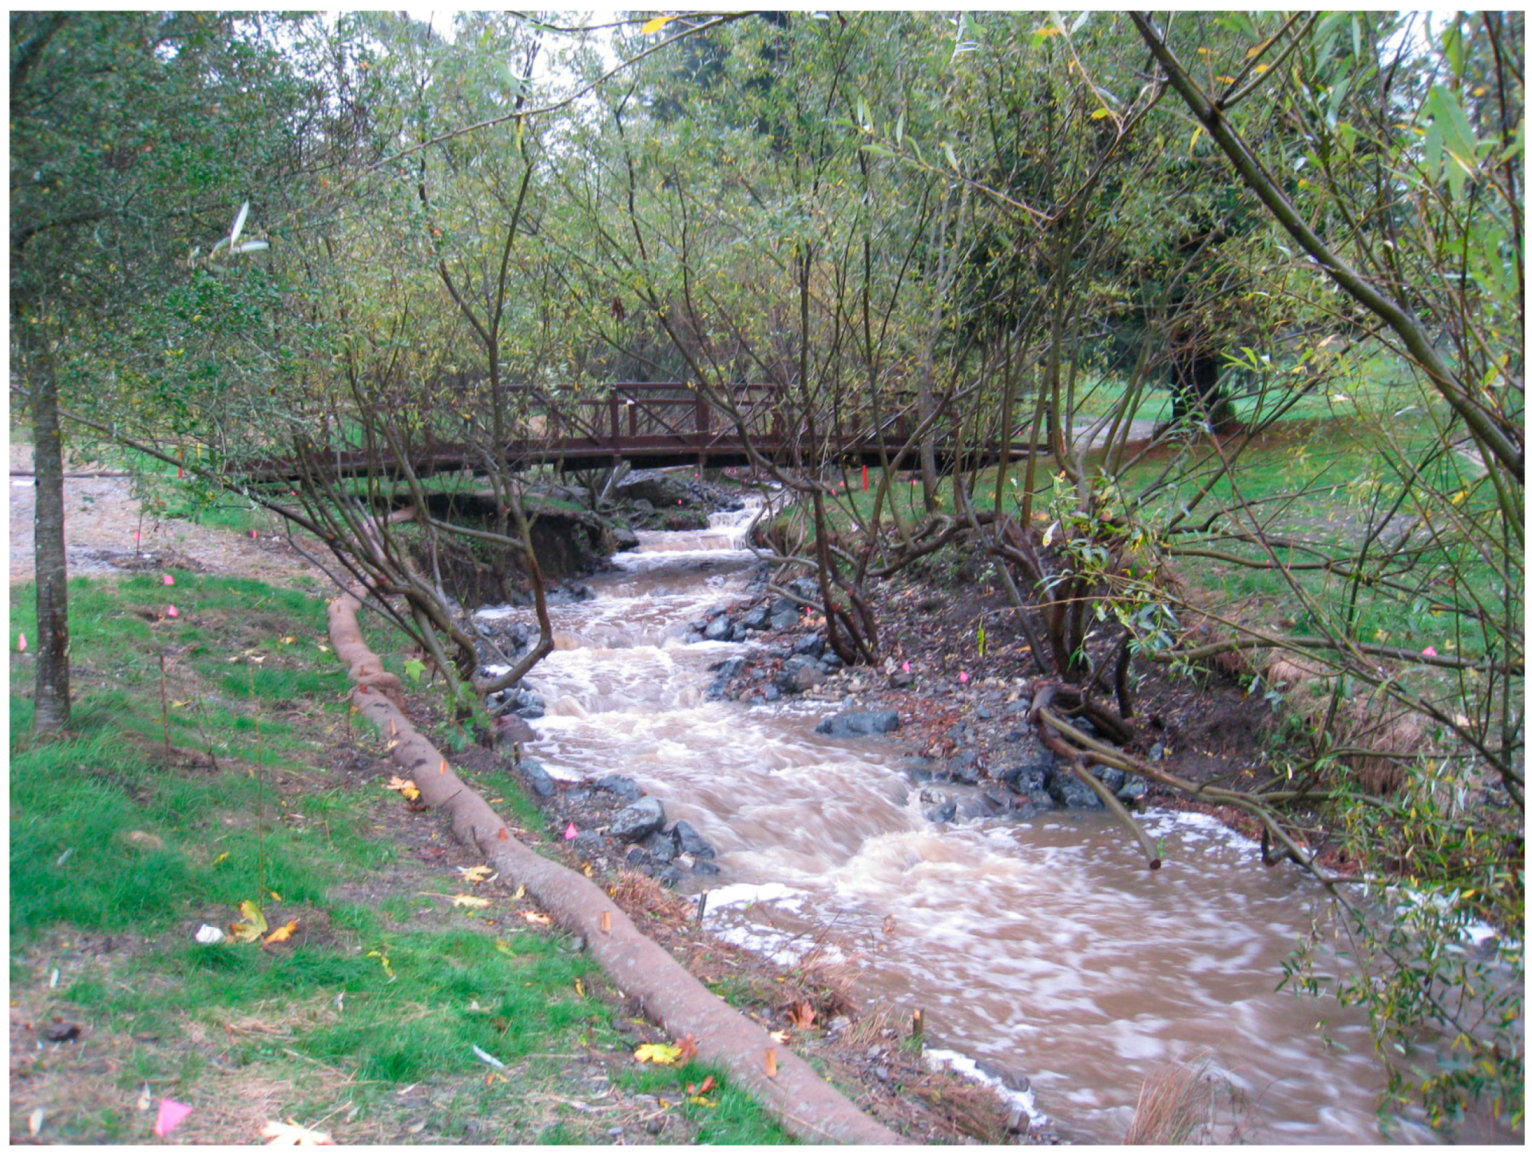
The Wildcat Creek upper watershed exhibits diverse land use (Figure 2) [18]. The catchment is exclusively within Tilden Regional Park; nevertheless, Figure 1 and Figure 2 show that the catchment is in close proximity to an urban area. In 2012, Landscape Architecture and Engineering, a consulting company contracted by the EBRPD, carried out a restoration project of Wildcat Creek within the golf course with the goal of enhancing habitat for fish and amphibians by way of a step and pool system [19]. The project consisted of building engineered in-stream steps to dissipate flow and create habitat for aquatic species, recontouring stream banks (Figure 3), and revegetation with native riparian plants [20]. Downstream of TGC, Wildcat Creek becomes channelized and concrete lined as it passes through the EBRPD botanical garden before reaching Lake Anza.
The Wildcat Creek Catchment is characterized by the presence of a syncline, the axis of which roughly delineates the course of Wildcat Creek [22], and which also likely controls groundwater flow. The limbs of the syncline dip at 35° and 67° to the south-west and north-east respectively [22]. These conditions make the watershed quite steep, with TGC being the only relatively flat topography of the area (Figure 1). This flattened topography was largely created through alteration for the development of the golf course. A summary of the catchment characteristics is listed in Table 1.
Fertilizers are applied on Tilden Golf Course by both spray techniques and dry, granular broadcast and include products with the following compounds: KNO3, FeSO4, MgSO4, and MnSO4. Pesticide products used on the golf course largely consist of fungicides and plant growth regulators, followed by herbicides. These include: Podium (EPA #100-937), Chipco Flo 26019 (EPA #432-888), Dorado (EPA #100-741), Proxy (EPA #432-1230). TGC has been compliant with the EBRPD policy of no phosphorous-based fertilizer and slow-release nitrogen use. KNO3 is applied periodically at an application rate decided by the superintendent, based on weather conditions, season and soil moister. The highest rates of application correspond to the summer months, where on average 100 pounds of KNO3 per month are applied. During winter, the rate of application is 50 pounds per month.
2.2. Data Collection and Analysis
Two locations were selected to collect water samples during this study (Figure 1). North Bridge, located at the outlet of TGC, and Padre, a reference site located upstream and outside of the influence of TGC. Samples were collected at both locations during baseflow (Summer and Fall) and during storm events in 2017 and 2018. Stream samples collected during baseflow were collected as individual grab samples. One sample of imported irrigation water was also collected and analyzed for nutrient content. Irrigation water for TGC has an imported source, East Bay Municipal Utility District (EBMUD) supplies all water available for the park for public use and irrigation. This water source comes from a high elevation reservoir in the Sierra Nevada Mountains. In addition, EBMUD water is isotopically light with respect to stable isotopes of the water molecule of local water, has low-dissolved solids and is disinfected with chloramine.
During precipitation events, stream samples were collected using a Teledyne ISCO automatic water sampler programmed to collect samples at specified time intervals. The ISCO was deployed at NB and the sampling intervals were determined based on the intensity and duration of the storm events. All anions, including NO3-N and PO4-P, analyses were carried out by Standard Method EPA 300.1, which employs ion chromatography, at the California state certified EBMUD water laboratory in Oakland, California. Pesticides and fungicides were analyzed by isotope dilution gas chromatography-mass spectrometry, after Cassada et al. (1994) [23] and by liquid chromatography/mass spectrometry, after Magalhaes et al. (2009) [24] at the Water Science Laboratory, University of Nebraska Lincoln. A total of 20 different pesticides were analyzed, including: Azoxystrobin, Thiacloprid, Thiamethoxam, Trifloxystrobin, Acetochlor, Alachlor, Atrazine, Chlorothalonil, DEA, DIA, Dimethenamid, EPTC, Metolachlor, Pendamethalin, Permethrin, Propachlor, Propazine, Simazine, Tefluthrin, Trifluralin.
Stable isotopes of water samples (δ2H and δ18O) were analyzed by Cavity Ring Down Spectrometry with a Los Gatos Research liquid water stable isotope analyzer. Chloride, used as a tracer for hydrograph separation, was modeled for some stream water samples based on the linear relationship (R2 = 0.9895) between measured chloride and electrical conductivity (view Supplementary Figure S1, scatter plot and linear regression of Cl vs Conductivity).
Spearman’s rank-order correlations were used to assess the relationship between the different solutes studied, including the association between stream discharge and nutrient concentrations. Hypothesis tests (t-test) were studied to determine the statistical significance of the differences observed on nutrient concentrations upstream and at the golf course. The cutoff for statistical significance (alpha) on our study was 0.05, all the statistical analyses were run using the functions available in base R (Vienna, Austria) [25].
3. Results and Discussion
3.1. Hydrograph Separation
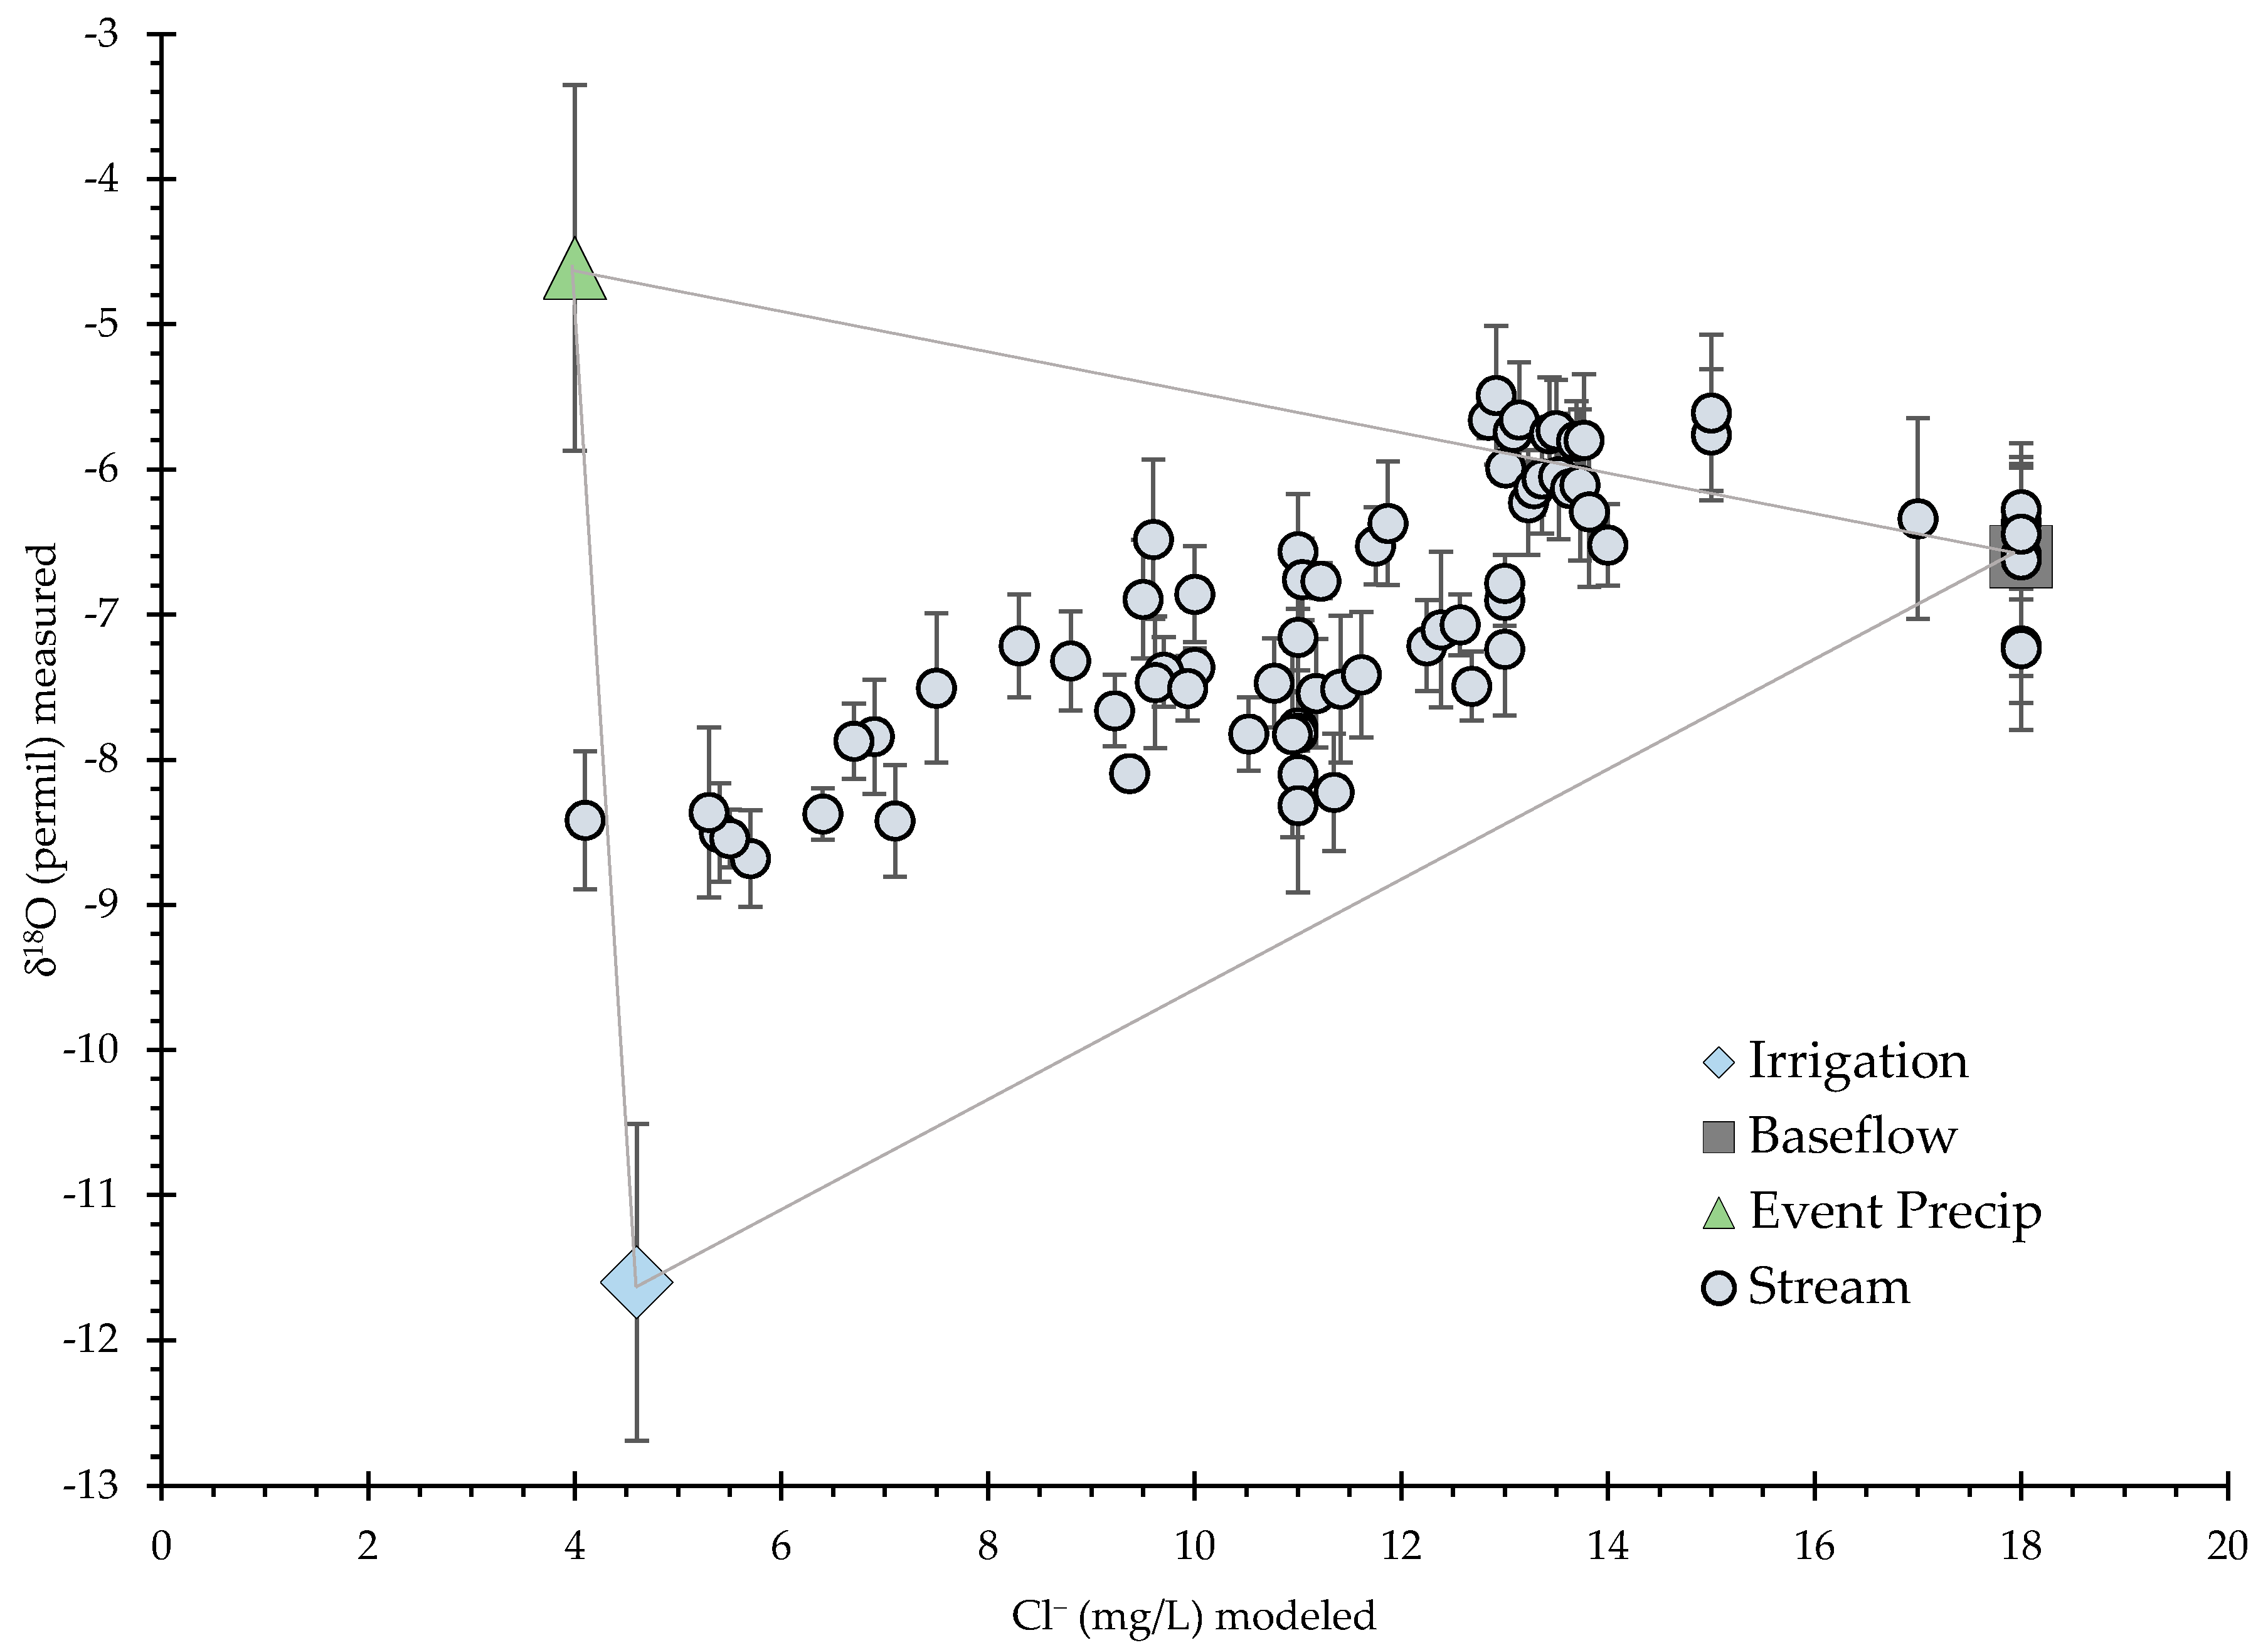
Storm hydrograph components were quantified using geochemical tracers (δ18O and chloride), and three end-member mixing analysis was carried out using data collected by the ISCO sampler at North Bridge. Examination of stable isotopes of stream water samples at this location revealed a surprisingly large fraction of isotopically light irrigation water entering the stream at the golf course, even during precipitation events. Figure 4 shows the δ18O and chloride values for the three end-members, and stream samples, for one of the runoff events analyzed during this study. All of the stream water samples plot inside the mixing triangle, supporting the notion that stream water is a mixture of three sources of water in the stream (Baseflow/Groundwater, Event Precipitation water and Irrigation Water), the proportions of which vary over the event. The samples plotted in Figure 4 were collected at 1.5-hour intervals during the first 24 hours and at 2-hour intervals for the remaining 96 hours of the precipitation-runoff event.
This sizable input of irrigation water to the stream is illustrated in Figure 5, which shows three-component mixing during the storm hydrograph for the precipitation event showed in Figure 4.
Figure 5 shows that as the rainfall intensity increases (see Figure 6 for the event hyetograph), there is an increase in the amount of irrigation water entering the stream. We hypothesize that irrigation water accumulates in the vadose zone during dry periods, and when there is a precipitation event, the irrigation water (pre-event water) is pushed out into the stream by the new event water that is infiltrating into the subsurface. The figure also illustrates that after the event nearly all of the irrigation water has been flushed out of the system and there is a two end-member mixture of “new” precipitation water and “old” baseflow/pre-event water. An analogous storm hydrograph, with similar component fractions, was observed for another runoff event, illustrating the importance of pre-event water, which includes a significant fraction of irrigation water, to stream flow generation in Wildcat Creek during runoff events (see Supplementary Figures S2–S4 for the storm hyetograph, graph of three end-member mixing and the hydrograph separation, respectively, for a precipitation event studied on April 5th to the 9th, 2018).
3.2. Nutrient Concentrations in Wildcat Creek
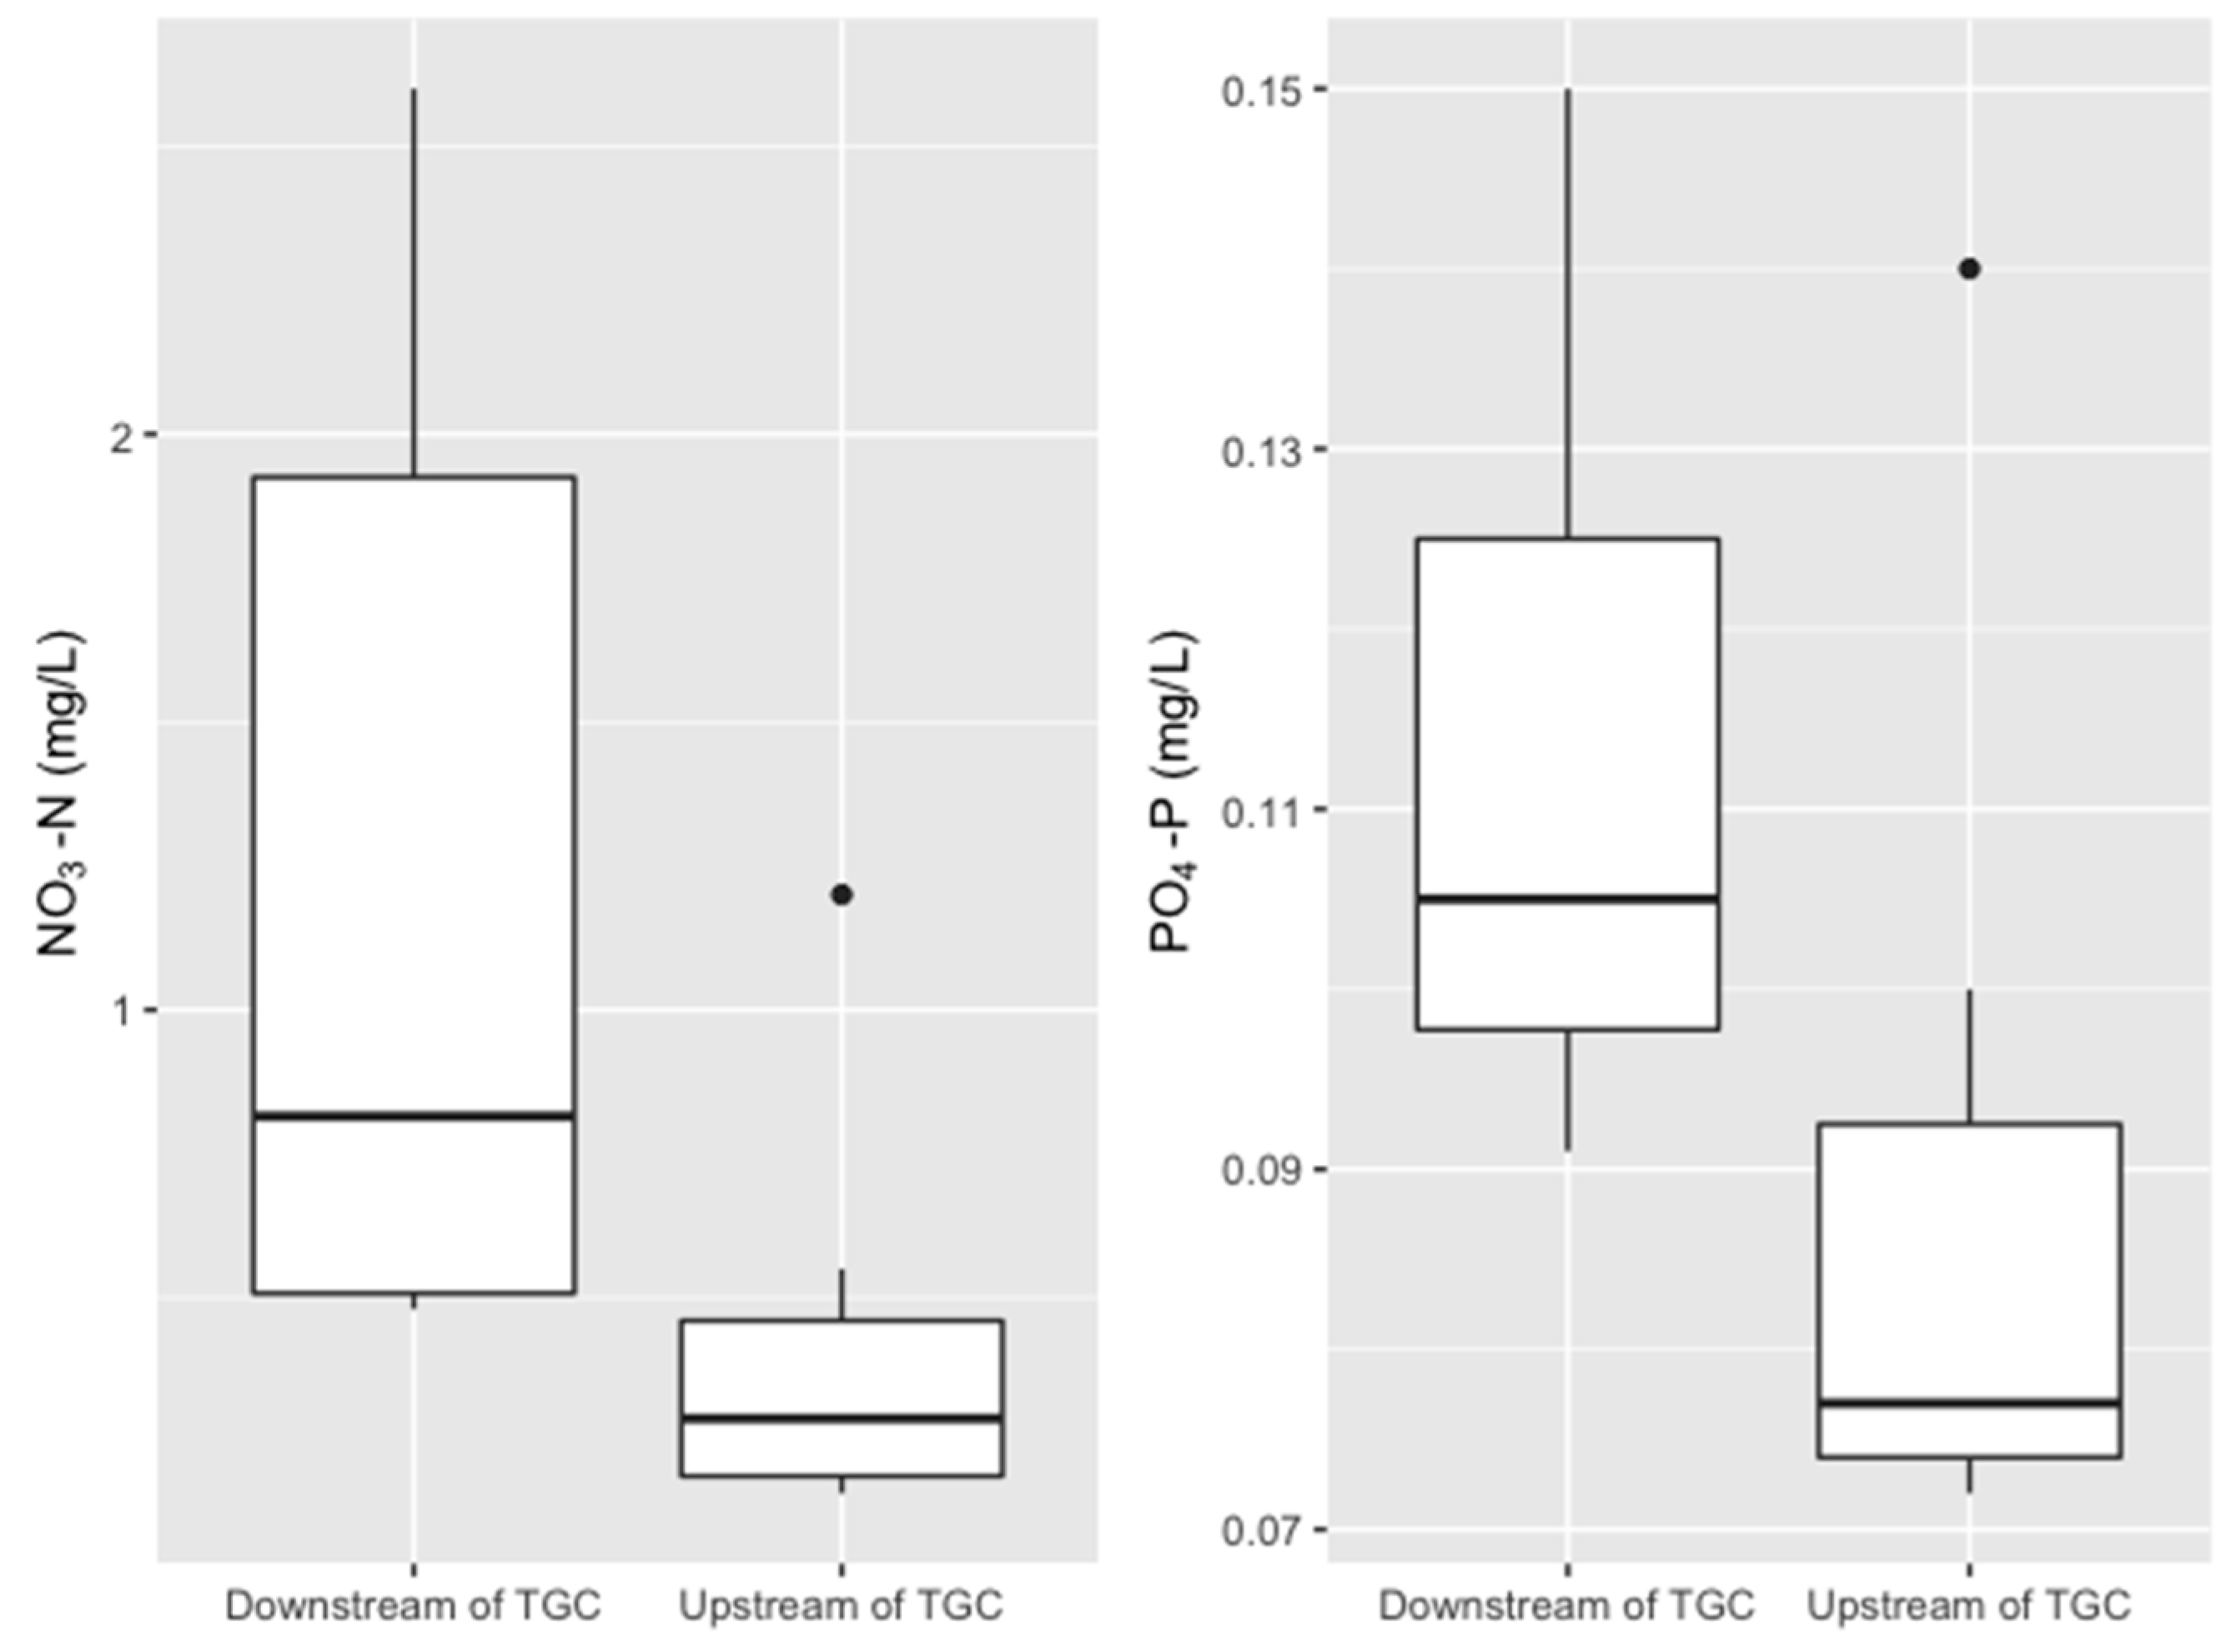
Nutrient samples collected upstream and at the outlet of the golf course during baseflow showed an increase in nutrient concentrations for both NO3-N and PO4-P at the downstream location (Figure 7). Paired t-test analysis, carried out for samples collected on the same day upstream and downstream of TGC were t (4) = 2.79, p = 0.049 for NO3-N and t (4) = 3.87, p = 0.018 for PO4-P. With mean differences of 0.9 mg/L and 0.04 mg/L for NO3-N and PO4-P, respectively. The observed p-values were less than the alpha level of 0.05, indicating that the increase in nutrients concentration at the golf course was statistically significant. NO3-N concentrations observed at North Bridge at times exceeded the 1 mg/L concentration that the EPA [8] recommends as a maximum to avoid eutrophication for a stream draining into a lake. PO4-P concentrations measured in the stream always exceeded the 0.05 mg/L maximum values of PO4-P considered protective for aquatic ecosystems [8]. These results indicate that although there is an increase of PO4-P concentration downstream of TGC, even under natural conditions (at Padre), the system is naturally rich in PO4, supporting eutrophication.
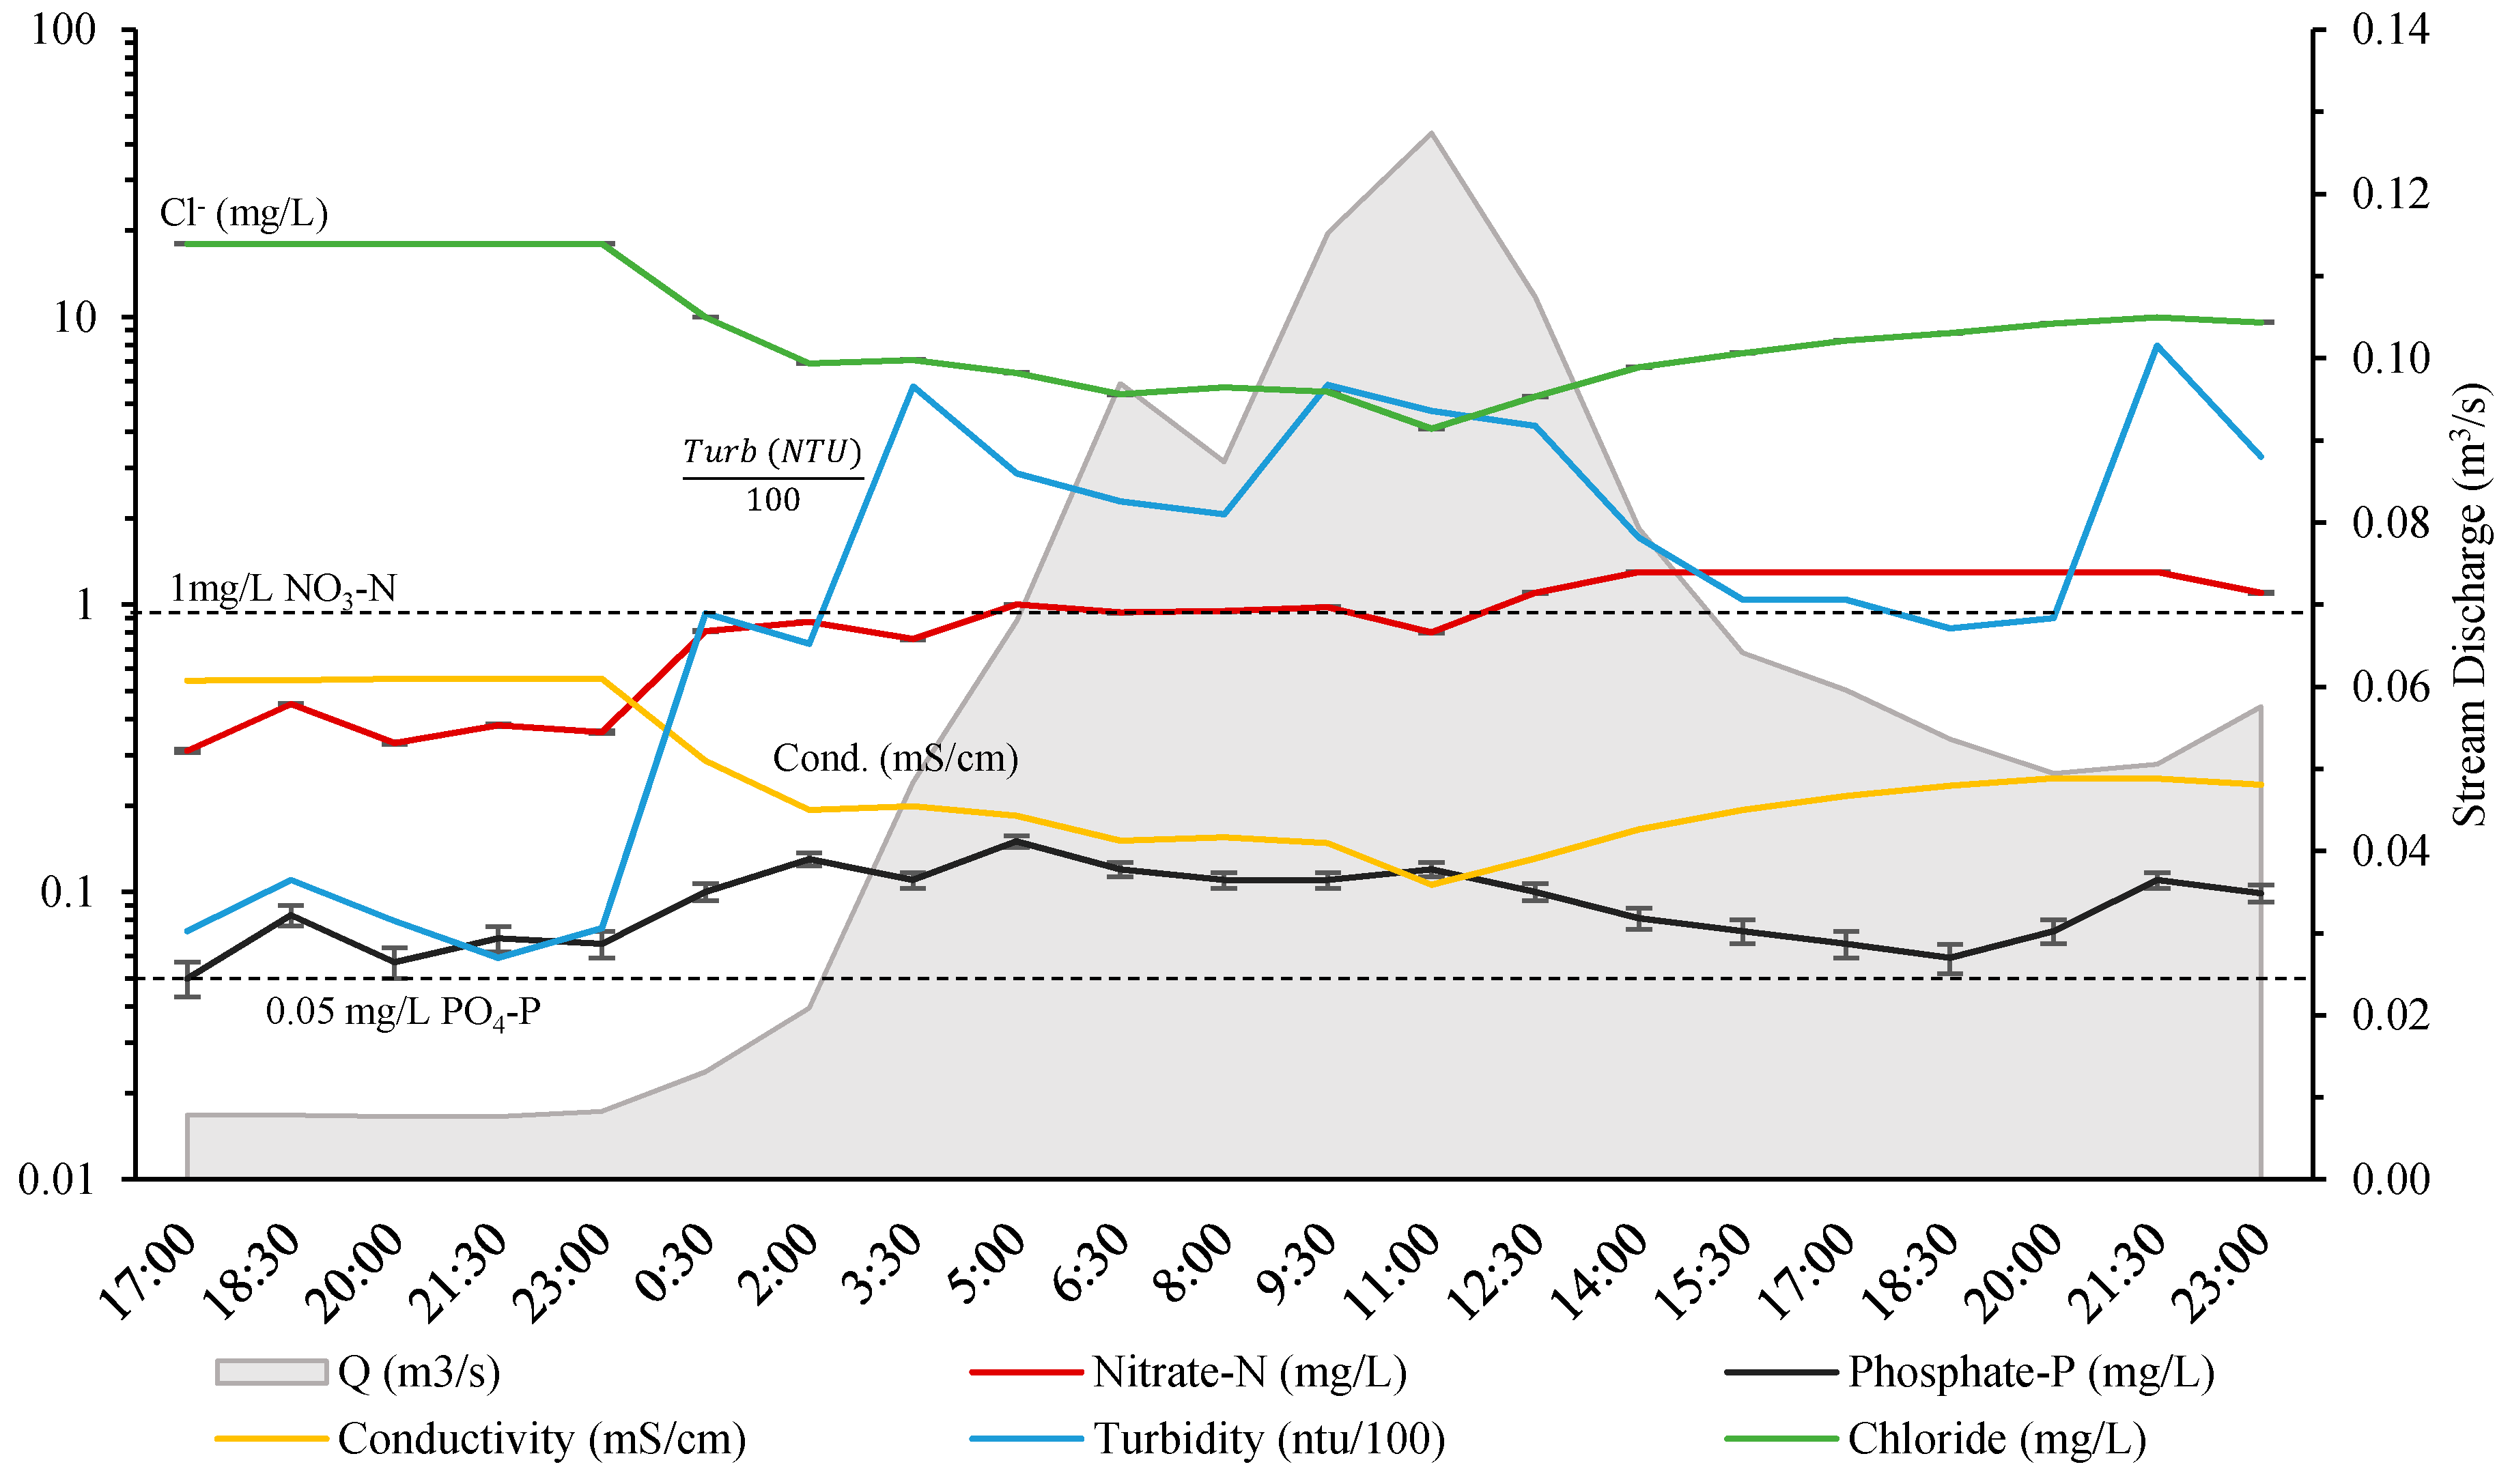
The effects of the golf course on Wildcat Creek during runoff events were considered using time series data from the ISCO sampler. Figure 8 illustrates the results obtained for one of the precipitation events studied (66.5 mm [26]) on February 28th, 2018. Samples were collected at 1.5-hour intervals.
Figure 8 shows an increase in the nutrient concentrations with increase in stream discharge. NO3-N concentrations were below 1 mg/L at the beginning of the event but exceeded that value as the precipitation event advanced. This result contrasts with results from most studies on rainfall-runoff relationships [27,28], where NO3-N concentrations in streams decrease by dilution during precipitation events. In Wildcat Creek, NO3-N increased with rainfall intensity, likely because the golf course is a source of readily soluble NO3-N. This is further evidenced by the fact that conservative chloride and electrical conductivity decreased with increasing discharge (Figure 8), showing a typical dilution pattern. NO3-N, a soluble anion, is expected to behave similarly to chloride and decrease in concentration in a natural system with no anthropogenic inputs. The relationship between chloride and stream discharge during the precipitation event (shown in Figure 8) was examined using a Spearman’s rank order correlation, yielding a correlation coefficient (ρ) of −0.92 and a p-value < 0.001, illustrating the strong, negative correlation between this solute and stream discharge. NO3-N, however, increased, while chloride decreased. For the same event, the Spearman’s correlation coefficient between NO3-N and flow rate is 0.54 with a p-value of 0.01; revealing the presence of an additional source of NO3-N into Wildcat Creek. The observed concentrations of NO3-N in the stream during precipitation events are likely lessened by the periodic addition of irrigation water (with very low NO3-N concentration) to the stream, and possibly by denitrification in turf soils that may become anaerobic during intense precipitation. All the runoff events analyzed during this study yielded similar patterns of increased NO3-N with increased runoff as illustrated in Figure 8.
PO4-P concentrations in Figure 8 exceed the 0.05 mg/L limit throughout the event, with concentration values increasing as stream discharge increases; confirmed by the Spearman’s rank-order correlation between these two variables, yielding ρ = 0.45 and a p-value of 0.01. Similar observations were reported in the literature [29,30], and are explained by the fact that PO4 is associated with particulate matter. Figure 8 also illustrates the close association of PO4 with turbidity (ρ = 0.67 and a p-value < 0.001), showing a strong relationship between the two parameters.
During a precipitation events, samples were collected upstream and at the golf course, before and soon after the precipitation event. The results showed an increase in nutrient concentration in the stream after the events at both locations (Table 2). These findings are common for PO4 due to the strong association of PO4 with stream turbidity. PO4-P concentrations always exceeded the allowed limit, even at Padre, likely due to a decomposition of organic matter, or a lithologic or sedimentary source of this solute within the watershed. Similar observations have been made in an adjacent catchment [2], where excess phosphorous was attributed, in part, to the erosion of apatite-rich geologic formations. Our results, however, showed an increase in PO4-P concentration at the golf course with respect to the upstream reference location, revealing that although the system naturally has excess PO4, the effects of land use (e.g., removal of natural vegetation during construction of the golf course), favoring runoff over infiltration, could have an influence on turbidity, and therefore, potentially, on elevated values of PO4-P levels in Wildcat Creek.
Concentrations of NO3-N were also observed to increase during the precipitation event sampled at Padre, the upstream reference site, exceeding the 1 mg/L limit (Table 2). Nonetheless, as shown in Table 2, potassium was observed to increase at a much higher rate at North Bridge than at Padre (65% and 305% increase at Padre and North Bridge, respectively), while sodium did not change considerably before and after the runoff event (12% and 15% decrease at Padre and North Bridge respectively), indicating that potassium nitrate (KNO3), a fertilizer used on the golf course, is a likely source of NO3 to the stream.
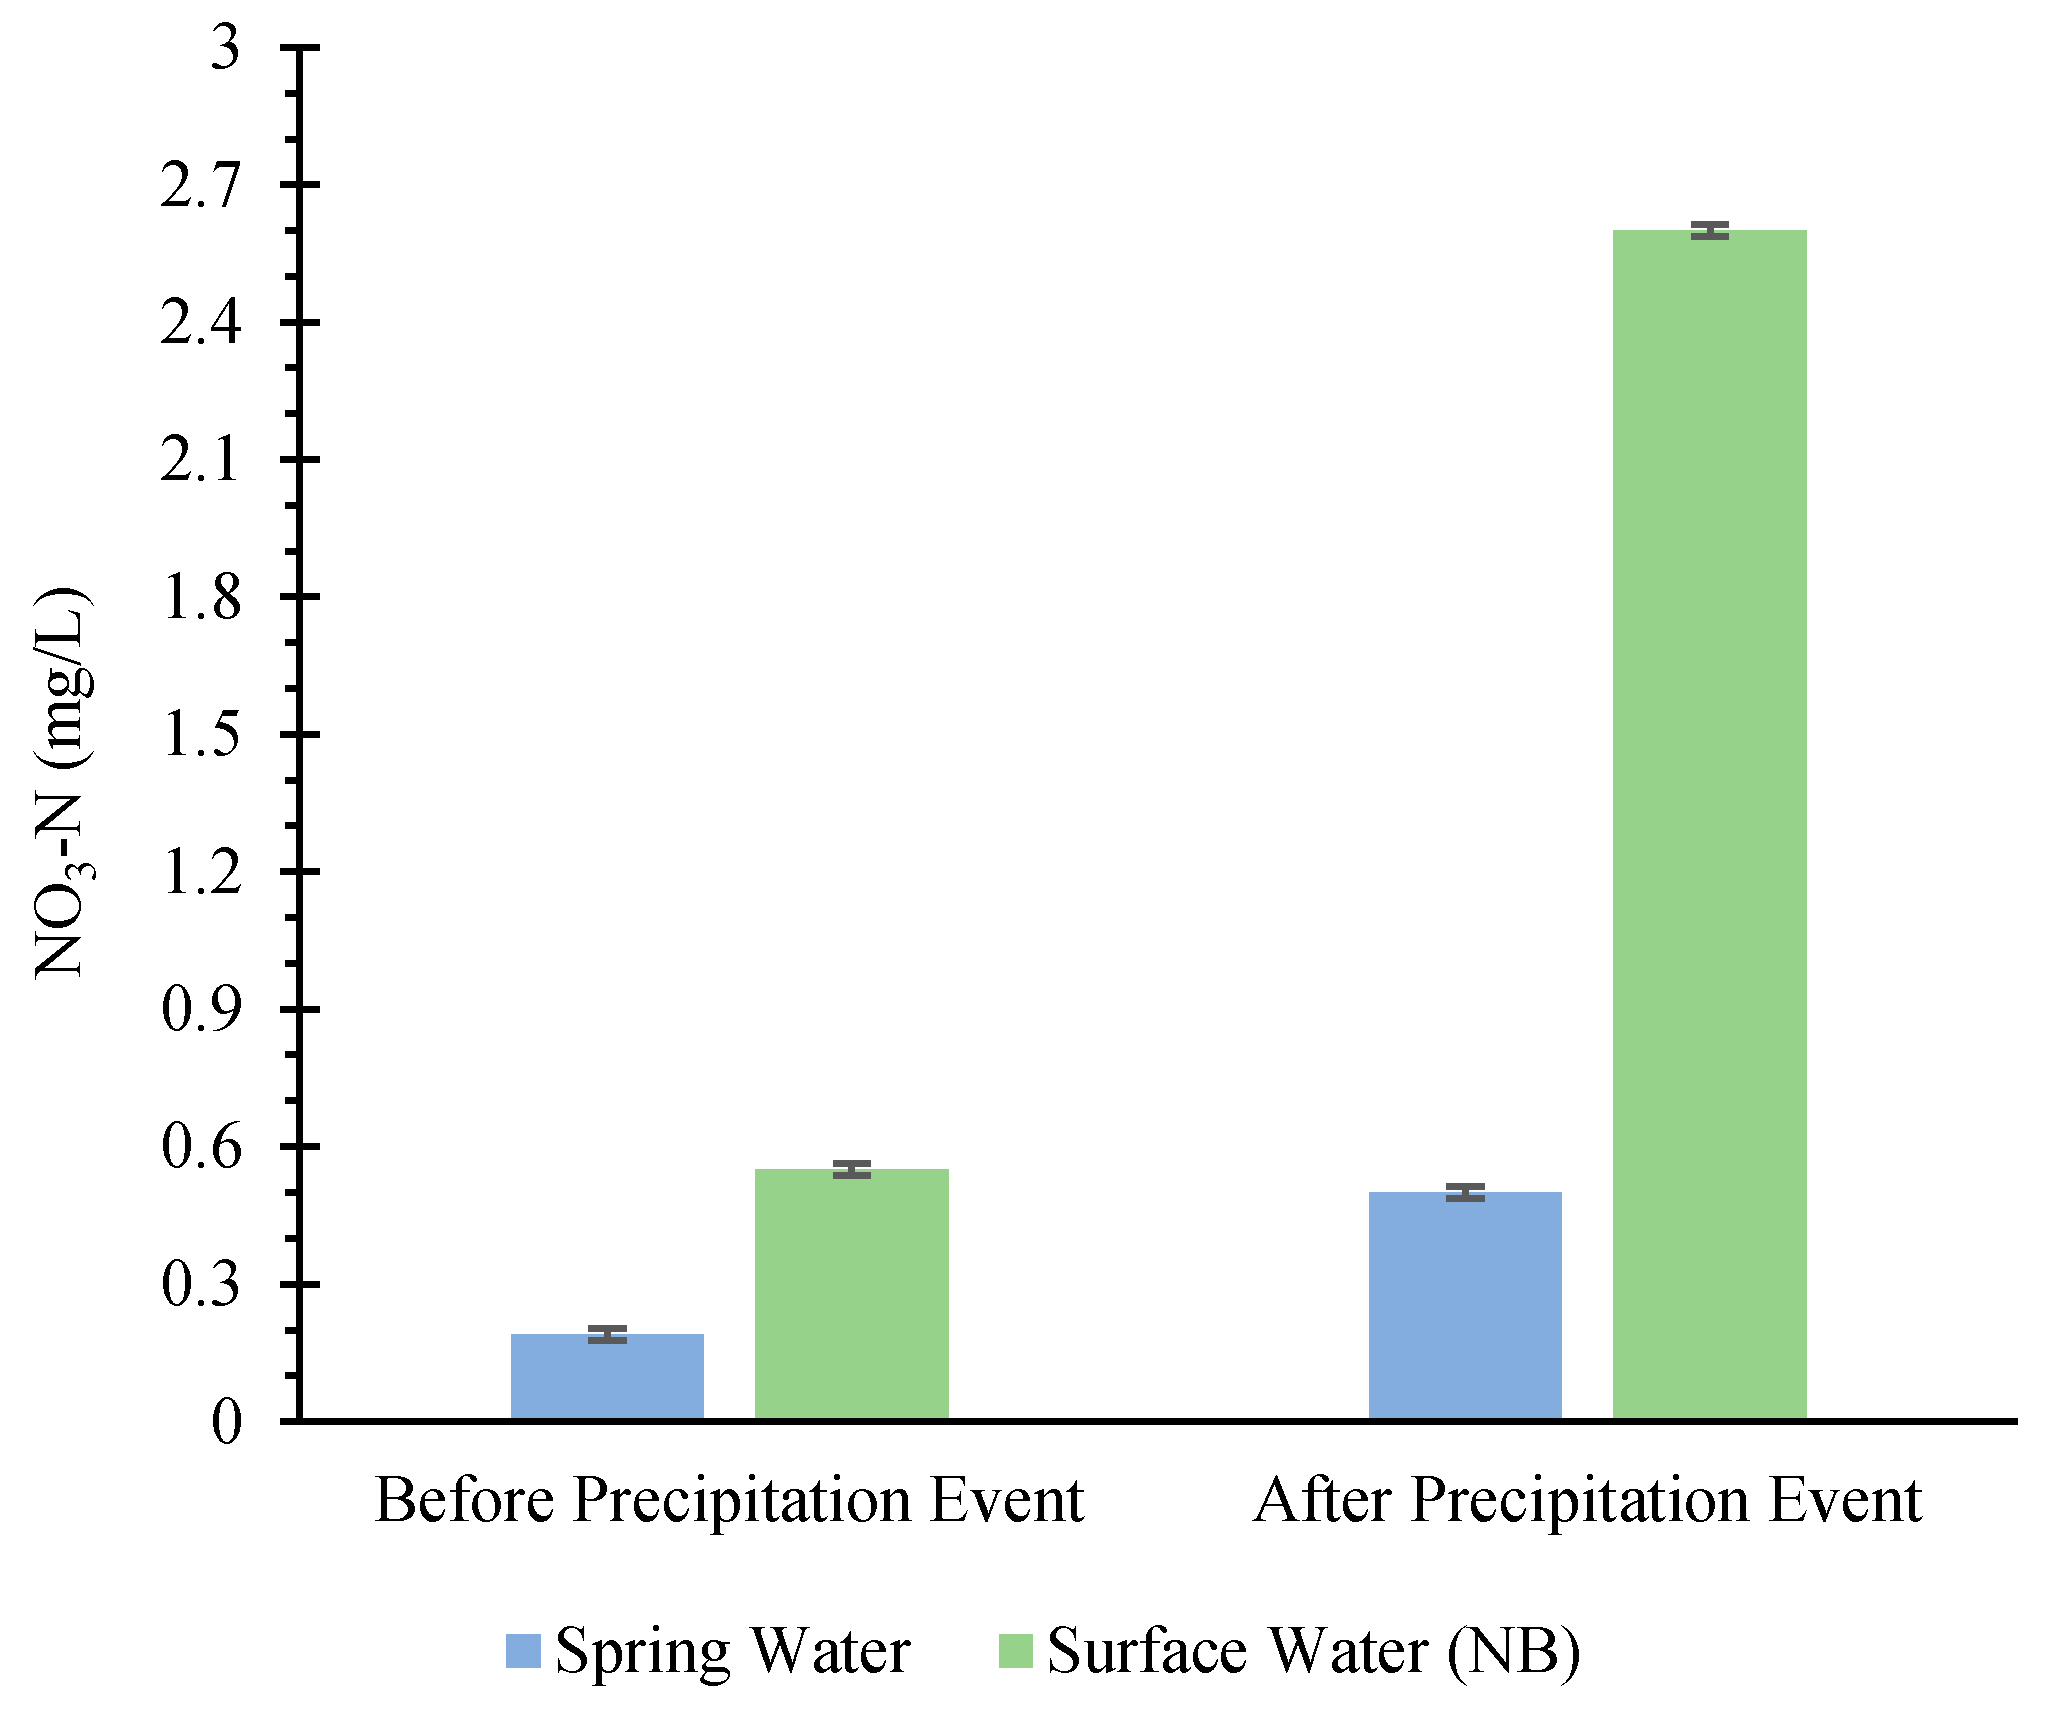
Additional NO3 sampling in a spring upstream of TGC also showed a slight increase in NO3-N concentration after a rain event studied (Figure 9), suggesting a natural source of NO3. However, the increase in NO3-N at this spring was substantially damped with respect to the golf course increase (190% and 420% increase upstream and at the golf course, respectively, for a precipitation event studied). This indicates that, although natural sources of NO3 are present in the basin (runoff from leaf litter/forested land, atmospheric), the golf course supplies an additional source of NO3-N to Wildcat Creek that raises inputs above recommended levels.
3.3. Concentration Discharge Analysis
Concentration-discharge (C-Q) graphs were analyzed for two precipitation events to examine the transport of nutrients during runoff events. C-Q relationships can reveal hydrochemical processes occurring in the stream, and therefore aid in determining the origin and fate of nutrients in surface water [29]. This relationship usually describes a hysteresis loop, especially during large discharge events, with scouring that mobilizes nutrients [31]. Hysteresis loops have been observed between discharge and many water quality parameters, including NO3 and PO4 [28,31]. C-Q hysteresis loop direction is controlled by changes in stream discharge and temperature, while the magnitude is controlled by antecedent rainfall [31]. The slope and direction of the loop provide information on flow pathways and dominant sources during runoff events. Clockwise rotational direction typically occurs when higher concentrations are observed on the rising limb of the hyetograph compared to the falling limb, indicating flushing of nutrients from near sources [29]. Counterclockwise directional rotation commonly occurs in the presence of delayed solutes from deeper subsurface zones or distant tributaries [31]. Positive slopes represent solute flushing, while negative slopes indicate solute dilution [32]. Both events analyzed showed similar patterns in the slope and rotation direction.
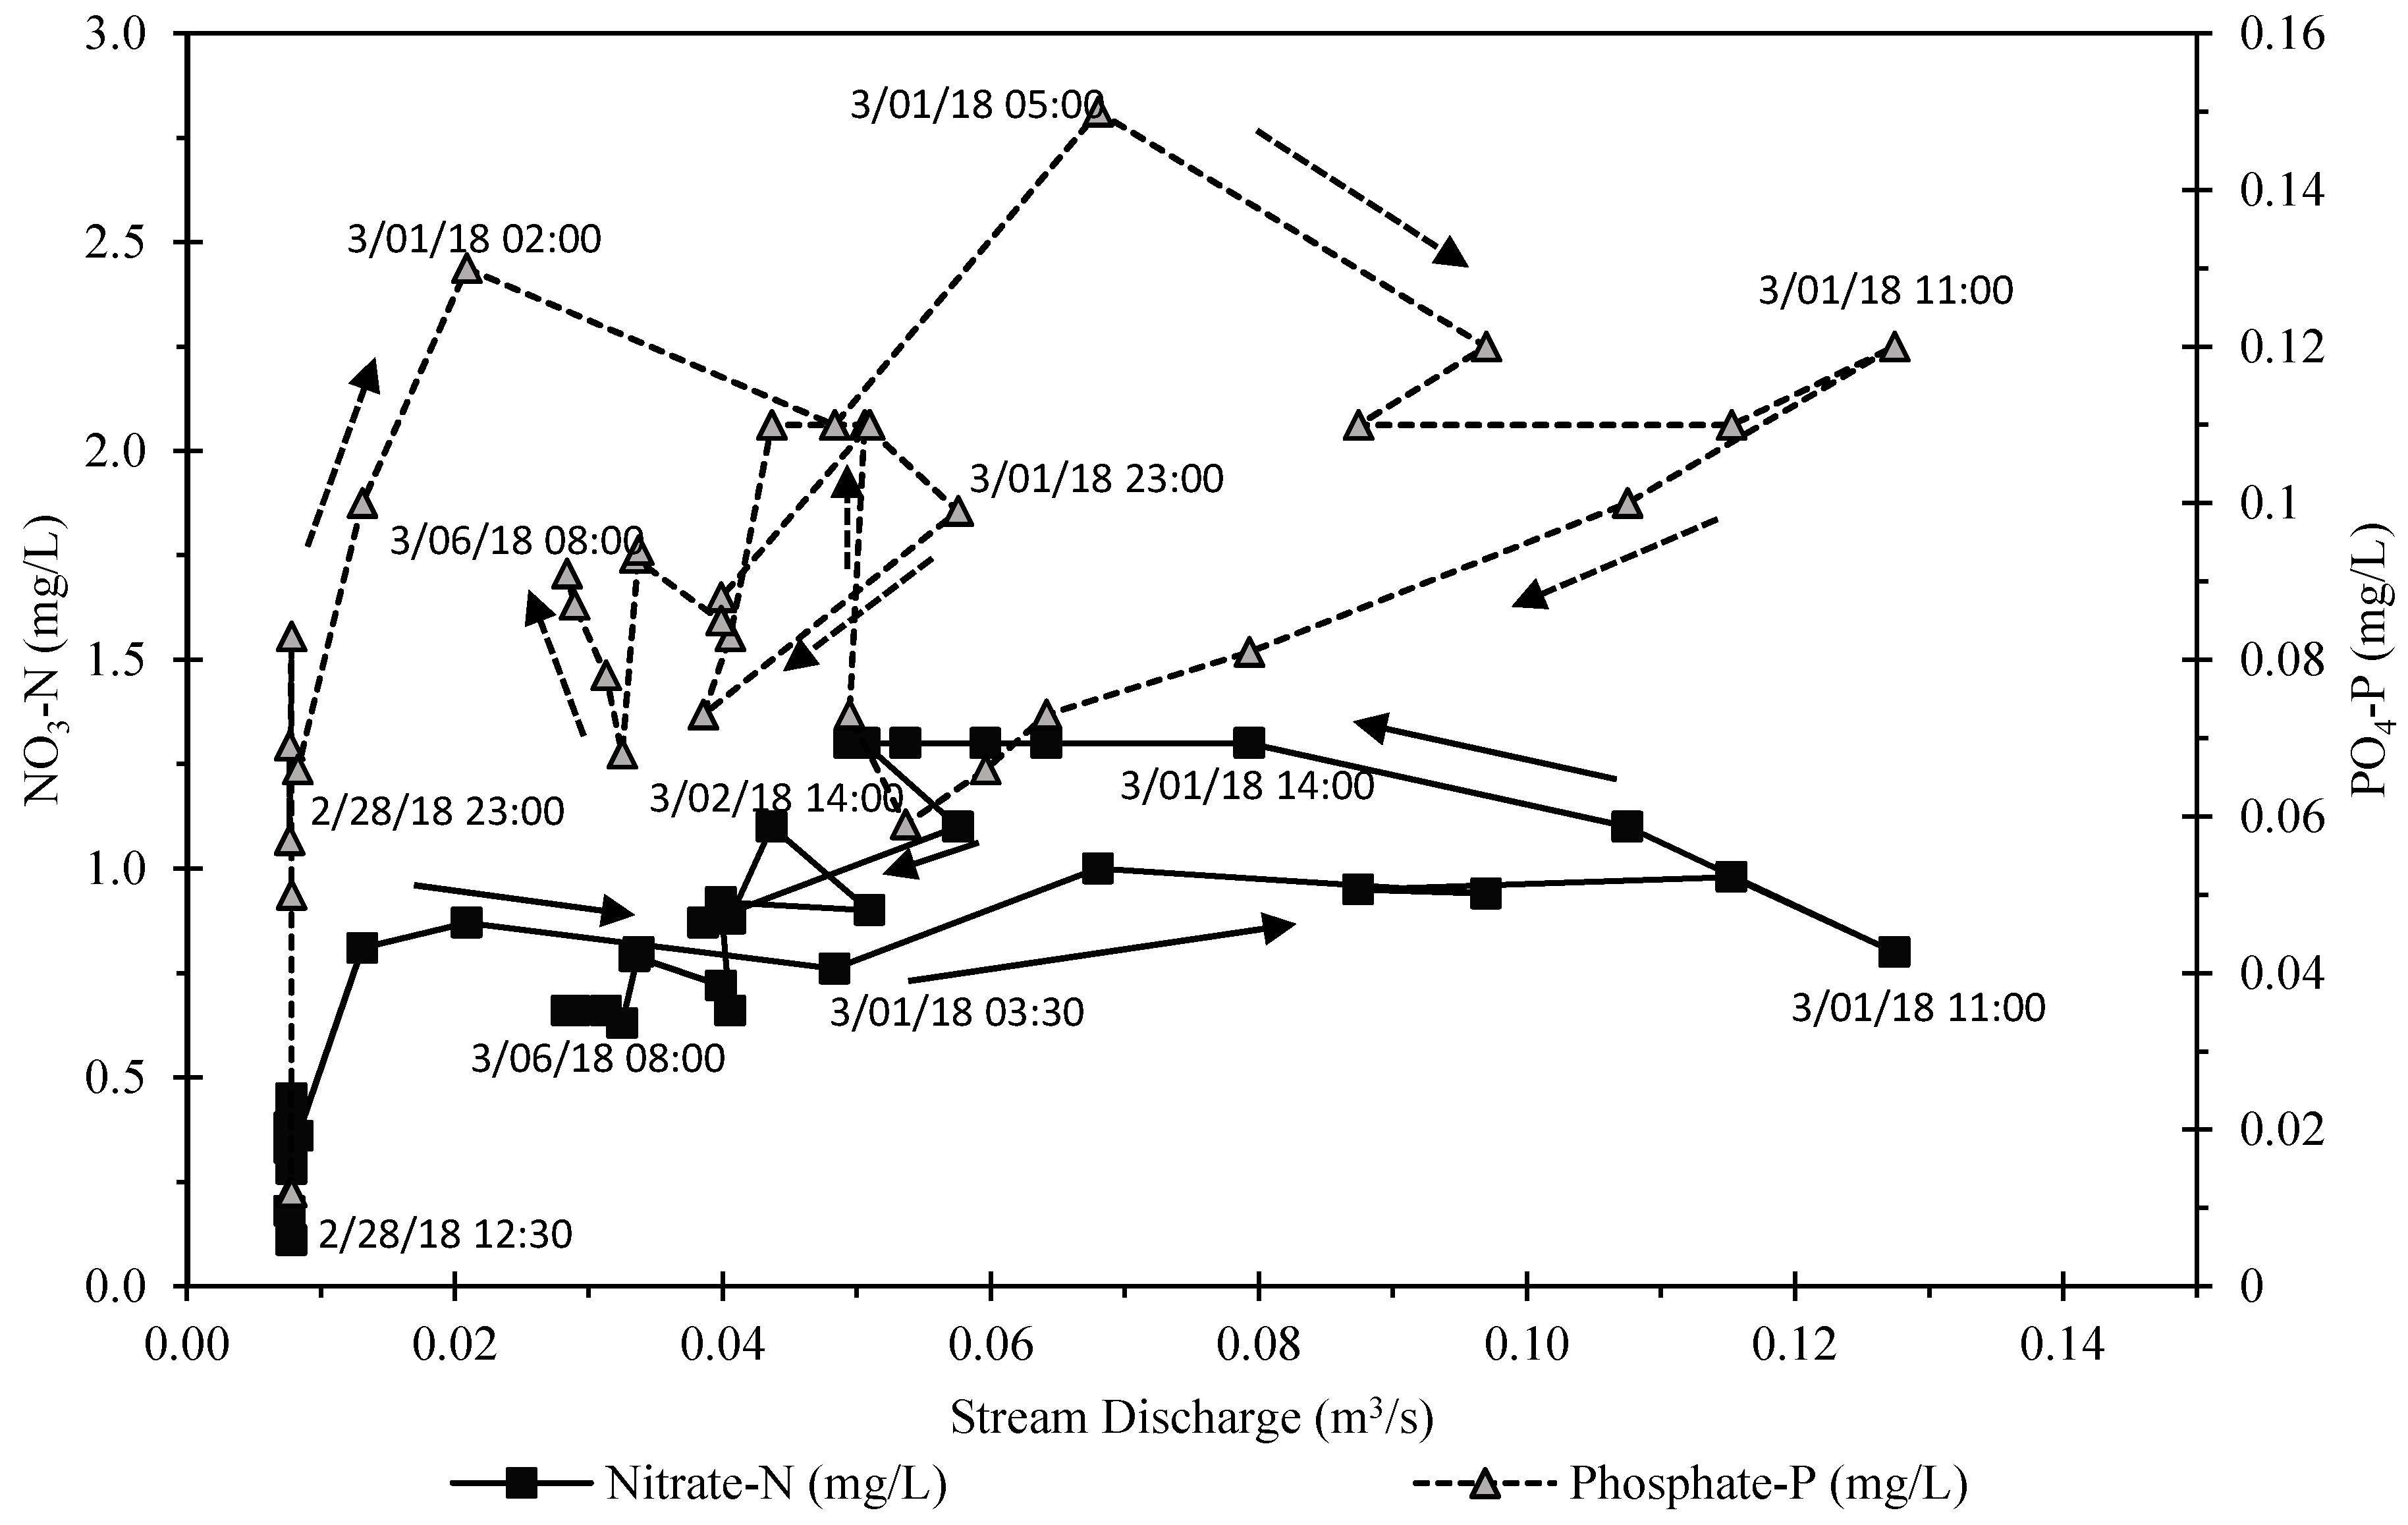
Figure 10 shows the C-Q relationship for the same runoff event as shown in Figure 8. The graph illustrates a complex hysteresis loop and figure-eight pattern, as described by Lloyd at al. (2016) [28]. These complex loops are produced by a change in the form of the relationship between discharge and suspended sediment concentration during the precipitation event. Interestingly, at the end of the event, the concentrations of both NO3-N and PO4-P are higher than their initial concentrations even though the last sample plotted was collected 40 hours after the precipitation event, highlighting the hysteresis process.
The NO3-N loop has a positive slope (lower left to top right), which translates as flushing of NO3-N to the stream during the event. The NO3-N C-Q loop follows a counterclockwise direction, indicating a delayed arrival of this solute, likely entering the stream dissolved in pre-event water. These findings agree with results obtained by Aguilera and Melack (2018) [29] in their research on streams in coastal California, where NO3-N enrichment/flushing with anticlockwise direction was observed on undeveloped sites.
PO4-P values followed a complex hysteresis loop, with a clockwise direction and the PO4-P peak occurring early in the runoff event, which is evidence for quick flushing of particulate matter that is exhausted by the end of the precipitation event. Of note is the fact that the PO4-P concentration at the beginning of the event was below the 0.05 mg/L limit but later surpassed that value and stayed above it after the event, from February 28th at 12:30 PM until March 6th at 8:00 AM, 139.5 hours. The hysteresis loop for PO4 differs from C-Q graphs described by Lloyd et al. (2016) [28], where 35 out of 41 analyzed runoff events exhibit anti-clockwise behavior for PO4. The clockwise loop shown in Figure 10 may be related to a source of PO4 close to the stream, such as particulate phosphorous from golf course runoff, because its concentration peaks before the peak of the hyetograph. A distant source of PO4 would cause a delayed arrival of this solute to the stream, and an anticlockwise loop.
3.4. Other Water Quality Issues
Fungicides are the primary pesticide applied to support grass growth and avoid the development of disease on the golf course turf. Fungicide application occurs only on greens, constituting 3 acres of the overall 120 acres occupied by the golf course. We studied the possible presence of pesticides in in Wildcat Creek due to land use by sampling upstream and downstream from the golf course. Sampling was carried out before and after precipitation events, and during baseflow. While several pesticides were analyzed, only Azoxystrobin, a broad-spectrum fungicide, was found in the stream. This chemical was observed only at North Bridge, not upstream from the golf course, and its concentration increased after precipitation events. However, per the U.S. EPA’s Pesticide Fact Sheet of Azoxystrobin (1997) [33], the maximum allowable toxicity concentration of Azoxystrobin in water is 168 μg/L, protective for freshwater fish and aquatic invertebrates. The highest value of this chemical observed in Wildcat Creek was 0.282 μg/L (minimum detection limit of 0.01 μg/L). Therefore, the presence of this fungicide in the stream is not expected to pose environmental risk to Wildcat Creek’s ecosystem or any aquatic organism.
The irrigation water used on TGC is disinfected by addition of chloramine, which could be a water quality issue, especially considering its toxicity to fish [34] and to soil microbes that can play an important role in nutrient management [35]. However, contact of chloramine with soil and sediments with organic matter should lead to sorption and rapid degradation of chloramine, and consequently, much lower (or zero) concentrations of chloramine should be expected in Wildcat Creek. On the other hand, Song et al. (2019) [35] observed a reduction in the microbial community diversity in soils exposed to chlorine by drip irrigation, which could inhibit its transformation and adsorption by nutrients in the soil. If chloramine breaks down to chlorine and ammonia in the stream, then volatilization will decrease its concentration. While sampling for chloramine or its degradates was not performed, it is unlikely that chloramine is transported by Wildcat Creek and thus is not expected to be a direct water quality issue for the ecosystem.
4. Conclusions
Measured NO3-N and PO4-P in Wildcat Creek, at times, exceeded concentration limits of 1 mg/L and 0.05 mg/L respectively, considered protective of aquatic ecosystems. Observations upstream and downstream from the golf course illustrated that phosphorous likely has a natural source, and that the system is naturally rich in PO4. Nevertheless, an increase in PO4-P downstream from TGC was observed in every sample analyzed. No phosphate-based fertilizer is currently used at the golf course; however, TGC may have contributed to a historical legacy of PO4 that affects water quality in the stream. Indirectly, the presence of the golf course may be influencing the increase of PO4-P in Wildcat Creek because removal of native vegetation and changes in soil types may reduce infiltration and favor runoff, which would manifest as an increase in PO4-Pconcentration in the creek. PO4 transport to the stream may have also been accelerated by the reduction of residence time of water within the golf course, caused by the continuous application of irrigation water to the system.
NO3, unlike PO4, likely has a golf course fertilizer source, as potassium nitrate (KNO3) fertilizer is periodically applied on TGC. Analysis of stream samples revealed that NO3-N concentrations downstream from the golf course were elevated with respect to background levels. Of note was the increase in NO3 concentration in the stream during runoff events. When stream discharge increased, conservative chloride decreased by dilution, but NO3-N concentration increased. Concentration-discharge hysteresis loops studied for NO3-N during precipitation events suggest a delayed arrival of NO3-N, likely entering the stream dissolved in pre-event water.
Despite significant improvements to the ecological functions of the TGC and the subsequent Audubon Sanctuary Certification, integrated geochemical analyses suggest that Tilden Golf Course has a somewhat negative effect on water quality to downstream receptors and may be an additional source of excess nutrients to Lake Anza, where eutrophication is a concern. PO4 from historic fertilizer use and natural sources may have also accumulated in bottom sediments of Lake Anza after runoff events. In anoxic conditions, bound PO4 is released into the water column, promoting algal growth. NO3 in the system also appears to have some natural provenance, but was observed to increase substantially downstream from golf course. It is important to note that Wildcat Creek, between the golf course and Lake Anza, is channelized and concrete lined. This disconnection between the creek and its bed, bank, flood plain and riparian community results in little opportunity for nutrient uptake before deposition in the Lake Anza impoundment. Therefore, excess nutrients accumulate in the lake at a greater rate than they would under natural conditions, possibly contributing to algal growth.
Supplementary Materials
The following are available online at https://www.mdpi.com/2073-4441/11/9/1923/s1, Figure S1: Scatter plot and linear regression of chloride vs conductivity, Figure S2: Storm hyetograph for precipitation event on April 5th to the 9th, 2018, Figure S3: graph of three end-member mixing and Figure S4: hydrograph separation for the event illustrated in Figure S2.
Author Contributions
Formal analysis, E.G. and J.M.; Funding acquisition, P.B.; Investigation, E.G.; Methodology, A.V. and J.M.; Supervision, J.M.; Validation, P.B.; Writing–original draft, E.G.; Writing–review & editing, E.G., A.V., P.B. and J.M.
Funding
This research received no external funding.
Acknowledgments
The authors sincerely thank the East Bay Regional Park District and the Tilden Golf Course staff for the support and the data provided. We would also like to thank the three anonymous reviewers for their useful and targeted suggestions and comments that have improved the quality of the manuscript.
Conflicts of Interest
The authors declare no conflict of interest.
References
- Rice, P.; Horgan, B. Nutrient loss with runoff from fairway turf: An evaluation of core cultivation practices and their environmental impact. Environ. Toxicol. Chem. 2011, 30, 2473–2480. [Google Scholar] [CrossRef] [PubMed]
- Lovelace, F. Sources of Excess Phosphate Leading to Cyanobacteria Blooms at Lake Temescal, Oakland, CA. Master’s Thesis, California State University East Bay, Hayward, CA, USA, 2017. [Google Scholar]
- Mullen, M.W.; Bell, M.A. Sanctuary Program for Golf Courses to Improve Water Quality: Experience by Audubon International and other States. Audubon Int. 2004, 2, 4. [Google Scholar]
- King, K.W.; Balogh, J.C.; Hughes, K.L.; Harmel, R.D. Nutrient Load Generated by Storm Event Runoff from a Golf Course Watershed. J. Environ. Qual. 2007, 36, 1021–1030. [Google Scholar] [CrossRef] [PubMed]
- Baris, R.D.; Cohen, S.Z.; Barnes, N.L.; Lam, J.; Ma, Q. A quantitative analysis of over twenty years of golf course monitoring studies. Environ. Toxicol. Chem. 2010, 29, 1224–1236. [Google Scholar] [CrossRef] [PubMed]
- Mackey, M.J.; Connette, G.M.; Peterman, W.E.; Semlitsch, R.D. Do golf courses reduce the ecological value of headwater streams for salamanders in the southern Appalachian Mountains? Landsc. Urban Plan. 2014, 125, 17–27. [Google Scholar] [CrossRef]
- Walker, W.J.; Branham, B. Environmental impacts of turf-grass fertilization. In Golf Course Management and Construction: Environmental Isues; Balogh, J.C., Walker, W.J., Eds.; Lewis Publisher Inc.: Chelsea, MI, USA, 1992; pp. 105–219. [Google Scholar]
- United States Environmental Protection Agency. Quality Criteria for Water; US. EPA 440/5-86-001; U.S. EPA: Washington, DC, USA, 1986. [Google Scholar]
- U.S. Environmental Protection Agency. Ambient Water Quality Criteria Recommendations: Information Supporting the Development of State and Tribal Nutrient Criteria for Lakes and Reservoirs in Nutrient Ecoregion III 2001; US EPA: Washington, DC, USA, 2001.
- US EPA State Progress toward Developing Numeric Nutrient Water Quality Criteria for Nitrogen and Phosphorus. Available online: https://www.epa.gov/nutrient-policy-data/state-progress-toward-developing-numeric-nutrient-water-quality-criteria (accessed on 3 September 2019).
- Quinton, J.; Catt, J.; Hess, T. The removal of phosphorus from soil: Is event size important? J. Environ. Qual. 2001, 30, 538–545. [Google Scholar] [CrossRef] [PubMed]
- Edwards, W.M.; Owens, L.B. Large storm effects on total soil erosion. J. Soil Water Conserv. 1991, 46, 75–77. [Google Scholar]
- Shuman, L.M. Phosphorus and Nitrate Nitrogen in Runoff Following Fertilizer Application to Turfgrass. J. Environ. Qual. 2002, 31, 1710–1715. [Google Scholar] [CrossRef] [PubMed]
- Mallin, M.; Wheeler, T. Nutrient and fecal coliform discharge from coastal North Carolina golf courses. J. Environ. Qual. 2000, 29, 979–986. [Google Scholar] [CrossRef]
- Lewis, M.A.; Boustany, R.G.; Dantin, D.D.; Quarles, R.L.; Moore, J.C.; Stanley, R.S. Effects of a Coastal Golf Complex on Water Quality, Periphyton, and Seagrass. Ecotoxicol. Environ. Saf. 2002, 53, 154–162. [Google Scholar] [CrossRef] [PubMed]
- PRISM Climate Group, Oregon State U. Available online: http://www.prism.oregonstate.edu/normals/ (accessed on 7 May 2019).
- PWS Dashboard|Weather Underground. Available online: https://www.wunderground.com/dashboard/pws/KCABERKE150 (accessed on 7 May 2019).
- NOAA: Data Access Viewer. Available online: https://coast.noaa.gov/dataviewer/#/landcover/search/ (accessed on 7 May 2019).
- Stream Alteration Agreement, Wildcat Creek, East Bay Regional Park District; EBRPD: Oakland, CA, USA, 2012.
- Tilden Golf Course Wildcat Creek Restoration Design; Landscape Architecture and Engineering: Berkeley, CA, USA, 2012.
- Restoration Design Group. Available online: http://www.restorationdesigngroup.com/ (accessed on 20 May 2019).
- Graymer, R.W. Geologic Map and Map Database of the Oakland Metropolitan Area, Alameda, Contra Costa, and San Francisco Counties, California. U. S. Geological Survey, Miscellaneous Field Studies MF-2342, scale 1:50,000. Available online: https://pubs.usgs.gov/mf/2000/2342/ (accessed on 20 February 2018).
- Cassada, D.A.; Spalding, R.F.; Cai, Z.; Gross, M.L. Determination of atrazine, deethylatrazine and deisopropylatrazine in water and sediment by isotope dilution gas chromatography-mass spectrometry. Anal. Chim. Acta 1994, 287, 7–15. [Google Scholar] [CrossRef]
- Magalhaes, L.C.; Hunt, T.E.; Siegfried, B.D. Efficacy of neonicotinoid seed treatments to reduce soybean aphid populations under field and controlled conditions in Nebraska. J. Econ. Entomol. 2009, 102, 187–195. [Google Scholar] [CrossRef] [PubMed]
- R Core Team. R: A Language and Environment for Statistical Computing; R Fundation for Statistical Computing: Vienna, Austria, 2019. [Google Scholar]
- California Data Exchange Center-Query Tools. Available online: https://cdec.water.ca.gov/ (accessed on 9 May 2019).
- Moravcová, J.; Pavlíček, T.; Ondr, P.; Koupilová, M.; Kvítek, T. Comparison of parameters influencing the behavior of concentration of nitrates and phosphates during different extreme rainfall-runoff events in small watersheds. Hydrol. Earth Syst. Sci. Discuss. 2013, 10, 12105–12151. [Google Scholar] [CrossRef]
- Lloyd, C.E.M.; Freer, J.E.; Johnes, P.J.; Collins, A.L. Using hysteresis analysis of high-resolution water quality monitoring data, including uncertainty, to infer controls on nutrient and sediment transfer in catchments. Sci. Total Environ. 2016, 543, 388–404. [Google Scholar] [CrossRef]
- Aguilera, R.; Melack, J.M. Concentration-Discharge Responses to Storm Events in Coastal California Watersheds: C-Q Storm Responses Coastal California. Water Resour. Res. 2018, 54, 407–424. [Google Scholar] [CrossRef]
- USGS Cooperative Matching Funds. Available online: https://www.usgs.gov/mission-areas/water-resources/science/usgs-cooperative-matching-funds?qt-science_center_objects=0#qt-science_center_objects (accessed on 9 May 2019).
- Bieroza, M.Z.; Heathwaite, A.L. Seasonal variation in phosphorus concentration–discharge hysteresis inferred from high-frequency in situ monitoring. J. Hydrol. 2015, 524, 333–347. [Google Scholar] [CrossRef]
- Andrea, B.; Francesc, G.; Jérôme, L.; Eusebi, V.; Francesc, S. Cross-site Comparison of Variability of DOC and Nitrate c–q Hysteresis during the Autumn–winter Period in Three Mediterranean Headwater Streams: A Synthetic Approach. Biogeochemistry 2006, 77, 327–349. [Google Scholar] [CrossRef]
- United States Environmental Protection Agency. Office of Prevention, Pesticides and Toxic Substances. In Pesticide Fact Sheet: Azoxystrobin; US EPA: Washington, DC, USA, 1997. [Google Scholar]
- United States Environmental Protection Agency. Chloramines-Related Research; US EPA: Washington, DC, USA, 2009.
- Song, P.; Feng, G.; Brooks, J.; Zhou, B.; Zhou, H.; Zhao, Z.; Li, Y. Environmental risk of chlorine-controlled clogging in drip irrigation system using reclaimed water: The perspective of soil health. J. Clean. Prod. 2019, 232, 1452–1464. [Google Scholar] [CrossRef]
Figure 1.
Location of Wildcat Creek in the East Bay Hills of the San Francisco Bay Area. Also shown in the figure Tilden Golf Course and Lake Anza, the section of Wildcat Creek that is the subject of this research, and the locations of the key sampling points, North Bridge (NB), near the outlet of the golf course and Padre (PD), upstream of the golf course.

Figure 2.
Land Cover of the study area [18]. Notice the proximity of Tilden Regional Park to a highly urbanized area, the city of Berkeley, California. Developed open space (shown in yellow) consists of areas with a mixture of some constructed materials but mostly vegetation in the form of lawn grass, including parks, lawns, athletic fields and golf courses.

Figure 3.
Step and Pool system built on Wildcat Creek along the golf course to dissipate flow and reduce stream turbidity. Picture from Restoration Design Group [21].
Figure 3.
Step and Pool system built on Wildcat Creek along the golf course to dissipate flow and reduce stream turbidity. Picture from Restoration Design Group [21].

Figure 4.
Graphical representation of end members and samples taken for hydrograph separation during an event from February 28th to March 6th, 2018. The geochemical tracers used for the 3 end-member mixing model were δ18O (vertical axis) and chloride (horizontal axis). The graph shows that the stream samples plot inside the mixing triangle, agreeing with the three end members identified. Error bars of end members represent standard deviation of the mean of measurements for the 3 end members. Error bars on stream samples are standard deviation (analytical uncertainty) from individual measurements. Horizontal error bars are within the symbol size.

Figure 5.
Storm Hydrograph for a precipitation event on February 28th to March 6th, 2018. Note the gap (marked by a dashed line on the graph) between 23:00 on February 28th and 10:00 March 1st, during which no samples were collected.
Figure 5.
Storm Hydrograph for a precipitation event on February 28th to March 6th, 2018. Note the gap (marked by a dashed line on the graph) between 23:00 on February 28th and 10:00 March 1st, during which no samples were collected.

Figure 6.
Wildcat Creek’s hyetograph and hydrograph for the precipitation event shown in Figure 5. The shaded area denotes a period of missing data, between 23:00 on February 28th and 10:00 March 1st, marked by the dashed line in Figure 5.

Figure 7.
Boxplots of nutrients concentrations for samples collected upstream and downstream of TGC. The graph shows an increase in concentrations at the golf course respect to the upstream samples for both solutes analyzed, NO3-N (left) and PO4-P (right). p-values obtained from paired t-test were 0.048 and 0.018 for NO3-N and PO4-P, respectively, confirming the statistical significance of the observed increases.

Figure 8.
NO3-N, PO4-P, Cl−, conductivity and turbidity sampled at TGC during a storm event from February 28th to March 1st, 2018 in Wildcat Creek. Samples were taken at 1.5 h intervals. Primary vertical axis is a logarithmic scale. The horizontal dashed lines mark the maximum NO3-N and PO4-P recommended values by the EPA to avoid eutrophication for a stream that drains into a lake. The error bars are 3× the minimum detection limit.

Figure 9.
NO3-N sampled in a spring upstream of TGC and at NB before and after a precipitation event, on November 15th and 16th, 2017, respectively.
Figure 9.
NO3-N sampled in a spring upstream of TGC and at NB before and after a precipitation event, on November 15th and 16th, 2017, respectively.

Figure 10.
Hysteresis loop observed from Concentration-Discharge relationship during runoff event from February 28th to March 6th, 2018.
Figure 10.
Hysteresis loop observed from Concentration-Discharge relationship during runoff event from February 28th to March 6th, 2018.


Table 1.
Summary of catchment characteristics.
| Area of upper catchment | 3.5 km2 |
| Average annual rainfall | 720 mm |
| Elevation range | 239–559m |
| Geology [22] | Basalts from late Miocene (Bald Peak Basalt and Moraga Formation) |
| Land cover type [18] | |
| Mixed forest | 48% |
| Evergreen forest | 21% |
| Scrub/Shrub | 13% |
| Developed open area | 8% |
| Grassland | 7% |
| Low intensity developed | 3% |
| Others | 0% |
Table 2.
Results of chemical analysis carried out upstream and at the golf course before (11/8/2017) and soon after (11/9/2017) a precipitation event studied.
Table 2.
Results of chemical analysis carried out upstream and at the golf course before (11/8/2017) and soon after (11/9/2017) a precipitation event studied.
| Location | Date | NO3-N N (mg/L) | PO4-P (mg/L) | K (mg/L) | Na (mg/L) |
|---|---|---|---|---|---|
| NB | 11/8/17 | 0.48 | 0.091 | 0.911 | 27.4 |
| PD | 11/8/17 | 0.19 | 0.075 | 0.501 | 22.7 |
| NB | 11/9/17 | 2.2 | 0.13 | 3.69 | 23.4 |
| PD | 11/9/17 | 1.2 | 0.1 | 0.826 | 19.9 |
© 2019 by the authors. Licensee MDPI, Basel, Switzerland. This article is an open access article distributed under the terms and conditions of the Creative Commons Attribution (CC BY) license (http://creativecommons.org/licenses/by/4.0/).
Share and Cite
MDPI and ACS Style
Grande, E.; Visser, A.; Beitz, P.; Moran, J. Examination of Nutrient Sources and Transport in a Catchment with an Audubon Certified Golf Course. Water 2019, 11, 1923. https://doi.org/10.3390/w11091923
AMA Style
Grande E, Visser A, Beitz P, Moran J. Examination of Nutrient Sources and Transport in a Catchment with an Audubon Certified Golf Course. Water. 2019; 11(9):1923. https://doi.org/10.3390/w11091923
Chicago/Turabian StyleGrande, Emilio, Ate Visser, Pamela Beitz, and Jean Moran. 2019. "Examination of Nutrient Sources and Transport in a Catchment with an Audubon Certified Golf Course" Water 11, no. 9: 1923. https://doi.org/10.3390/w11091923
Note that from the first issue of 2016, this journal uses article numbers instead of page numbers. See further details here.