Temporal and Spatial Characteristics of Precipitation and Temperature in Punjab, Pakistan
by
 , and
, and
Zain Nawaz
1,2 ,
,
Xin Li
3,4,
Yingying Chen
3,4,*,
Yanlong Guo
3,
Xufeng Wang
1,2 and
Naima Nawaz
5 1
Key Laboratory of Remote Sensing of Gansu Province, Northwest Institute of Eco-Environment and Resources, Chinese Academy of Sciences, Lanzhou 730000, China
2
University of Chinese Academy of Sciences, Beijing 100049, China
3
Institute of Tibetan Plateau Research, Chinese Academy of Sciences, Beijing 100101, China
4
CAS Center for Excellence in Tibetan Plateau Earth Sciences, Beijing 100101, China
5
Department of Rural Sociology, University of Agriculture, Faisalabad 38040, Pakistan
*
Author to whom correspondence should be addressed.
Water 2019, 11(9), 1916; https://doi.org/10.3390/w11091916
Submission received: 27 June 2019
/
Revised: 7 September 2019
/
Accepted: 10 September 2019
/
Published: 14 September 2019
(This article belongs to the Section Hydrology)
Abstract
:Identifying the changes in precipitation and temperature at a regional scale is of great importance for the quantification of climate change. This research investigates the changes in precipitation and surface air temperature indices in the seven irrigation zones of Punjab Province during the last 50 years; this province is a very important region in Pakistan in terms of agriculture and irrigated farming. The reliability of the data was examined using double mass curve and autocorrelation analysis. The magnitude and significance of the precipitation and temperature were visualized by various statistical methods. The stations’ trends were spatially distributed to better understand climatic variability across the elevation gradient of the study region. The results showed a significant warming trend in annual Tmin (minimum temperature) and Tmean (mean temperature) in different irrigation zones. However, Tmax (maximum temperature) had insignificant variations except in the high elevation Thal zone. Moreover, the rate of Tmin increased faster than that of Tmax, resulting in a reduction in the diurnal temperature range (DTR). On a seasonal scale, warming was more pronounced during spring, followed by that in winter and autumn. However, the summer season exhibited insignificant negative trends in most of the zones and gauges, except in the higher-altitude Thal zone. Overall, Bahawalpur and Faisalabad are the zones most vulnerable to warming annually and in the spring, respectively. Furthermore, the elevation-dependent trend (EDT) indicated larger increments in Tmax for higher-elevation (above 500 m a.s.l.) stations, compared to the lower-elevation ones, on both annual and seasonal scales. In contrast, the Tmin showed opposite trends at higher- and lower-elevation stations, while a moderate increase was witnessed in Tmean trends from lower to higher altitude over the study region. An increasing trend in DTR was observed at higher elevation, while a decreasing trend was noticed at the lower-elevation stations. The analysis of precipitation data indicated wide variability over the entire region during the study period. Most previous studies reported no change or a decreasing trend in precipitation in this region. Conversely, our findings indicated the cumulative increase in annual and autumn precipitation amounts at zonal and regional level. However, EDT analysis identified the decrease in precipitation amounts at higher elevation (above 1000 m a.s.l.) and increase at the lower-elevation stations. Overall, our findings revealed unprecedented evidence of regional climate change from the perspectives of seasonal warming and variations in precipitation and temperature extremes (Tmax and Tmin) particularly at higher-elevation sites, resulting in a variability of the DTR, which could have a significant influence on water resources and on the phenology of vegetation and crops at zonal and station level in Punjab.
1. Introduction
Global metrics of future climate changes are directly associated with regional climatic variations. There is mounting evidence that the climate is changing in response to human activity, and the variations in temperature and precipitation recorded during the twentieth century cannot be entirely attributed to natural causes [1]. It has been established that the global mean surface air temperature (hereafter mentioned as Tmean) has increased by approximately 0.72 °C during 1951–2012, with a slower increase during 1998–2012 [2]. Similarly, the amount of global land precipitation has increased by 2% during the last century [3], and changes in its pattern would directly influence the water resources and agriculture of the concerned regions [4]. However, the variations in temperature and precipitation are dynamic in nature and exhibit continuous change over time and space. There are many measures of climate change, and changes in annual and seasonal temperature and precipitation are significant indicators that enable the assessment of climate variability [5,6]. A recent study reported that the increasing tendency of Tmean could be attributed to the noteworthy variations in maximum and minimum temperatures (hereafter mentioned as Tmax and Tmin), which could ultimately lead to surface warming and changes in climate and precipitation patterns [7,8,9]. In addition to variations in the above-mentioned indicators, the diurnal temperature range (DTR) (i.e., the difference between Tmax and Tmin) is an important meteorological indicator and index of observed climate change [10]. Across the globe, there have been different variations in daily Tmax and Tmin, resulting in a smaller DTR and an increase in Tmean [11]. The amplification in variation of a) temperature indices and b) precipitation amounts is also highly dependent on the regional elevation gradient. Increasing evidence suggests that rate of warming trends in mountainous regions is faster as compared with the average global warming trends [12]. Nonetheless, the variation in climate with respect to elevation does not follow a general trend but it, rather, exhibits different patterns from region to region.
It has been widely accepted that long-term changes in climate variables can alter ecological and hydrological processes [13], and have significant effects on the growth and development of vegetation that lead to a decline in the net agricultural productivity [14]. The deleterious effects of climate change would mostly be endured by under-developed nations. Moreover, the natives of developing countries are mostly engaged in agriculture, which is a sector that is highly susceptible to climate change, and have limited resources to adapt to changing circumstances. In this context, the detection of historical variations in climate indicators is highly important for the countries where agriculture is the backbone of the economy, such as Pakistan, which is situated in one of the zones with a rapidly increasing temperature [15]. In recent studies, significant climatic changes have been documented in Pakistan, indicating that the Tmax and Tmin fluctuated at rates of 0.12–0.29 and 0.10–0.37 °C/decade, respectively [16,17]. Previous reports have indicated variations in temperature extremes in different parts of the country; for example, positive trends were observed in Tmax and Tmin in the upper, middle, and lower Indus basin [18], while decreasing (increasing) trends in Tmax (Tmin) were observed in the northern part of the country [19]. Similarly, studies on trend assessments of precipitation have indicated increasing tendencies in annual precipitation for the northern, northeastern and northwestern regions [20,21]. Conversely, [22] reported an increase in temperature and a decrease in precipitation and corresponding river flows, starting from the late 1990s, for different sub-basins in Upper Indus Basin (UIB). They estimated the trends by using six atmospheric reanalysis products due to the lack of availability of in-situ observation at UIB. Furthermore, central and southern parts of the country are mostly reported to have experienced a decreasing trend in annual precipitation [23,24]. However, no comprehensive research has been conducted regarding the spatiotemporal trends of the temperature indices (e.g., Tmax, Tmin, Tmean, DTR) and precipitation in various zones of Punjab, which are highly significant from the perspectives of agriculture and irrigated farming, because the major agricultural commodities of the country are produced in these zones, and studies have shown that these zones are highly susceptible to climate change [25]. While most previous studies have not focused much on the important segments of climatic variations at the zonal and sub-basin levels, this study intends to bridge the knowledge gap through the use of more detailed and comprehensive research on the spatiotemporal variations in air temperature indices and precipitation in different irrigation zones of Punjab Province, Pakistan. The primary goal of this work is to assess the spatial and temporal trends of the air temperature indices (e.g., Tmax, Tmin, Tmean, DTR) and precipitation in different irrigation zones of Punjab. The secondary objective is to analyze the trends and heterogeneity in the air temperature indices (e.g., Tmax, Tmin, Tmean, DTR) and precipitation across the elevation gradient of the whole Punjab region. In addition, the spatial distribution of the annual and seasonal station trends, especially an analysis during the crop growing season (Rabi and Kharif) in different irrigation zones, is presented.
The next sections of the paper are organized as follows. Section 2 provides a brief description of the study area. The data and methods section includes the different statistical methods and techniques, while the results and discussion section presents the outcomes of the study. The conclusions of the study are presented in the last section.
2. Materials and Methods
2.1. Study Area
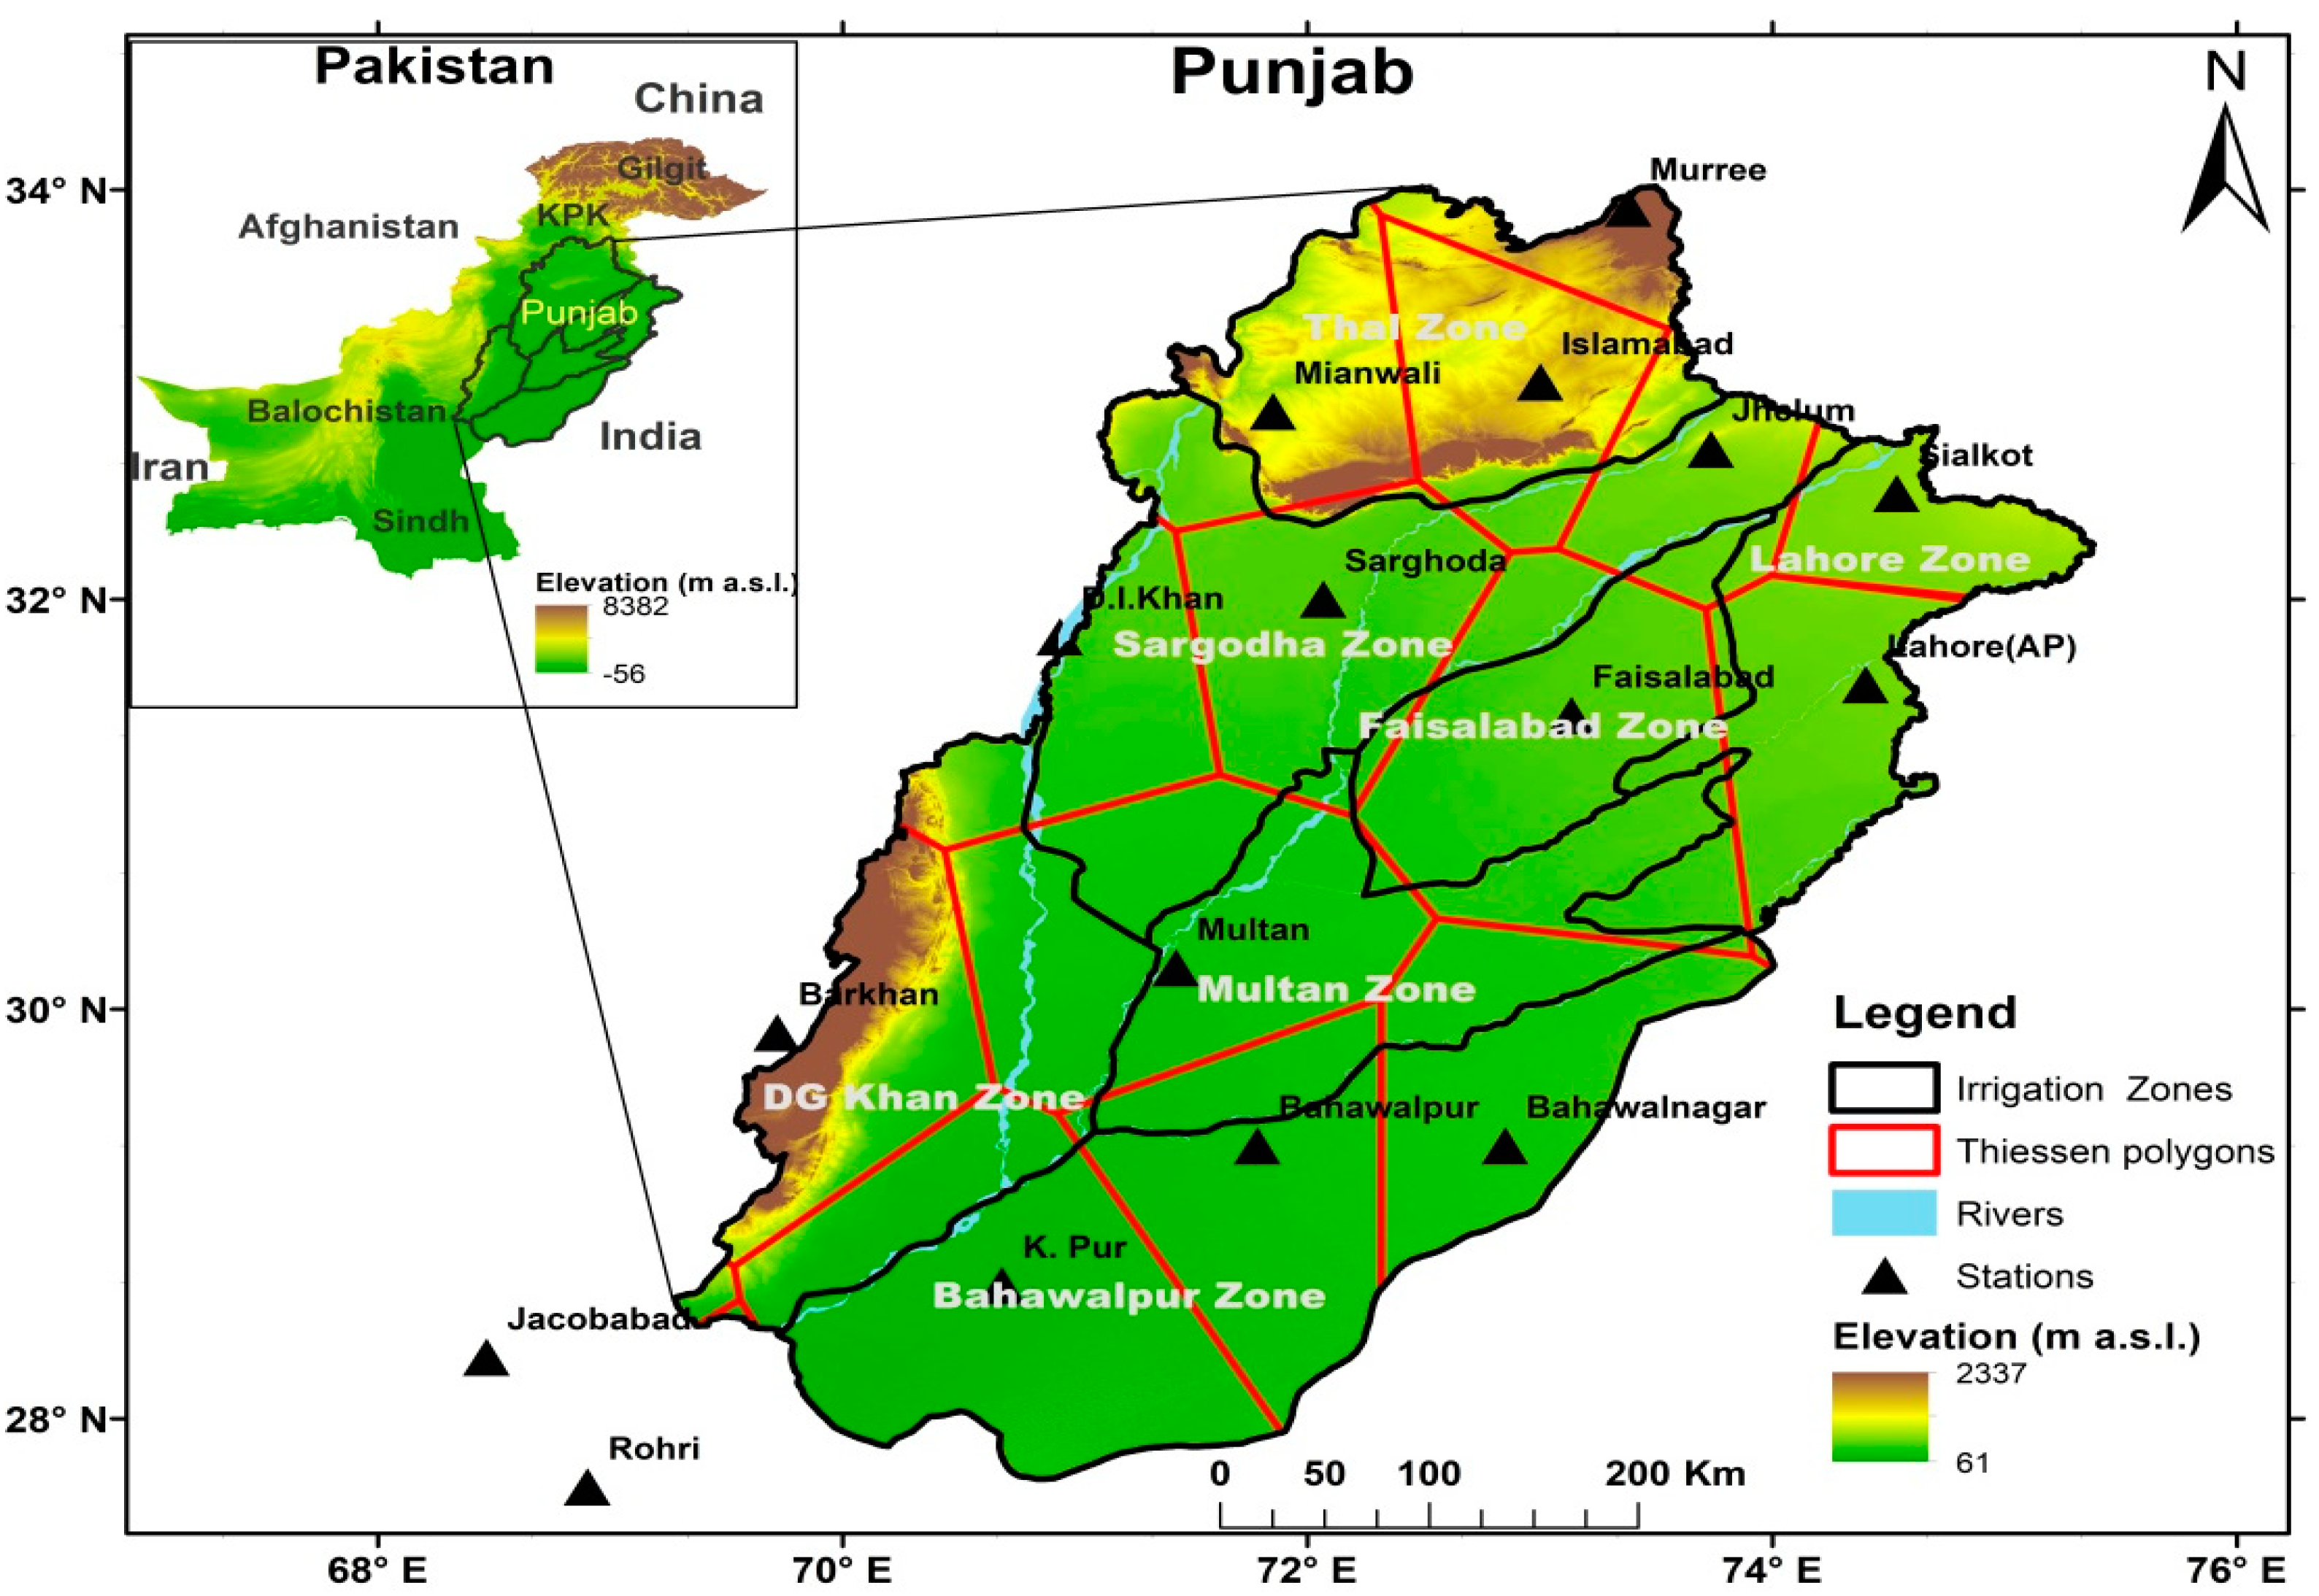
Pakistan is a sovereign country in southwest Asia situated between 24°–37° N and 60°–75° E. The country has an area of 8 × 10⁶ km2. The country has a diverse landscape ranging from the Karakoram and Himalayan mountains in the north and northwest, with the agricultural plains of the Indus River basin in the center and the Arabian Sea along the southern coast [26]. Punjab Province is Pakistan’s second largest province, with geographical coordinates of 31.17° N and 72.70° E, as shown in Figure 1. Additionally, the province has the largest population and is the agricultural hub of the country, producing more than 50% of the country’s agricultural commodities [27]. The province accommodates five major rivers, namely, Jhelum, Chenab, Ravi, Bias, and Sutlej. There are seven irrigation zones in Punjab, including Thal, Sargodha, Lahore, Multan, Faisalabad, Dera Ghazi (D.G.) Khan, and Bahawalpur. These zones are distributed on the basis of flow canals and distributaries and are managed by the provincial irrigation department of Punjab.
The annual mean temperature varies from 23 to 26 °C, with a Tmin of 16–19 °C and a Tmax of 29–33 °C. The annual mean precipitation ranges from >800 mm in the northern part to <300 mm in the southern part [28]. There are two precipitation seasons in this region (i.e., the monsoon season (July–September) and winter (December–March)) [29]. Overall, the northern part of the region is dominated by humid and sub-humid climates, while the central and southern parts are dominated by tropical and coastal climates, respectively.
2.2. Data
Long-term variations in the annual and seasonal air temperature indices (e.g., Tmax, Tmin, Tmean, DTR) and precipitation were investigated in the present study. The historical records from 1967 to 2017, regarding 16 meteorological stations situated in different irrigation zones of Punjab, were provided by the Regional Meteorological Department of Pakistan are shown in Table 1. These stations were selected based on their historical temporal coverage, homogeneity, and completeness of records. The climatic variables were analyzed on an annual and a seasonal scale. The required seasons were defined as winter (December–February), spring (March–May), summer (June–August), and autumn (September–November) [30], and the crop growing periods, Rabi (November–April) and Kharif (May–June). The seasonal and annual climatic data records were obtained using the means of the monthly averages.
2.3. Data Processing
The quality of the recorded climatic data series, such as the identification of outliers and quest for missing values, is of primary importance. Therefore, to ensure the quality of the recorded data series, outliers were fixed using the adjacent gauge records, and missing values were obtained using those from nearby stations [31]. The gaps in the data series were completed using the time-based interpolation method (monthly records were determined as the mean values of the same month for a period between ± two years [32].
Many approaches have been developed to identify the outliers and non-homogeneities in the records [33]. In the present study, the double-mass curve technique was used for the climatic data series for each station [34]. The detection or adjustment of discrepancies in the gauge records was performed by associating its period trends with those of other comparatively stable chronicles of a station [1]. Non-linearity or bends can serve as a sign of the gauges being relocated or new instruments being installed [35]. If the outcome of the double-mass curve analysis showed a straight line, there were no obvious break points, confirming the high temporal consistency in the data series.
To attain the characteristics of air temperature and precipitation in different irrigation zones, Punjab was divided into seven irrigation zones according to the canal command areas, which include Lahore, Multan, Sargodha, Bahawalpur, Faisalabad, Thal, and D.G. Khan (Figure 1). The duration of the analyzed period was 51 years (i.e., from 1967 to 2017). The series of annual and seasonal climatic variables (e.g., Tmax, Tmin, Tmean, and precipitation) for different irrigation zones were obtained using the Thiessen polygon method, as shown in Figure 1 and Table S1 in the Supplementary Information (SI). This method was developed by [36], and it has been widely used to estimate the areal averages from meteorological and hydrological station data [37,38]. According to the position of the stations, polygons are formed by the perpendicular bisectors of the lines joining nearby stations. Thus, each polygon comprises only one station, and the weights of the stations are computed by their relative areas, which are estimated using a polygon network [39].
2.4. Methods
Before applying the Mann–Whitney (MW), Mann–Kendall (MK), and Sen’s slope techniques to detect the absolute change and trends in the air temperature indices and precipitation data series, the data series were tested using a time serial autocorrelation technique. In addition, the autocorrelation was removed from the data series using the pre-whitening method. Furthermore, the absolute changes in the temperature indices and trends were analyzed using the Mann–Whitney, Mann–Kendall, and Sen’s slope techniques to evaluate the patterns and their significance levels in the data series of climatic variables in different irrigation zones. Moreover, inverse distance weighting (IDW) was incorporated as a spatial interpolation technique into the station data to analyze the spatial distribution of the temperature indices and precipitation in different irrigation zones.
2.4.1. Time Serial Autocorrelation
The MK test requires time series data to be serially independent. However, this condition was not present in the time series data. The probability of a significant trend would be added to the data series by the increased autocorrelation and would affect the results of the MK test [40]. The presence of significant autocorrelation should be checked and removed before applying the MK trend test [41]. Therefore, the following procedure was adopted before applying the MK trend test [42]. Compute the lag-1 serial correlation coefficient ) of the different time series data as follows:
where , and are the correlation coefficient at lag-1, climatic variable data series, and mean of the climatic variable time series, respectively. The confidence interval (CI) of at the 5% significance level can be calculated as follows:
If falls into the confidence limits (lag-1 ≥ 0.254 or lag-1 ≤ −0.254), the data series is independent, and the MK test can be applied to the original data series. Otherwise, the MK test should be applied after the removal of the significant autocorrelation, which can be computed as .
The analyses of autocorrelation coefficients at lag-1 for the annual data series of Tmax, Tmin, Tmean, DTR, and precipitation in different zones are described in Section 1, Figure S1 in the SI.
2.4.2. Mann–Whitney Test (MW)
The MW test is a non-parametric test used to evaluate the significance of a difference in the median or central trend of two data series. MW analysis was performed to determine the difference in means from the data series [43]. Sample data do not require a normal distribution for the MW test. The governing equation of the MW test for each dataset is as follows:
Here, and are the number of observations, and and are the ranks assigned in the first and second periods, respectively. For the application of the MW test, the data series were divided into two spans (i.e., 1967–1991 and 1992–2017) to obtain the absolute change between the two periods.
2.4.3. Mann–Kendall Test (MK)
The non-parametric trend diagnosis MK test was used in the present study. The MK test has been widely used for the detection of trends in metrological or hydrological temporal data series [44,45]. The method is less sensitive to the abrupt break points and is robust against outliers and missing values [46]. However, the test is sensitive to the serial correlation that may affect the test results [45,47]. During the current study, the sequential correlation approach was employed prior to applying the MK test to examine the statistical significance of trends in the climatic data series.
The detailed procedure of the MK test is reported by [48,49]. The standardized MK test statistic “S” is defined below:
where n is the length of the series, and are the sequential values of data. If n ≥ 10, then the S statistic is normally distributed and the variance (Var) is given by
where m is the number of tied groups, and is the size of the tied group. The test statistic Z is computed by:
The Z statistics in the MK test follow the normal distribution with an average of zero and a variance of one with a null hypothesis of no trend [50]. The positive and negative values of the statistical Z shows increasing and decreasing trends, respectively.
2.4.4. Theil and Sen’s Slope (TSS)
TSS is a non-parametric test used to estimate the slope magnitude in linear trends [51], and the test is frequently used for the analysis of hydro-meteorological data series [52]. TSS is a least square regression and is widely used for estimating the magnitude of linear trends in large data sets [53]. The basic governing equation of Sen’s slope for the N pair of data is computed by:
where are the data values at time j and k, respectively. If N is an odd number, then Sen’s equation is:
If N is an even number, then Sens’s equation is:
2.4.5. Spatial Interpolation
Spatial interpolation techniques can be used to visualize data variability in space and time. The technique predicts values that are identical to the measured values from the sample [54]. IDW is one of the most commonly used deterministic methods for interpolating the climate variability distribution. This method has been used by many researchers for the spatial interpolation of data in different regions [55]. The method estimates the characteristic values at unsampled sites using a linear arrangement of values at sampled points, and these values are weighted by a converse function of the distance from the point of attention to the sampled location. The weights can be expressed as:
where is the distance between and , p is a power constant, and n represents the number of sample points used for the estimation. The weights decrease as distance increases, mainly when the rate of the power parameter increases; thus, adjacent samples have a heavier weight and have more influence on the estimation [56].
3. Results and Discussion
3.1. Absolute Changes and Trends of Temperature Indices
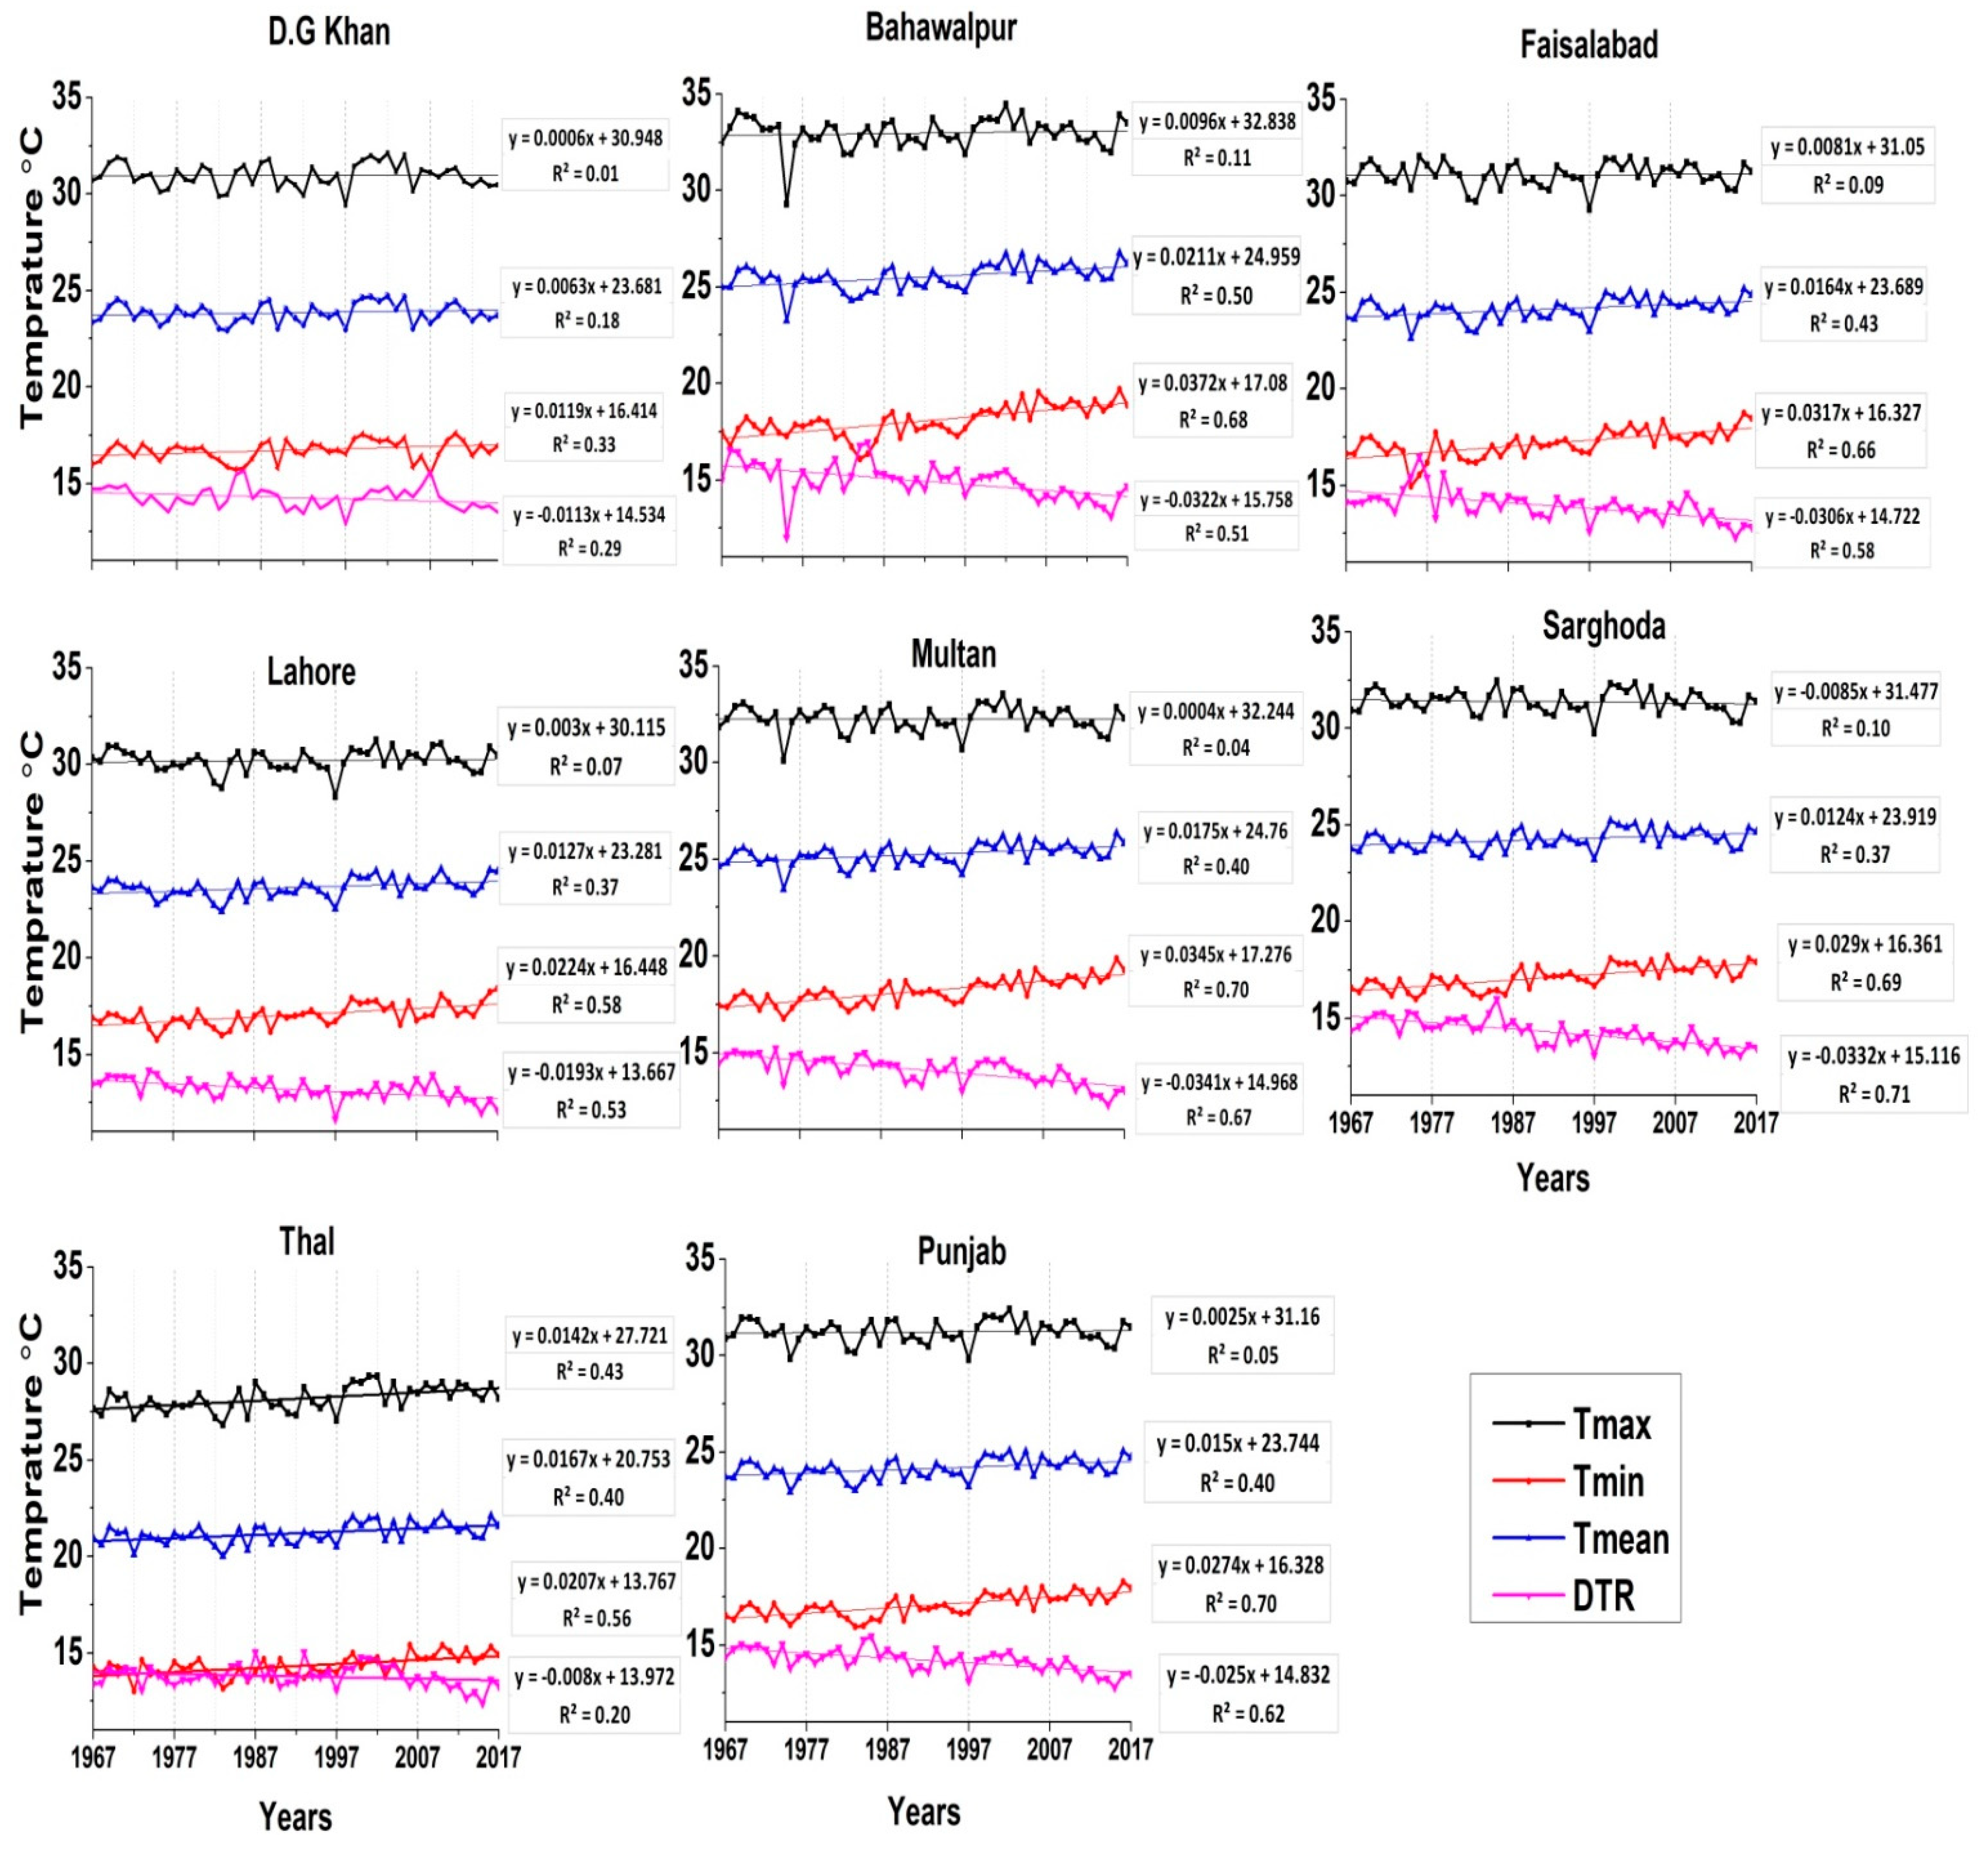
Figure 2 provides the graphical demonstration of annual time series and the linear trends for climatic variables for each irrigation zone as well as for of the whole region of Punjab. The results of linear trends and coefficient of determination of Tmin and Tmean data series indicate a clear increasing trend. Meanwhile, the trends and coefficient of Tmax data series depicted non-significant trends and lower r-squared values in most of the zones except for the Thal zone. On the other hand, the DTR data series showed a higher decreasing trend with higher r-squared values, which can be attributed to the higher rate of the increasing trend in Tmin than that of Tmax. The highest value of r-squared in Tmean and Tmin data series was observed for Bahawalpur and Multan zone, respectively. Moreover, the highest r-squared value in Tmax and DTR data series was noticed for Thal and Sargodha zone, respectively. Overall, the linear increase in the Tmin, Tmean data series was more conspicuous than that of the Tmax in most of the zones and for of the overall Punjab region, during the whole study period. The most significant rapid change in temperature’s linear trends was observed during the period 1997–2002 for most of the zones and for the whole Punjab region. According to [19], the country faced a severe and long lasting drought during this period. The rapid increase in temperature trends during the aforementioned period in Punjab region could be owing to the upshots of severe drought conditions in major parts of the country.
The annual and seasonal absolute change and trends of Tmax, Tmin, Tmean, and DTR for all of Punjab Province obtained by the MW, MK, and Theil–Sen approaches are presented in Table 2 and Table 3. Meanwhile, the annual and seasonal absolute changes and trends of Tmax, Tmin, Tmean, and DTR for the irrigation zones other than the entire Punjab basin are presented in Tables S2 and S3 in the SI. The results (MW and MK) indicated that Tmax exhibited a positive absolute change and increasing trend in the higher elevation Thal zone in the annual, winter, spring, and Rabi seasons, with the highest increase assessed during the spring season with magnitudes of 0.94 °C and 0.29 °C/decade, respectively. However, conflicting signals of insignificant positive and negative trends were observed on a seasonal scale in most zones.
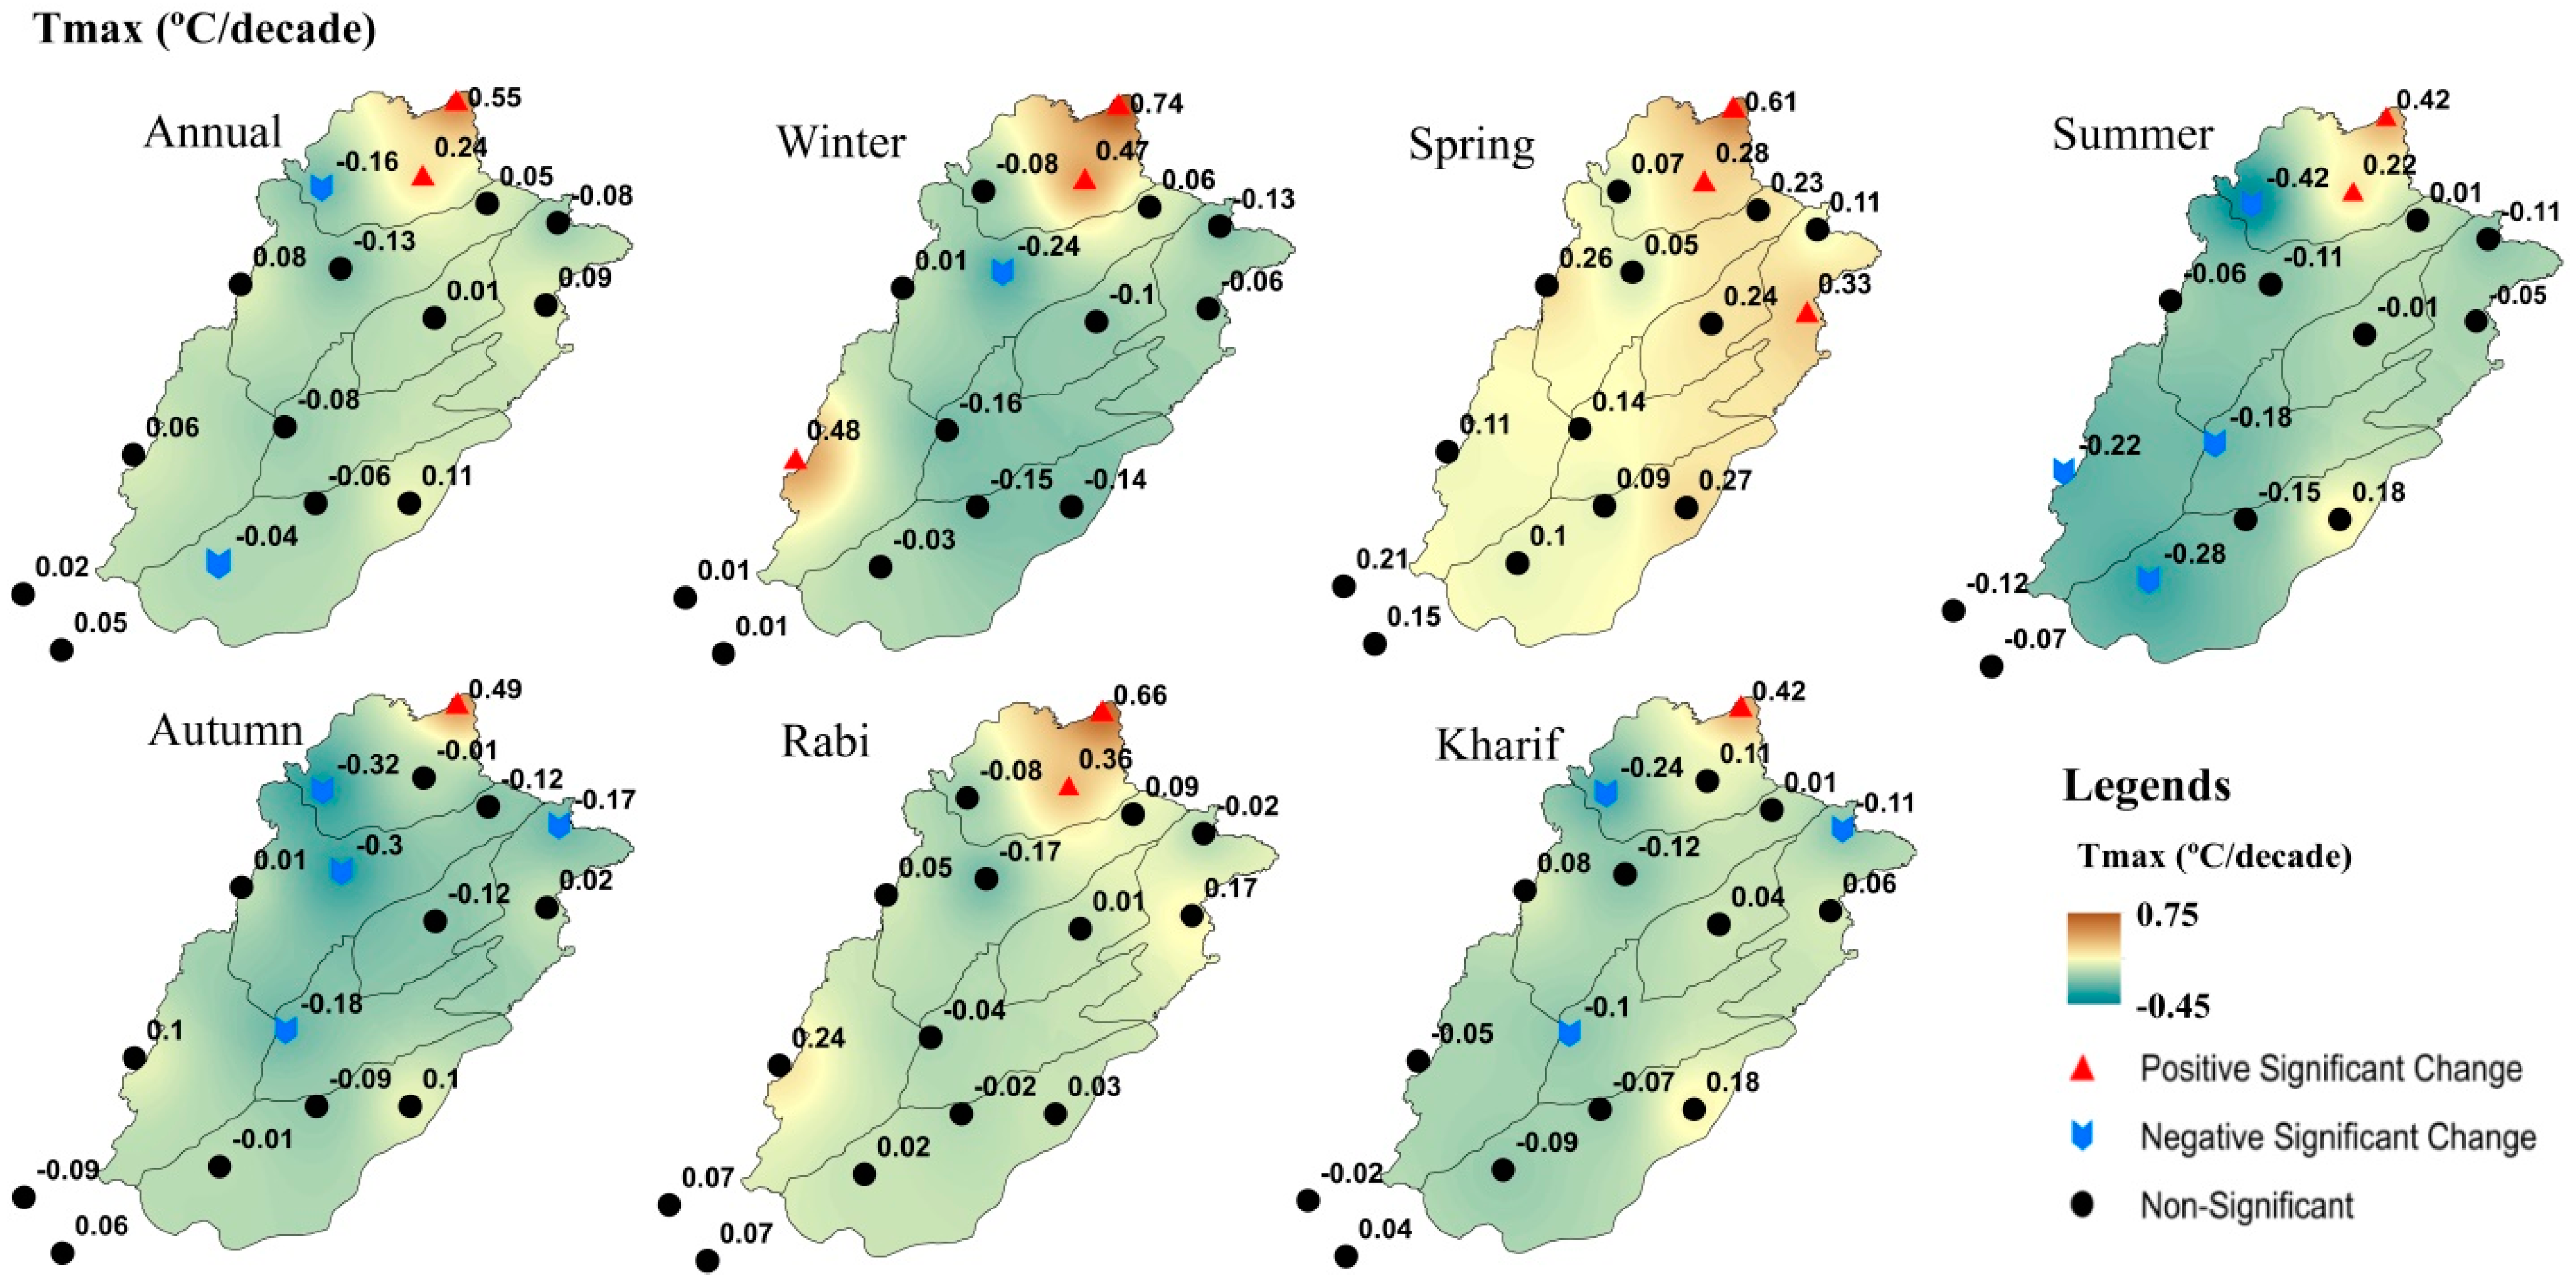
The spatial distribution of the annual and seasonal trends of Tmax is presented in Figure 3. The MK trends of the annual Tmax showed conflicting signals of non-significant positive and negative trends over the whole basin. In particular, the Murree and Islamabad stations, which are located at high altitudes, exhibited a significant increasing trend in Tmax with magnitudes of 0.55 and 0.24 °C/decade, respectively. In contrast, the highest reduction in Tmax was observed at Mianwali (−0.16 °C/decade), followed by Sarghoda (−0.13 °C/decade) station. In winter, Tmax indicated a slight declining trend at most stations except for the higher-altitude Muree and Islamabad stations.
In contrast, the spring season indicated an insignificant increasing trend of Tmax at most sites. However, a significant increasing trend in Tmax was observed for the Murree, Islamabad, and Lahore stations, with rates of 0.61, 0.28, and 0.33 °C/decade, respectively. In summer, most of the gauge sites showed an insignificant declining trend except for the Muree, Islamabad, and Bahawalnagar stations, which indicated significant increasing trends. The decrease in Tmax during the summer season is in agreement with the findings of [57], who reported a decreasing trend in some parts of the country. The highest declining trend in Tmax was observed at the Mianwali station with a magnitude of −0.42 °C/decade. Meanwhile, the autumn season revealed a decreasing trend at most sites, with the highest reduction observed at the Mianwali (−0.32 °C/decade) station.
On the other hand, the seasonal (crop growing) Tmax showed a slight increasing trend at most stations in the Rabi season, while the Kharif season revealed a minor decrease in Tmax. A significant negative trend was observed at the elevated gauge sites of Muree and Islamabad for the Rabi season, while two gauge sites, Muree and Bahawalnagar, showed negative trends for the Kharif season. Overall, the annual and seasonal Tmax trends varied from −0.45 to 0.75 °C/decade. The increasing tendency of Tmax at high altitudes are consistent with the previously reported work, for the northern belt of Pakistan by [58]. Additionally, the decreasing trend in Tmax observed in this work is in conformity with the findings of [59]. Furthermore, our zonal and spatial results are in good agreement with the findings of [17], where it is reported that the trend of Tmax at the annual scale increased at a rate of 0.12 °C/decade in Pakistan (country level). The present study highlights a significant increase in Tmax in the Thal zone at a high elevation compared to that at lower elevations. The increasing trend of Tmax in the higher elevation zone could have a major impact on water resources and agriculture from different perspectives. Nevertheless, this change could have positive implications, such as shortening the crop growing period, as suggested by [60], and it may also lead to an accelerated snow melting process and substantial changes in the amount and pattern of precipitation [18].
Due to significant changes in precipitation, disproportionate snow melting can cause rivers to overflow, which may consequently cause flooding in the low-elevation zones [61]. Nonetheless, the seasonal negative variations in Tmax could be a possible explanation for the westerlies and monsoon periods in the different zones [62]. In the case of Tmin, the results indicated the absolute positive change and increasing trends at the annual and seasonal time scales. The maximum positive absolute change and increasing trend were observed in the Bahawalpur zone during the annual and spring seasons with magnitudes of (1.01 and 1.26 °C absolute changes) and (0.35 and 0.48 °C/decade trends), respectively.
Overall, the spring season showed the highest increasing trend for the nighttime temperature in the southern zone. The increasing trend in Tmin at the annual and seasonal scales strengthened the results of previous studies for different areas of Pakistan [17]. However, the non-significant magnitude of the increasing trend in the summer season conflicted with the results of [59], where a sharp increase in trends during the summer season was reported in different zones of the country. The outcomes of the present study are in harmony with the findings of [18] for the summer season.
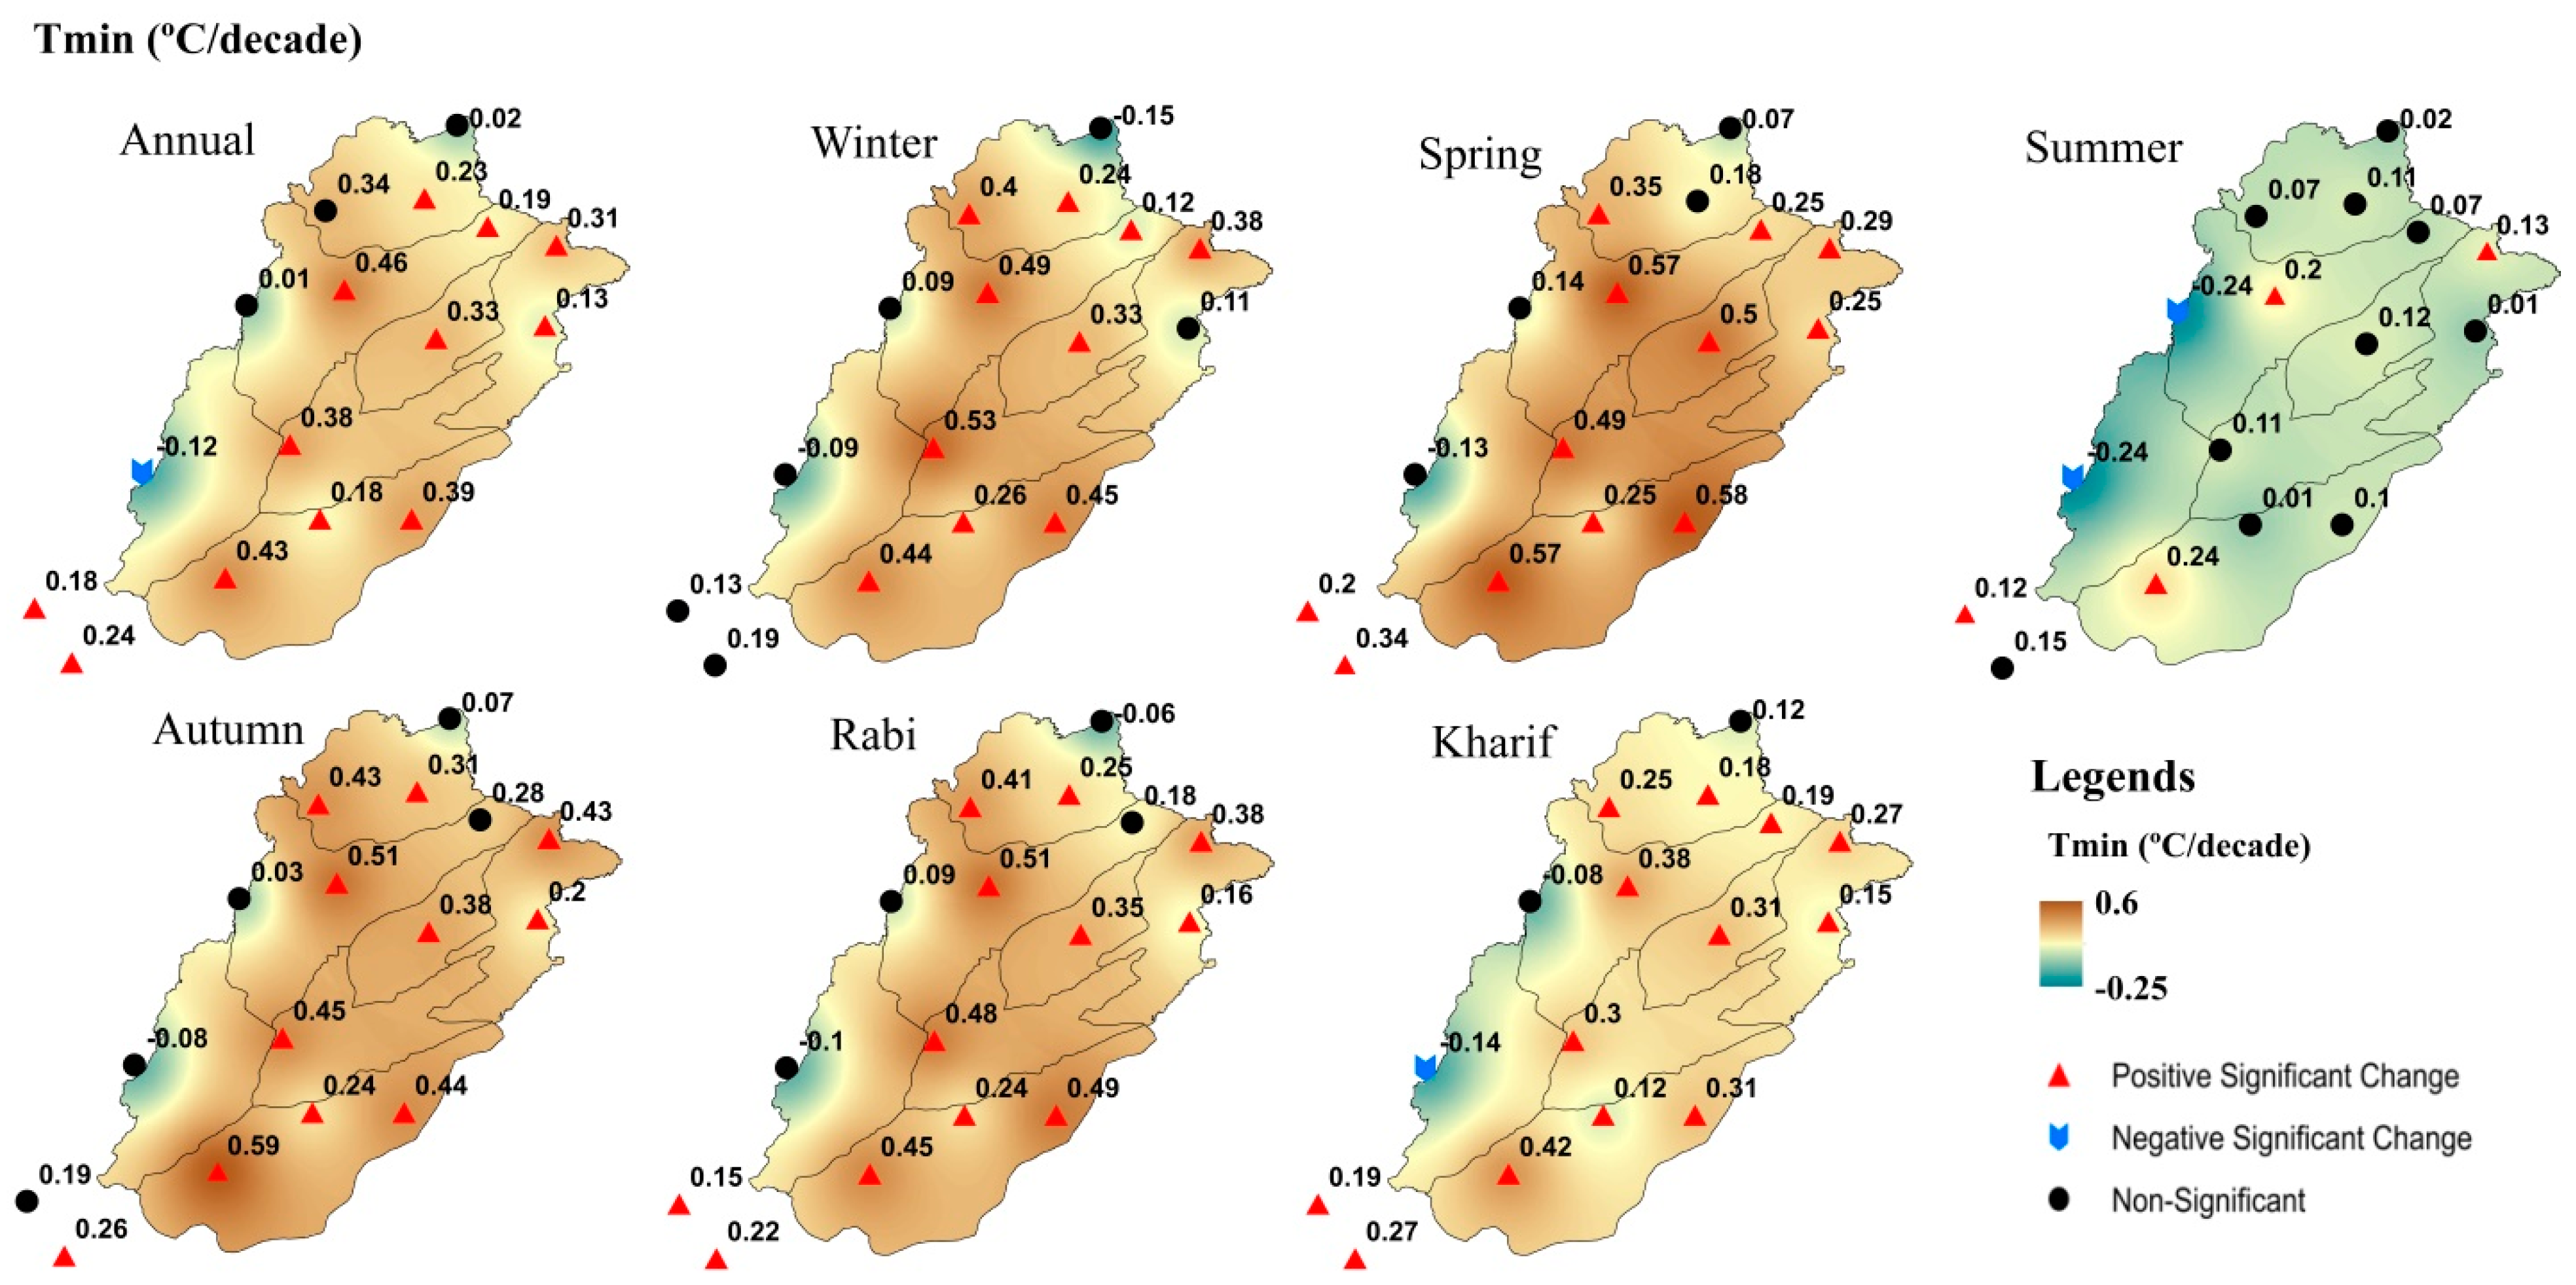
The spatial distribution of the annual and seasonal trends in Tmin is presented in Figure 4. The spatial MK trends of the annual Tmin revealed a clear tendency of warming over the entire Punjab basin except at the Barkhan station, which exhibited a significant decreasing trend with a magnitude of −0.12 °C/decade. The highest positive trend in Tmin was observed for the Sargodha station with a magnitude of 0.46 °C/decade. For the winter season, the Tmin revealed a clear increasing tendency, except for the insignificant decreasing trend in the Tmin at the Murree and Barkhan stations.
The warming in the winter season was also reported by [63] at the country level. Similarly, in the spring season, Tmin showed a significant increasing behavior at most stations located in central and southern Punjab, except for Barkhan, which had an insignificant decreasing trend. Our results are consistent with the finding of [64]. The highest increase in Tmin was observed at the Bahawalnagar station with a magnitude of 0.58 °C/decade. This value was the highest magnitude observed at the annual and seasonal scales. Meanwhile, the trend analysis of the climatic variables in the summer season revealed a conflicting signal of negative and positive slopes at most stations in Punjab. The inclinations in Tmin indicated an insignificant increasing trend for most stations except D.I. Khan and Barkhan, where significant decreases were observed. The maximum increase in Tmin was observed at the Khanpur (0.24 °C/decade) station. The variations in the autumn season indicated a clear tendency of a conspicuous increase in Tmin. The maximum increasing trend in Tmin was observed at the Khanpur station with a magnitude of 0.59 °C/decade. The results were in accordance with the findings of [16,17] for autumn Tmin over the whole region.
Furthermore, the seasonal (crop growing) trends in Tmin revealed a very clear tendency of warming at most stations, except for the northwestern stations, which showed slight insignificant decreasing trends. The highest trend magnitude in Tmin was observed at the Sarghoda (0.51 °C/decade) and Khanpur (0.42 °C/decade) stations in the Rabi and Kharif seasons, respectively. Overall, the annual and seasonal Tmin trends varied from −0.25 to 0.60 °C/decade. The present results indicated elevated trends in Tmin with a faster rate than that of Tmax in the different irrigation zones and stations, except for the high-elevation sites, and this difference could have a serious impact on the evapotranspiration rate and consequently on crop productivity [57]. In addition to direct effects on plant physiological processes, increases in Tmin could affect plant growth by changing the duration of the growing season or by changing the soil water availability [65]. It was also suggested that nighttime warming aggravates the adverse effects of soil water stress, as reported in [66], and could reduce the productivity of the rice crop by 10% for each 1 °C increase in the growing season [67]. Overall, there is a need for comprehensive research on the interaction between elevated Tmin and the ecosystem for the region under study. The interactions between climatic variability and different ecosystem characteristics are not considered in the present work because that is beyond the scope of the study.
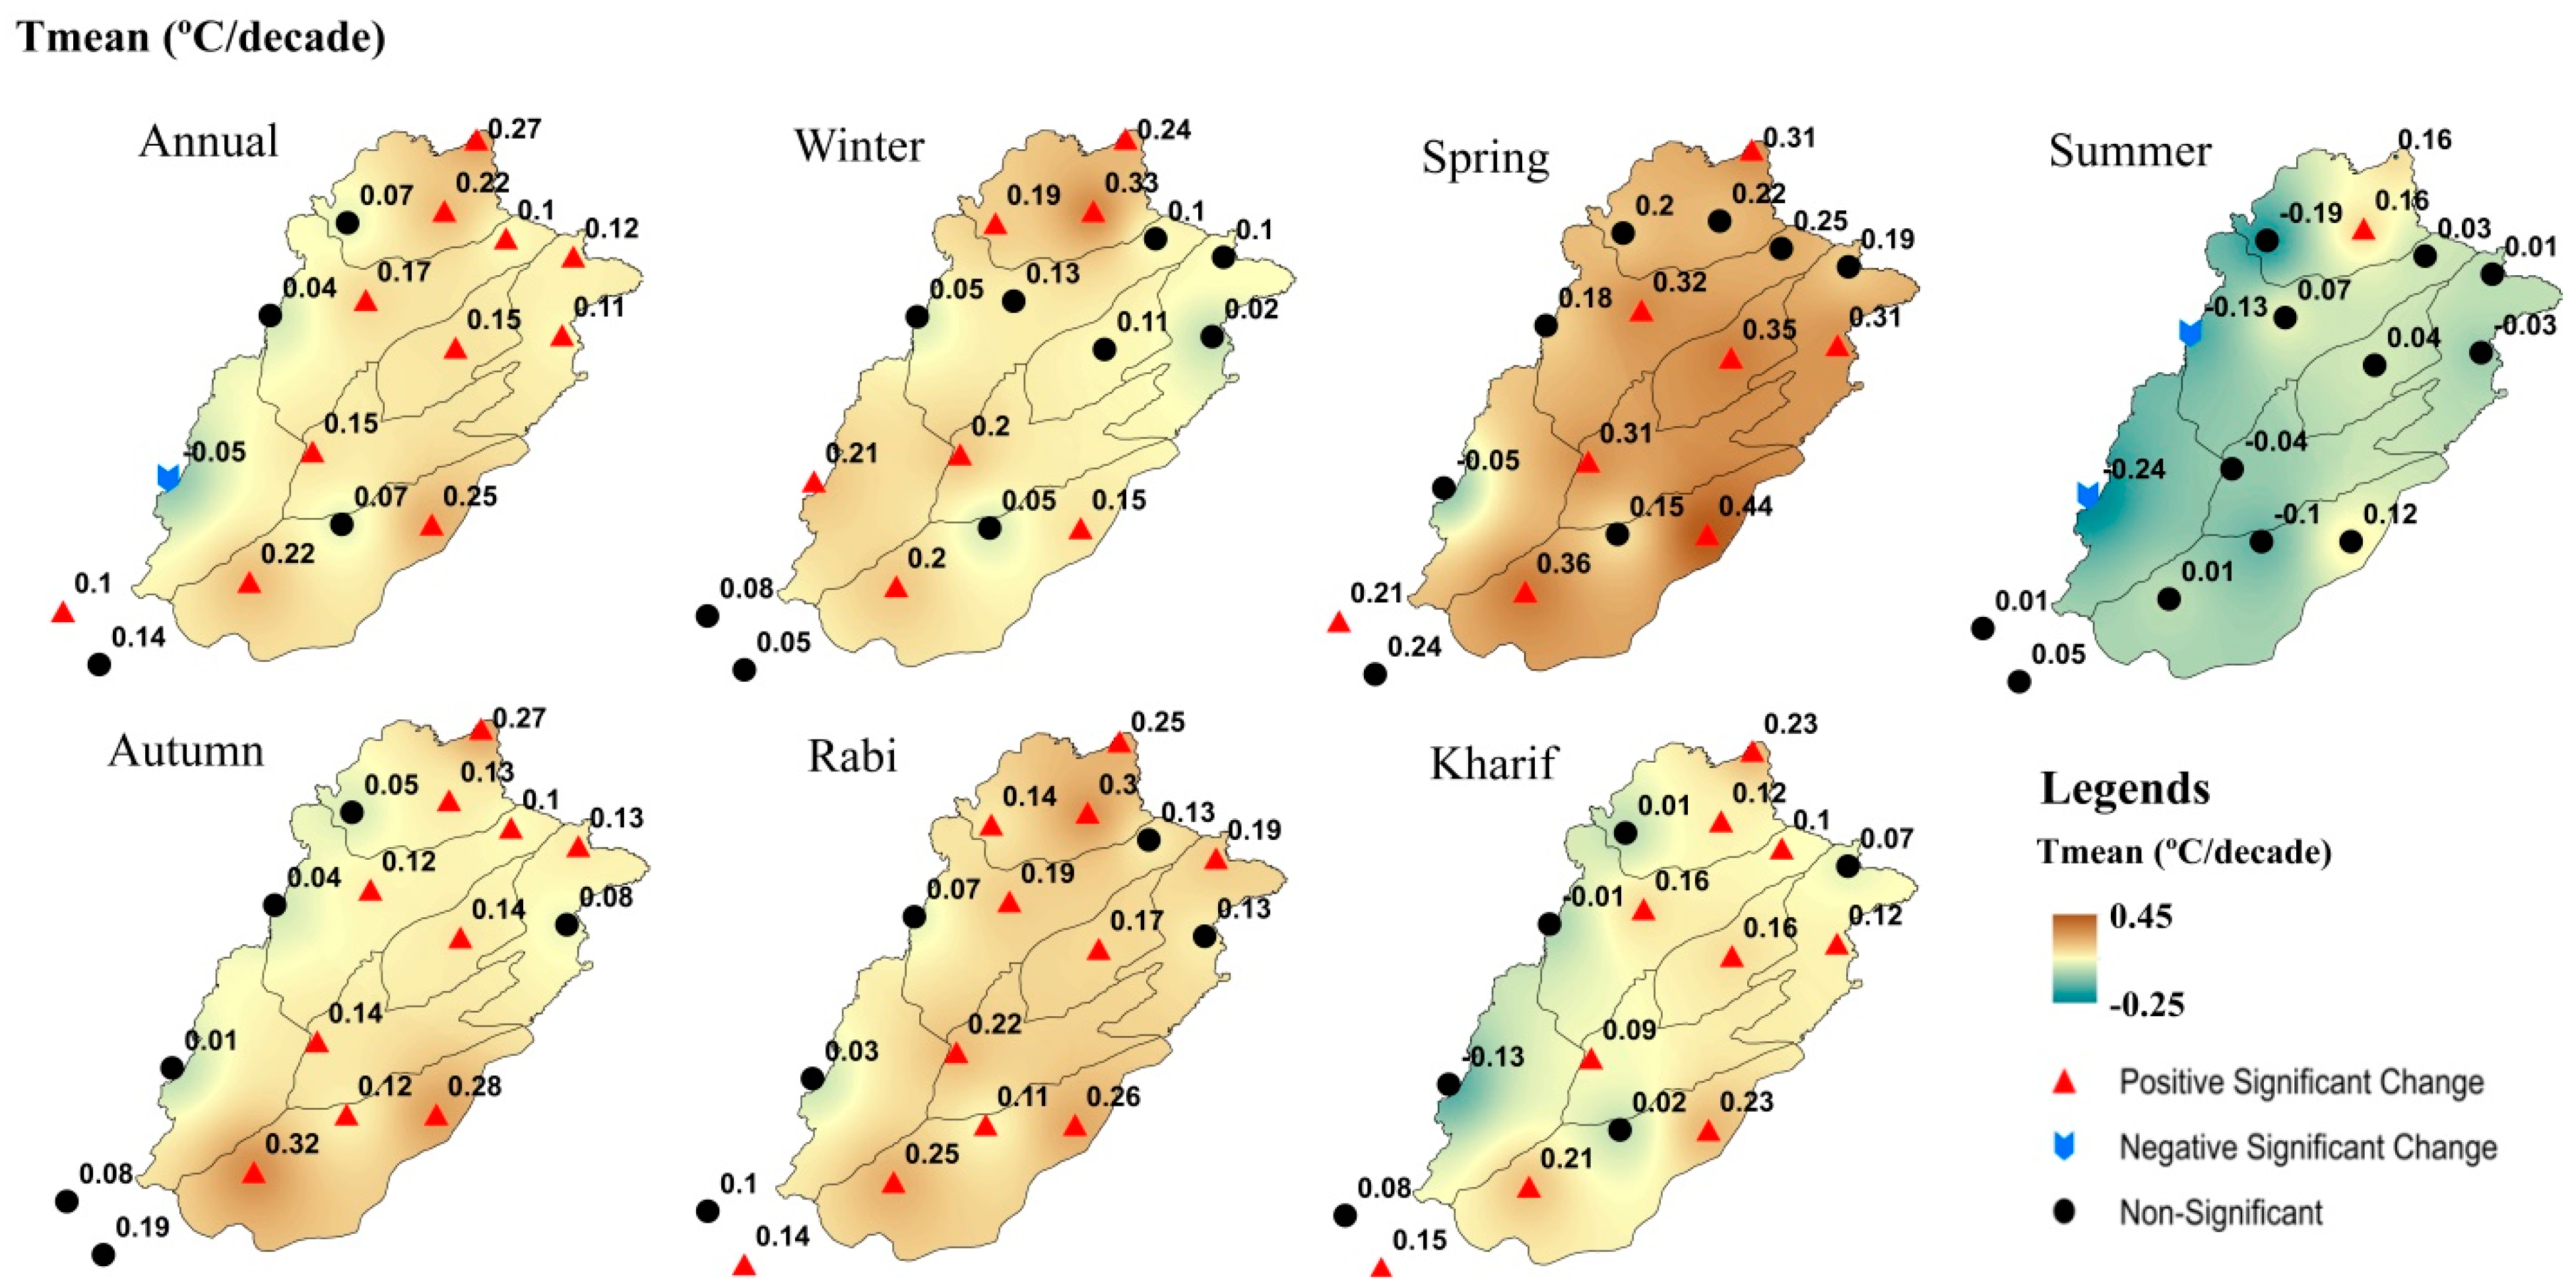
The analysis of Tmean indicated a positive absolute change and warming trends at the annual and seasonal scales, with the exception of the summer season, which showed a decreasing trend. On an annual scale, the maximum absolute change and trend was observed in the Bahawalpur zone with magnitudes of 0.64 and 0.20 °C/decade, respectively. The present results of the annual trends also confirm the findings of [68], who reported a slope of annual Tmean of approximately 0.24 °C/decade in Pakistan during 1960–2007. On a seasonal scale, the maximum change and trend were observed in the Faisalabad zone during the spring season with magnitudes of 1 and 0.34 °C/decade, respectively. Meanwhile, the summer season showed a negative trend in the entire Punjab basin. The decreasing trend of Tmean in the summer season was previously reported for other areas of Pakistan [63]. The spatial distribution of the annual and seasonal trends of Tmean is presented in Figure 5. The MK results for the annual Tmean showed a warming trend over the entire Punjab basin except for the Barkhan station, which exhibited a significant decreasing trend with a magnitude of −0.05 °C/decade. The highest positive trend in the annual Tmean was observed for the Muree station with a magnitude of 0.27 °C/decade. These observations contradict the findings of [60], who reported negative trends in temperature at high-altitude regions in the country.
In winter, the Tmean revealed a clear increasing tendency at most stations except for Muree and Barkhan. Similarly, the spring Tmean showed a significant increasing behavior at most stations, with the highest increase observed at Bahawalnagar with a magnitude of 0.44 °C/decade; however, an insignificant decreasing trend was observed at Barkhan. In contrast, the summer season revealed a conflicting signal of negative and positive slopes at most stations in Punjab, with the highest positive trend observed at Muree and Islamabad at a rate of 0.16 °C/decade. The variations in the autumn season indicated a clear tendency for a conspicuous increase in the Tmin. The maximum increasing trend in the Tmean was observed at the Khanpur station with a magnitude of 0.32 °C/decade.
Similarly, trends in Tmean during the crop growing seasons revealed a clear tendency of warming at most stations except for those in the northwest, where slight insignificant decreasing trends were observed. The highest trend magnitude in Tmean was observed at the Bahawalnagar station in the Bahawalpur zone with magnitudes of 0.26 and 0.23 °C/decade in the Rabi and Kharif seasons, respectively. The overall annual and seasonal Tmean trends varied from −0.25 to 0.45 °C/decade. The increasing trend of Tmean in different zones and stations has been related to various aspects, such as the concentration of anthropogenic activities, aerosol effects on the climate, increased cloud cover, land-use change, and industrial growth [69]. It is also suggested that there is a significant effect of urbanization and land-use change on surface warming at the local scale [70]. The present findings report a higher increasing trend of Tmean in the Faisalabad zone, which is a highly populated and industrial hub of the country; these findings are associated with the results of previous studies related to warming caused by urbanization and industrial development. [27] reported similar findings in different industrial and populated cities of Pakistan. In addition, various agricultural practices, such as increased irrigation and different cropping patterns, may have potential impacts on the Tmean trends in the Indian sub-continent [71].
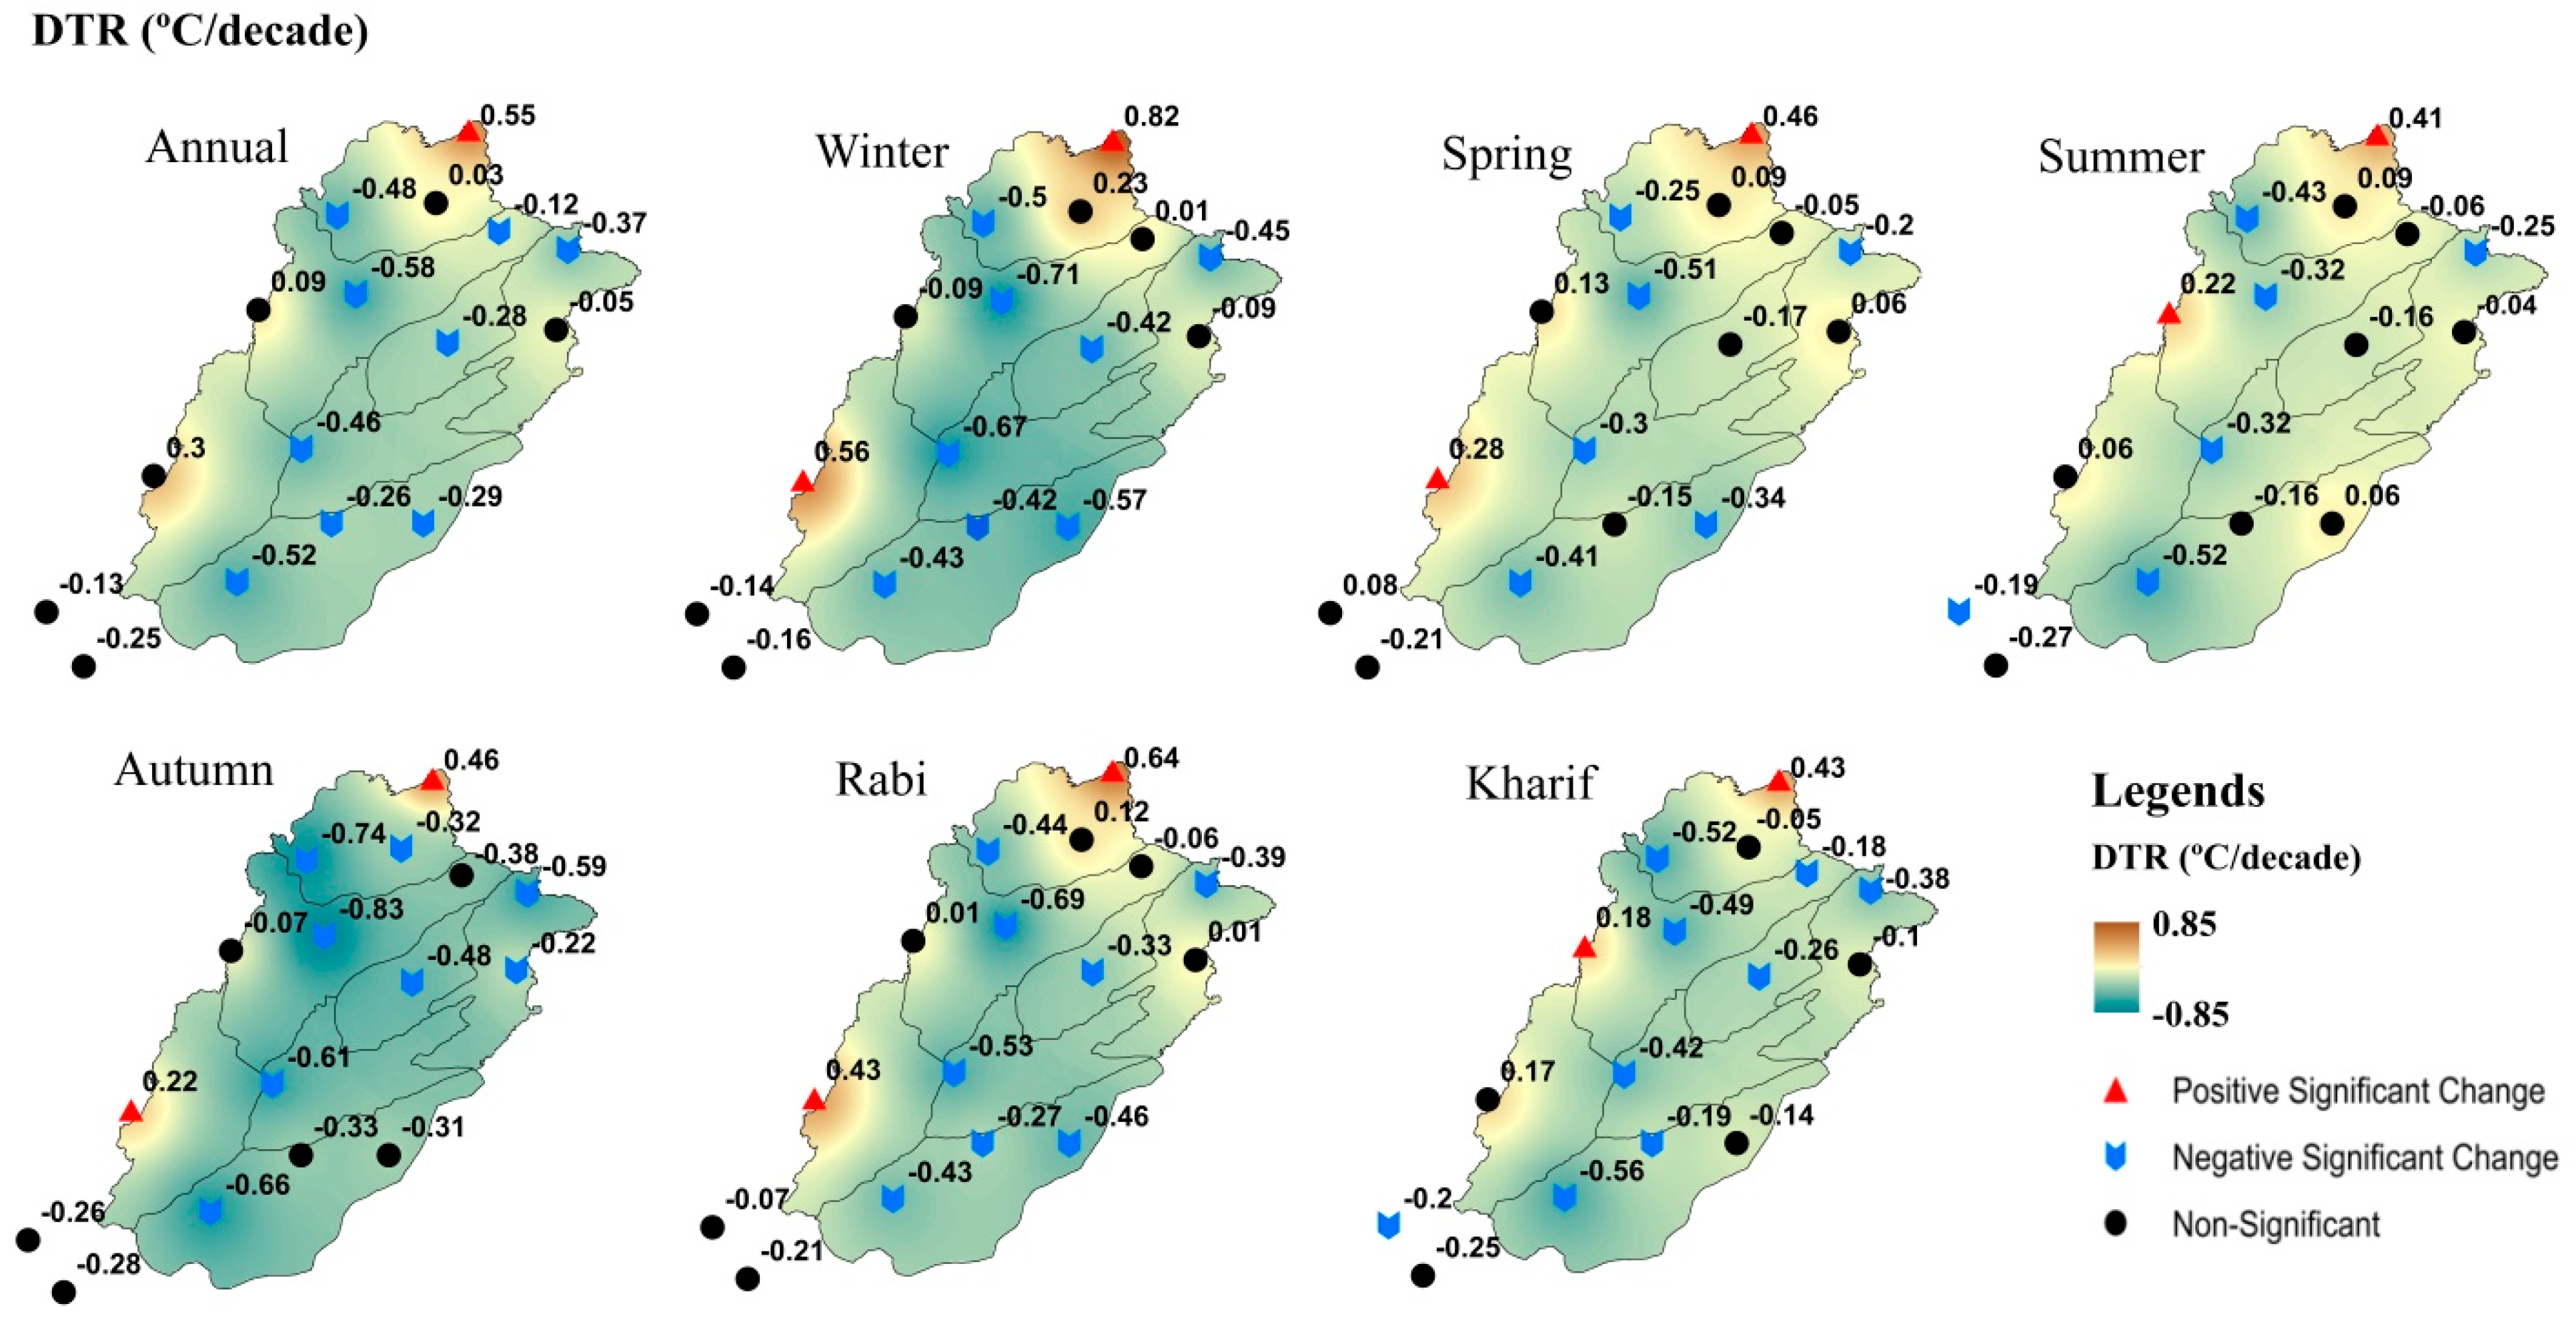
Furthermore, the magnitude of the absolute change and trends of the DTR demonstrated a significant decreasing shift at the annual and seasonal scales for the different zones except those located at higher elevations (e.g., Thal and D.G Khan showed a non-significant increasing trend in the winter, spring, and Rabi seasons). On an annual scale, the highest negative absolute change and trend was observed in the Faisalabad and Bahawalpur zones, with magnitudes of −0.79 and −0.36 °C/decade, respectively. Similarly, on a seasonal scale, the highest declining change and trend was observed in the Sarghoda zone during the autumn season, with magnitudes of −1.45 and −0.57 °C/decade, respectively. Overall, there was a clear decreasing tendency in the DTR data series over the entire study region.
The spatial distribution of the annual and seasonal trends of the DTR is presented in Figure 6. The spatial MK trends of the annual DTR indicated a declining behavior at most stations except Muree and Barkhan, where a significant increase in the DTR was observed. The maximum increasing and decreasing trends were observed at the Murree (0.55 °C/decade) and Sarghoda (−0.58 °C/decade) stations, respectively. In the winter season, most stations showed significant declining behavior, with the highest fluctuation observed at Muree and Sarghoda, at rates of 0.82 and −0.71 °C/decade, respectively. Similarly, in the spring season, most of the gauge sites showed negative trends except for the high-altitude Murree and Barkhan stations. In contrast, the summer DTR values were characterized by positive and negative trends over the entire Punjab basin, with the highest increase observed at Murree (0.41 °C/decade) and D.G. Khan (0.22 °C/decade), while the greatest reduction was observed at Khanpur station (−0.52 °C/decade).
Moreover, trends in the DTR during the crop growing seasons exhibited a negative change at most stations except those in the northern and northwestern sites, which showed significant increasing trends, particularly at Murree, D.G. Khan, and Barkhan. The overall annual and seasonal DTR trend varied from −0.85 to 0.85 °C/decade in the Rabi and Kharif seasons, respectively. The magnitude of the decrease in the DTR during Rabi was greater than that of the Kharif season. The highest increase and decrease were observed at Murree (0.64 °C/decade) and Sarghoda (−0.69 °C/decade) for the Rabi season, and at Murree (0.43 °C/decade) and Khanpur (−0.56 °C/decade) for the Kharif season. These results are also supported by previous findings in the region [27]. Several past reports suggest that there is a strong relationship between the cloud cover and DTR. More cloud cover is associated with a decrease in the DTR [72]. Similarly, the outcomes of the present study, which indicated a decreasing trend in the DTR for the autumn, summer, and Kharif seasons, indicate a negative relationship with cloud cover and the occurrence of significant precipitation during these seasons.
3.2. Annual and Seasonal Trends of Precipitation
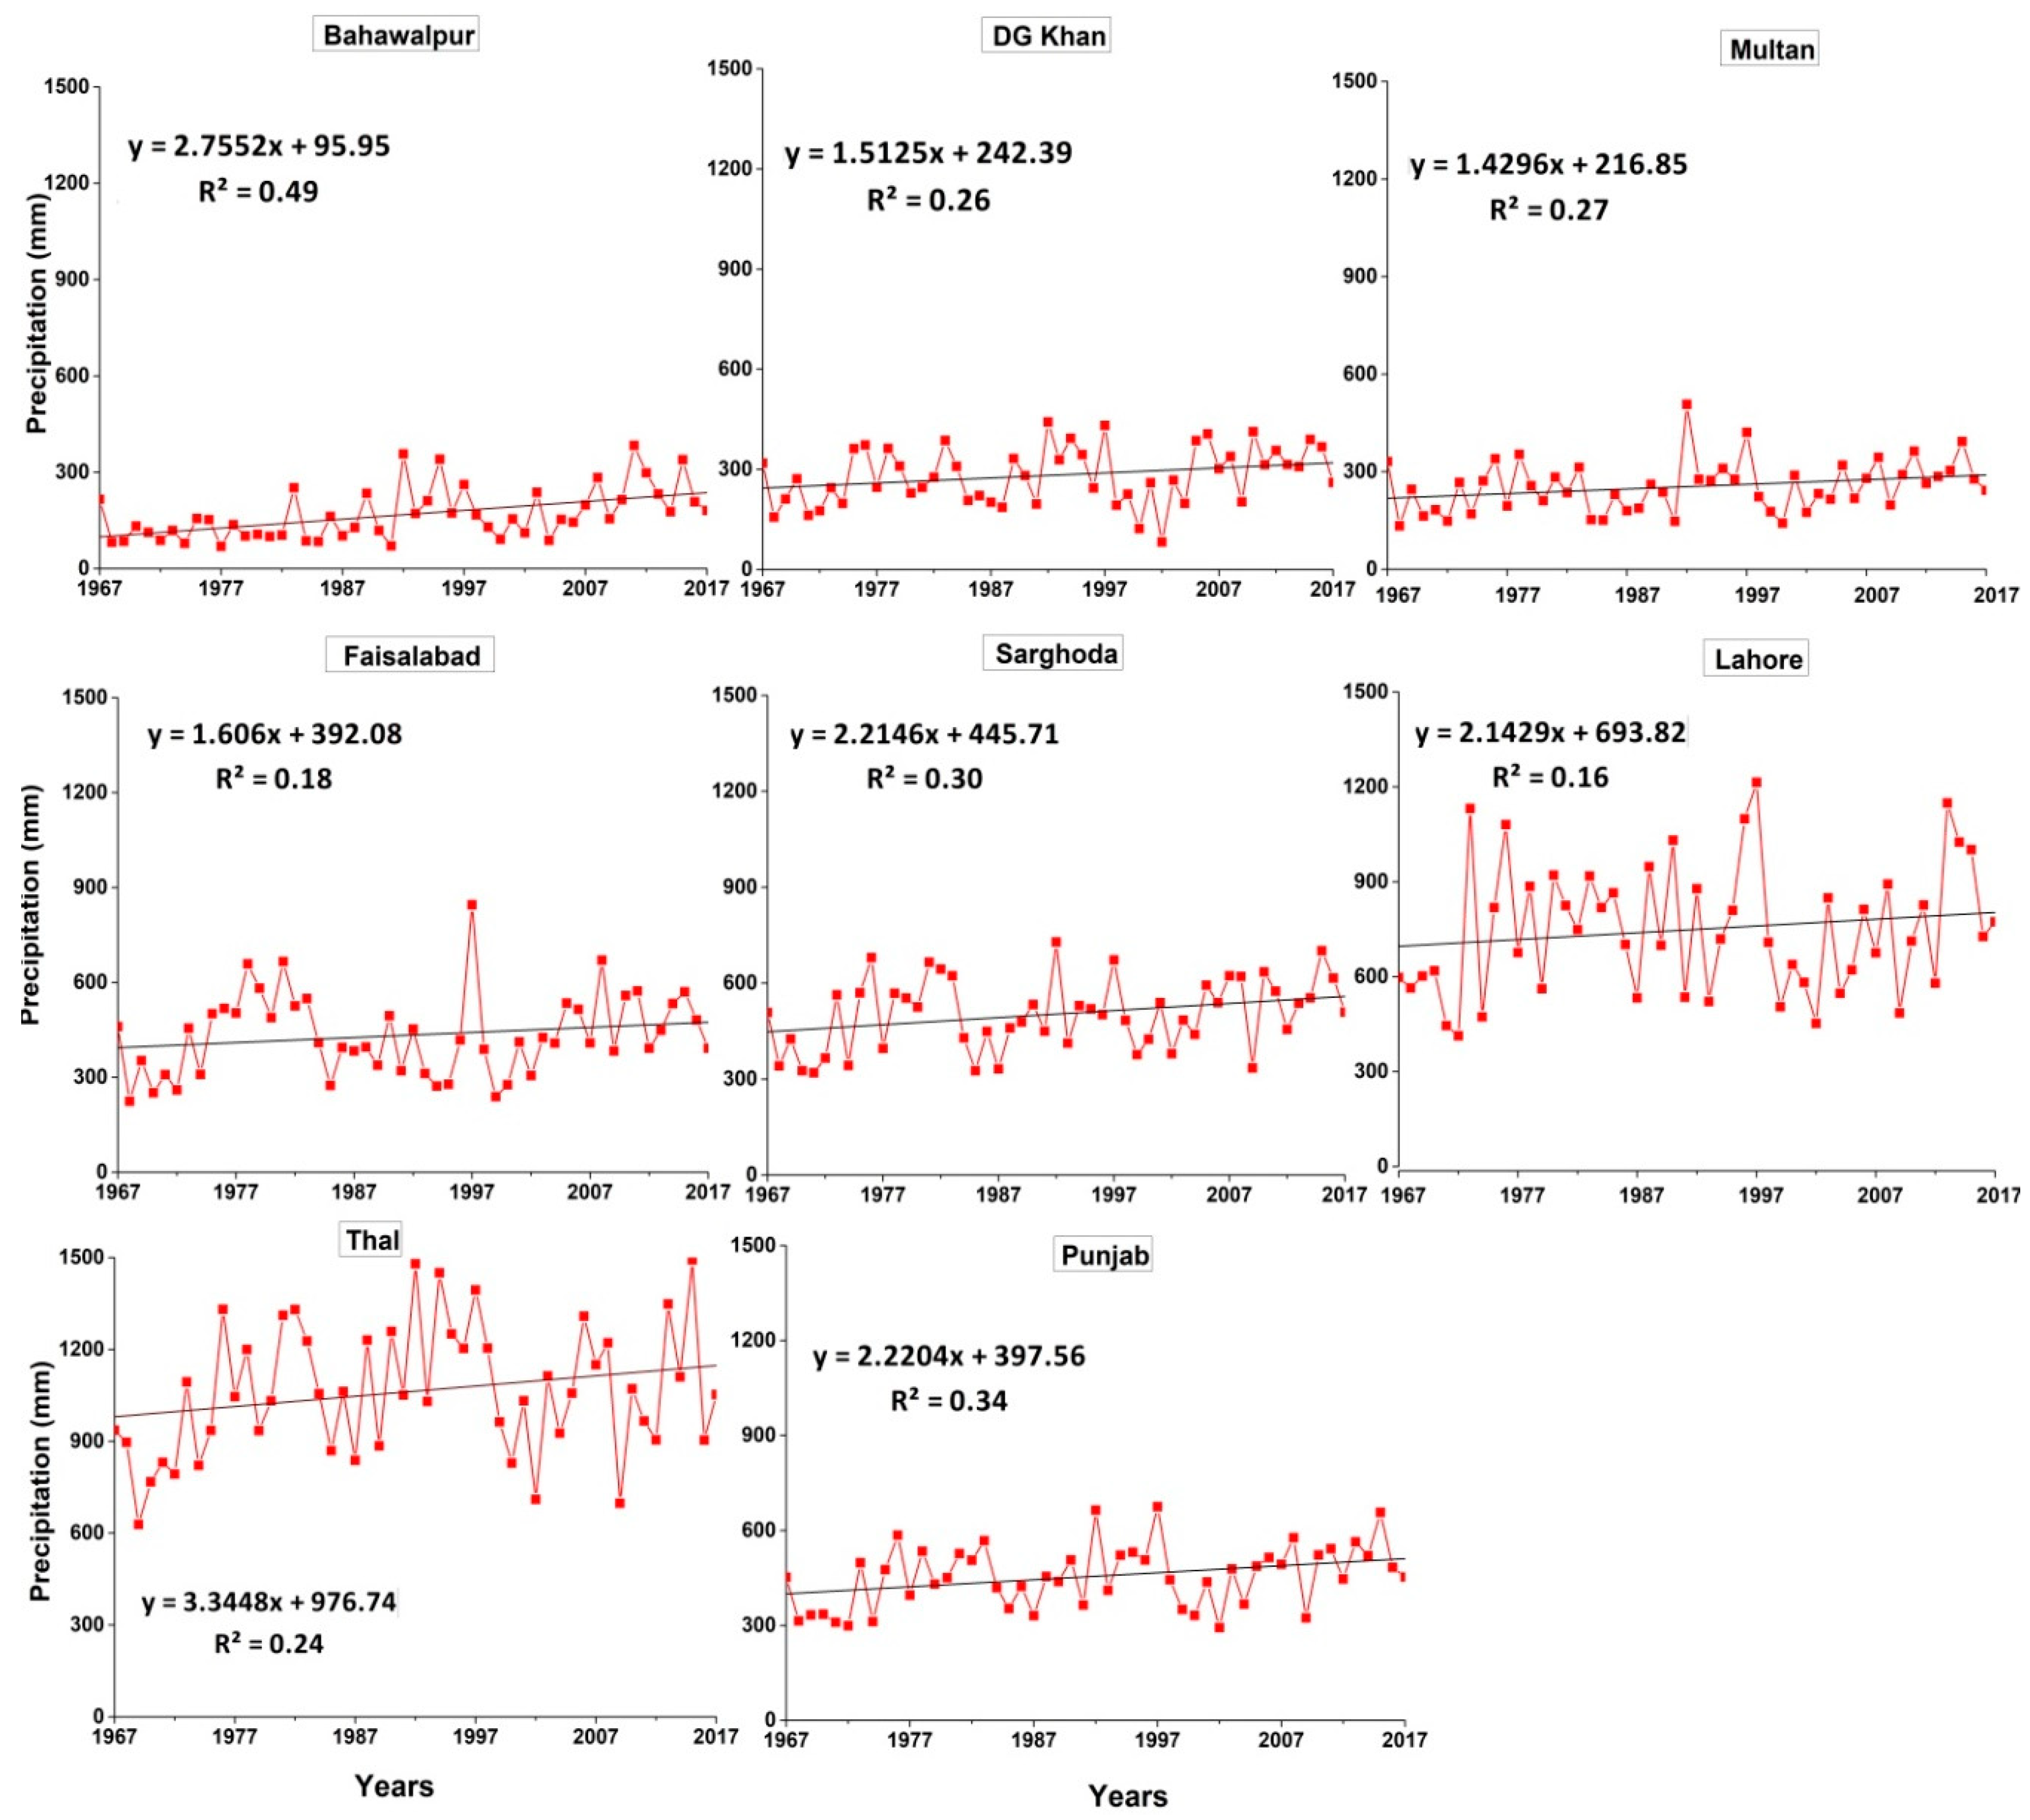
The annual time series and linear trends of precipitation for each irrigation zone and for the entire province of Punjab are presented in Figure 7. The annual average precipitation showed a slight increasing trend in all zones, including the whole basin, during the study period 1967–2017. The corresponding regression line along with r-squared values were also plotted for each irrigation zone and for all of Punjab. The southern zones, including Bahawalpur, Multan, and D.G. Khan, showed an annual precipitation frequency of approximately 100–300 mm. However, the central zone (Faisalabad, Lahore, and Sarghoda) and the northern zone (Thal) indicated precipitation frequencies of approximately 400–700 and ≥ 1000 mm, respectively. Similarly, the entire Punjab basin showed an annual precipitation of approximately 400–500 mm. The highest and lowest r-squared values were noticed in Bahawalpur and Lahore zones, respectively. The highest fluctuation in linear trend was observed in Thal followed by the Lahore zone. In addition, the annual and seasonal precipitation trends and magnitude for the entire Punjab basin obtained by the MK test and the Theil–Sen approach are presented in Table 3. Meanwhile, the annual and seasonal precipitation trends for irrigation zones other than the entire Punjab basin are presented in Table S3 in the SI. Finally, the spatial distributions of the annual and seasonal precipitation trend of the stations are presented in Figure 8.
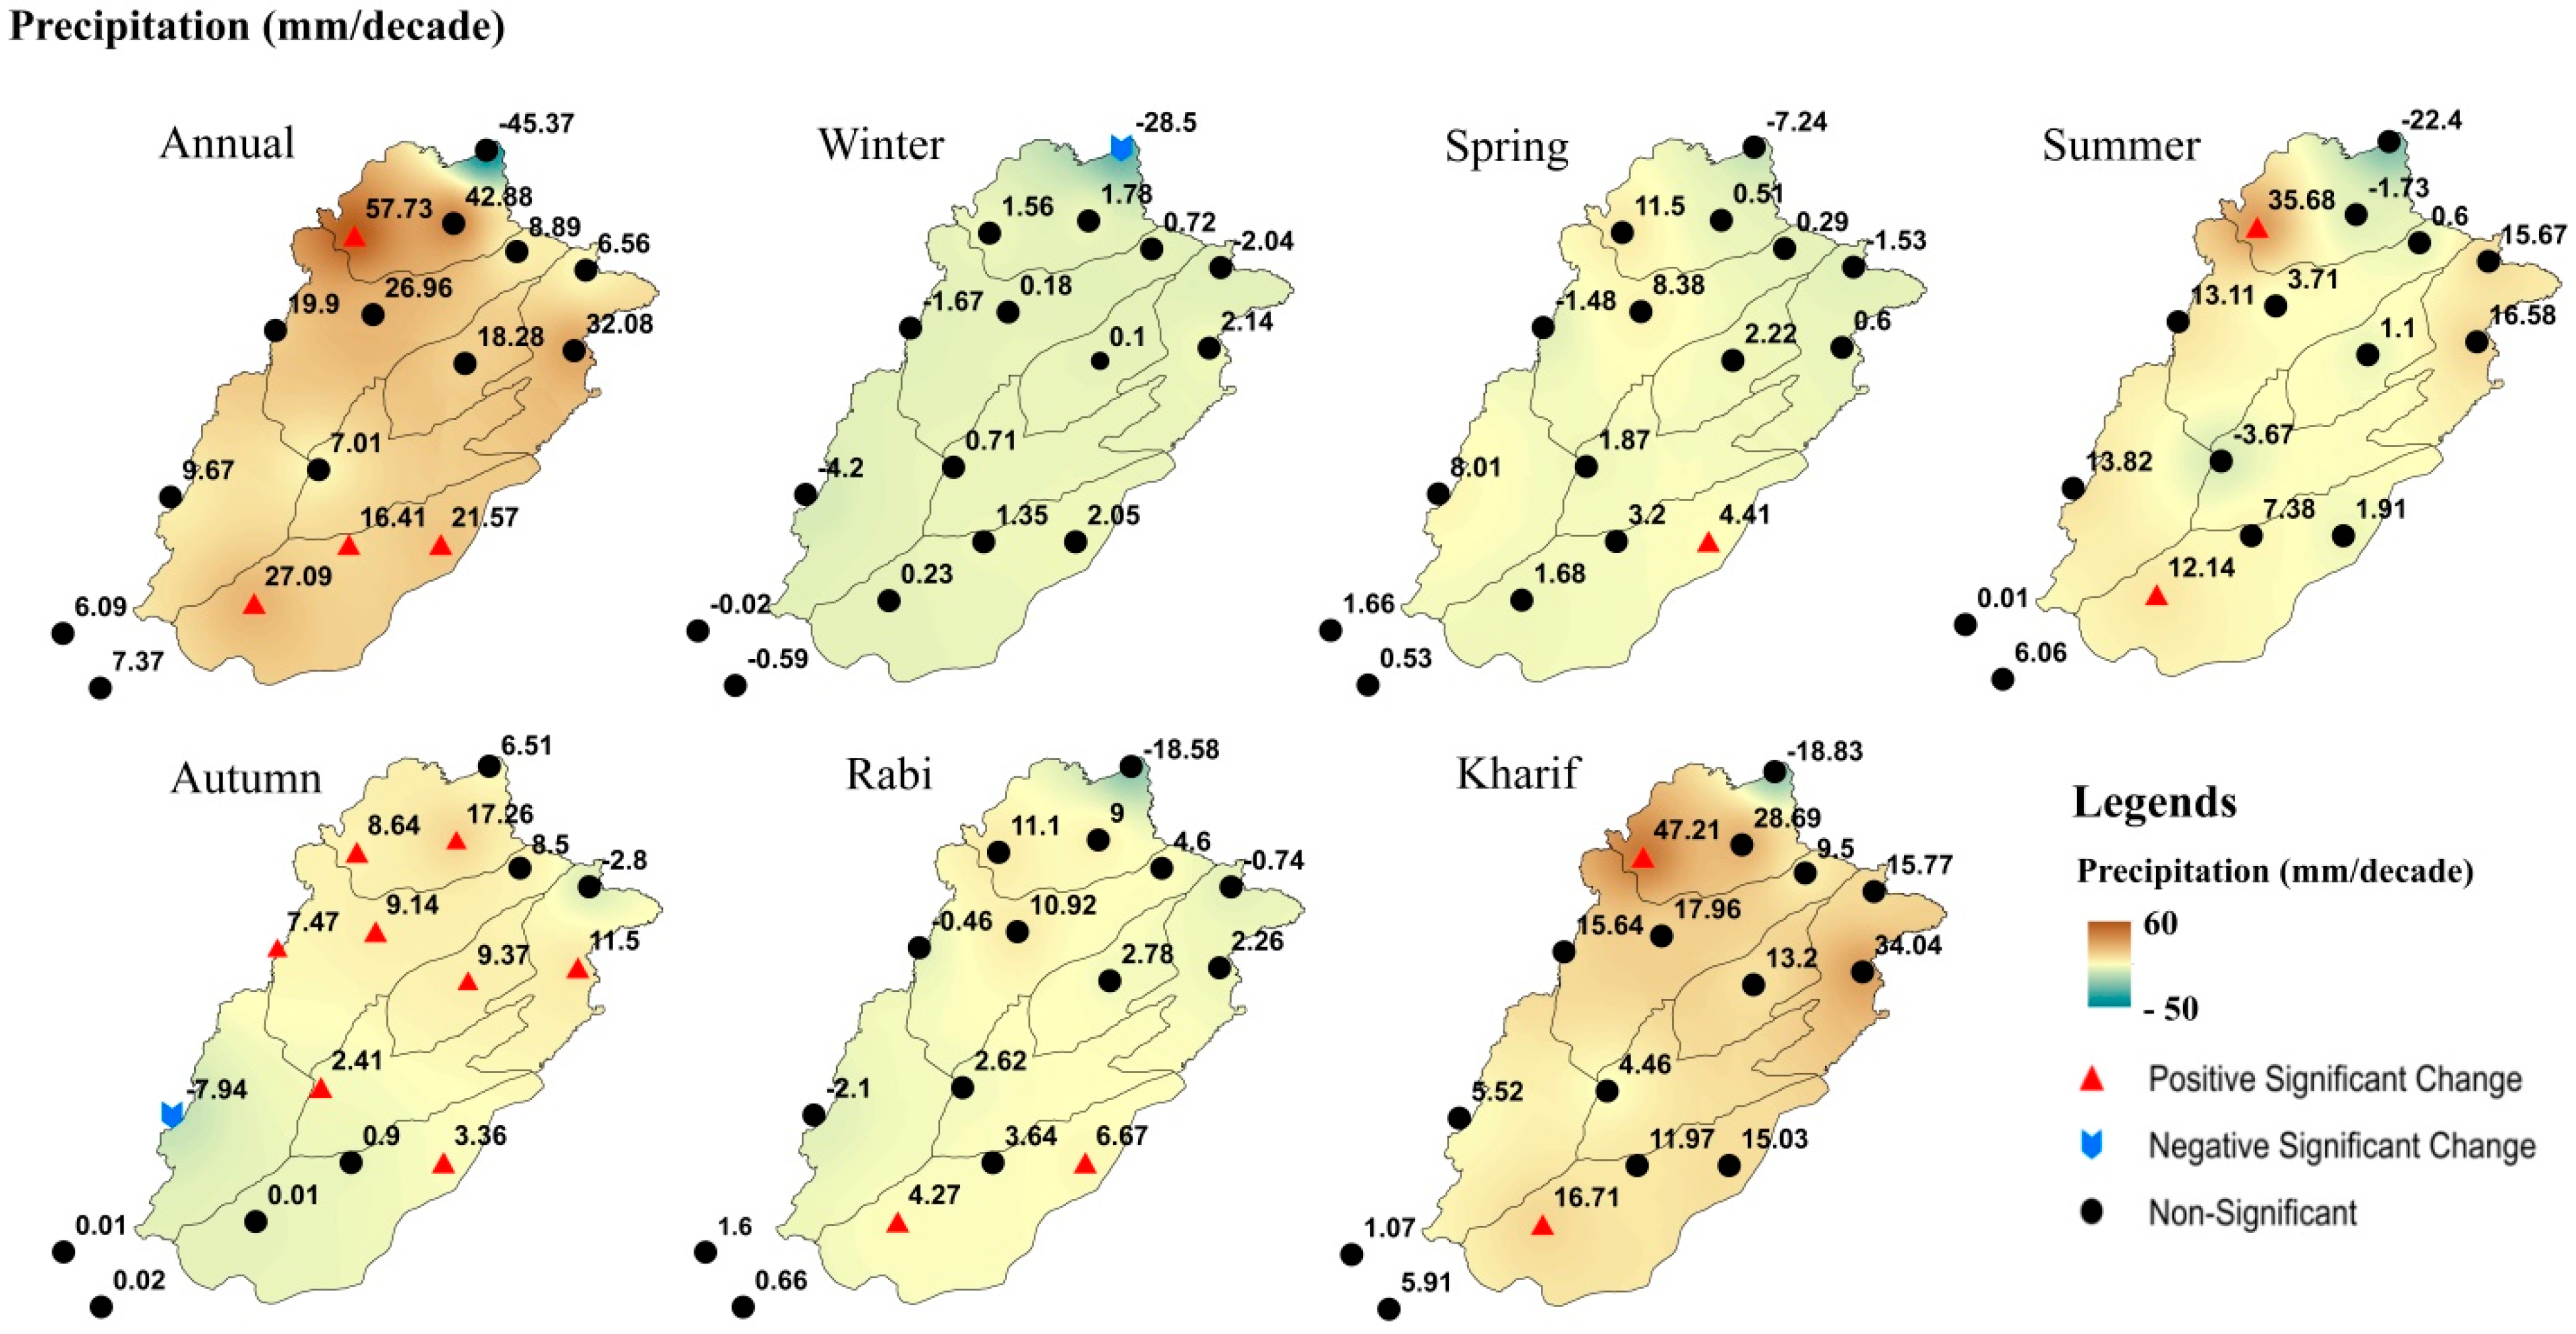
The results of the MK test indicated the wide variability of precipitation for the annual and seasonal time scales in the majority of the zones during the period 1967–2017. The annual precipitation revealed a significant increasing trend in all irrigation zones, with a magnitude ranging from 15.01 to 34.45 mm/decade. The maximum cumulative increase in annual precipitation was observed in the Thal zone (34.83 mm/decade), followed by Sarghoda (25.55 mm/decade) and Lahore (23.45 mm/decade). Similarly, the spatial distribution of the annual station trends showed that most sites were characterized by non-significant positive trends.
However, considerable positive tendencies were observed at low elevation for the Bahawalnagar, Bahawalpur, Khanpur, and Mianwali stations at rates of 16.4 21.57, 27.09, and 57.73 mm/decade, respectively. In contrast, a decreasing trend was detected for the high altitude Murre station, with a value of −45 mm/decade, in the Thal zone. The increasing trend of annual precipitation in southern Punjab contradicted the results of [73], who reported a decreasing trend in annual precipitation in this region. In winter precipitation, the negative trends were more obvious over the whole region, particularly in the D.G. Khan and Bahawalpur zones, including the entire Punjab basin. The negative trend in the winter season correlates with the findings of [74], who reported a decreasing trend of precipitation in different areas of Pakistan. The spatial distribution of the MK results showed that most stations revealed insignificant signs of positive and negative slopes during the winter season. Most of the winter precipitation was due to western disturbances, and consequently, most stations in the study area indicated less precipitation. The maximum decline in winter precipitation was observed at the high-altitude Murree station (−28.5 mm/decade) in the Thal zone.
The zonal trend analysis of spring precipitation showed insignificant negative and positive increases over the whole basin. However, prominent increasing trends were observed in the southern zone, while significant decreasing trends were observed in the northern zones of Punjab. The spatial distribution of the MK trends indicated variable fluctuations for most stations. However, a significant increase was observed for the Bahawalnagar station, at the rate of 4.41 mm/decade. In summer precipitation, the MK trend results illustrated the insignificant positive trends in different irrigation zones and all of Punjab, except for the Bahawalpur zone, which showed a significant increase during summer. The highest increase was assessed in the Lahore and Sargodha zones, with a rate of 11.76 mm/decade. Similarly, the spatial distribution of the station trends indicated an insignificant increasing trend over the entire study area. According to the MK analysis results, 13 stations showed positive trends, while three stations revealed negative tendencies. A significant increasing trend was detected at the Mianwali and Khanpur stations, with magnitudes of 35.68 and 12.14 mm/decade, respectively.
Meanwhile, autumn precipitation revealed a significant increasing trend in all zones, with a magnitude ranging from 0.78 to 9.81 mm/decade, with the highest increase assessed in the Thal zone at a rate of 9.81 mm/decade. The spatial distribution of station trends indicated that 14 out of 16 stations showed a positive trend; Barkhan and Sialkot, which exhibited negative trends, were the two outliers. The highest increasing trend was observed at the Islamabad station (17.26 mm/decade) in the Thal zone.
In addition, the precipitation trends during the crop growing seasons (Rabi and Kharif) indicated non-significant increasing trends in most zones except for the Bahawalpur zone, which showed a significant increase during the Rabi and Kharif seasons, while the entire Punjab basin showed a significant increase during the Kharif season. The highest increase was observed during the crop growing period at Sarghoda in the Rabi and Thal zones in the Kharif season, with rates of 5.22 and 30.92 mm/decade, respectively. The overall zonal trend magnitudes ranged from 1.23 to 5.22 and 11.68 to 30.92 mm/decade during the Rabi and Kharif seasons, respectively. Moreover, the spatial distribution of precipitation trends during the crop growing seasons (Rabi and Kharif) indicated considerable fluctuations at most stations. Furthermore, the station precipitation indicated that the magnitude of the positive trend in Kharif was more pronounced than in the Rabi season. The overall annual and seasonal precipitation trends magnitude ranged from −50 to 60 mm/decade during the Rabi and Kharif seasons, respectively. The findings of the current investigation for summer season contradict the results of [64], who reported a considerable increase in precipitation during the summer season. Moreover, the entire Punjab basin showed a significant increasing trend of precipitation for the annual and autumn seasons, with magnitudes of 22.24 and 5.23 mm/decade, respectively. Similar results were reported by [21] in different regions in Pakistan. In addition, the Bahawalpur zone indicated a slight significant increasing trend in precipitation at all time scales except for the winter season. Altogether, the study area exhibited a significant positive shift in annual and autumn precipitation compared with that in the other seasons.
3.3. Annual and Seasonal Elevation-Dependent Trends (EDTs)
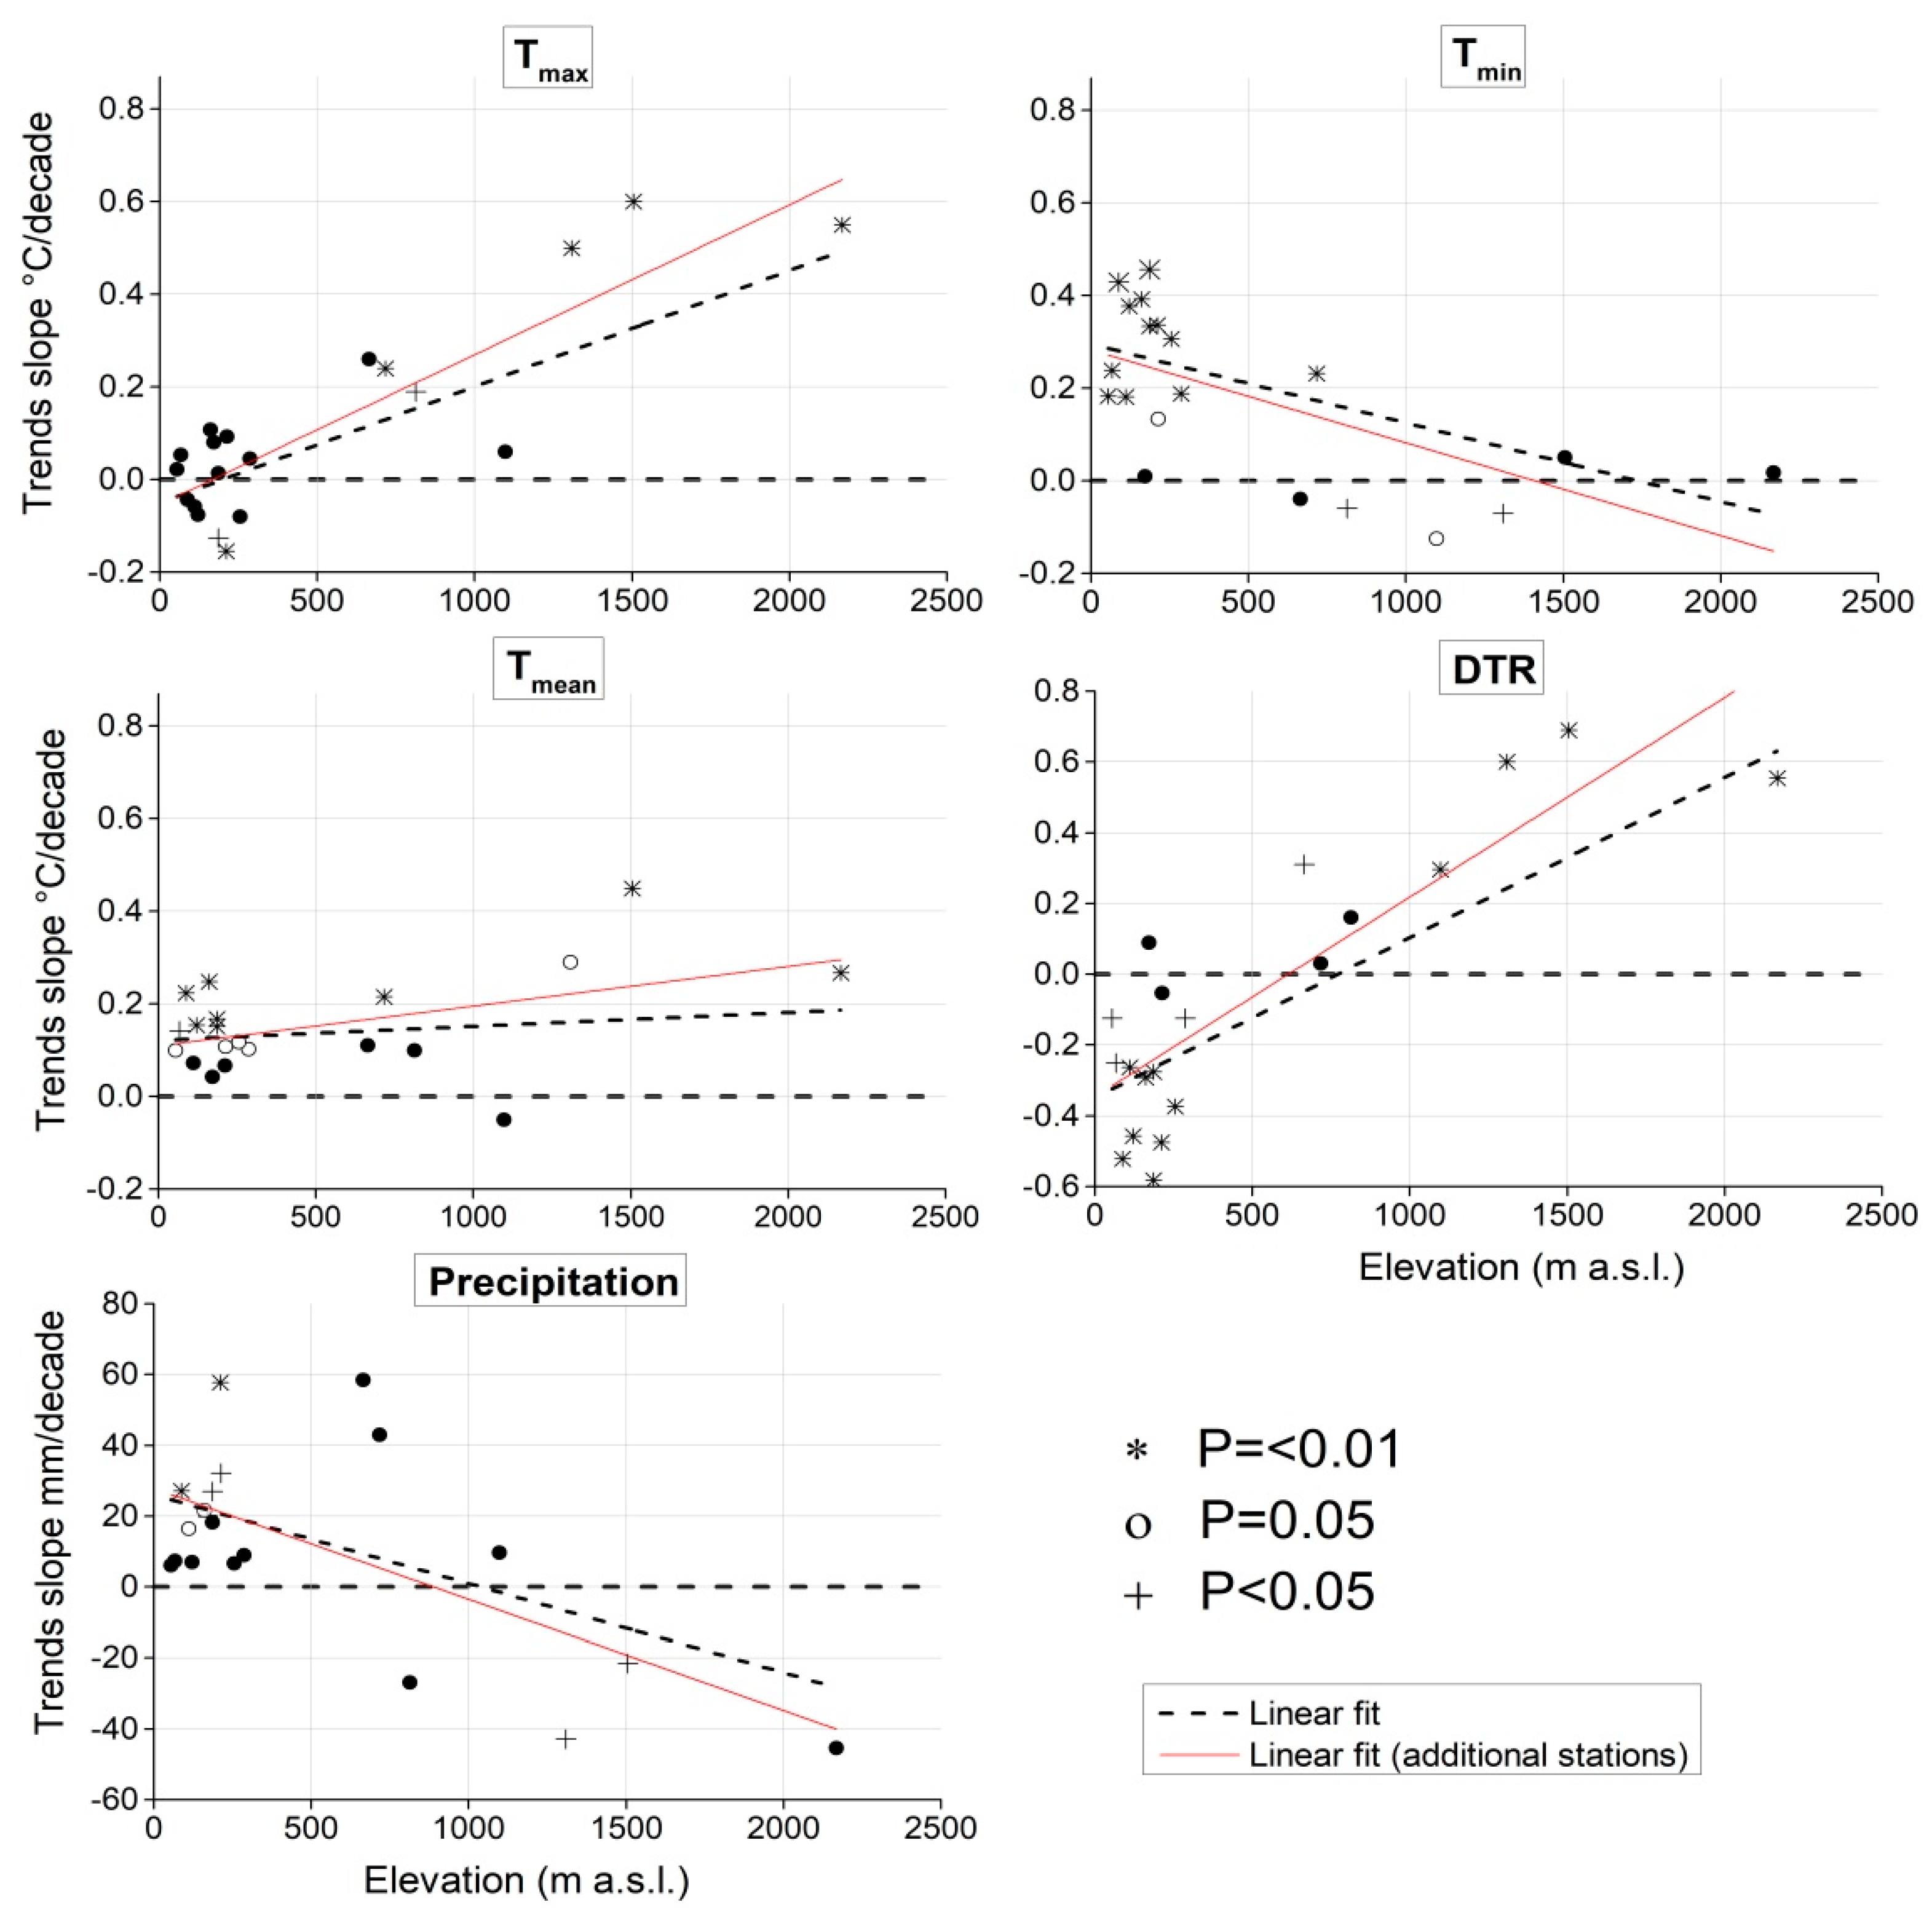
The analysis for annual EDT in temperature indices (Tmax, Tmin, Tmean, DTR) and precipitation over the Punjab region is shown in Figure 9 (black dash linear fit). The geographical locations of the available stations in the region of Punjab located between the elevation range of 55–2167 (m a.s.l.) are shown in Table 1. The EDT result of Tmax indicates a positive gradient from lower to higher elevation with significant positive trends observed at higher elevation (above 500 m a.s.l.), with the magnitude of 0.55 and 0.24 °C/decade at Murree and Islamabad stations (p =< 0.01). On the contrary, the EDT of Tmin showed a negative slope from lower to higher elevation with an overall significant positive trend for most of the low elevation stations, except for the higher-altitude Barkhan and Murree stations. Furthermore, the EDT in Tmean showed a moderate increasing slope from lower to higher altitude with significant positive trends for most of the stations. However, the EDT in DTR showed a steep slope from lower to higher altitude with a significant increase at higher elevation stations above 500 m a.s.l. On the other hand, the EDT analysis for precipitation indicates a negative gradient from lower to higher altitude, with overall positive trend at most of the stations at lower elevation and significant negative or no trend for the high-altitude stations, particularly Murree and Barkhan (above 1000 m a.s.l.). Overall, the results indicate an increase in the amount of precipitation at low-elevation stations, whereas, a decrease in amount of precipitation was noticed for higher-elevation stations. A decrease in precipitation for higher elevation (above 4000 m a.s.l) was also reported by [22] for different sub-basin levels in Upper Indus Basin by assembling different reanalysis products, during the period 1997–2014. As a consequence, decline in river flows was reported for different sub-basins in the UIB. Similarly, the results of EDTs for temperature indices and precipitation, obtained in this study, concur well with the findings of [75] who reported a similar increasing trend in Tmax and DTR, as well as a decrease in Tmin and precipitation trends, with a moderate positive slope in Tmean from lower to higher gradient across the longitudinal extension of Nepal. However, for the region of Punjab, most stations are located at less elevation, yet the results obtained from the EDT analysis are highly significant, particularly for the futuristic studies related to the elevation-dependence warming over the region under study.
The EDT analysis presented in Figure 9 (black dash linear fit) deals with the 16 stations located between the elevation range of 55–2167 m a.s.l. However, most of the stations in this range are located below 500 m a.s.l., in exception to three stations (Murree, Islambad, and Barkhan) that are located above the said elevation. Generally, a chance of uncertainty could exist if such a smaller number of stations (above 500 m a.s.l) are utilized to perform EDT analysis,. Under such scenario, the uncertainty of the gauge data can be minimized by assembling different atmospheric reanalysis products. For instance, [22,76] quantified the uncertainty of climatic variables by using six atmospheric reanalysis products for cross validation of river flow data for poorly gauged regions. Meanwhile, another way to deal with such scenarios, where there are lesser number of stations involved, is to extend the analysis by incorporating data from a greater number of stations (if available) and compare the outcomes with the results obtained for analysis performed for fewer number of stations. Therefore, in order to address any ambiguities related to the results of our analysis for elevation-dependent temperature indices (Tmax, Tmin, Tmean, DTR) and precipitation trends, we performed the additional EDT analysis by including a greater number of higher elevation meteorological stations (Table 4). The stations that cover the continuous elevation range above 500–2167 m a.s.l. were incorporated in the EDT extension analysis, as can be seen through Figure 9 (red linear fit). The outcome of EDT analysis, which included the additional stations, indicated a similar linear trends in the precipitation and the temperature indices, as was observed for the stations under the scope of this study (the trend is presented as black dash linear fit). Moreover, the additional stations in EDT extension analysis confirmed an analogous trend pattern, and data quality with overall higher range of magnitude and better statistical significance along the extension gradient of the Punjab and surrounding region at higher elevation.
The spatial and seasonal distributions of EDT of temperature indices (Tmax, Tmin, Tmean, DTR) and precipitation over the Punjab region are shown in Figure 3, Figure 4, Figure 5, Figure 6 and Figure 8. Significant positive trends in Tmax were noticed at higher-elevation (above 500 m a.s.l.) sites in Thal and D.G. Khan zones, while low-elevation sites did not show any trend or negative slopes at the seasonal scale. The highest positive trends were observed in the winter season at higher-elevation Murree, Islamabad, and Barkhan sites, with the magnitude of 0.74, 0.47, and 0.48 °C/decade, respectively. The trend in Tmax is highly sensitive with respect to the elevation and can be easily detected by spatial distribution of trends. The current findings of Tmax trends are in consistence with the results of [75], wherein higher trends in temperature in Nepal at elevations above 1000 m a.s.l. were reported and were said to be homogenous for all seasons. Similarly, [77] reported the increasing trends of Tmax at higher elevation in Nepal during the 1990s, without finding any further significant dependence of these trends on the elevation levels.
Further, in our study, EDT in Tmin revealed positive slopes for most of the sites at low elevation, while negative or no trends in Tmin were observed for all seasons at high-elevation (above 500 m a.s.l) sites. In accordance with Tmin trends, the seasonal and spatial EDT of Tmean indicates the positive significant slopes in all seasons except summer. However, the higher-altitude Islamabad and Murree stations in the Thal zone showed an increasing trend during the summer season. In case of DTR, the higher-altitude (above 500 m a.s.l.) sites (i.e., Murree, Islamabad, and Barkhan stations) showed positive slopes in all seasons, while the highest trends were observed in the winter season with the magnitude of 0.82, 0.23, and 0.56 °C/decade, respectively. In addition, the low-elevation sites (less than 500 m a.s.l.) indicated negative DTR trends at the seasonal scale. The results of increasing trends in Tmax and DTR are related to the decrease in the cloud cover, while the precipitation at higher elevation are consistent with the previous findings by [78] for Central Asia and [79] for India, where similar results were reported, owing to a decrease in cloud cover and precipitation, with the increase in temperature trends. The seasonal and spatial EDT of precipitation showed the positive slopes at low elevation sites in all seasons, with an exception for the winter season where negative trends were observed for most of the sites. Moreover, the higher-elevation sites (above 1000 m a.s.l.) showed a negative pattern, which resulted in a negative gradient in precipitation amounts from lower to higher elevation across the Punjab region. The outcomes of this study regarding the increase in amounts of precipitation for lower-elevation regions are consistent with the findings of [80,81], wherein the increase in precipitation amounts and its impact on the increase in Tmin trends were discussed. The results of the higher decreasing trend of precipitation at annual and seasonal scale at higher elevation, and particularly results of Murree station (above 2000 m a.s.l), are associated with findings of [75,82], which reported a decreasing trend in annual precipitation from lower to higher elevation. The possible explanation of decreasing precipitation at higher elevation could be linked with the decrease in cloud cover and soil moisture and, ultimately, increase in day time and decrease in nighttime temperatures (Tmax and Tmin) [83,84]. However, an in-depth investigation is required to explore, in detail, the quantitative relationship between precipitation and temperature indices and to learn about the main driving factors for such asymmetric trends of temperature and precipitation for Punjab, which is a highly worthwhile region with respect to the agriculture and economy of Pakistan.
4. Conclusions
The present study investigated the spatiotemporal heterogeneity of air temperature (e.g., Tmax, Tmin, Tmean, DTR) and precipitation on annual and seasonal time scales at seven irrigation zones of Punjab, using 51 years (1967–2017) of data from 16 meteorological stations in the region. The major findings of this paper are as follows:
On an annual scale, Tmin and Tmean showed a noteworthy increasing trend, while Tmax showed conflicting signals of insignificant positive and negative trends, except in the high-elevation Thal zone. Moreover, the rate of Tmin increased faster than that of Tmax, resulting in a reduction in the DTR, except for that in the Thal zone. Overall, southern Punjab, especially Bahwalapur, was the most vulnerable zone to warming, while the high-altitude Thal zone was more susceptible to changes in Tmax.
On a seasonal scale, warming was more pronounced during the spring, followed by winter and autumn seasons. Moreover, on a temporal and spatial scale, the summer season exhibited negative trends at most zones and gauges, with the exception of high-altitude sites. Overall, central Punjab, especially Faisalabad, was the most vulnerable zone to warming during the spring season.
The analysis of precipitation data indicated the wide variability of positive and negative trends during 1967–2017. However, the annual and autumn precipitation showed a significant increase, while the winter precipitation showed a decreasing trend in most zones, including the entire Punjab region.
The spatial and temporal elevation-dependent trend analysis solidified our conclusion regarding the increment in warming (Tmax) at higher-elevation (above 500 m a.s.l.) than low-elevation stations, on both annual and seasonal scales. In contrast, the nighttime temperature (Tmin) showed opposite trends at higher and lower elevation stations, with moderate increase in Tmean slope from lower to higher altitude over the longitudinal extension of the study region. Furthermore, we witnessed an increasing trend in DTR and a decrease in precipitation amounts at higher-elevation stations (above 1000 m a.s.l.) and vice versa at the lower-elevation stations. The warming at higher-elevation stations could be related to the decrease in precipitation and cloud cover and the changing soil moisture conditions during the study period.
Overall, our study progresses scientific knowledge regarding spatial and temporal heterogeneity in climate variables of different irrigation zones of Punjab by using historical station data. The results provide preliminary and significant information of climate variability depending on the station elevations across the longitudinal section of Punjab and surrounding higher-elevation regions. Additionally, this study may prove significant to predict heterogeneity of climate trends for other regions in the world with similar meteorological conditions; this information could enable better agricultural management. Altogether, we found evidence of seasonal variations and warming that could influence the water resources and agricultural sectors of the whole study region. Industrialization, urbanization, and other anthropogenic interventions could be possible reasons for warming at zonal and station levels. On the basis of our analysis, we highly recommend further investigations to establish the cause of warming and to explore the relationship between temperature indices and precipitation at zonal and station levels across the elevation gradient of Punjab.
Supplementary Materials
The following are available online at https://www.mdpi.com/2073-4441/11/9/1916/s1, Figure S1: Time serial autocorrelation (lag-1) for the climatic variables of different zones, Table S1: Meteorological station weighing factors corresponding to their zones, where Ab is the area defined by intersection of Thiessen polygon and zone boundary; Tw is Thiessen-based station weights (i.e., Ab/Az); Ac is the values of temperature indices (Tmax, Tmin, Tmean, and DTR) and precipitation for different zones during the study period, Table S2: Absolute changes of temperature (°C) indices in the Punjab irrigation zones during the second period (1992–2017) compared to the first period (1967–1991) by using Mann–Whitney (MW) test, Table S3: Annual and seasonal trends of temperatures (°C/decade) indices and precipitation (mm /decade) in the Punjab irrigation zones during 1967–2017 by using Mann–Kendall and Sen’s slope.
Author Contributions
X.L. and Y.C. supervised and designed this study. Z.N. conducted the researech and wrote the manuscript. Y.G. and X.W. assisted in formatting and data analysis. N.N. provided the additional data and helped in editing the manuscript
Funding
This study is supported by the National Natural Science Foundation of China through Grant No. 41871280, for this study.
Acknowledgments
We used in-situ data from the Pakistan Meteorological Department (PMD). The authors cordially appreciate the PMD whose efforts made it possible for us to access the data. We also acknowledge the support of the CAS-TWAS president fellowship program for PhD.
Conflicts of Interest
The authors declare that there is no conflicts of interest.
References
- Tabari, H.; Somee, B.S.; Zadeh, M.R. Testing for long-term trends in climatic variables in Iran. Atmos. Res. 2011, 100, 132–140. [Google Scholar] [CrossRef]
- Stocker, T.F.; Qin, D.; Plattner, G.-K.; Tignor, M.M.B.; Allen, S.K.; Boschung, J.; Nauels, A.; Xia, Y.; Bex, V.; Midgley, P.M. Climate Change 2013: The Physical Science Basis, Contribution of Working Group I to the Fifth Assessment Report of IPCC the Intergovernmental Panel on Climate Change; Cambridge University Press: Cambridge, UK; New York, NY, USA, 2014. [Google Scholar]
- New, M.; Todd, M.; Hulme, M.; Jones, P. Precipitation measurements and trends in the twentieth century. Int. J. Climatol. A J. R. Meteorol. Soc. 2001, 21, 1889–1922. [Google Scholar] [CrossRef]
- Jain, S.K.; Kumar, V.; Saharia, M. Analysis of rainfall and temperature trends in northeast India. Int. J. Climatol. 2013, 33, 968–978. [Google Scholar] [CrossRef]
- Chou, C.; Chiang, J.C.H.; Lan, C.-W.; Chung, C.-H.; Liao, Y.-C.; Lee, C.-J. Increase in the range between wet and dry season precipitation. Nat. Geosci. 2013, 6, 263. [Google Scholar] [CrossRef]
- Karl, T.R.; Knight, R.W.; Easterling, D.R.; Quayle, R.G. Indices of climate change for the United States. Bull. Am. Meteorol. Soc. 1996, 77, 279–292. [Google Scholar] [CrossRef]
- Jin, M.; Dickinson, R.E. New observational evidence for global warming from satellite. Geophys. Res. Lett. 2002, 29, 31–39. [Google Scholar] [CrossRef]
- Shahid, S.; Harun, S.B.; Katimon, A. Changes in diurnal temperature range in Bangladesh during the time period 1961–2008. Atmos. Res. 2012, 118, 260–270. [Google Scholar] [CrossRef]
- del Río, S.; Iqbal, M.A.; Cano-Ortiz, A.; Herrero, L.; Hassan, A.; Penas, A. Recent mean temperature trends in Pakistan and links with teleconnection patterns. Int. J. Climatol. 2013, 33, 277–290. [Google Scholar] [CrossRef]
- Sang, Y.-F. Spatial and temporal variability of daily temperature in the Yangtze River Delta, China. Atmos. Res. 2012, 112, 12–24. [Google Scholar] [CrossRef]
- Jones, P.D. Maximum and minimum temperature trends in Ireland, Italy, Thailand, Turkey and Bangladesh. Atmos. Res. 1995, 37, 67–78. [Google Scholar] [CrossRef]
- Pepin, N.; Bradley, R.S.; Diaz, H.F.; Baraër, M.; Caceres, E.B.; Forsythe, N.; Fowler, H.; Greenwood, G.; Hashmi, M.Z.; Liu, X.D.; et al. Elevation-dependent warming in mountain regions of the world. Nat. Clim. Chang. 2015, 5, 424. [Google Scholar]
- Gleick, P.H. Climate change, hydrology, and water resources. Rev. Geophys. 1989, 27, 329–344. [Google Scholar] [CrossRef]
- Rao, B.B.; Chowdary, P.S.; Sandeep, V.M.; Rao, V.U.M.; Venkateswarlu, B. Rising minimum temperature trends over India in recent decades: Implications for agricultural production. Glob. Planet. Chang. 2014, 117, 1–8. [Google Scholar]
- Ullah, S.; You, Q.; Ullah, W.; Ali, A. Observed changes in precipitation in China-Pakistan economic corridor during 1980–2016. Atmos. Res. 2018, 210, 1–14. [Google Scholar] [CrossRef]
- Khan, N.; Shahid, S.; Ismail, T.B.; Wang, X.J. Spatial distribution of unidirectional trends in temperature and temperature extremes in Pakistan. Theor. Appl. Climatol. 2018, 136, 899–913. [Google Scholar] [CrossRef]
- Qasim, M.; Khlaid, S.; Shams, D.F. Spatiotemporal variations and trends in minimum and maximum temperatures of Pakistan. J. Appl. Environ. Biol. Sci. 2014, 4, 85–93. [Google Scholar]
- Khattak, M.S.; Babel, M.S.; Sharif, M. Hydro-meteorological trends in the upper Indus River basin in Pakistan. Clim. Res. 2011, 46, 103–119. [Google Scholar] [CrossRef]
- Rahman, G.; Dawood, M. Spatial and temporal variation of rainfall and drought in Khyber Pakhtunkhwa Province of Pakistan during 1971–2015. Arab. J. Geosci. 2018, 11, 46. [Google Scholar] [CrossRef]
- Ahmad, I.; Tang, D.; Wang, T.; Wang, M.; Wagan, B. Precipitation trends over time using Mann-Kendall and spearman’s rho tests in swat river basin, Pakistan. Adv. Meteorol. 2015, 2015, 431860. [Google Scholar] [CrossRef]
- Ahmed, K.; Shahid, S.; Chung, E.-S.; Ismail, T.; Wang, X.-J. Spatial distribution of secular trends in annual and seasonal precipitation over Pakistan. Clim. Res. 2017, 74, 95–107. [Google Scholar] [CrossRef]
- Reggiani, P.; Mukhopadhyay, B.; Rientjes, T.H.M.; Khan, A. A joint analysis of river runoff and meteorological forcing in the Karakoram, Upper Indus Basin. Hydrol. Process. 2016, 31, 409–430. [Google Scholar] [CrossRef]
- Hanif, M.; Khan, A.H.; Adnan, S. Latitudinal precipitation characteristics and trends in Pakistan. J. Hydrol. 2013, 492, 266–272. [Google Scholar] [CrossRef]
- Hussain, M.S.; Lee, S. Long-term variability and changes of the precipitation regime in Pakistan. Asia-Pac. J. Atmos. Sci. 2014, 50, 271–282. [Google Scholar] [CrossRef]
- Khattak, M.S.; Reman, N.U.; Sharif, M.; Khan, M.A. Analysis of streamflow data for trend detection on major rivers of the Indus Basin. J. Himal. Earth Sci. 2015, 48, 87. [Google Scholar]
- Ashiq, M.W.; Zhao, C.; Ni, J.; Akhtar, M. GIS-based high-resolution spatial interpolation of precipitation in mountain–plain areas of Upper Pakistan for regional climate change impact studies. Theor. Appl. Climatol. 2010, 99, 239. [Google Scholar] [CrossRef]
- Abbas, F. Analysis of a historical (1981–2010) temperature record of the Punjab province of Pakistan. Earth Interact. 2013, 17, 1–23. [Google Scholar] [CrossRef]
- Khan, S.U.; Hasan, M.U.; Khan, F.K.; Bari, A. Climate classification of Pakistan. In Proceedings of the 2010 Balwois Conference, Ohrid, Republic of Macedonia, 25–29 May 2010; pp. 1–47. [Google Scholar]
- Asmat, U.; Athar, H.; Nabeel, A.; Latif, M. An AOGCM based assessment of interseasonal variability in Pakistan. Clim. Dyn. 2018, 50, 349–373. [Google Scholar] [CrossRef]
- Fowler, H.J.; Archer, D.R. Conflicting signals of climatic change in the Upper Indus Basin. J. Clim. 2006, 19, 4276–4293. [Google Scholar] [CrossRef]
- Iqbal, M.; Wen, J.; Wang, X.; Lan, Y.; Tian, H.; Anjum, M.N.; Adnan, M. Assessment of air temperature trends in the Source Region of Yellow River and its sub-basins, China. Asia-Pac. J. Atmos. Sci. 2018, 54, 111–123. [Google Scholar] [CrossRef]
- Mitchell, J.M.; Dzerdzeevskii, B.; Flohn, H.; Hofmeyr, W.L.; Lamb, H.H.; Rao, K.N.; Wallén, C.C. Climatic Change; Technical Note, No. 79; World Meteorological Organization: Geneva, Switzerland, 1966; p. 99. [Google Scholar]
- Peterson, T.C.; Easterling, D.R.; Karl, T.R.; Groisman, P.; Nicholls, N.; Plummer, N.; Torok, S.; Auer, I.; Boehm, R.; Gullett, D. Homogeneity adjustments of in situ atmospheric climate data: A review. Int. J. Climatol. A J. R. Meteorol. Soc. 1998, 18, 1493–1517. [Google Scholar] [CrossRef]
- Kohler, M.A. On the use of double-mass analysis for testing the consistency of meteorological records and for making required adjustments. Bull. Am. Meteorol. Soc. 1949, 30, 188–195. [Google Scholar] [CrossRef]
- Buishand, T.A. Some methods for testing the homogeneity of rainfall records. J. Hydrol. 1982, 58, 11–27. [Google Scholar] [CrossRef]
- Thiessen, A.H. Precipitation averages for large areas. Mon. Weather Rev. 1911, 39, 1082–1089. [Google Scholar] [CrossRef]
- Shi, H.; Li, T.; Wei, J.; Fu, W.; Wang, G. Spatial and temporal characteristics of precipitation over the Three-River Headwaters region during 1961–2014. J. Hydrol. Reg. Stud. 2016, 6, 52–65. [Google Scholar] [CrossRef]
- Yuan, F.; Berndtsson, R.; Zhang, L.; Uvo, C.B.; Hao, Z.; Wang, X.; Yasuda, H. Hydro climatic trend and periodicity for the source region of the Yellow River. J. Hydrol. Eng. 2015, 20, 5015003. [Google Scholar] [CrossRef]
- Cheng, M.; Wang, Y.; Engel, B.; Zhang, W.; Peng, H.; Chen, X.; Xia, H. Performance assessment of spatial interpolation of precipitation for hydrological process simulation in the Three Gorges Basin. Water 2017, 9, 838. [Google Scholar] [CrossRef]
- Partal, T. Wavelet transform-based analysis of periodicities and trends of Sakarya basin (Turkey) streamflow data. River Res. Appl. 2010, 26, 695–711. [Google Scholar] [CrossRef]
- Sonali, P.; Kumar, D.N. Review of trend detection methods and their application to detect temperature changes in India. J. Hydrol. 2013, 476, 212–227. [Google Scholar] [CrossRef]
- Sayemuzzaman, M.; Jha, M.K. Seasonal and annual precipitation time series trend analysis in North Carolina, United States. Atmos. Res. 2014, 137, 183–194. [Google Scholar] [CrossRef]
- Nachar, N. The Mann-Whitney U: A test for assessing whether two independent samples come from the same distribution. Tutor. Quant. Methods Psychol. 2008, 4, 13–20. [Google Scholar] [CrossRef]
- Yang, P.; Xia, J.; Zhang, Y.; Hong, S. Temporal and spatial variations of precipitation in Northwest China during 1960–2013. Atmos. Res. 2017, 183, 283–295. [Google Scholar] [CrossRef]
- Chen, Y.; Guan, Y.; Shao, G.; Zhang, D. Investigating trends in streamflow and precipitation in Huangfuchuan Basin with wavelet analysis and the Mann-Kendall test. Water 2016, 8, 77. [Google Scholar] [CrossRef]
- Zamani, R.; Mirabbasi, R.; Abdollahi, S.; Jhajharia, D. Streamflow trend analysis by considering autocorrelation structure, long-term persistence, and Hurst coefficient in a semi-arid region of Iran. Theor. Appl. Climatol. 2017, 129, 33–45. [Google Scholar] [CrossRef]
- Salman, S.A.; Shahid, S.; Ismail, T.; Chung, E.-S.; Al-Abadi, A.M. Long-term trends in daily temperature extremes in Iraq. Atmos. Res. 2017, 198, 97–107. [Google Scholar] [CrossRef]
- Mann, H.B. Nonparametric tests against trend. Econom. J. Econom. Soc. 1945, 13, 245–259. [Google Scholar] [CrossRef]
- Kendall, M.G. Rank Correlation Measures; Charles Griffin Book Series; Oxford University Press: London, UK, 1975; Volume 202, p. 15. [Google Scholar]
- Hu, Y.; Maskey, S.; Uhlenbrook, S.; Zhao, H. Streamflow trends and climate linkages in the source region of the Yellow River, China. Hydrol. Process. 2011, 25, 3399–3411. [Google Scholar] [CrossRef]
- Sen, P.K. Estimates of the regression coefficient based on Kendall’s tau. J. Am. Stat. Assoc. 1968, 63, 1379–1389. [Google Scholar] [CrossRef]
- Kunkel, K.E.; Andsager, K.; Easterling, D.R. Long-term trends in extreme precipitation events over the conterminous United States and Canada. J. Clim. 1999, 12, 2515–2527. [Google Scholar] [CrossRef]
- Zhang, X.; Zwiers, F.W.; Li, G. Monte Carlo experiments on the detection of trends in extreme values. J. Clim. 2004, 17, 1945–1952. [Google Scholar] [CrossRef]
- Johnston, K.; Ver Hoef, J.M.; Krivoruchko, K.; Lucas, N. Using ArcGIS Geostatistical Analyst; ESRI Press: Redlands, CA, USA, 2001; Volume 380. [Google Scholar]
- Price, C.; Michaelides, S.; Pashiardis, S.; Alpert, P. Long term changes in diurnal temperature range in Cyprus. Atmos. Res. 1999, 51, 85–98. [Google Scholar] [CrossRef] [Green Version]
- Isaaks, E.H.; Srivastava, R.M. An Introduction to Applied Geostatistics; Oxford University Press: Oxford, UK, 1989. [Google Scholar]
- Iqbal, M.A.; Penas, A.; Cano-Ortiz, A.; Kersebaum, K.C.; Herrero, L.; del Río, S. Analysis of recent changes in maximum and minimum temperatures in Pakistan. Atmos. Res. 2016, 168, 234–249. [Google Scholar] [CrossRef]
- Singh, D.; Jain, S.K.; Gupta, R.D. Trend in observed and projected maximum and minimum temperature over NW Himalayan basin. J. Mt. Sci. 2015, 12, 417–433. [Google Scholar] [CrossRef]
- Ullah, S.; You, Q.; Ali, A.; Ullah, W.; Jan, M.A.; Zhang, Y.; Xie, W.; Xie, X. Observed changes in maximum and minimum temperatures over China-Pakistan economic corridor during 1980–2016. Atmos. Res. 2019, 216, 37–51. [Google Scholar] [CrossRef]
- Hussain, S.S.; Mudasser, M.; Sheikh, M.M.; Manzoor, N. Climate change and variability in mountain regions of Pakistan implications for water and agriculture. Pakistan J. Meteorol. 2005, 2, 75–90. [Google Scholar]
- Gadiwala, M.S.; Burke, F. Climate change and precipitation in Pakistan-a meteorological Prospect. Int. J. Econ. Environ. Geol. 2019, 4, 10–15. [Google Scholar]
- Dimri, A.P.; Niyogi, D.; Barros, A.P.; Ridley, J.; Mohanty, U.C.; Yasunari, T.; Sikka, D.R. Western disturbances: A review. Rev. Geophys. 2015, 53, 225–246. [Google Scholar] [CrossRef]
- McSweeney, C.; New, M.; Lizcano, G. UNDP Climate Change Country Profiles—Kenya; University of Oxford School of Geography and the Environment: Oxford, UK, 2008. [Google Scholar]
- Ahmad, W.; Fatima, A.; Awan, U.K.; Anwar, A. Analysis of long term meteorological trends in the middle and lower Indus Basin of Pakistan—A non-parametric statistical approach. Glob. Planet. Chang. 2014, 122, 282–291. [Google Scholar] [CrossRef]
- Alward, R.D.; Detling, J.K.; Milchunas, D.G. Grassland vegetation changes and nocturnal global warming. Science 1999, 283, 229–231. [Google Scholar] [CrossRef] [PubMed]
- Xu, Z.-Z.; Zhou, G.-S. Effects of water stress and high nocturnal temperature on photosynthesis and nitrogen level of a perennial grass Leymus chinensis. Plant Soil 2005, 269, 131–139. [Google Scholar] [CrossRef]
- Peng, S.; Huang, J.; Sheehy, J.E.; Laza, R.C.; Visperas, R.M.; Zhong, X.; Centeno, G.S.; Khush, G.S.; Cassman, K.G. Rice yields decline with higher night temperature from global warming. Proc. Natl. Acad. Sci. USA 2004, 101, 9971–9975. [Google Scholar] [CrossRef] [Green Version]
- Chaudhry, Q.-Z.; Mahmood, A.; Rasul, G.; Afzaal, M. Climate Change Indicators of Pakistan; Pakistan Meterological Department: Islamabad, Pakistan, 2009. [Google Scholar]
- Smadi, M.M. Observed abrupt changes in minimum and maximum temperatures in Jordan in the 20th century. Am. J. Environ. Sci. 2006, 2, 114–120. [Google Scholar] [CrossRef]
- Kalnay, E.; Cai, M. Impact of urbanization and land-use change on climate. Nature 2003, 423, 528. [Google Scholar] [CrossRef]
- Roy, S.S.; Kiany, K.; Sadegh, M.; Balling, R.C. A significant population signal in Iranian temperature records. Int. J. Atmos. Sci. 2016, 2016. [Google Scholar] [CrossRef]
- Zhou, L.; Dai, A.; Dai, Y.; Vose, R.S.; Zou, C.-Z.; Tian, Y.; Chen, H. Spatial dependence of diurnal temperature range trends on precipitation from 1950 to 2004. Clim. Dyn. 2009, 32, 429–440. [Google Scholar] [CrossRef]
- Farhat, A.; Ahmad, A.; Safeeq, M.; Ali, S.; Saleem, F.; Hammad, H.M.; Farhad, W. Changes in precipitation extremes over arid to semiarid and subhumid Punjab. Pak. Theor. Appl. Clim. 2013, 116, 671–680. [Google Scholar]
- Salma, S.; Shah, M.A.; Rehman, S. Rainfall trends in different climate zones of Pakistan. Pak. J. Meteorol. 2012, 9, 37–47. [Google Scholar]
- Thakuri, S.; Dahal, S.; Shrestha, D.; Guyennon, N.; Romano, E.; Colombo, N.; Salerno, F. Elevation-dependent warming of maximum air temperature in Nepal during 1976–2015. Atmos. Res. 2019, 228, 261–269. [Google Scholar] [CrossRef]
- Reggiani, P.; Boyko, O.; Rientjes, T.H. In the Central Indus River Basin; Elsevier: Amsterdam, The Netherlands, 2019; ISBN 9780128127827. [Google Scholar]
- Shrestha, A.B.; Wake, C.P.; Mayewski, P.A.; Dibb, J.E. Maximum temperature trends in the Himalaya and its vicinity: An analysis based on temperature records from Nepal for the period 1971–94. J. Clim. 1999, 12, 2775–2786. [Google Scholar] [CrossRef]
- Feng, R.; Yu, R.; Zheng, H.; Gan, M. Spatial and temporal variations in extreme temperature in Central Asia. Int. J. Climatol. 2018, 38, e388–e400. [Google Scholar] [CrossRef]
- Bhutiyani, M.R.; Kale, V.S.; Pawar, N.J. Long-term trends in maximum, minimum and mean annual air temperatures across the Northwestern Himalaya during the twentieth century. Clim. Chang. 2007, 85, 159–177. [Google Scholar] [CrossRef]
- Yao, T.; Thompson, L.; Yang, W.; Yu, W.; Gao, Y.; Guo, X.; Yang, X.; Duan, K.; Zhao, H.; Xu, B.; et al. Different glacier status with atmospheric circulations in Tibetan Plateau and surroundings. Nat. Clim. Chang. 2012, 2, 663. [Google Scholar] [CrossRef]
- Easterling, D.R.; Horton, B.; Jones, P.D.; Peterson, T.C.; Karl, T.R.; Parker, D.E.; Salinger, M.J.; Razuvayev, V.; Plummer, N.; Jamason, P. Maximum and minimum temperature trends for the globe. Science 1997, 277, 364–367. [Google Scholar] [CrossRef]
- Talchabhadel, R.; Karki, R.; Thapa, B.R.; Maharjan, M.; Parajuli, B. Spatio-temporal variability of extreme precipitation in Nepal. Int. J. Climatol. 2018, 38, 4296–4313. [Google Scholar] [CrossRef]
- Dai, A.; Trenberth, K.E.; Karl, T.R. Effects of clouds, soil moisture, precipitation, and water vapor on diurnal temperature range. J. Clim. 1999, 12, 2451–2473. [Google Scholar] [CrossRef]
- Salerno, F.; Guyennon, N.; Thakuri, S.; Viviano, G.; Romano, E.; Vuillermoz, E.; Cristofanelli, P.; Stocchi, P.; Agrillo, G.; Ma, Y. Weak precipitation, warm winters and springs impact glaciers of south slopes of Mt. Everest (central Himalaya) in the last 2 decades (1994–2013). Cryosphere 2015, 9, 1229–1247. [Google Scholar] [CrossRef]
Figure 1.
Location of the Punjab irrigation zones, climatic stations, and corresponding Thiessen polygons.
Figure 1.
Location of the Punjab irrigation zones, climatic stations, and corresponding Thiessen polygons.

Figure 2.
Time series of annual maximum temperature (Tmax), minimum temperature (Tmin), mean temperature (Tmean) and diurnal temperature range (DTR) in degree celcius (°C) for the Punjab irrigation zones and their linear trends.
Figure 2.
Time series of annual maximum temperature (Tmax), minimum temperature (Tmin), mean temperature (Tmean) and diurnal temperature range (DTR) in degree celcius (°C) for the Punjab irrigation zones and their linear trends.

Figure 3.
Change per decade and signs of trends at meteorological stations for Tmax for the year, winter, spring, summer, autumn, Rabi, and Kharif in Punjab for the period 1967–2017.
Figure 3.
Change per decade and signs of trends at meteorological stations for Tmax for the year, winter, spring, summer, autumn, Rabi, and Kharif in Punjab for the period 1967–2017.

Figure 4.
Change per decade and signs of trends at meteorological stations for Tmin for the year, winter, spring, summer, autumn, Rabi, and Kharif in Punjab for the period 1967–2017.
Figure 4.
Change per decade and signs of trends at meteorological stations for Tmin for the year, winter, spring, summer, autumn, Rabi, and Kharif in Punjab for the period 1967–2017.

Figure 5.
Change per decade and signs of trends at meteorological stations for Tmean for the year, winter, spring, summer, autumn, Rabi, and Kharif in Punjab for the period 1967–2017.
Figure 5.
Change per decade and signs of trends at meteorological stations for Tmean for the year, winter, spring, summer, autumn, Rabi, and Kharif in Punjab for the period 1967–2017.

Figure 6.
Change per decade and signs of trends at meteorological stations for the DTR of the year, winter, spring, summer, autumn, Rabi, and Kharif in Punjab for the period 1967–2017.
Figure 6.
Change per decade and signs of trends at meteorological stations for the DTR of the year, winter, spring, summer, autumn, Rabi, and Kharif in Punjab for the period 1967–2017.

Figure 7.
Time series and linear trend of annual precipitation in Punjab and the irrigation zones.

Figure 8.
Change per decade and trends of precipitation at meteorological stations (mm) for the entire year, winter, spring, summer, autumn, Rabi, and Kharif in Punjab for the period 1967–2017.
Figure 8.
Change per decade and trends of precipitation at meteorological stations (mm) for the entire year, winter, spring, summer, autumn, Rabi, and Kharif in Punjab for the period 1967–2017.

Figure 9.
Elevation-dependent trend of temperature indices and precipitation for stations under the study region located at elevations above 500 m a.s.l. (black dash linear fit), and for additional stations (red linear fit) covering continuous elevation range of 500–2167 m. a.s.l, during the period 1967–2017.


Table 1.
Information of Meteorological stations in Punjab.
| Stations | Longitude (°E) | Latitude (°N) | Altitude (m) |
|---|---|---|---|
| Bahawalnagar | 72.85 | 29.33 | 161 |
| Bahawalpur | 71.78 | 29.33 | 110 |
| Lahore | 74.40 | 31.58 | 214 |
| Multan | 71.43 | 30.20 | 122 |
| Sialkot | 74.53 | 32.52 | 255 |
| K. Pur | 70.68 | 28.65 | 88 |
| Jhelum | 73.73 | 32.73 | 287 |
| Faisalabad | 73.13 | 31.43 | 186 |
| Murree | 73.38 | 33.91 | 2167 |
| Islamabad | 73.00 | 33.06 | 718 |
| D.I. Khan | 70.93 | 31.82 | 171 |
| Rohri | 68.90 | 27.67 | 66 |
| Jacobabad | 68.47 | 28.30 | 55 |
| Barkhan | 69.72 | 29.88 | 1097 |
| Mianwali | 71.85 | 32.92 | 212 |
| Sarghoda | 72.07 | 32.00 | 187 |
Table 2.
Absolute changes in temperature (°C) indices in Punjab Province during the second period (1992–2017) compared to the first period (1967–1991) using the Mann–Whitney (MW) test.
Table 2.
Absolute changes in temperature (°C) indices in Punjab Province during the second period (1992–2017) compared to the first period (1967–1991) using the Mann–Whitney (MW) test.
| Time Scale | Tmax | Tmin | Tmean | DTR |
|---|---|---|---|---|
| Annual | 0.14 | 0.75 | 0.44 | −0.61 |
| Winter | 0.07 | 0.84 | 0.45 | −0.61 |
| Spring | 0.70 | 1.00 | 0.85 | −0.3 |
| Summer | −0.22 | 0.23 | −0.08 | −0.45 |
| Autumn | 0.02 | 0.93 | 0.48 | −0.91 |
| Rabi | 0.32 | 0.87 | 0.60 | −0.55 |
| Kharif | 0.01 | 0.62 | 0.30 | −0.65 |
Bold and italic showed significant change with Mann–Whitney (MW) test at 95% confidence level.
Table 3.
Annual and seasonal MK temperatures trend (°C/decade) indices and precipitation (mm/decade) in Punjab Province during 1967–2017 using Mann–Kendall and Sen’s slope.
Table 3.
Annual and seasonal MK temperatures trend (°C/decade) indices and precipitation (mm/decade) in Punjab Province during 1967–2017 using Mann–Kendall and Sen’s slope.
| Time Scale | Tmax | Tmin | Tmean | DTR | Precipitation |
|---|---|---|---|---|---|
| Annual | 0.01 | 0.28 | 0.14 | −0.25 | 22.24 |
| Winter | −0.03 | 0.32 | 0.18 | −0.31 | −0.03 |
| Spring | 0.17 | 0.37 | 0.27 | −0.17 | 3.40 |
| Summer | −0.13 | 0.08 | −0.04 | −0.19 | 10.78 |
| Autumn | −0.08 | 0.36 | 0.15 | −0.39 | 5.23 |
| Rabi | 0.06 | 0.32 | 0.20 | −0.24 | 3.61 |
| Kharif | −0.02 | 0.23 | 0.11 | −0.25 | 20.14 |
Bold and italic showed a significant trend with Mann–Kendall (MK) test at 95% confidence level.
Table 4.
Information of additional meteorological stations for elevation-dependent trend analysis.
| Stations | Longitude (°E) | Latitude (°N) | Altitude (m) |
|---|---|---|---|
| Zhob | 69.28 | 31.21 | 1505 |
| Kotli | 73.54 | 33.31 | 814 |
| Kohat | 71.53 | 33.45 | 664 |
| Kakul | 73.15 | 34.18 | 1308 |
© 2019 by the authors. Licensee MDPI, Basel, Switzerland. This article is an open access article distributed under the terms and conditions of the Creative Commons Attribution (CC BY) license (http://creativecommons.org/licenses/by/4.0/).
Share and Cite
MDPI and ACS Style
Nawaz, Z.; Li, X.; Chen, Y.; Guo, Y.; Wang, X.; Nawaz, N. Temporal and Spatial Characteristics of Precipitation and Temperature in Punjab, Pakistan. Water 2019, 11, 1916. https://doi.org/10.3390/w11091916
AMA Style
Nawaz Z, Li X, Chen Y, Guo Y, Wang X, Nawaz N. Temporal and Spatial Characteristics of Precipitation and Temperature in Punjab, Pakistan. Water. 2019; 11(9):1916. https://doi.org/10.3390/w11091916
Chicago/Turabian StyleNawaz, Zain, Xin Li, Yingying Chen, Yanlong Guo, Xufeng Wang, and Naima Nawaz. 2019. "Temporal and Spatial Characteristics of Precipitation and Temperature in Punjab, Pakistan" Water 11, no. 9: 1916. https://doi.org/10.3390/w11091916
Note that from the first issue of 2016, this journal uses article numbers instead of page numbers. See further details here.