1. Introduction
Iron and manganese occur in dissolved forms as single ions (Fe
2+, Mn
2+) or in undissolved higher forms mainly as Fe(II) or Mn(II), respectively [
1]. Both metals are common elements found in the earth’s crust [
2], and are two of the most common pollutants found in both surface and groundwater, but predominantly in the latter [
3,
4], reaching the ground water by the rain, surface and waste water filtration dissolving minerals from soil strata. The Fe(II) and Mn(II) ions pollution in groundwater may interact with the sediment and with other dissolved constituents, such as inorganic anions, or dissolved organic carbon (DOC), present as a humic-like material [
4]. These interactions lead to complex formations and to potential solid precipitation. Iron may also be present as a result of the use of the iron coagulants of the corrosion of steel and cast iron pipes during ground water extraction and distribution [
5,
6]. Both elements can be commonly found in natural water in concentrations up to 1.0 mg L
−1, although they are rarely present in concentrations exceeding 1.0 mg L
−1 [
3,
4].
The presence of iron in water causes aesthetic and operational problems such as odor and a brown color, stain and deposition in the water distribution systems, leading to high turbidity [
5,
6,
7]. Colored water is formed when oxidized iron enters the bulk water as ferric particles or as Fe(II) and forms ferric particles [
6,
8]. Manganese is also used in the manufacture of iron and steel alloys, manganese alloys and as an ingredient in various products [
9]. Elevated levels of manganese in water is considered undesirable, because when water is exposed to air, Mn(II) is oxidized to Mn(IV). This Mn(IV) precipitate can stain household utensils and clothes, and may impart a metallic, bitter, astringent or medical taste to water [
3]. Exposure to high concentrations of manganese over the course of years has been associated with a nervous system disease with symptoms like Parkinson’s disease [
10].
Several techniques and methods are employed in the removal of manganese and iron from water, including aeration, settling, filtration and ion exchange [
11,
12,
13]. The use of low-cost materials as potential sorbents for the removal of heavy metals has been emphasized recently, and among the different materials which possess sorbent properties are zeolites [
12,
13]. Natural and synthetic zeolites are used as a filtration material for the removal of iron and manganese from water [
12]. Zeolites are microporous aluminosilicates minerals which could be used as ion exchange in domestic and commercial water purification, softening and other applications [
14,
15]. Substitution of silicon by aluminum atoms in the crystal framework leads to an extra negative charge to be balanced by the surrounding counter ions (such as Na
+, K
+, Ca
2+, and Mg
2+), and these counter ions are easily exchanged by the cations of a contact solution with better affinity [
15,
16]. A number of earlier studies confirm their excellent performance in the removal of heavy metals from underground water [
1,
6,
17,
18,
19]. Although there are many papers on the utilization of natural zeolites, the synthetic zeolites can also be used for the same purpose because the synthetic zeolites resemble the natural zeolite minerals [
17]. Natural zeolites are cheaper compared to synthetic zeolites, but contain other impurities such as quartz, iron, copper, lead and rare earth metals. These supposed impurities make natural zeolites less effective compared to synthetic zeolites. Synthetic zeolites, however, are expensive, but are also very effective, since they can be synthesized for a specific application and purpose.
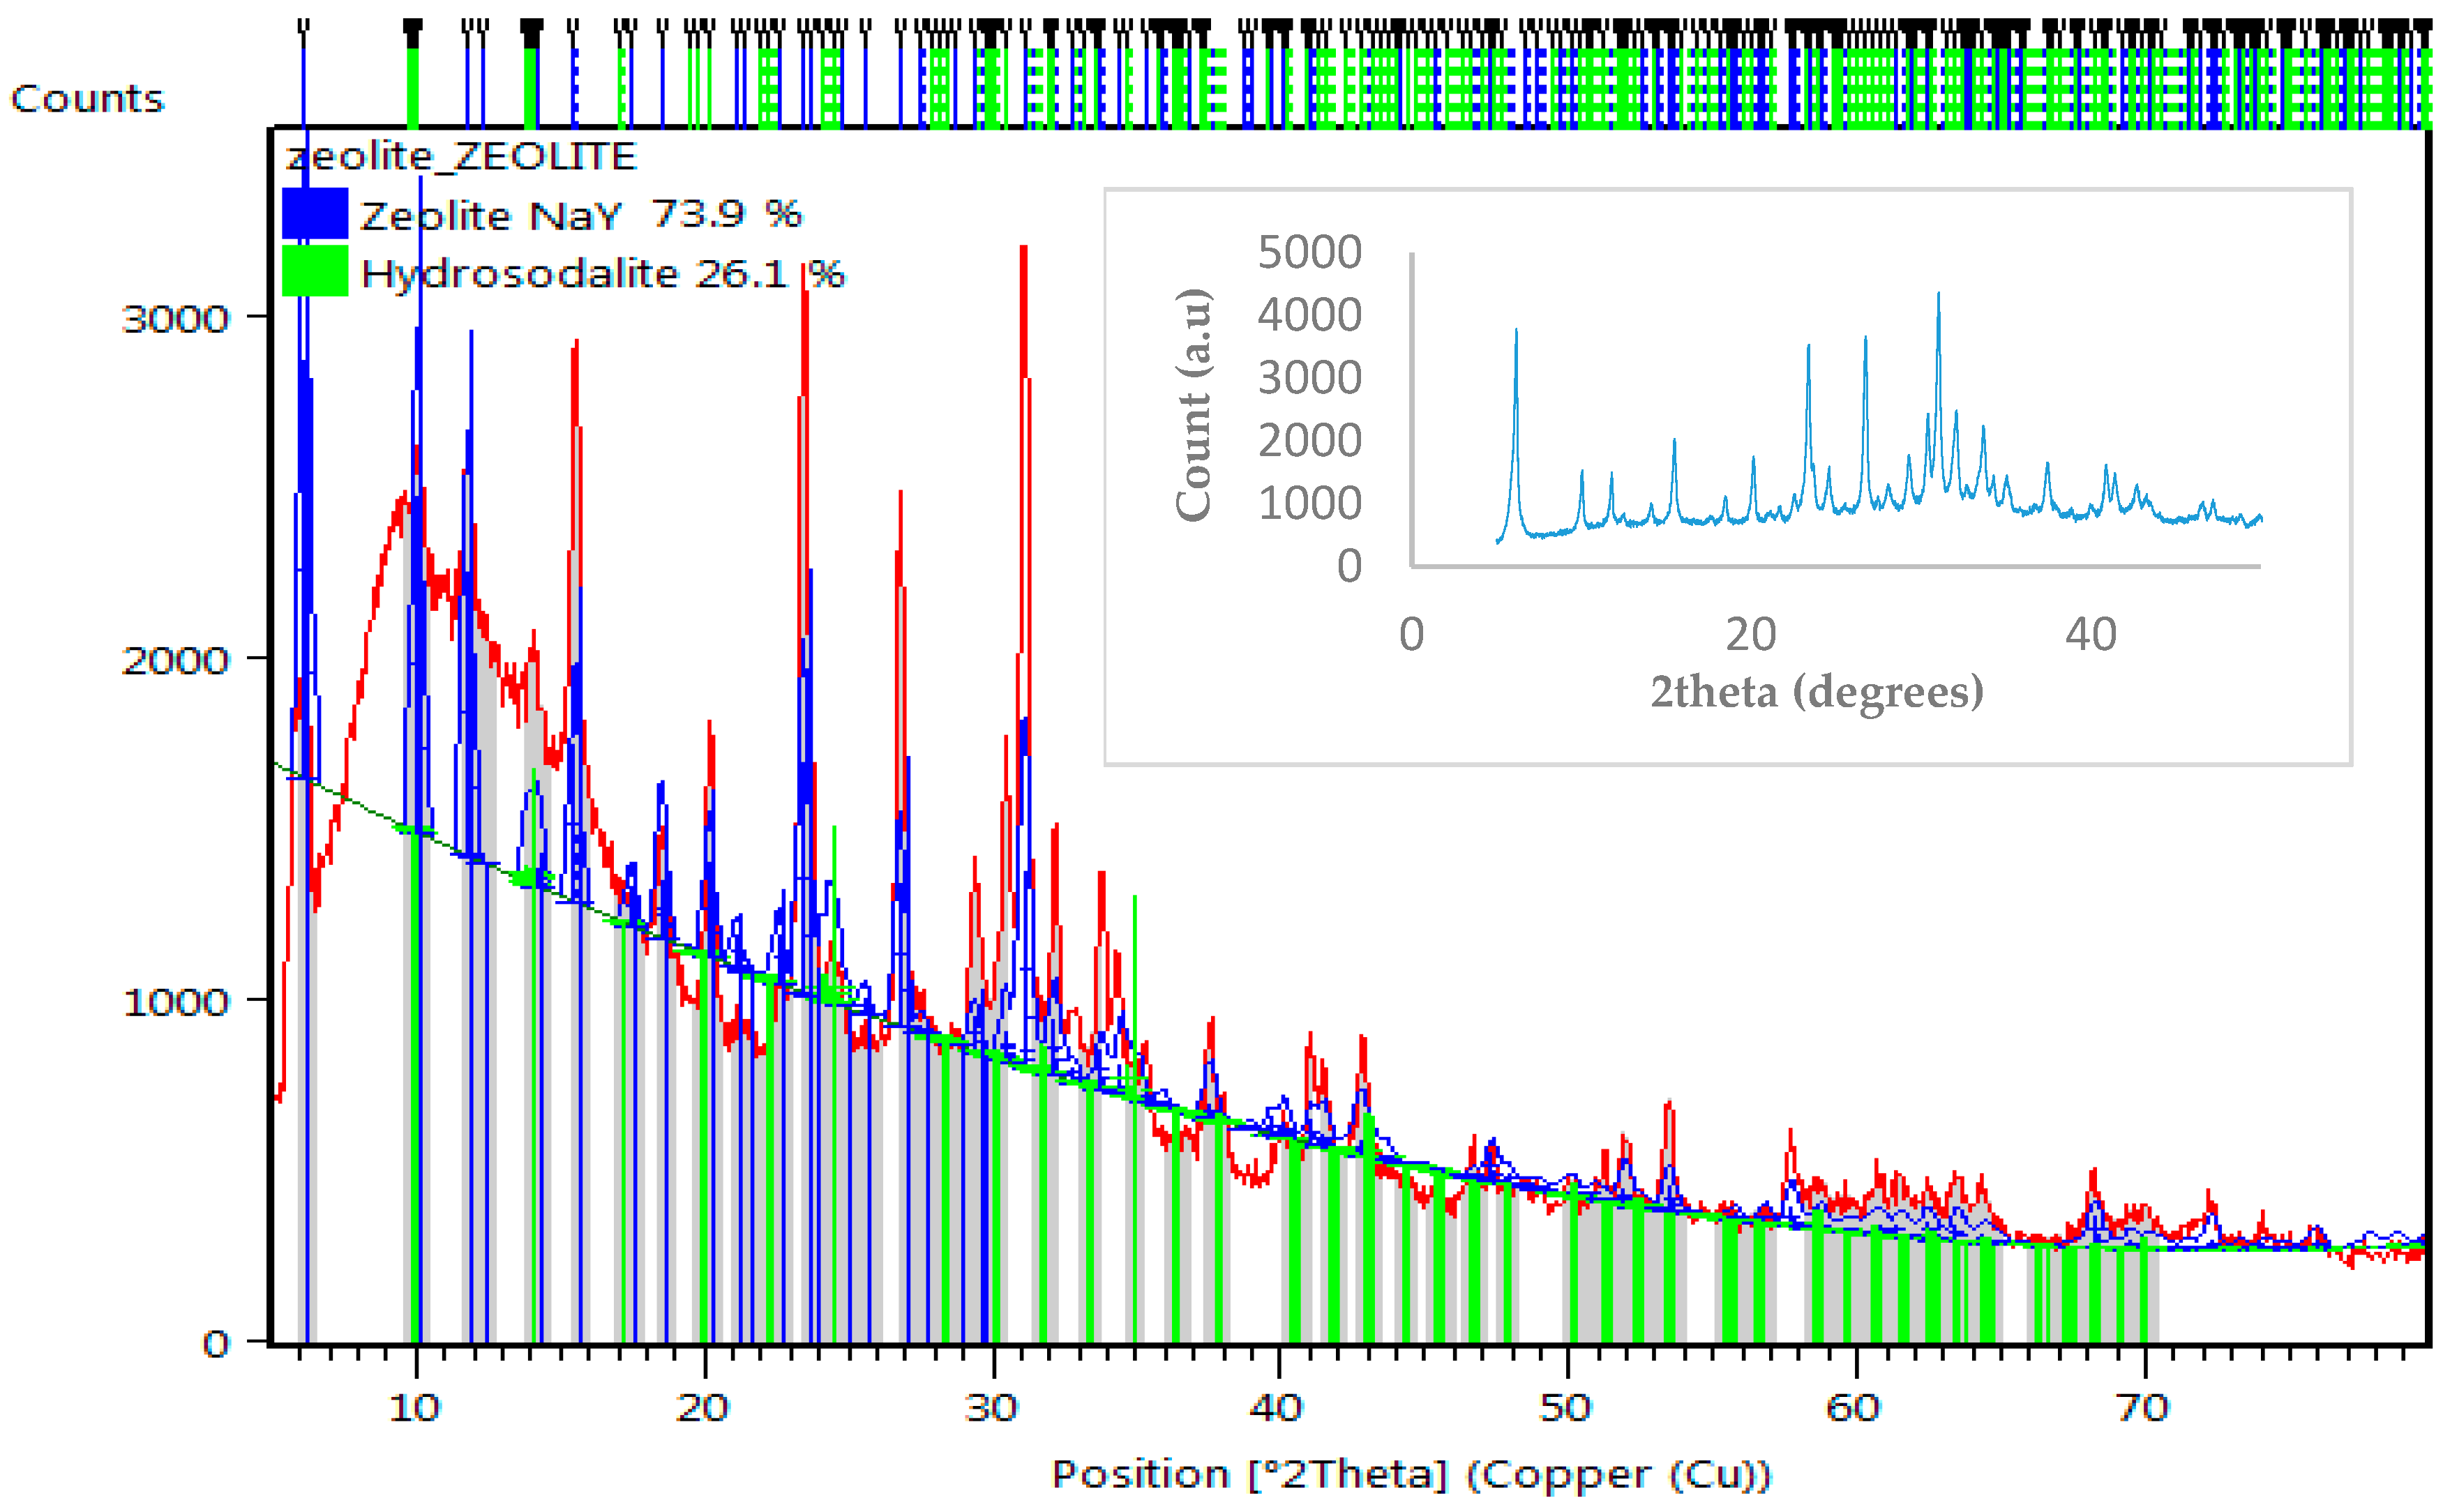
Zeolite Y is considered one of the most promising candidates for use in the removal of metal ions from water, owing to their large pore high surface structure [
20,
21,
22]. Synthetic zeolites are produced from chemical reagents. However, in this work there is an added benefit to the environment and human health, since the synthetic zeolite Y produced for this study was obtained by transforming bauxite and kaolin. The synthesis protocol developed by our research group is novel, and is currently being documented for a possible patent right. Earlier studies by Shevade [
23] and Ford showed that modified zeolite Y with
can remove arsenic from water and Yusof and coworkers [
18] also reported that synthesized zeolite NaY from rice husks can remove chromate and arsenate ions from aqueous solutions. The aims of this paper are to synthesize zeolite Y from bauxite and kaolin in Ghana, and to investigate its capability to remove iron and manganese from natural ground water samples.
4. Discussion
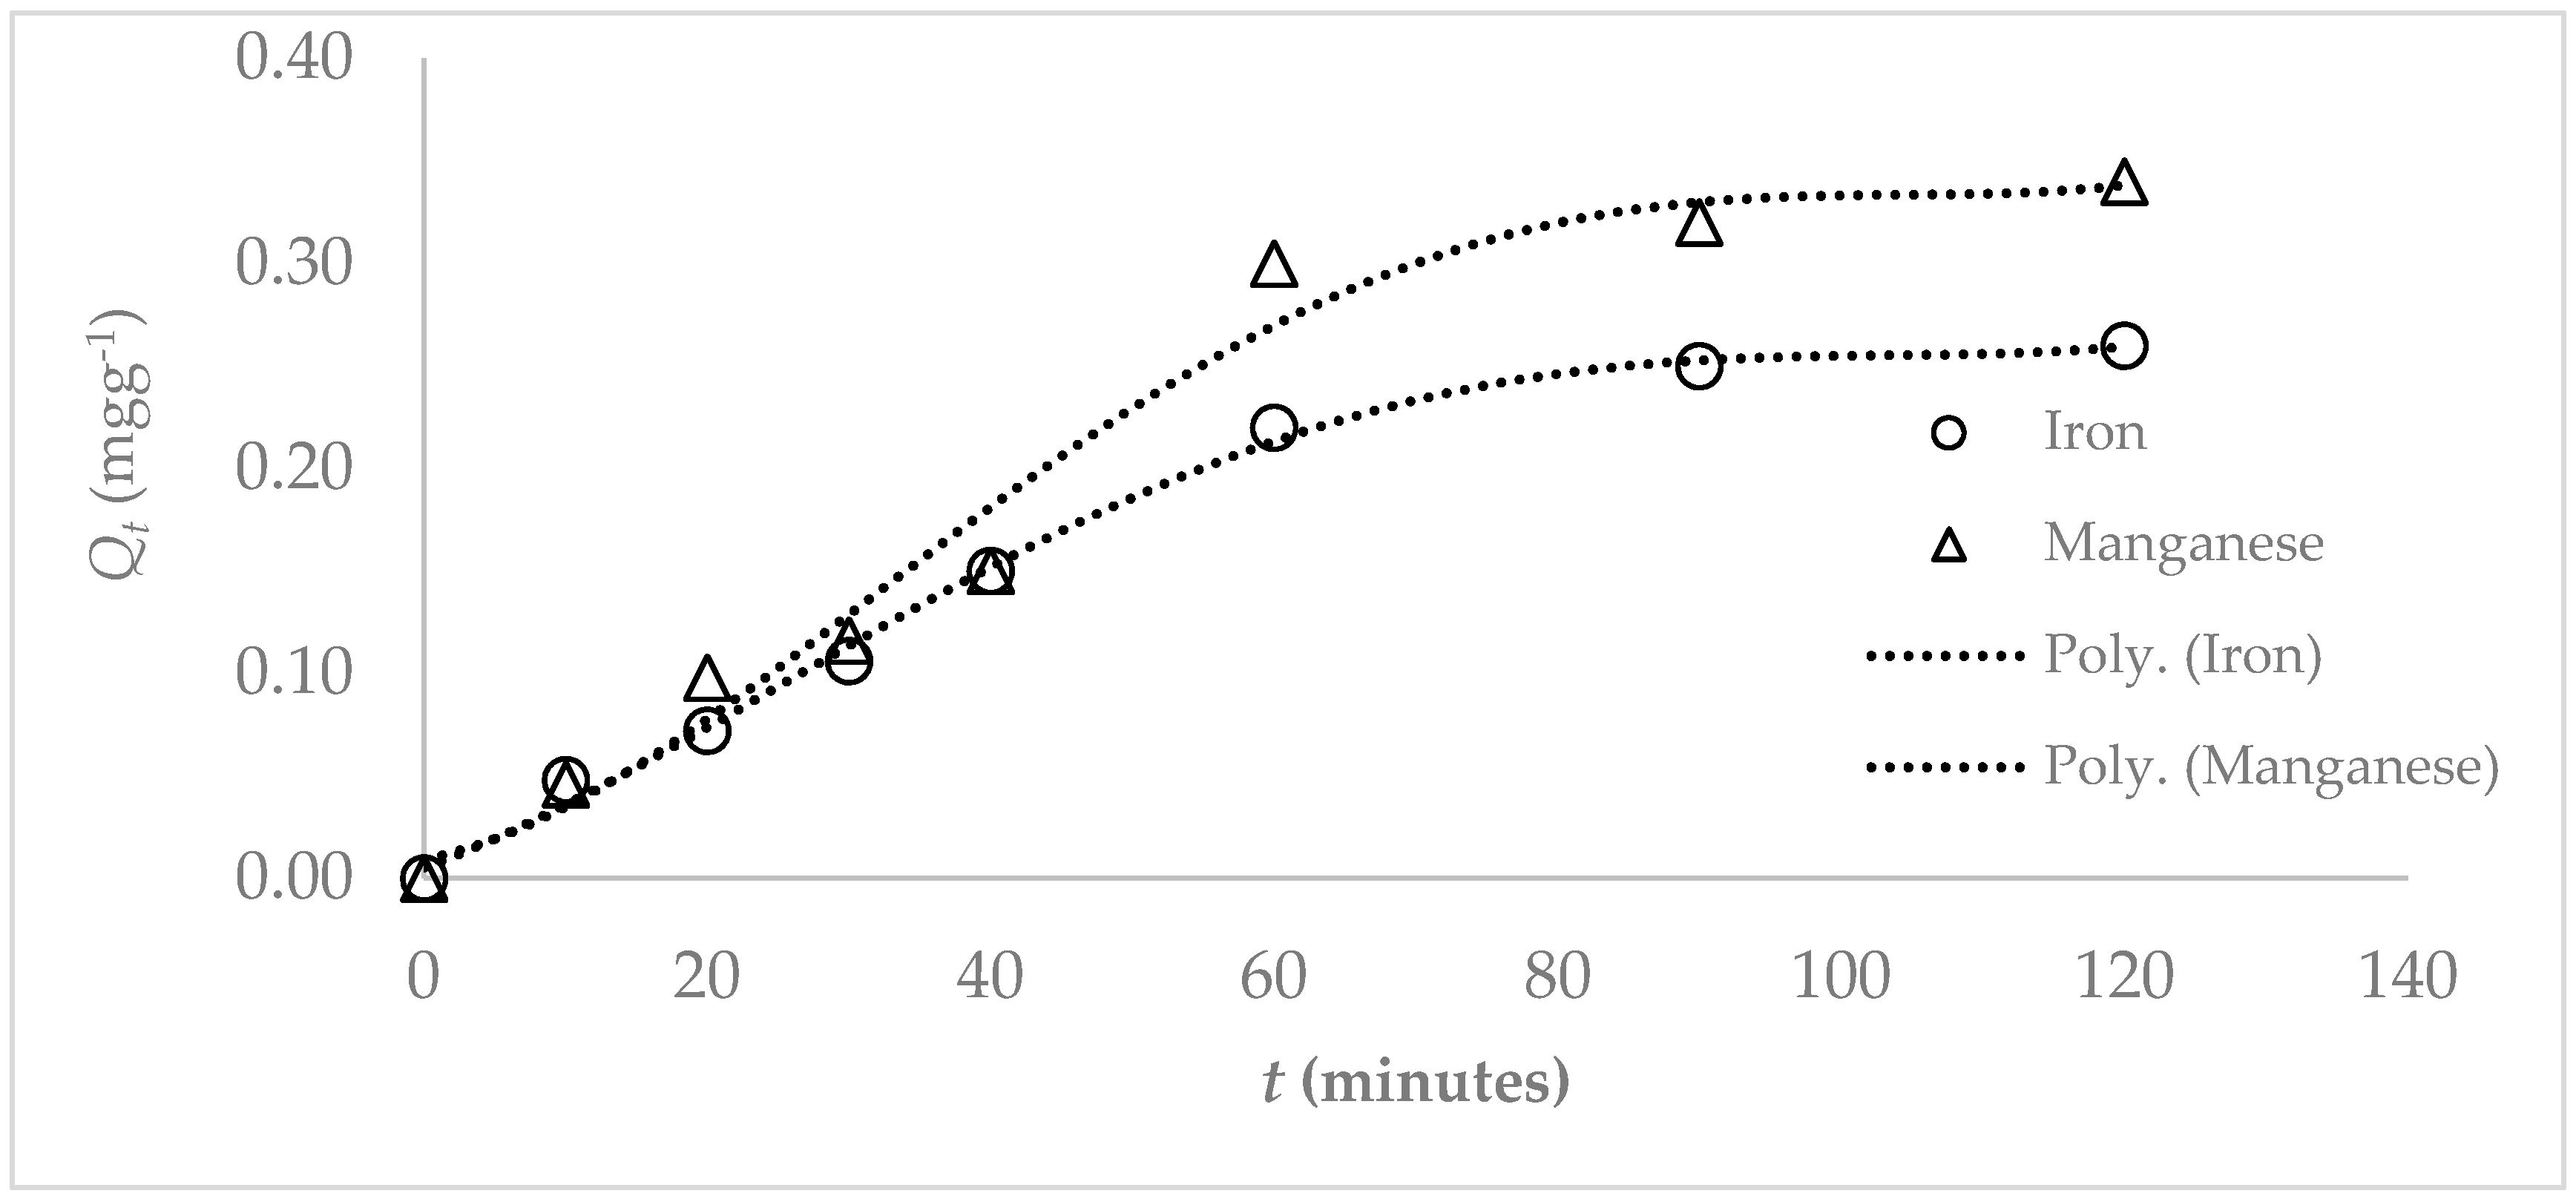
The plot of adsorption capacity versus time showed that the kinetics of the Fe and Mn adsorption onto adsorbent consisted of two phases: An initial rapid adsorption phase that continued for at least 60 min, and subsequently a very slow second sorption phase, with small contributions to the total Fe and Mn adsorption uptake, while after 60 min the change of adsorption capacities for both Fe and Mn did not show a sharp increase. The first phase can be attributed to either intra-particle diffusion or mass transfer from the bulk liquid to the particle external surface, since the suspension was vigorously agitated during the adsorption experiments. As more of Fe and Mn are adsorbed onto the zeolite sorption sites, the zeolite becomes saturated, thereby decreasing the sorption capacity. In this respect, Saha et al. [
30] explained that at low metal concentrations metals are mainly sorbed onto specific sorption sites, while at higher metal concentrations the sorption sites overlap, becoming thus less specific for a particular metal. This in turn, induces a reduction in metal sorption. Consequently, less favorable sites were involved in the sorption process as Fe(II) and Mn(II) saturate the action sorption sites in the aqueous solution. The mechanism of the sorption of Fe and Mn is attributed to both the ion exchange and adsorption processes. During the ion exchange process, Fe and Mn move through the pores of the zeolite mass, but also through channels of the lattice, replacing exchangeable cations (mainly sodium, potassium and calcium).
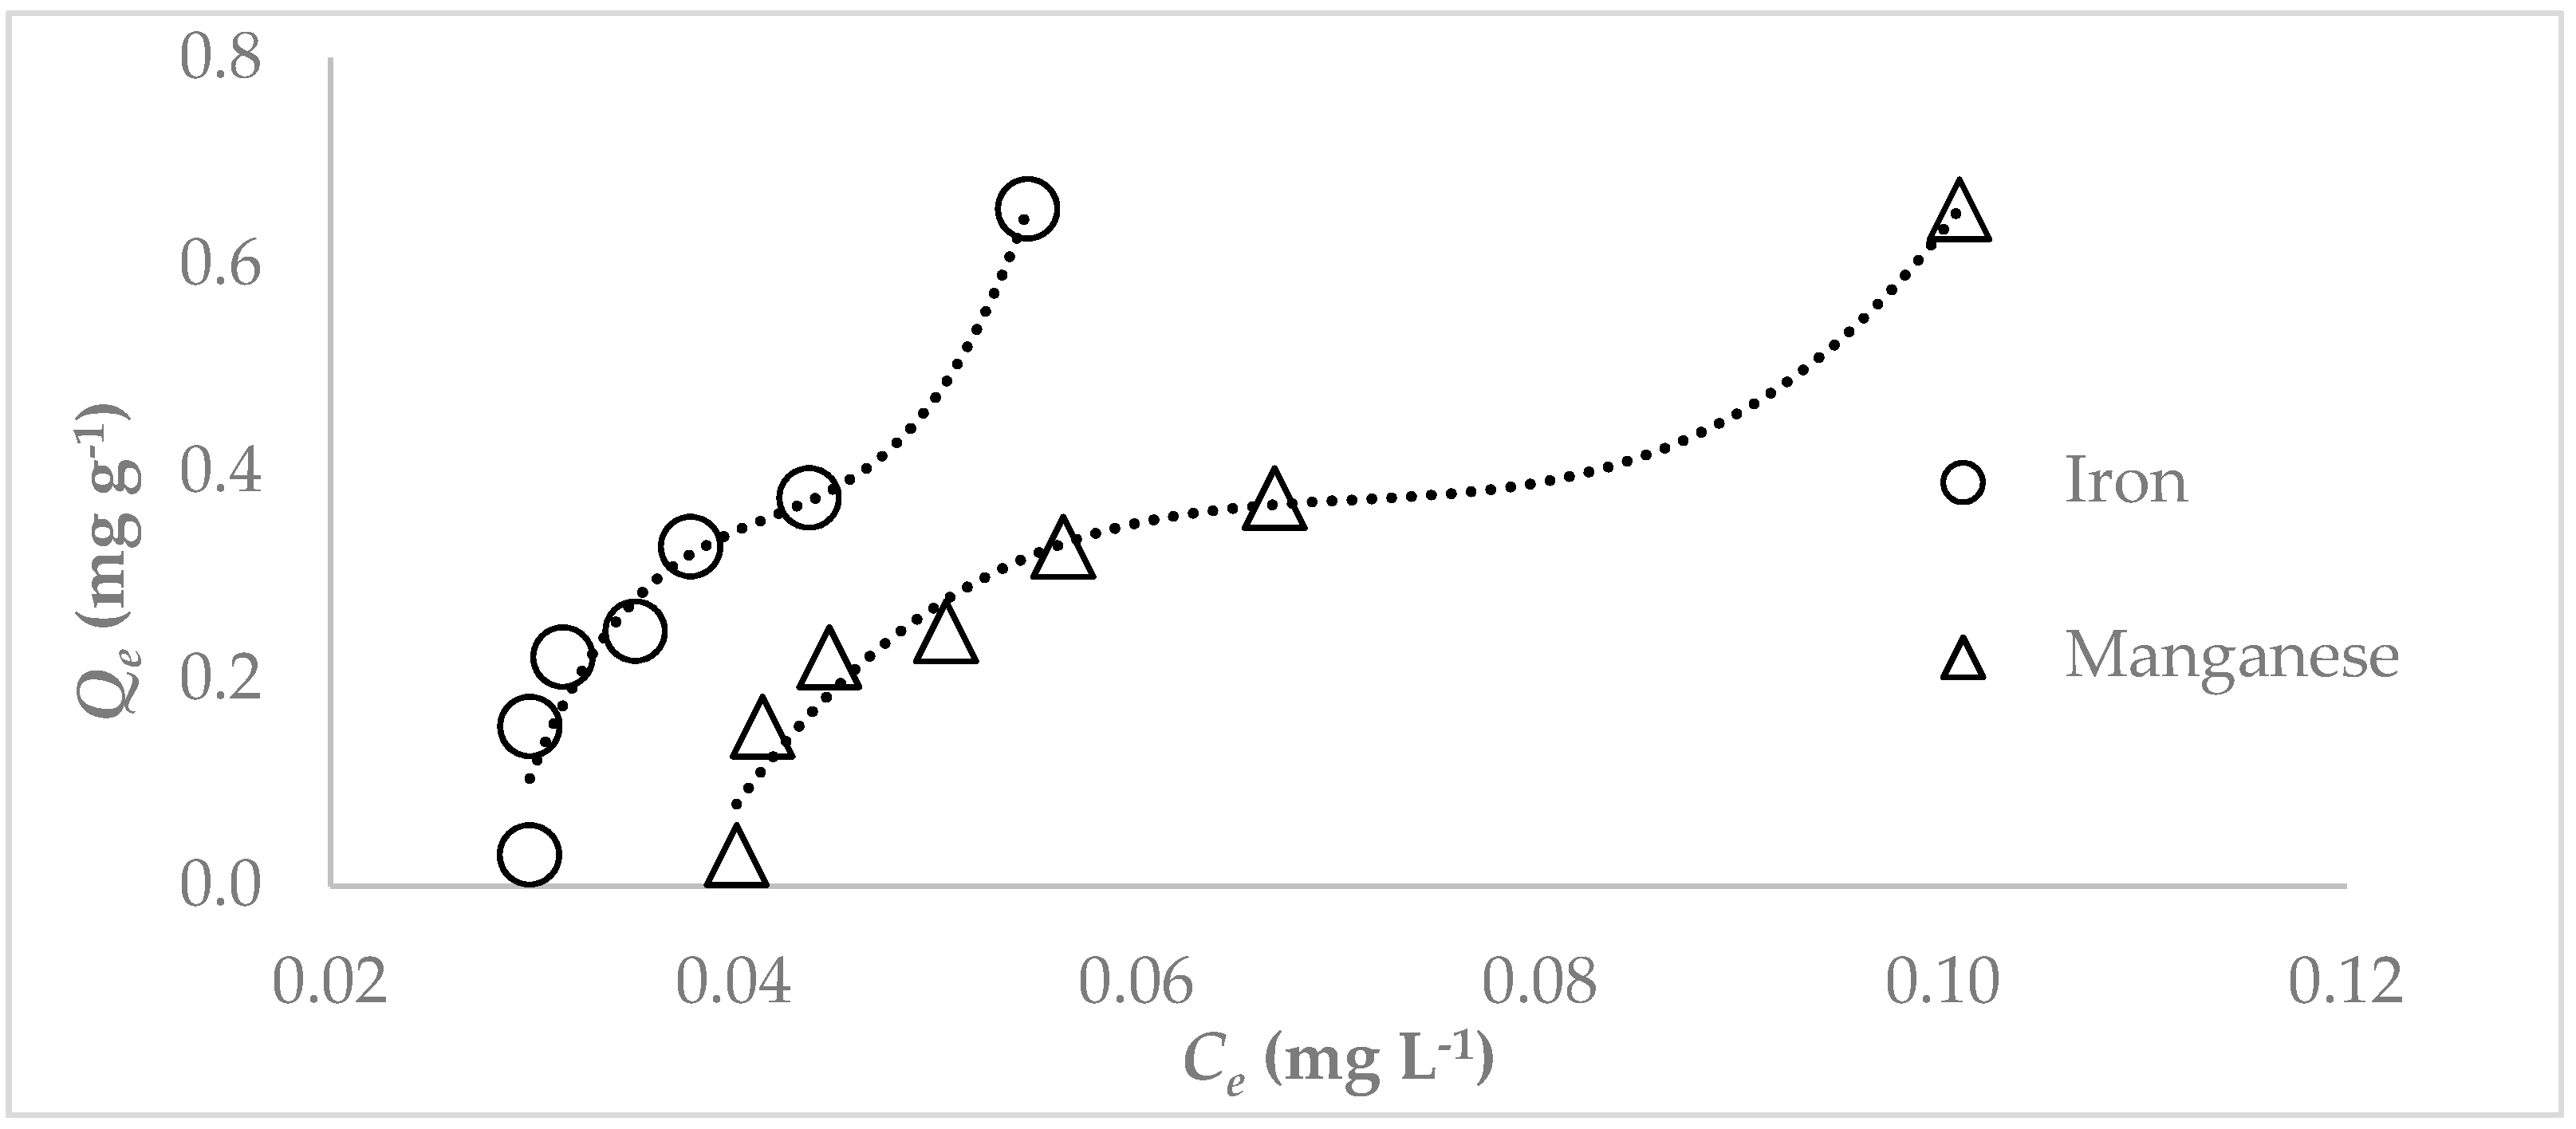
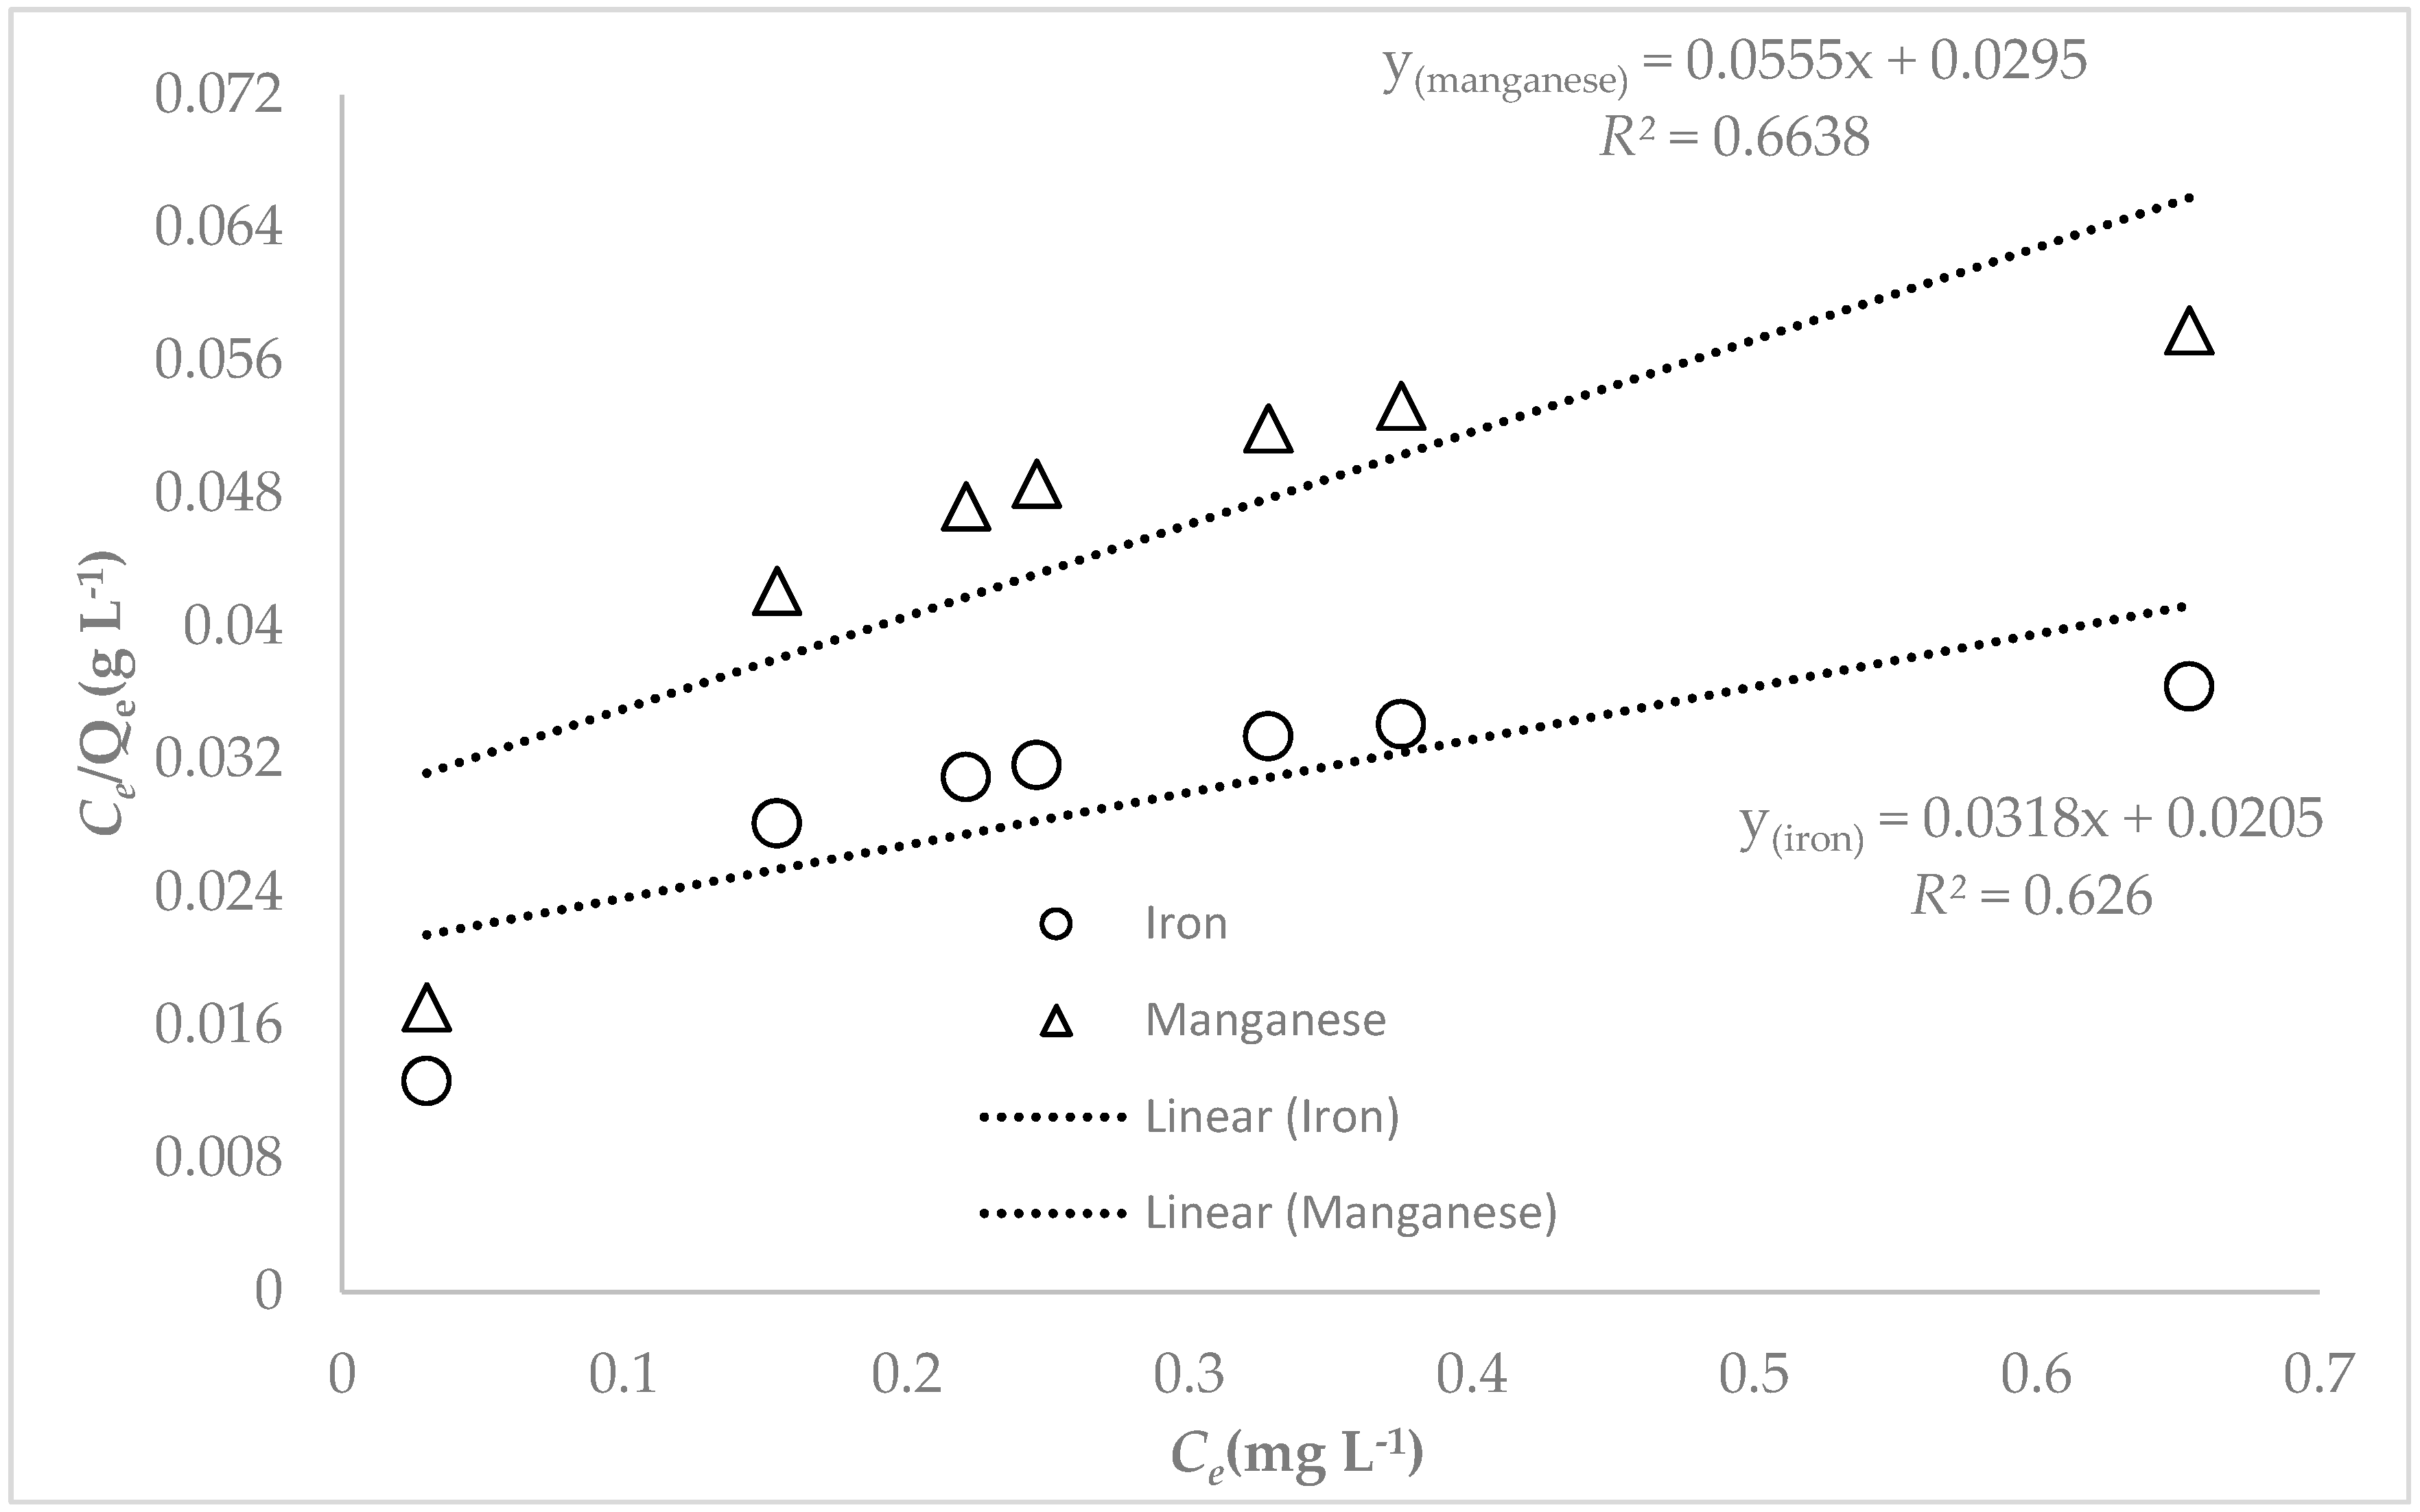
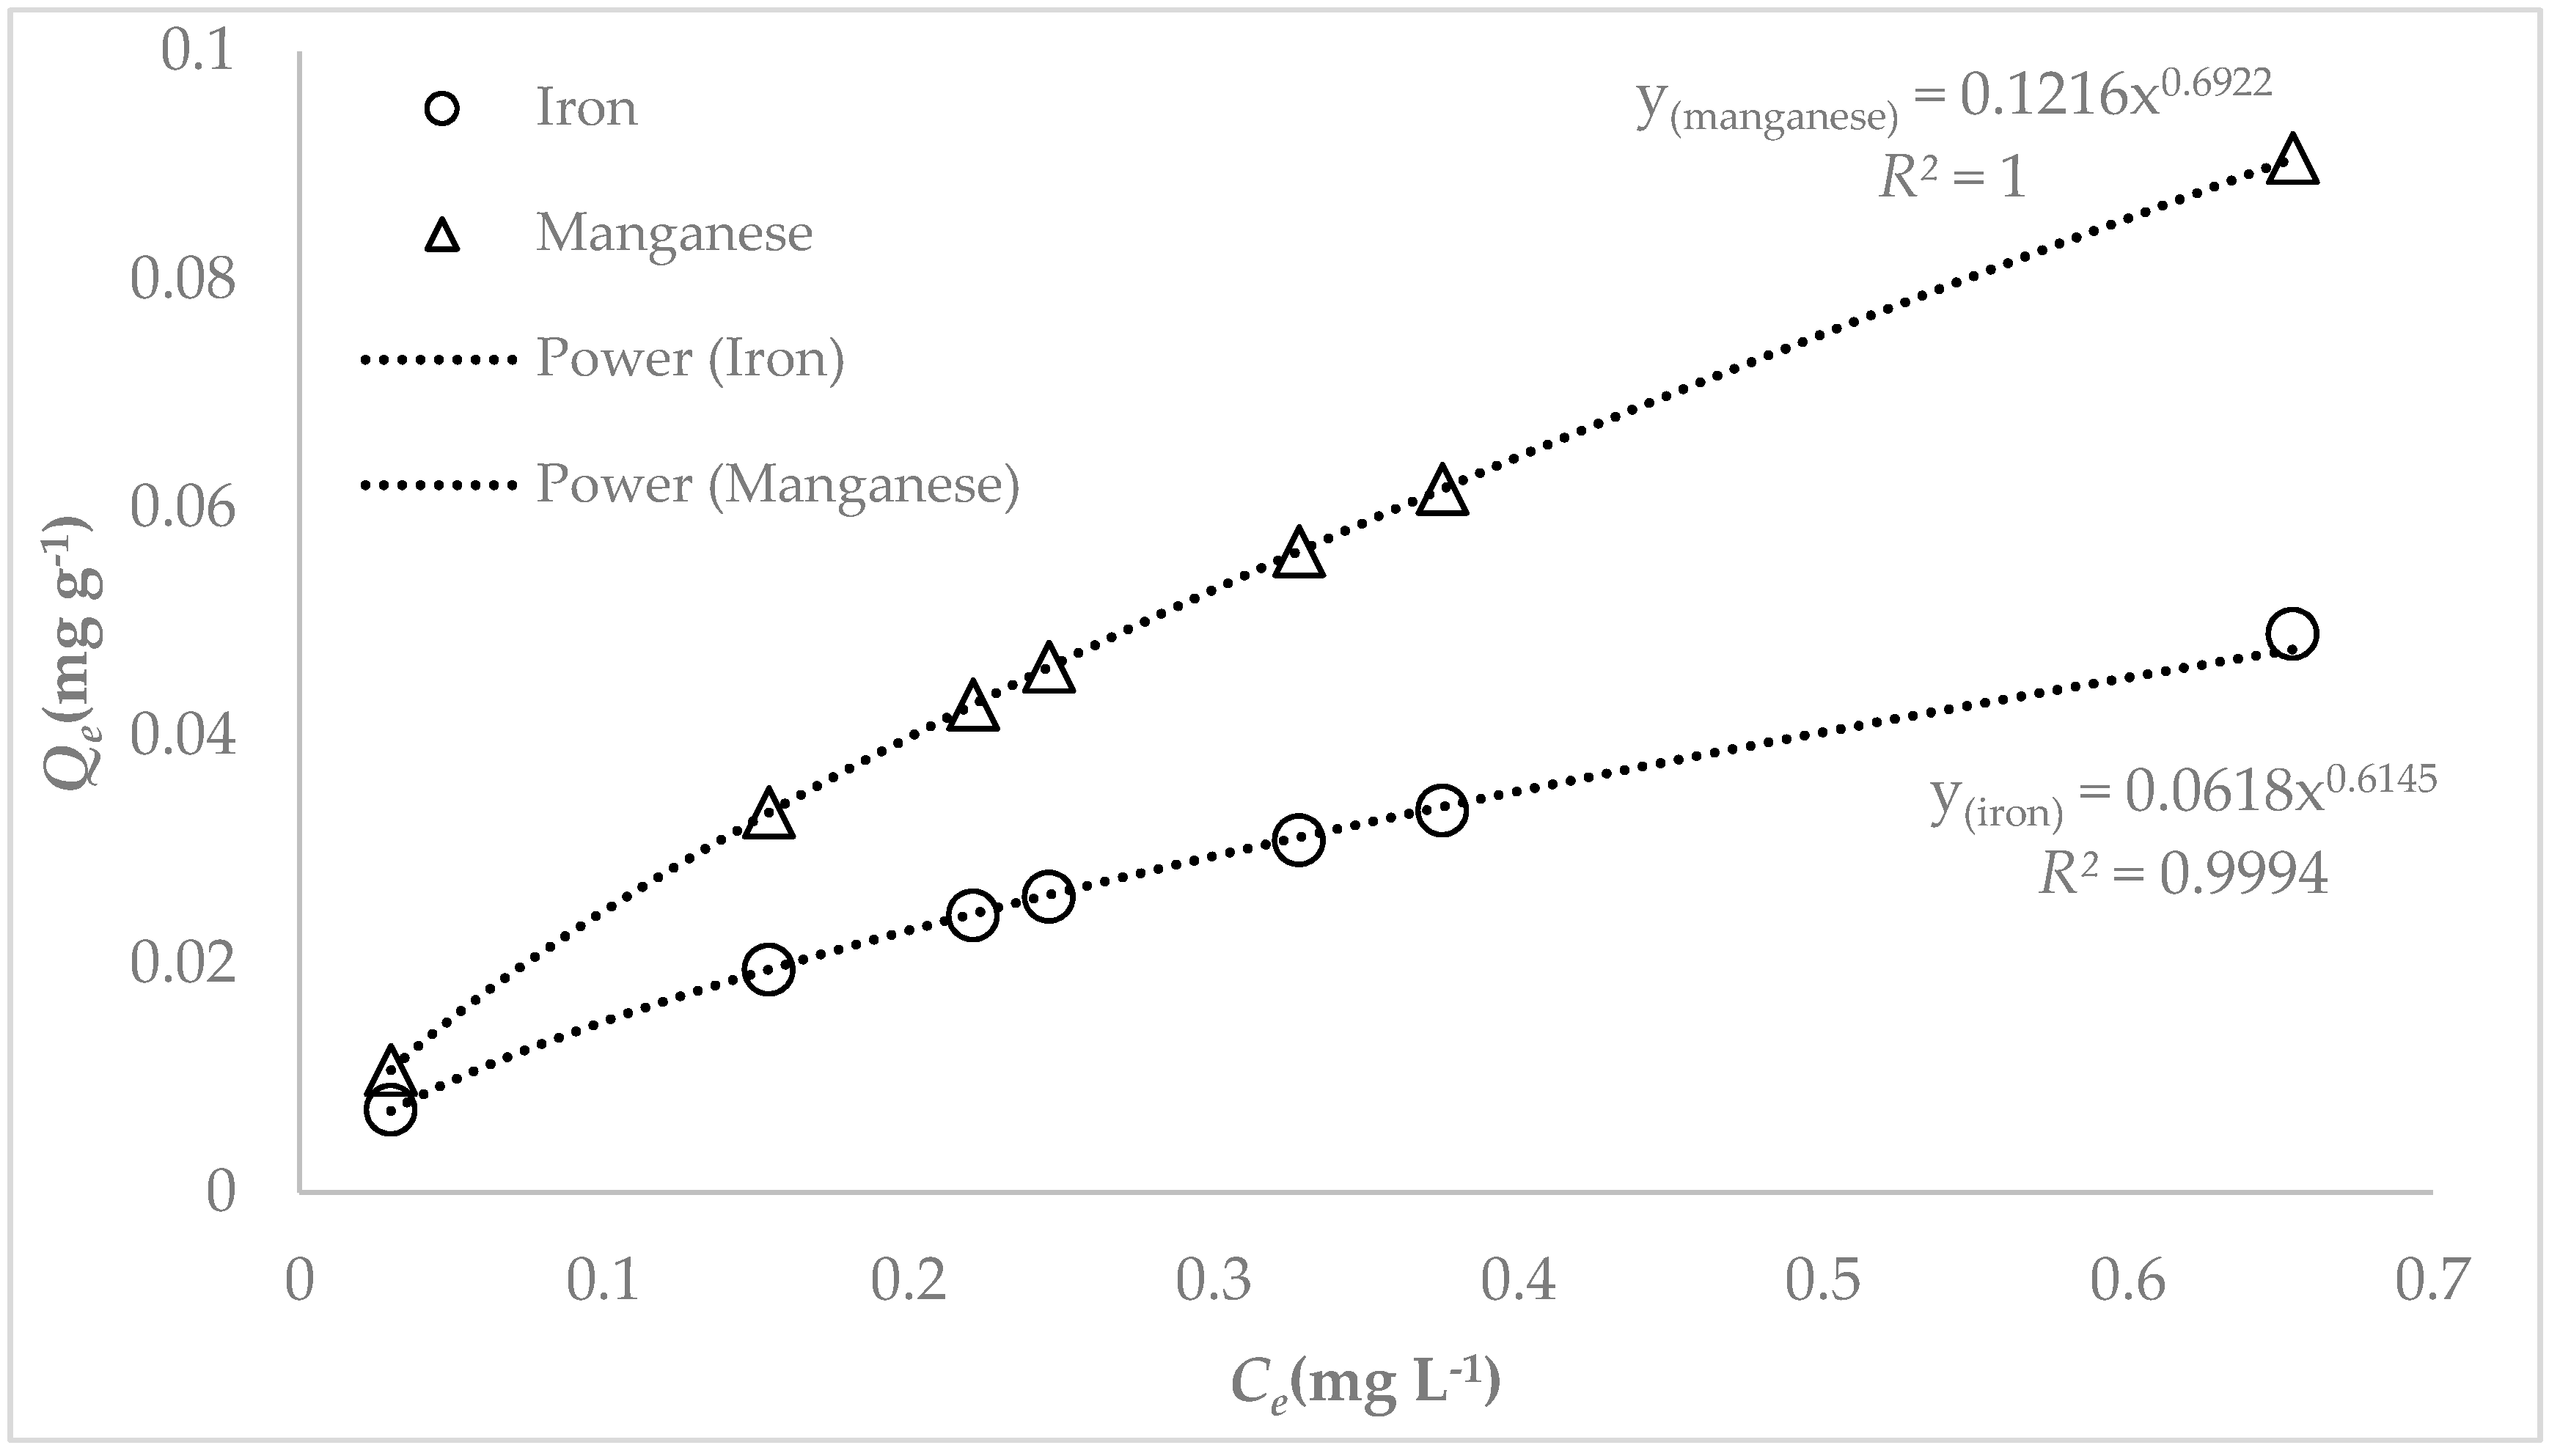
The Langmuir parameter
Qmax represents the monolayer saturation whilst the Freundlich parameter
n indicates the binding affinity for Fe(II) and/or Mn (II). The
values (0.526 for iron and 0.664 for manganese) obtained for the Langmuir model for both iron and manganese showed that the Langmuir model did not provide a good fit for the adsorption of Fe(II) and Mn(II). The Freundlich constant,
KF, (adsorption capacity) values obtained were
for iron and
for manganese. The corresponding
values were 0.6145 for iron and 0.6922 for manganese. The
values at equilibrium for both iron and manganese were less than 1, reflecting a favorable adsorption of Fe(II) and Mn(II). Furthermore, the corresponding adsorption at 0.2 mg L
−1 Fe (
) was calculated to be
, whilst that of manganese at 0.05 mg L
−1 Mn (
) was calculated to be
. The values obtained for the Freundlich parameter were found to be in agreement with what were obtained from other workers such as Fu et al. [
31], Guozinis et al. [
32], Farag et al. [
33], Yuvuz et al. [
34], Wei-Wei et al. [
35] and Araby et al. [
36].
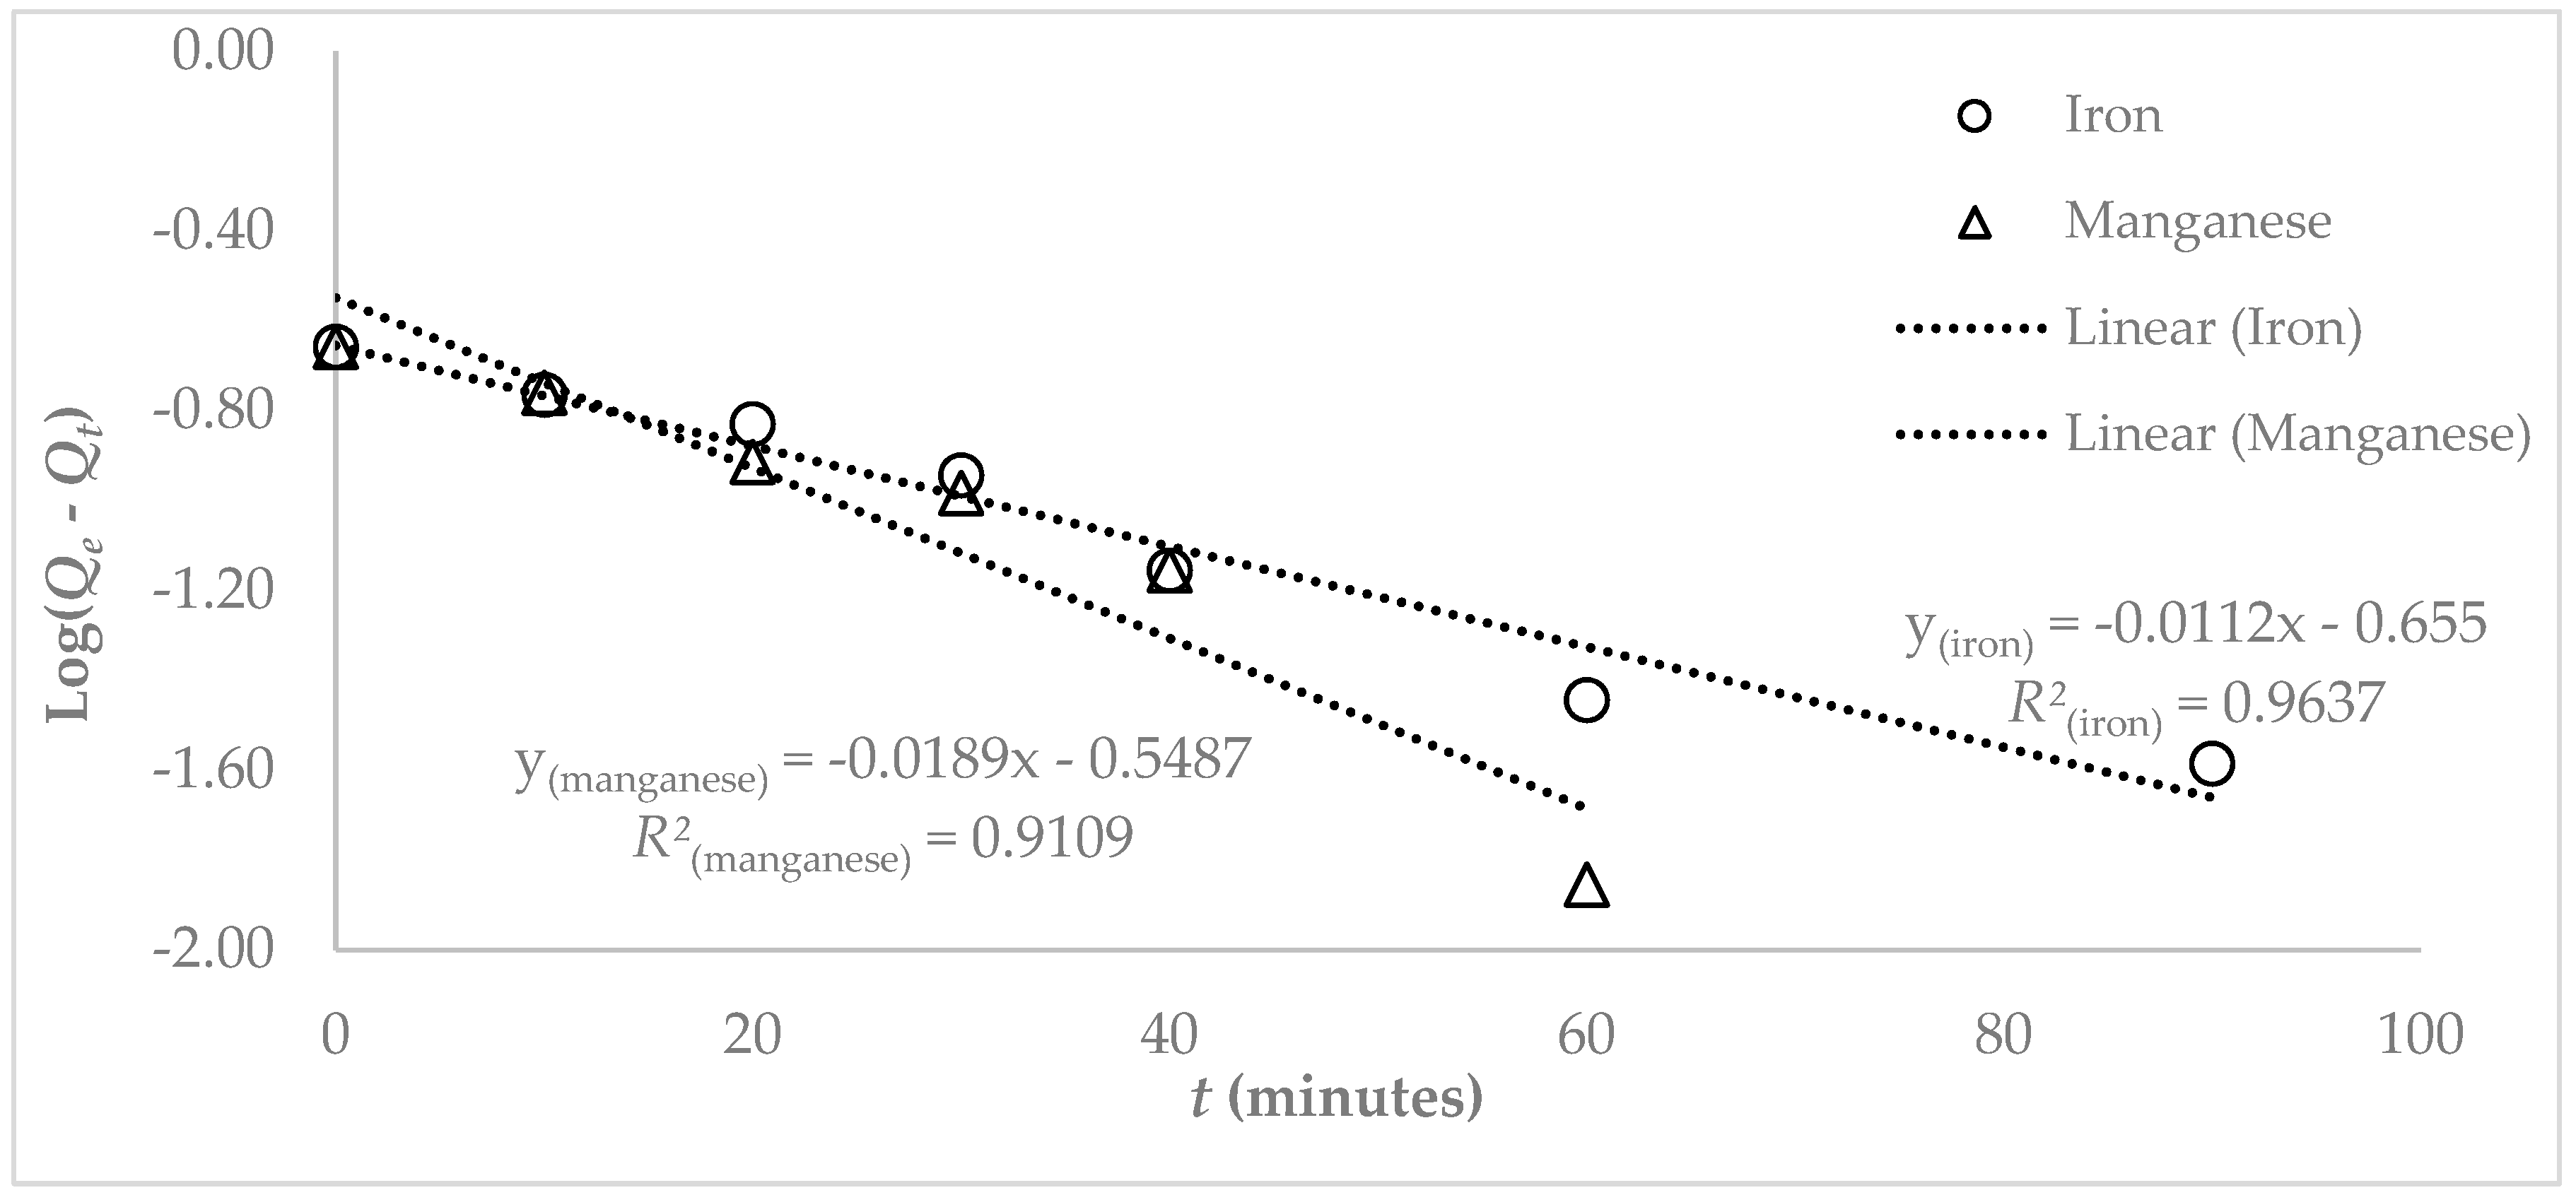
From
Table 5 it can also be found that the calculated
Qe = (0.221
) for Fe(II) for the pseudo-first order reaction were on a par with the experimental
Qe value (0.220 mg g
−1) for the observed process. However, there were considerable differences for Mn(II) between the calculated value (0.250 mg g
−1) and the experimental (0.282 mg g
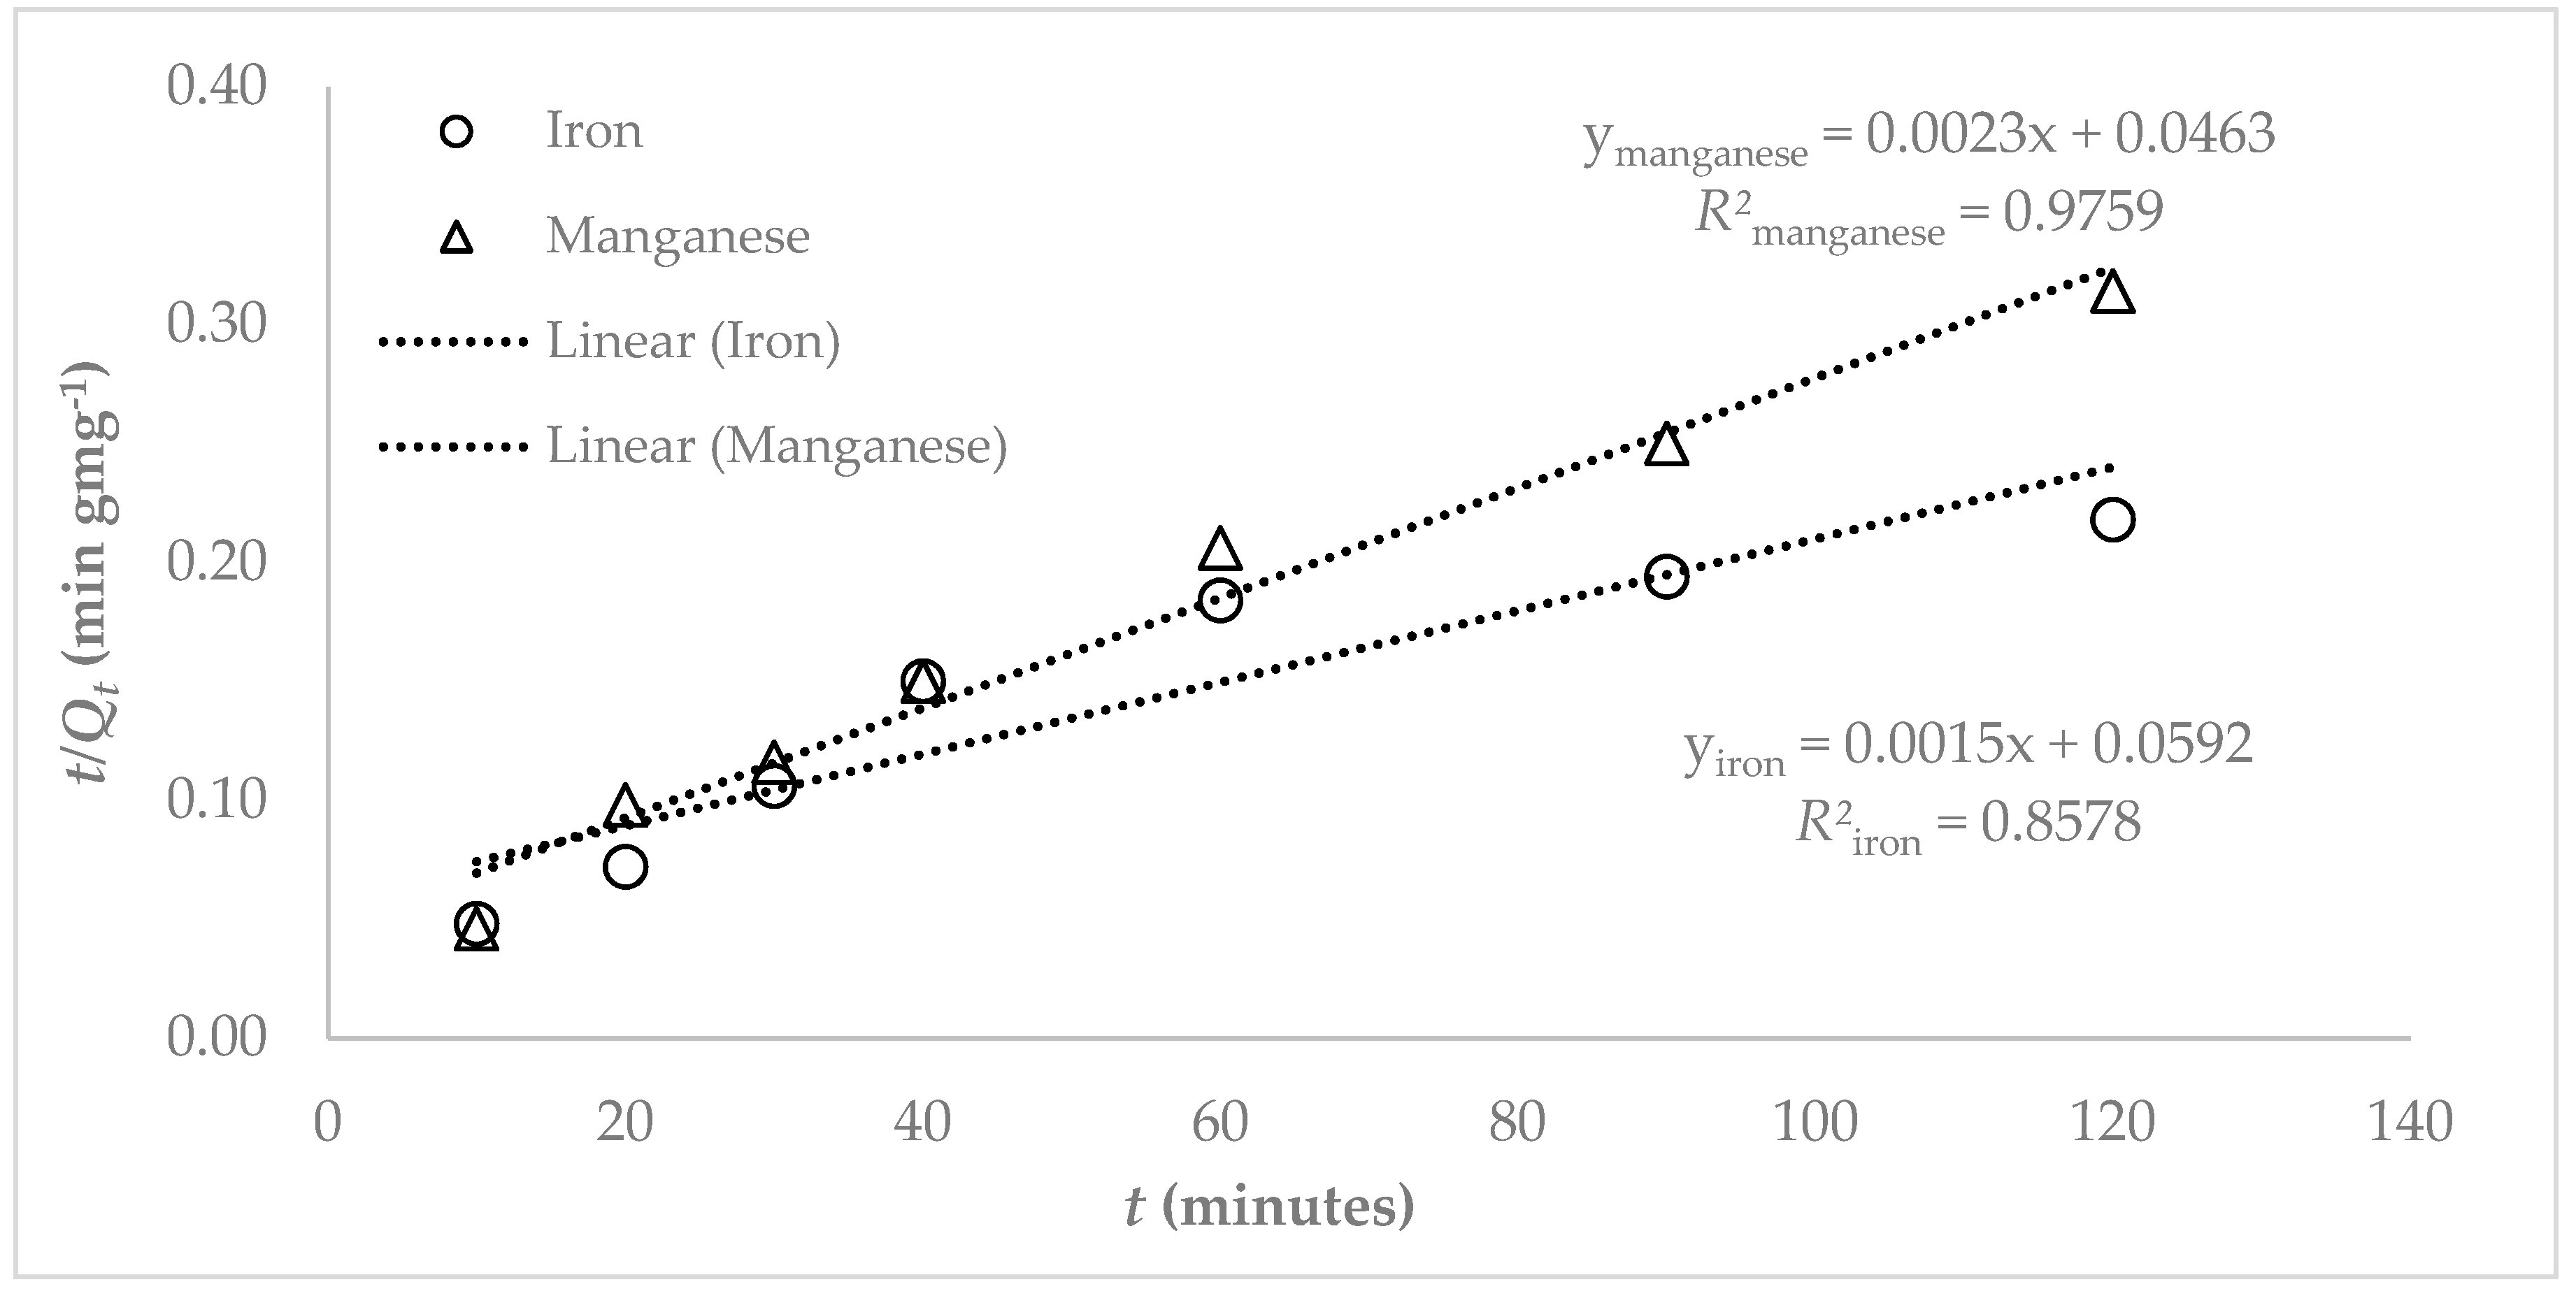
−1) value. Unlike the pseudo first-order equation considerable differences were observed between calculated
Qe values for Fe(II) and Mn(II) and the experimental
Qe. The values of the first and second reaction rate constants
K1,
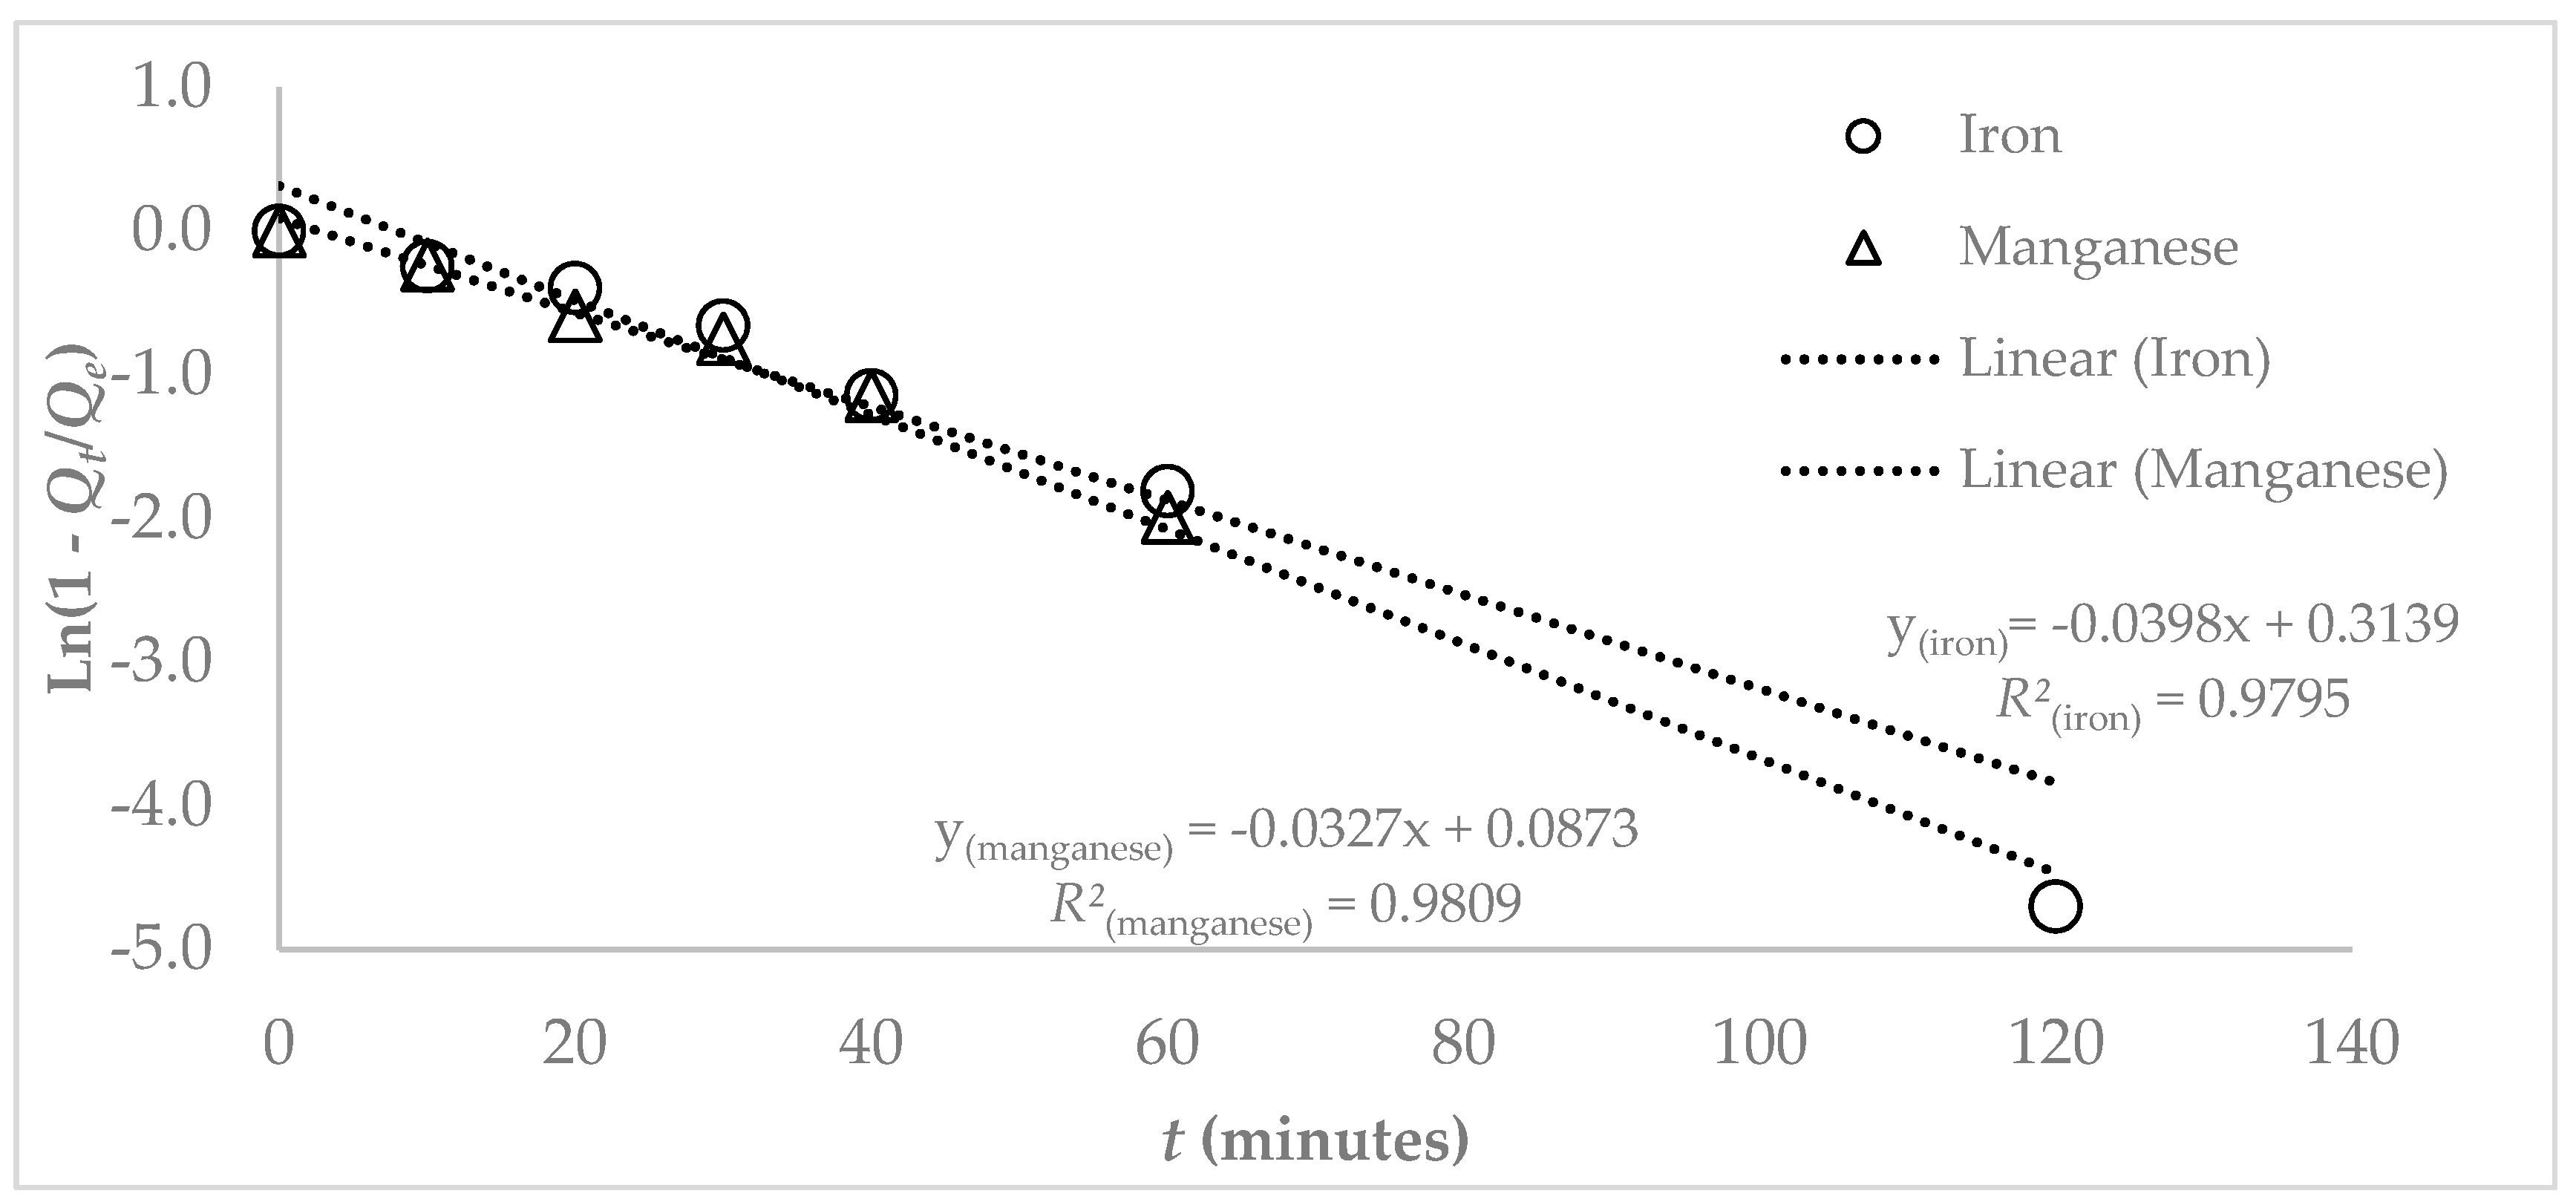
K2 obtained from sorption kinetic models were used to correlate the experimental data on zeolite Y. It is worthy to note that the pseudo-first reaction constant has a higher value for the sorption kinetic of iron and manganese than those obtained from pseudo-second order kinetics. Furthermore, the
R2 values obtained indicate a better correlation for pseudo-first order (
Figure 10) compared with pseudo-second order (
Figure 11) kinetics. Hence, these values mean that the sorption followed first-order kinetics.
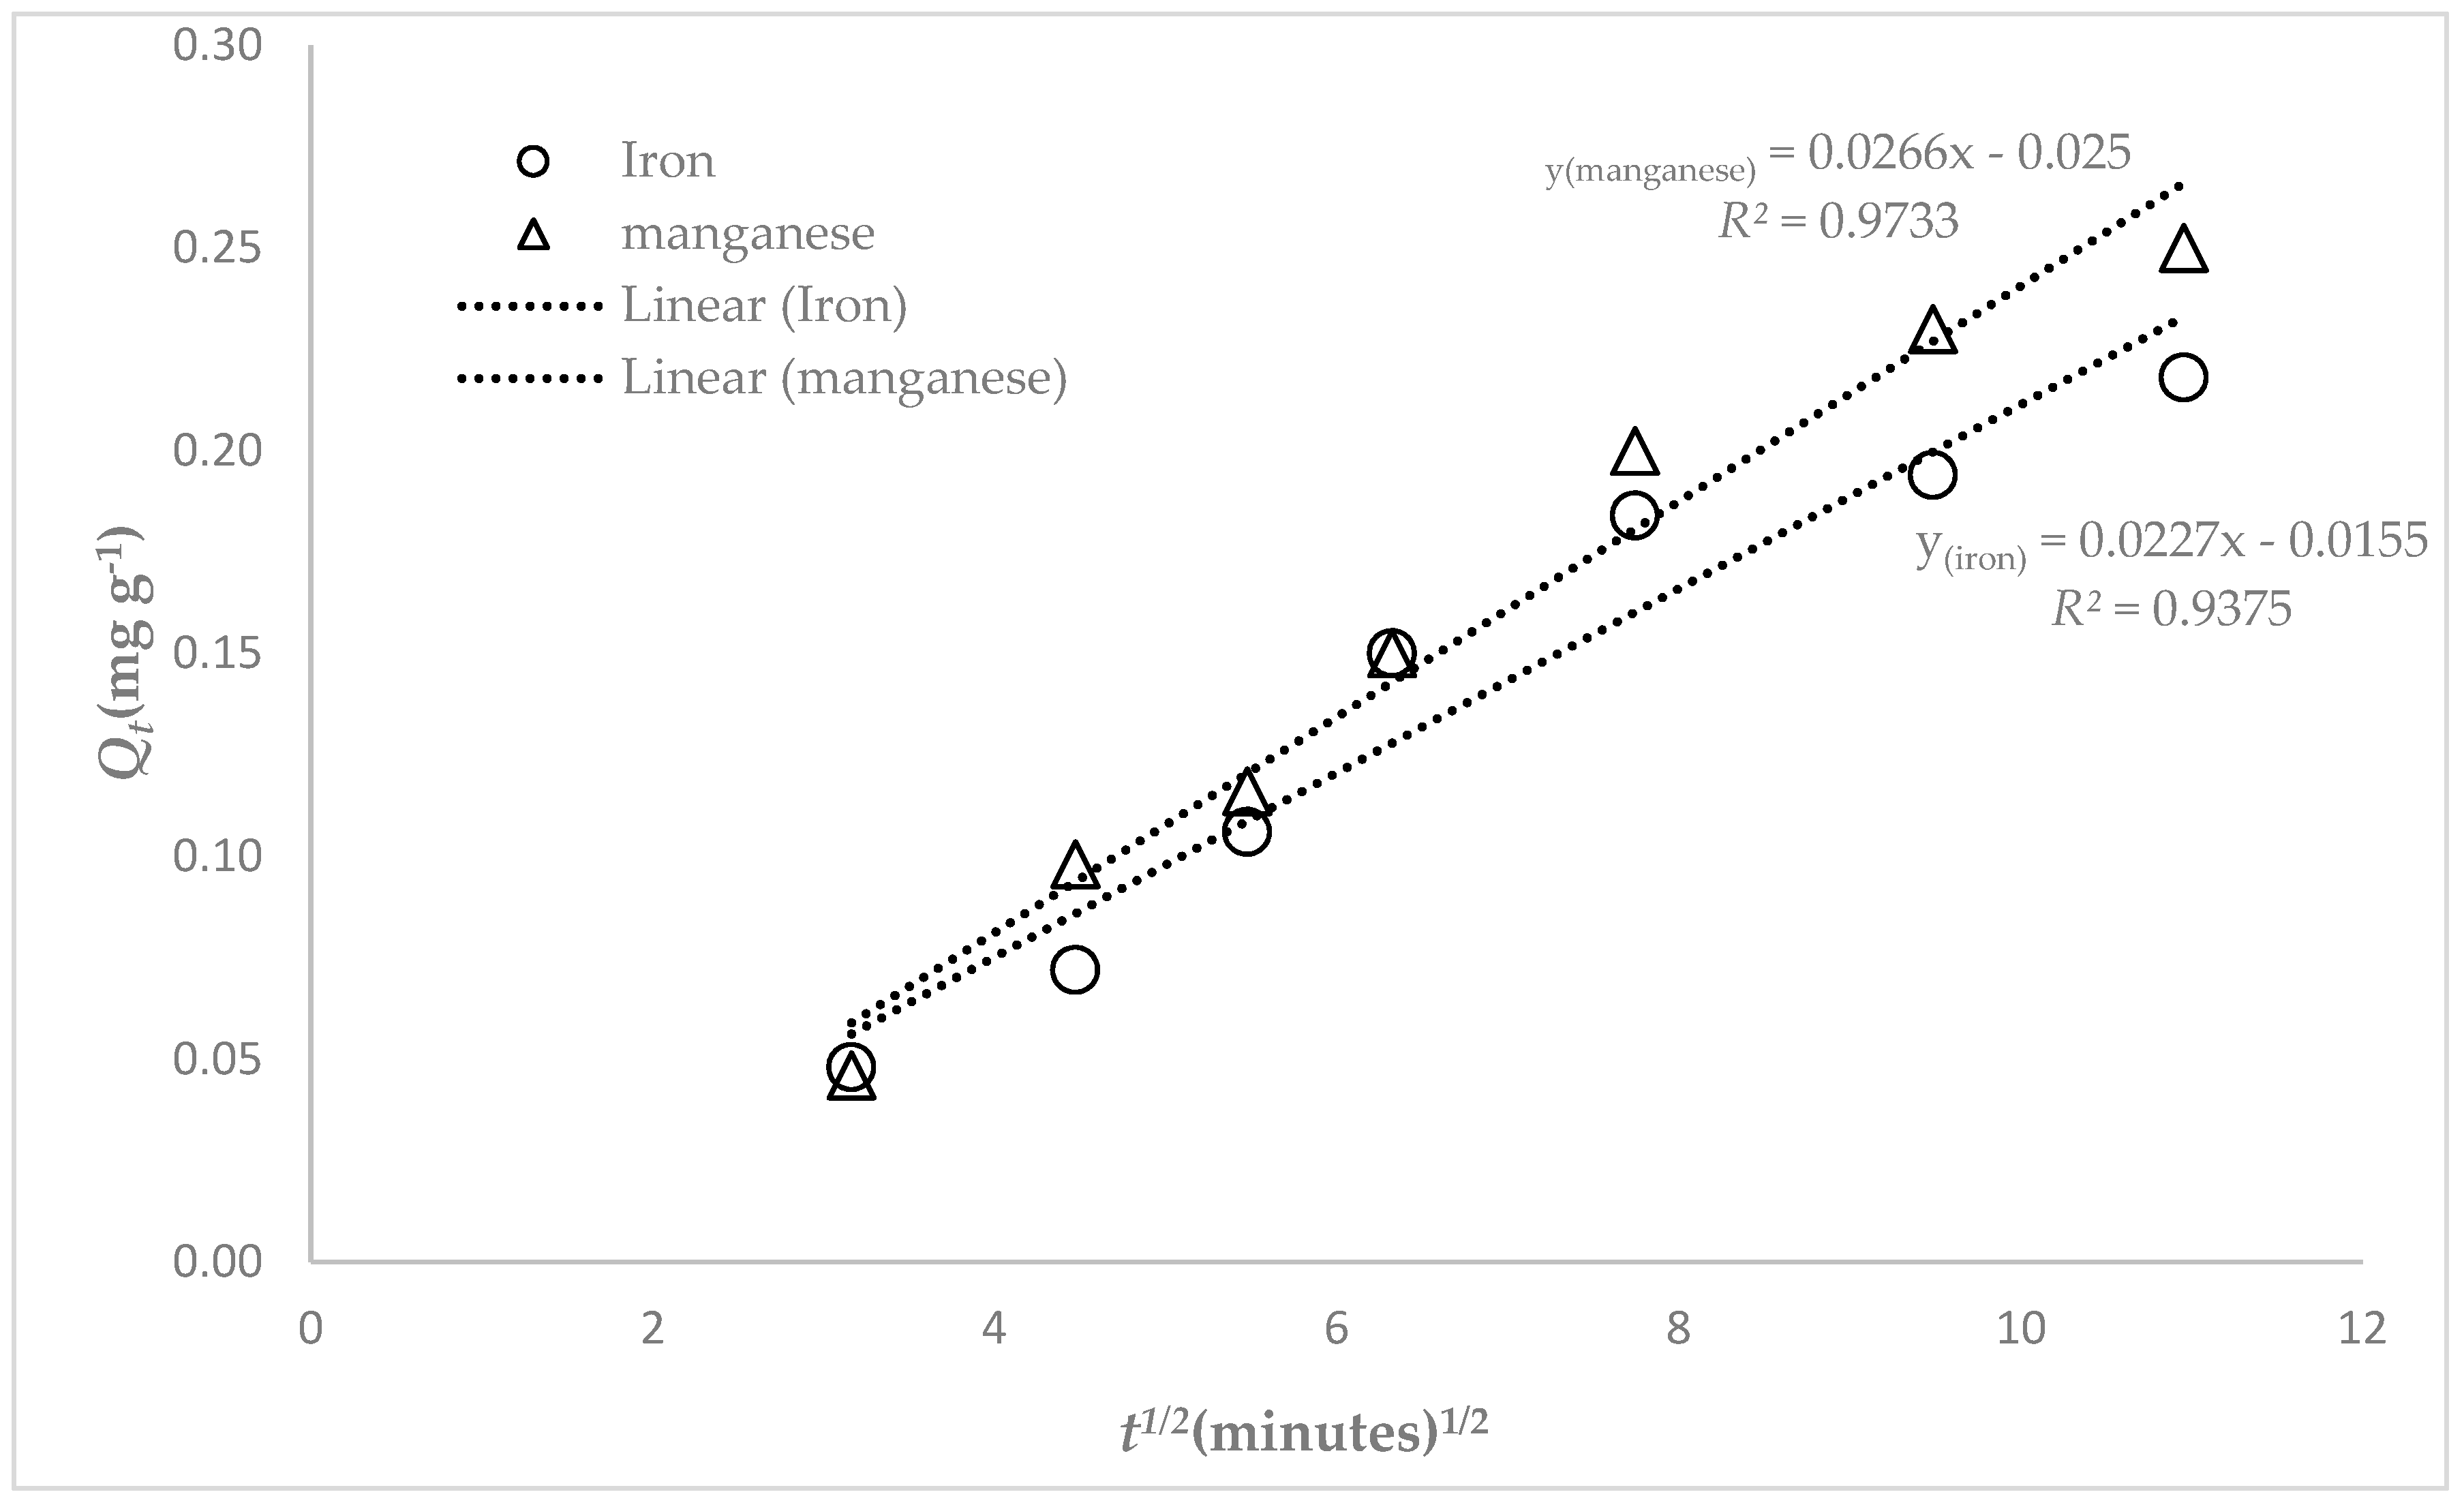
When intra particle diffusion alone is the rate limiting step, then the plot of Qt versus t1/2 passes through the origin. When film diffusion is also taking place then the intercept is C, which gives an idea of the thickness of the boundary layer.
The initial linear portion in the plot Fe and Mn adsorbed versus
t1/2 (
Figure 12) corresponds to the intra-particle diffusion process and the plateau to the equilibrium state. The values of
Ki (=0.009
) for Fe(II) and (
) for Mn(II) are equal to the slope of the intra-particle diffusion line. The fact that intra-particle diffusion curves did not cross the origin of the axes is indicative of the rapid adsorption of Fe(II) and Mn(II) onto the exterior surface of the adsorbent. However, the negative value of the intercept may be attributed to the fact that the surface of the zeolite did not slow down the rate of adsorption. Hence, the intra-particle diffusion was not the rate determining step in the adsorption process. Thus it was clear that from the intra particle diffusion plots shown in
Figure 12 that the adsorption processes followed two steps: The first linear portion followed the boundary layer diffusion followed by another linear portion which represents the liquid film diffusion (
Figure 13). This shows that the adsorption processes were not only by intra particle diffusion but the film diffusion also played a role in both the observed processes [
35,
36].
It is well established that the addition of zeolites to drinking water results in complex pH variations where ion exchange is accompanied by a variety of hydrolytic side reactions resulting in additional hydronium ion exchange as well as the precipitation of metal hydroxides [
37,
38,
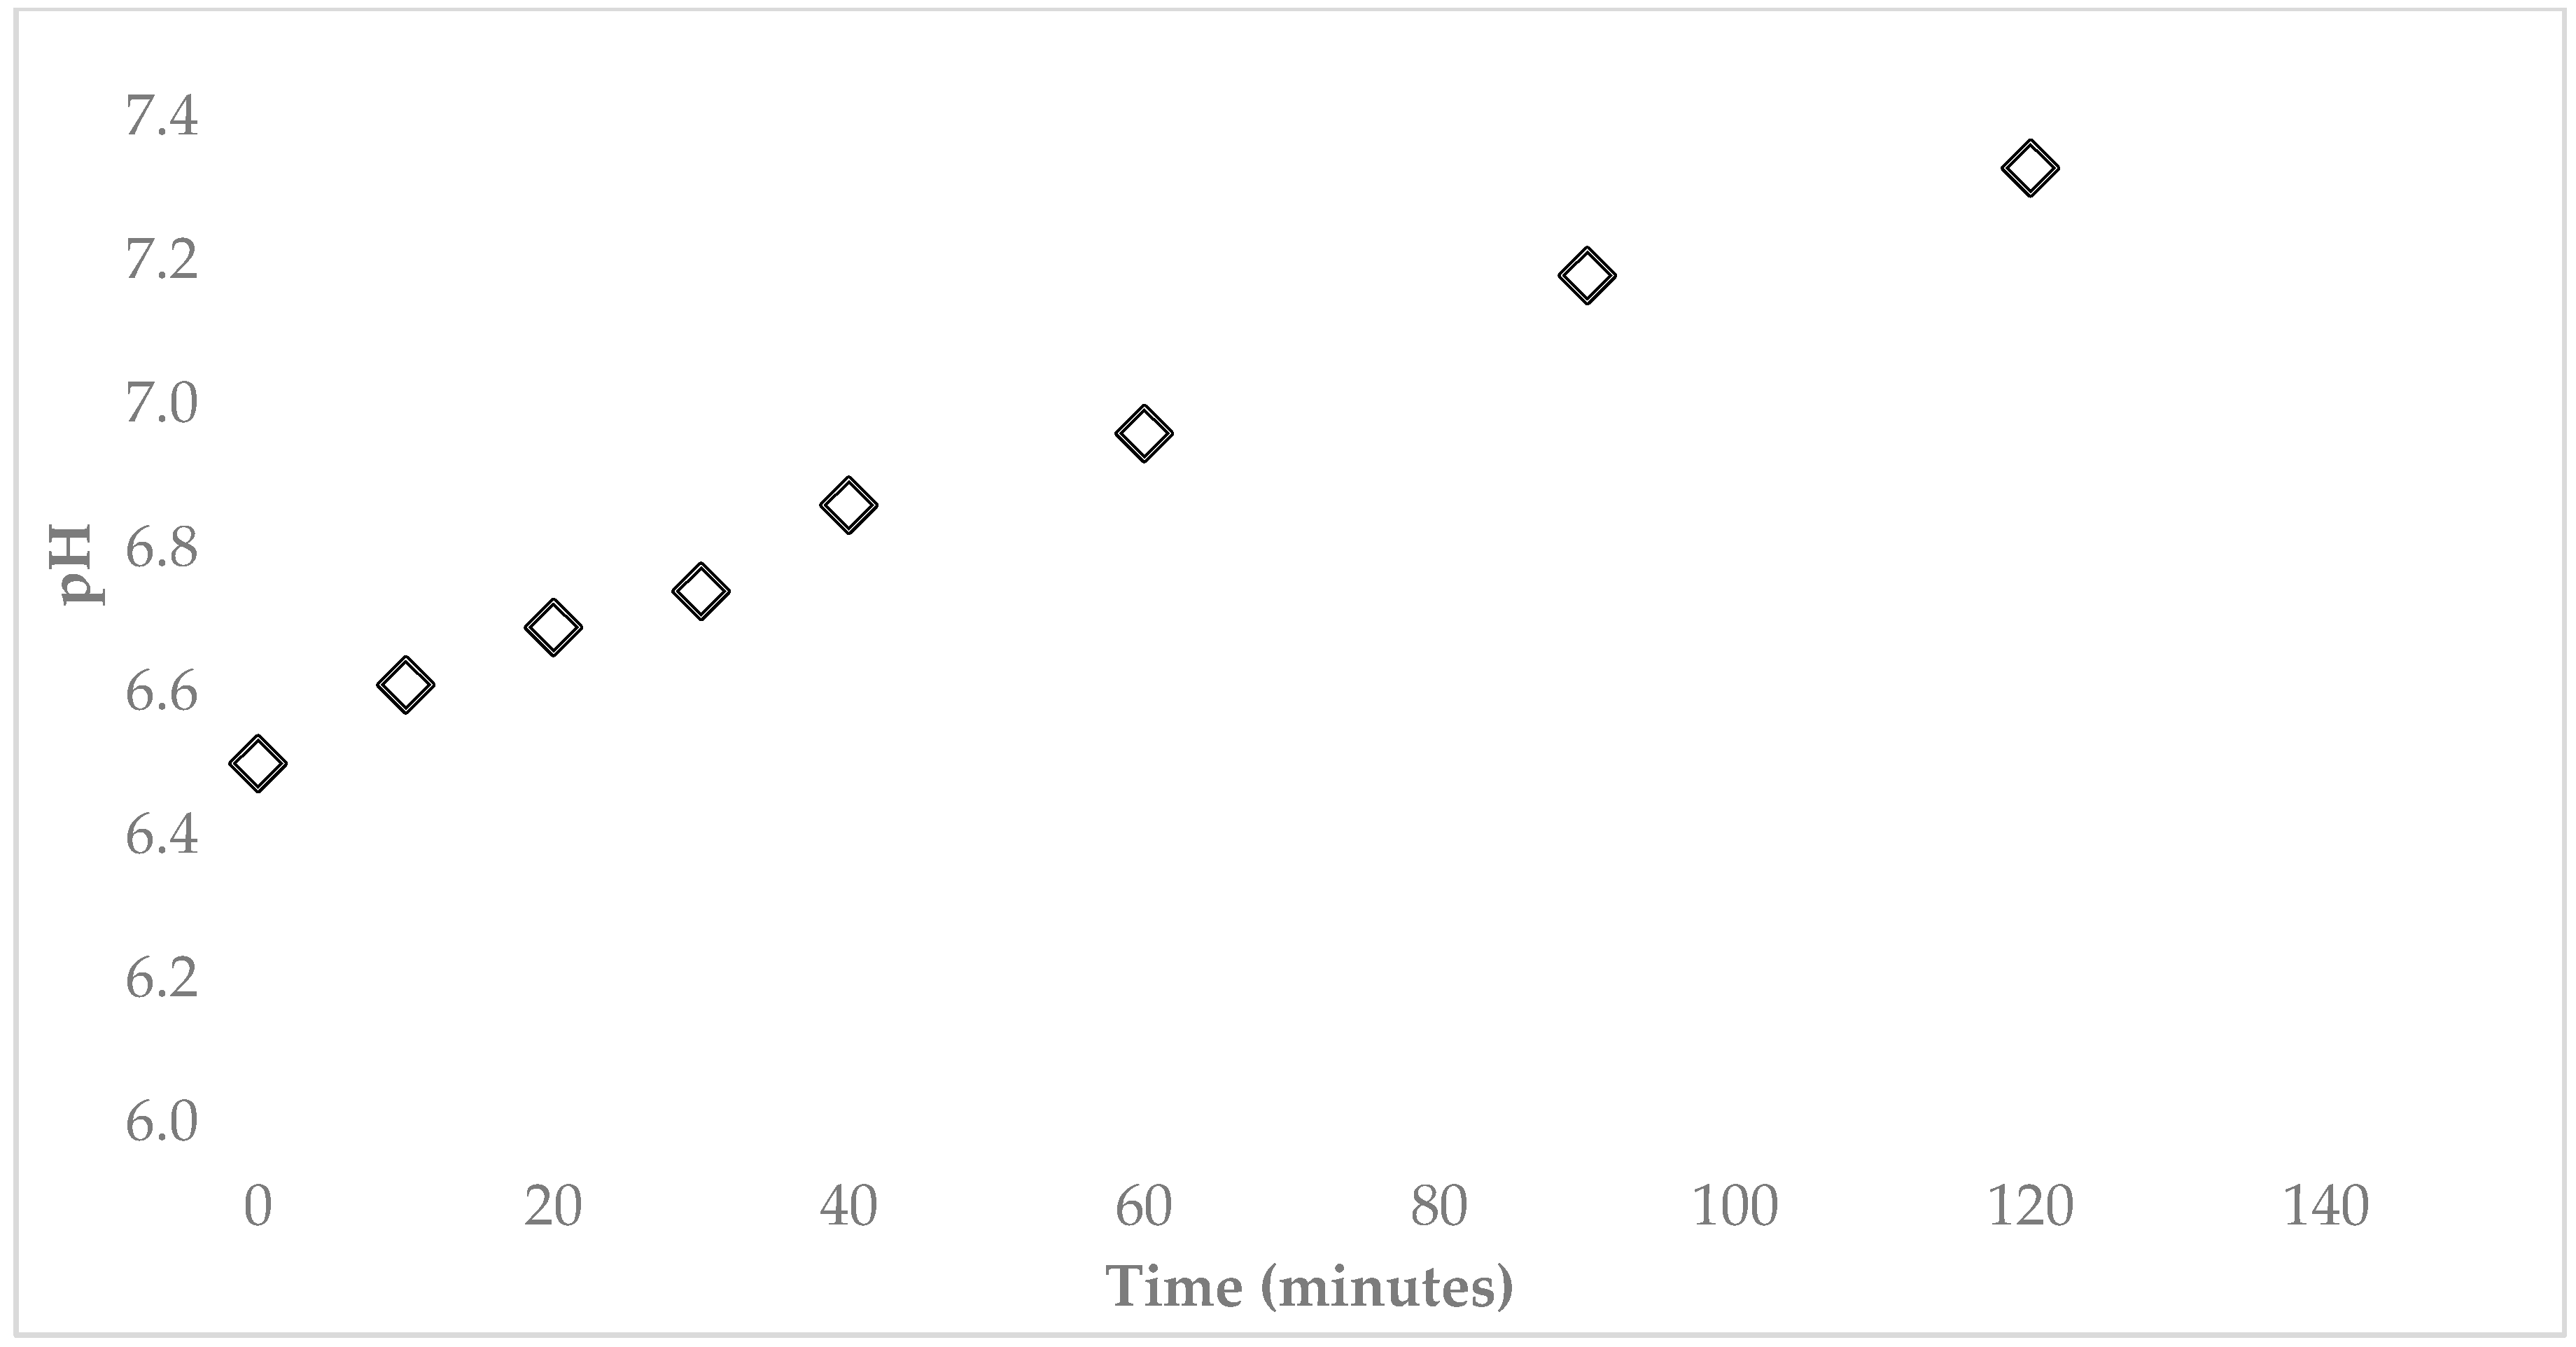
39]. As shown in
Figure 14, the pH immediately increased upon an addition of the zeolite to reach a maximum after 5 min and then slowly to attain a fairly weak neutral (pH = 7.3–7.4). The immediate pH increase after the addition of Na-Y can be attributed to a hydrolysis of the zeolite [
37,
38].
The indigenous zeolitic sodium cations were partially exchanged by hydronium ions forming free hydroxide. The hydroxide formed is responsible for the pH increase of the solution. The addition of Na-Y to the water samples was also accompanied by an immediate increase in pH to a maximum value of 7.4 that then maintained to a constant value of 7.3 due to a partial dissolution of the zeolite in the alkaline solution accompanied by a consumption of hydroxide ions [
32,
40]. The increase in solution pH can be attributed to an uptake of the hydroxide ions originating from the hydrolysis of the zeolite [
40,
41]. Similar reaction sequences can be attributed to the removal of manganese ions from the water samples. However, since the maximum adsorption of Fe(II) and Mn(II) was achieved at a pH just below 7 (slightly acidic), it is safe to say that the removal of Fe(II) and Mn(II) were due to adsorption rather than to dissolution.
It has been reported that in general, manganese removal is higher than Mn for clinoptilolite, a natural zeolite [
34,
42]. Overall, Fe and Mn removal levels are 22–90% and 61–100% for clinoptilolite. These removal levels are comparable to the ones obtained by zeolite Y as shown in this work for the simultaneous iron and manganese removal from water samples. For instance, in a treatment of iron and manganese in simulated groundwater via ozone technology, at an ozone dose of 1.25 mg L
−1 and an initial iron concentration of 2.6 mg L
−1 and a manganese concentration of 1 mg L
−1, more than 90% of iron was removed, while just only 15% of manganese was eliminated at the same conditions. Increasing the ozone concentration to about 3 mg L
−1 improved the removal of iron to more than 96% while about 83% of manganese was removed [
43].
In another case, the biological removal of Fe (II) and Mn (II) from drilled well water in a biological treatment continuous flow unit in China, resulted in a 99% removal of Fe and 35–75% for Mn, under an initial concentration of 3–8 mg L
−1 for Fe and 2 mg L
−1 for Mn [
35,
38]. In this work both Fe(II) and Mn(II) were equally removed from the potable ground water.

 ,
, 


