The Impact of the Quality of Tap Water and the Properties of Installation Materials on the Formation of Biofilms

 , , and
Abstract
:1. Introduction
2. Materials and Methods
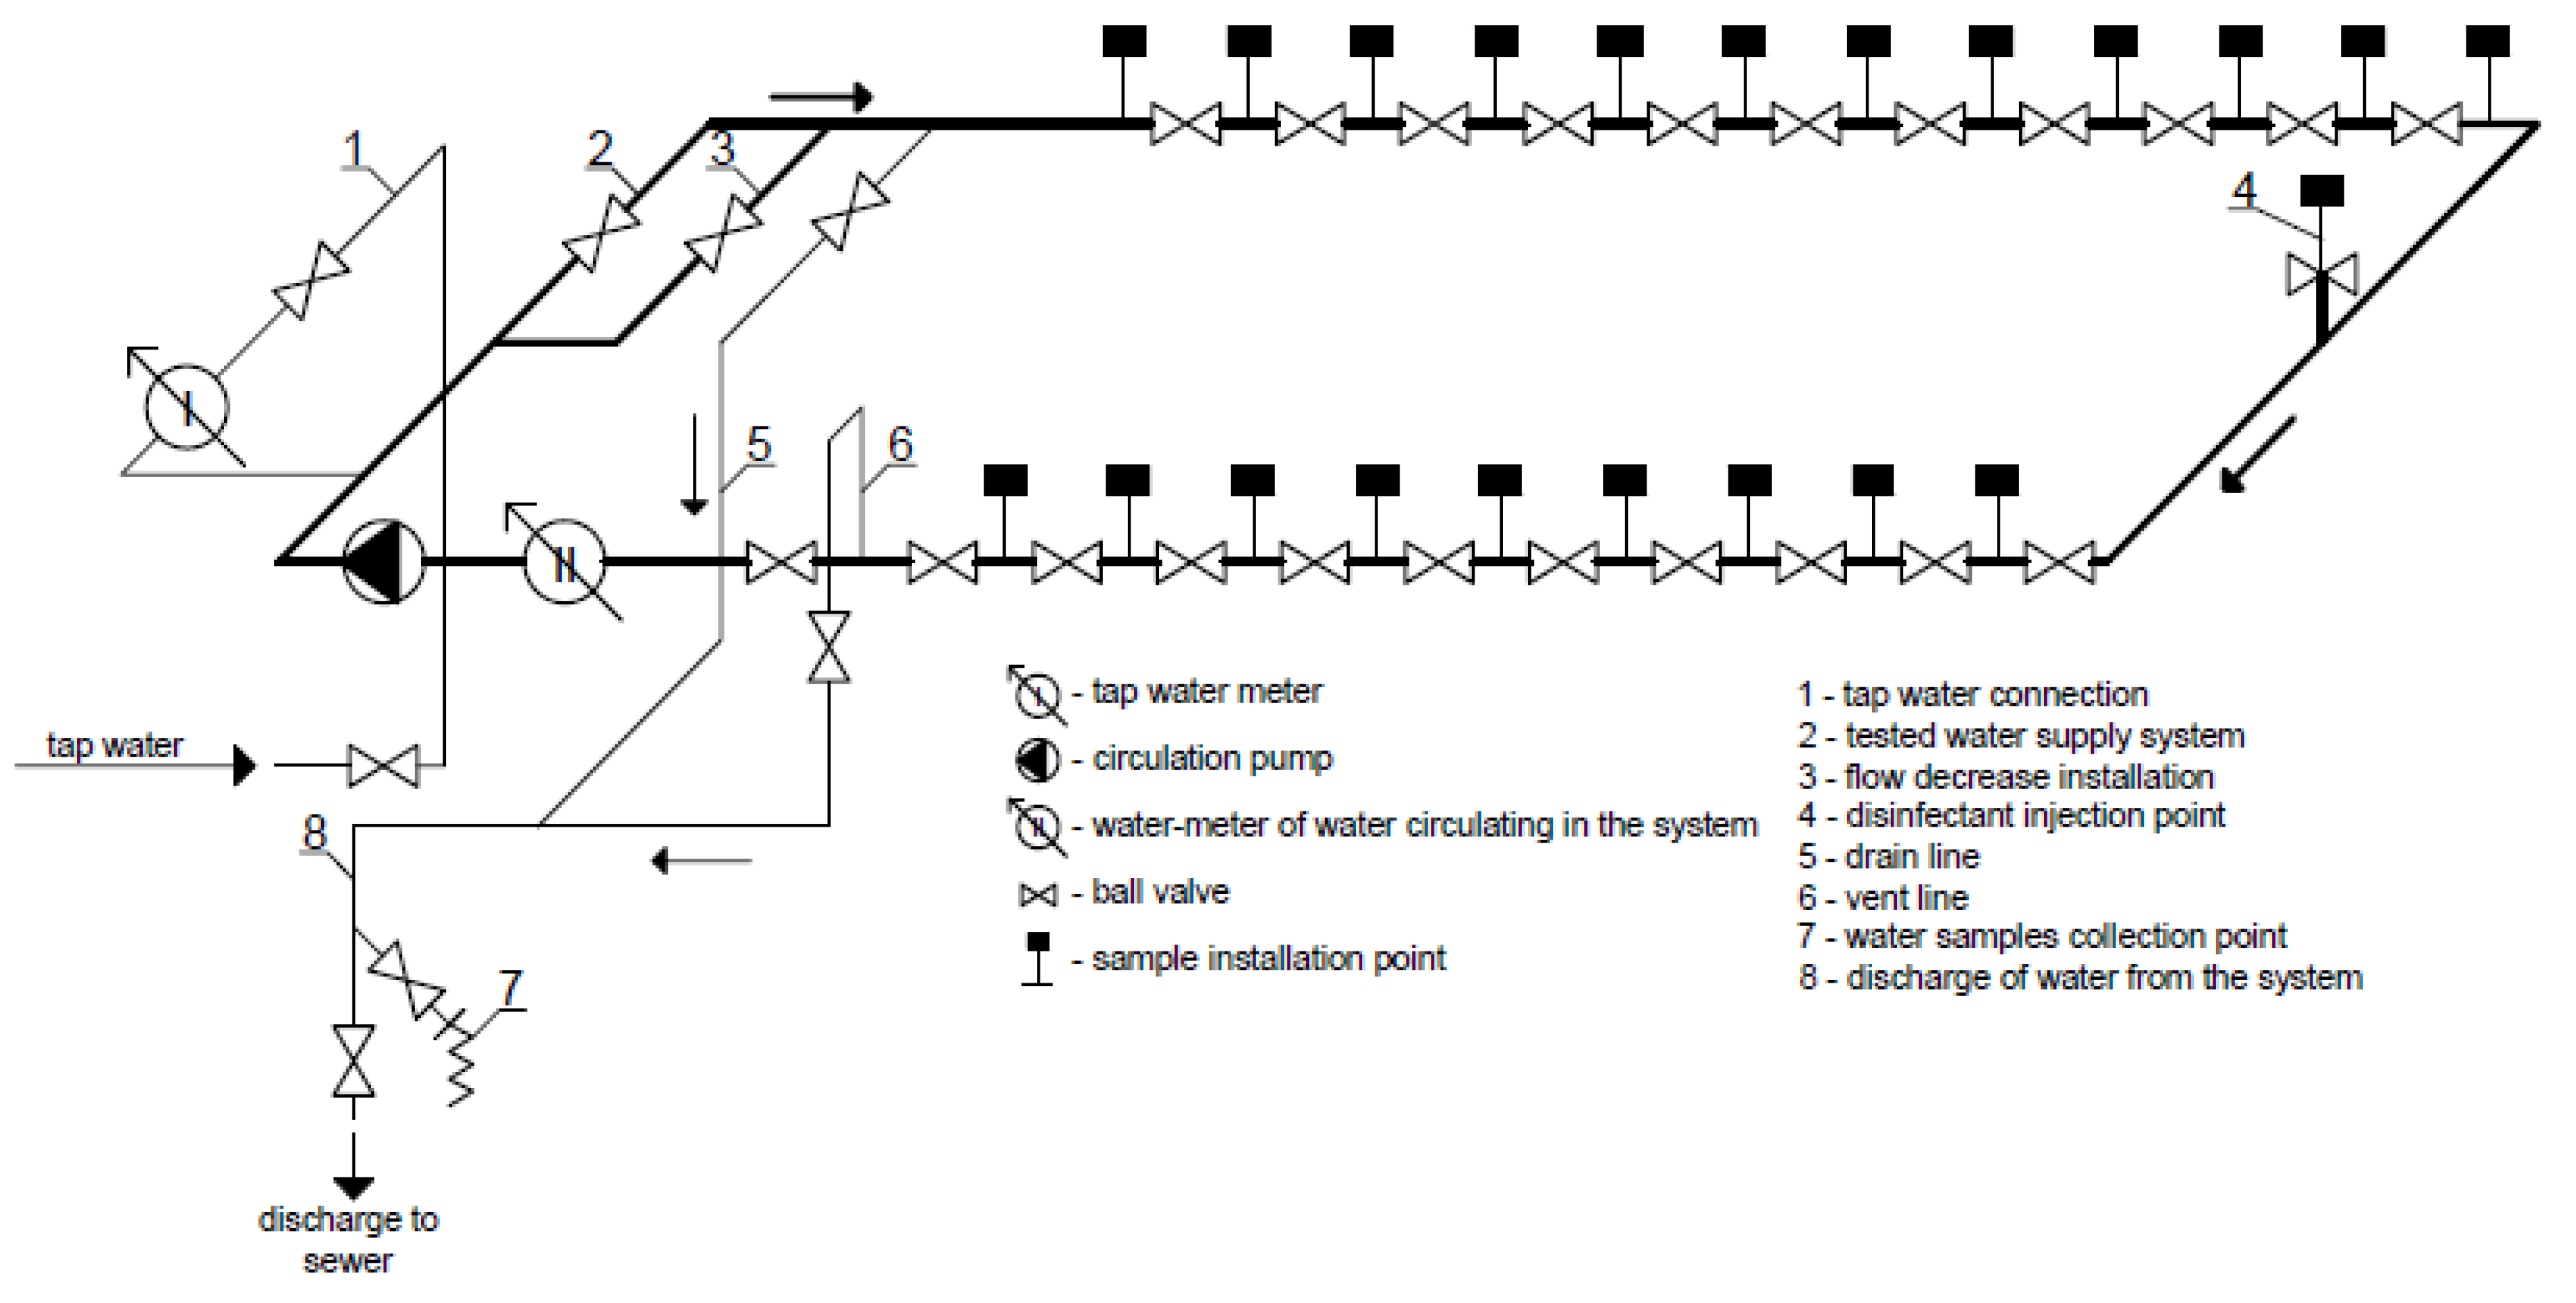
2.1. Subject of Study
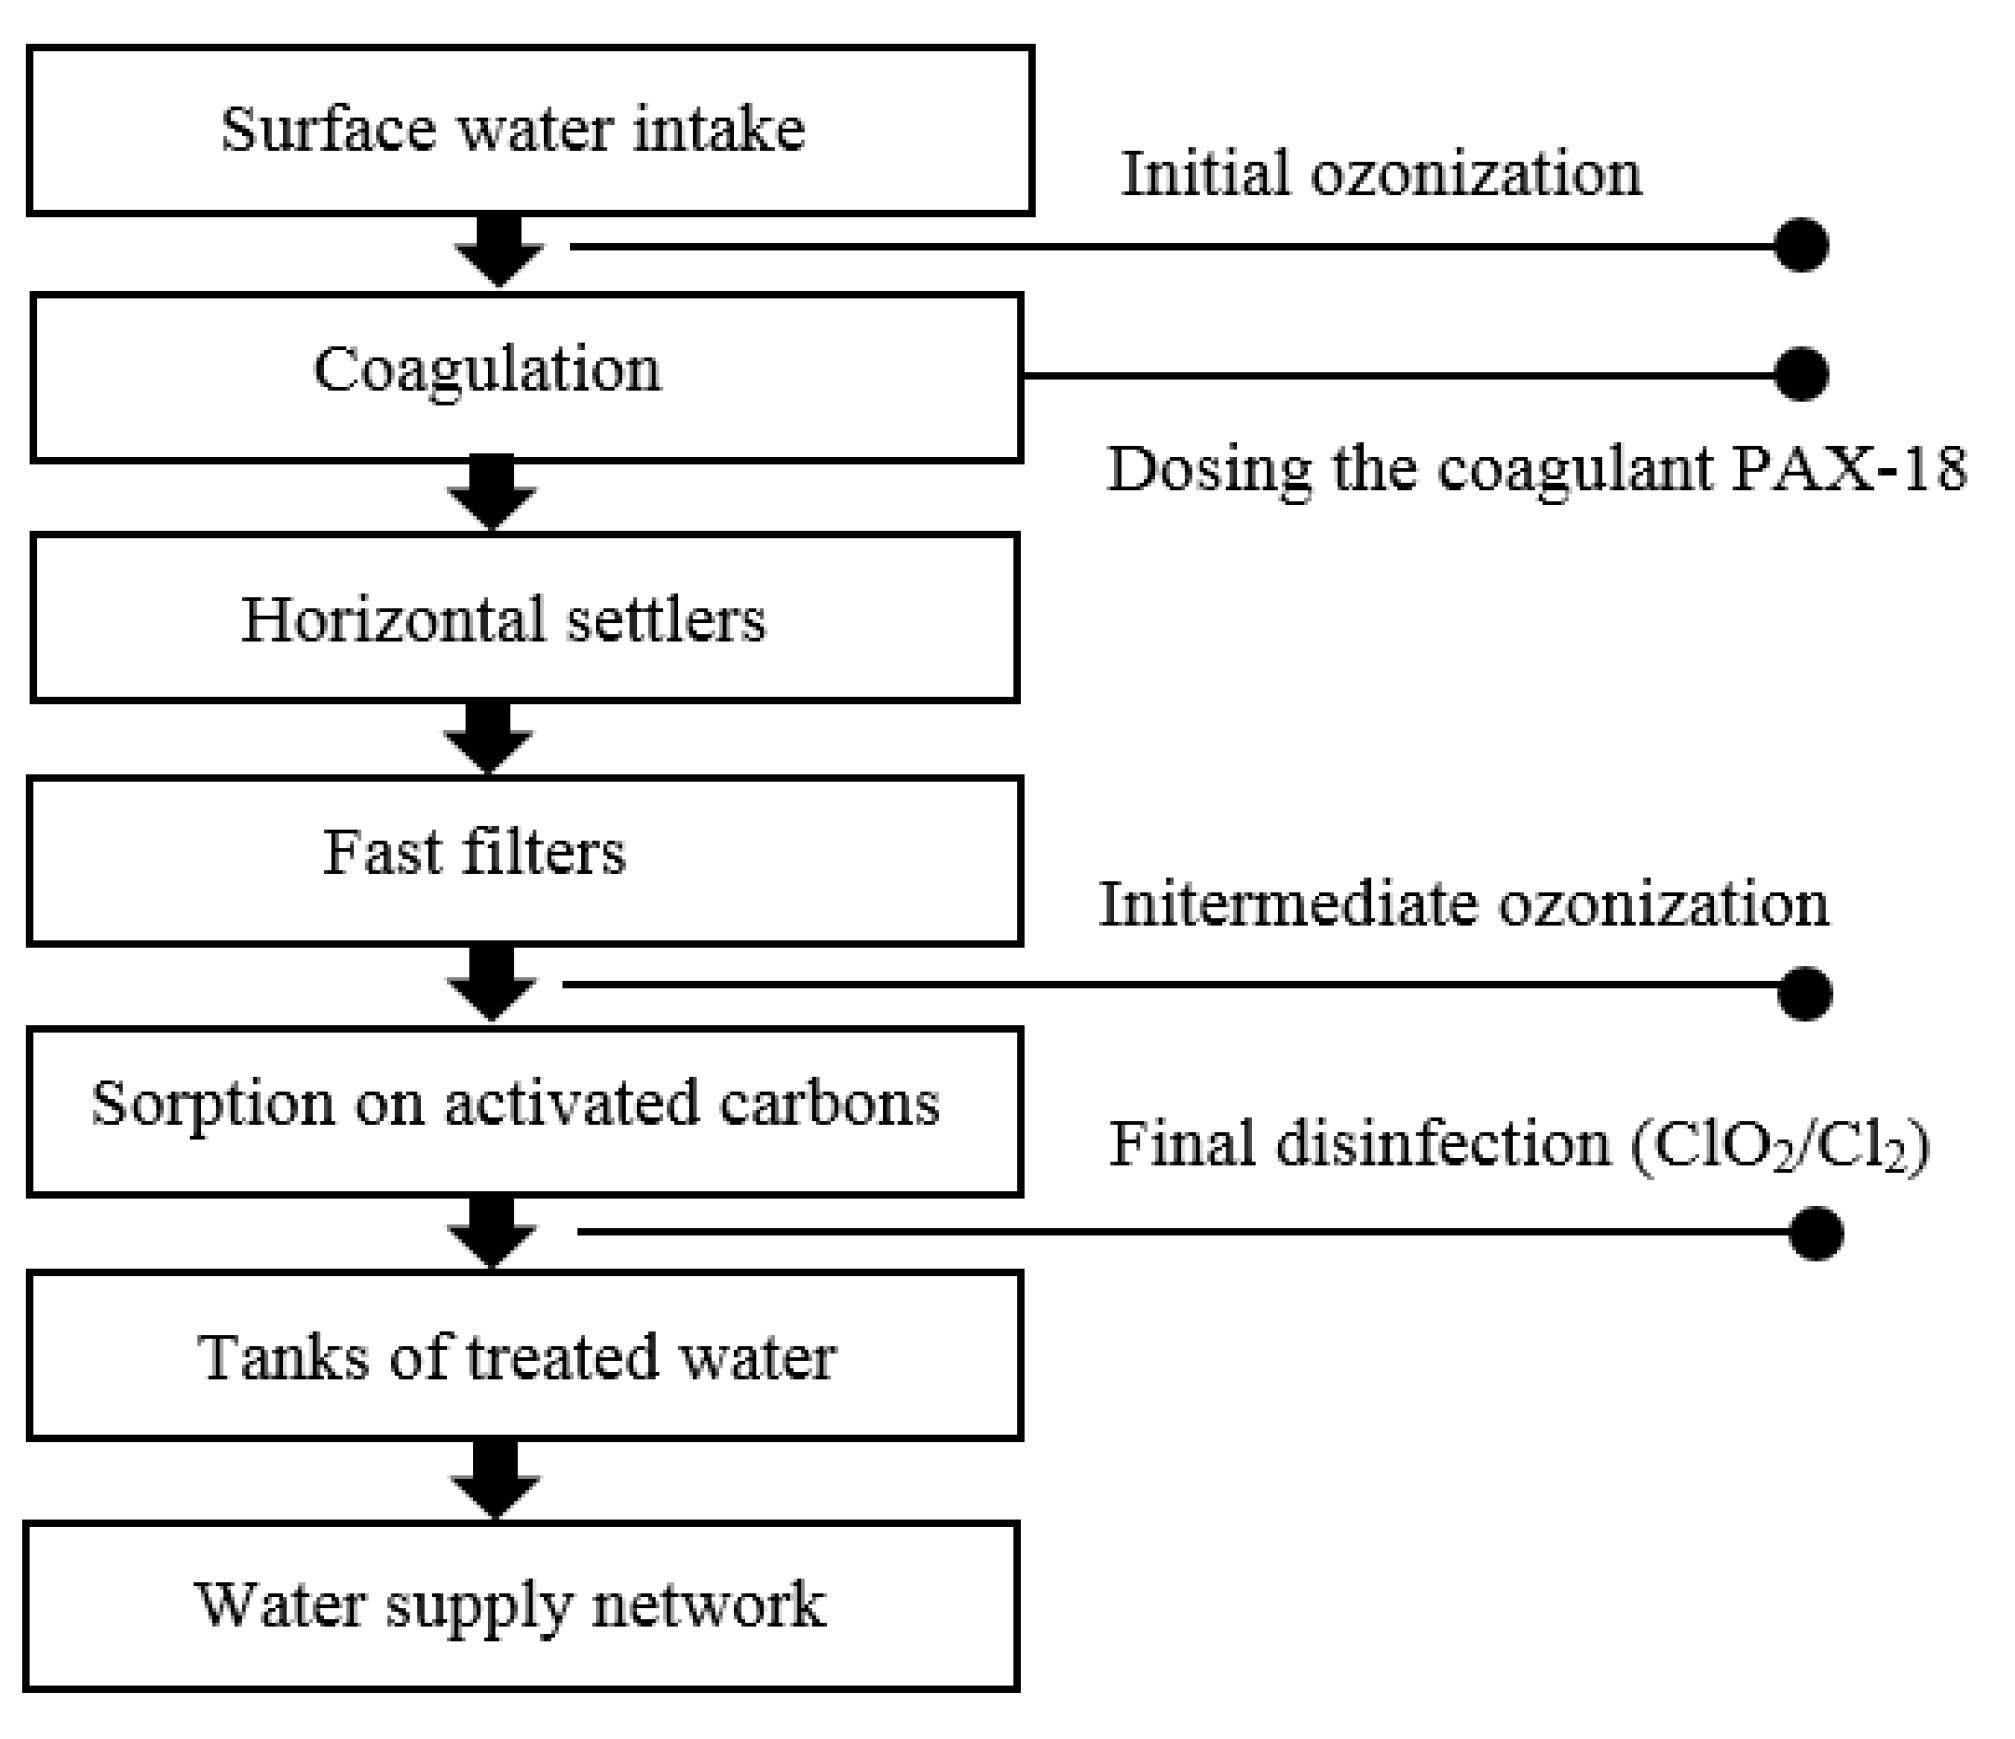
2.2. Water in the Experimental Installation
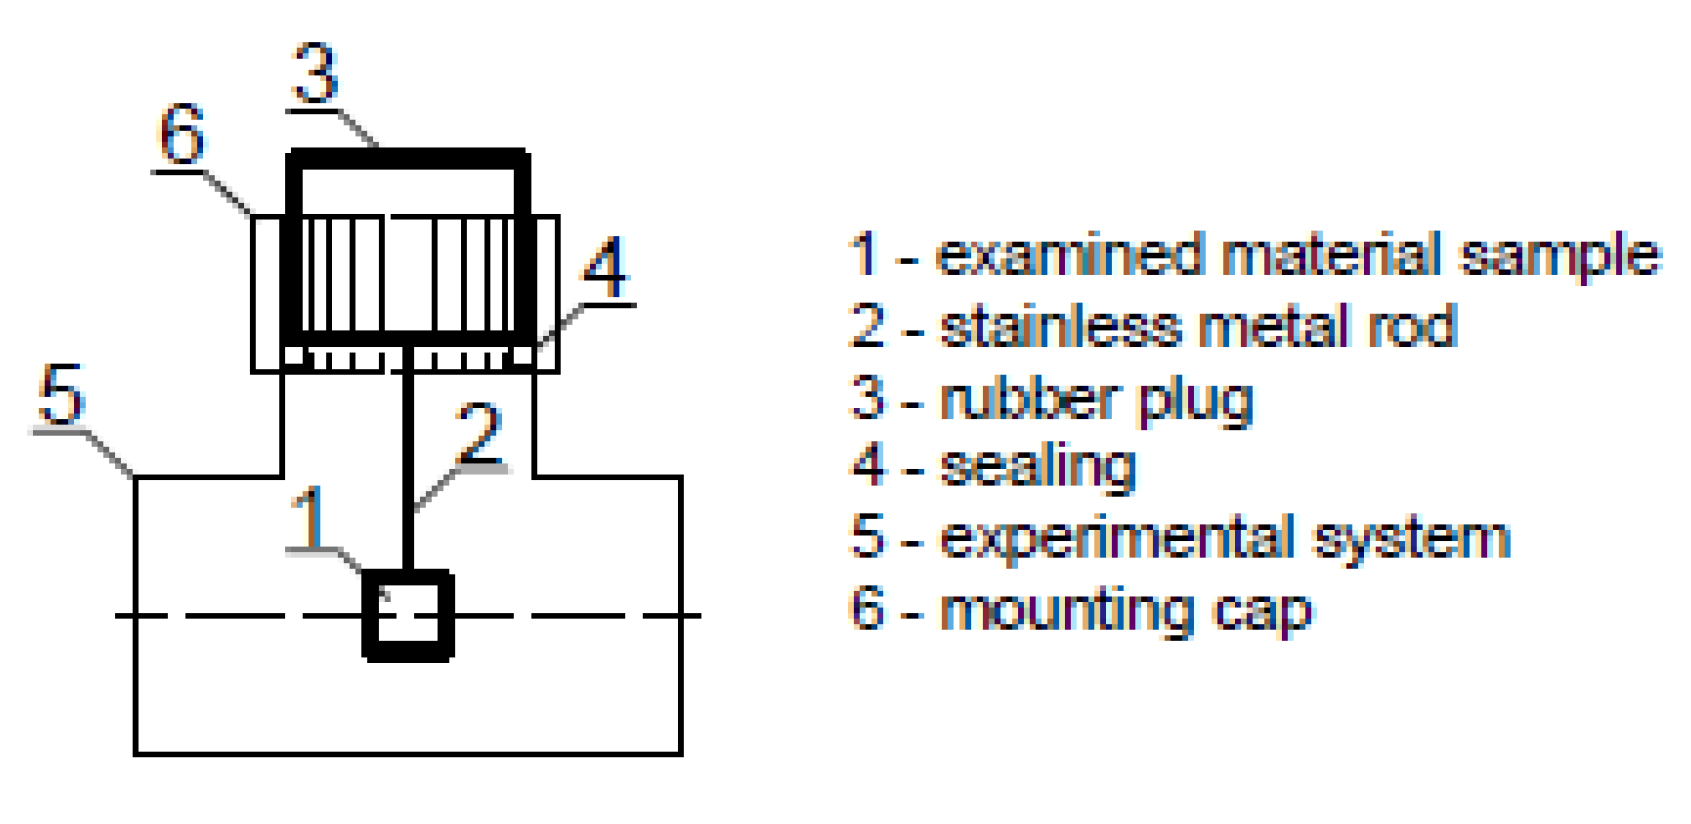
2.3. The Susceptibility of Materials to the Formation of Biofilms in the Experimental Installation
3. Results
3.1. Water Quality Assessment
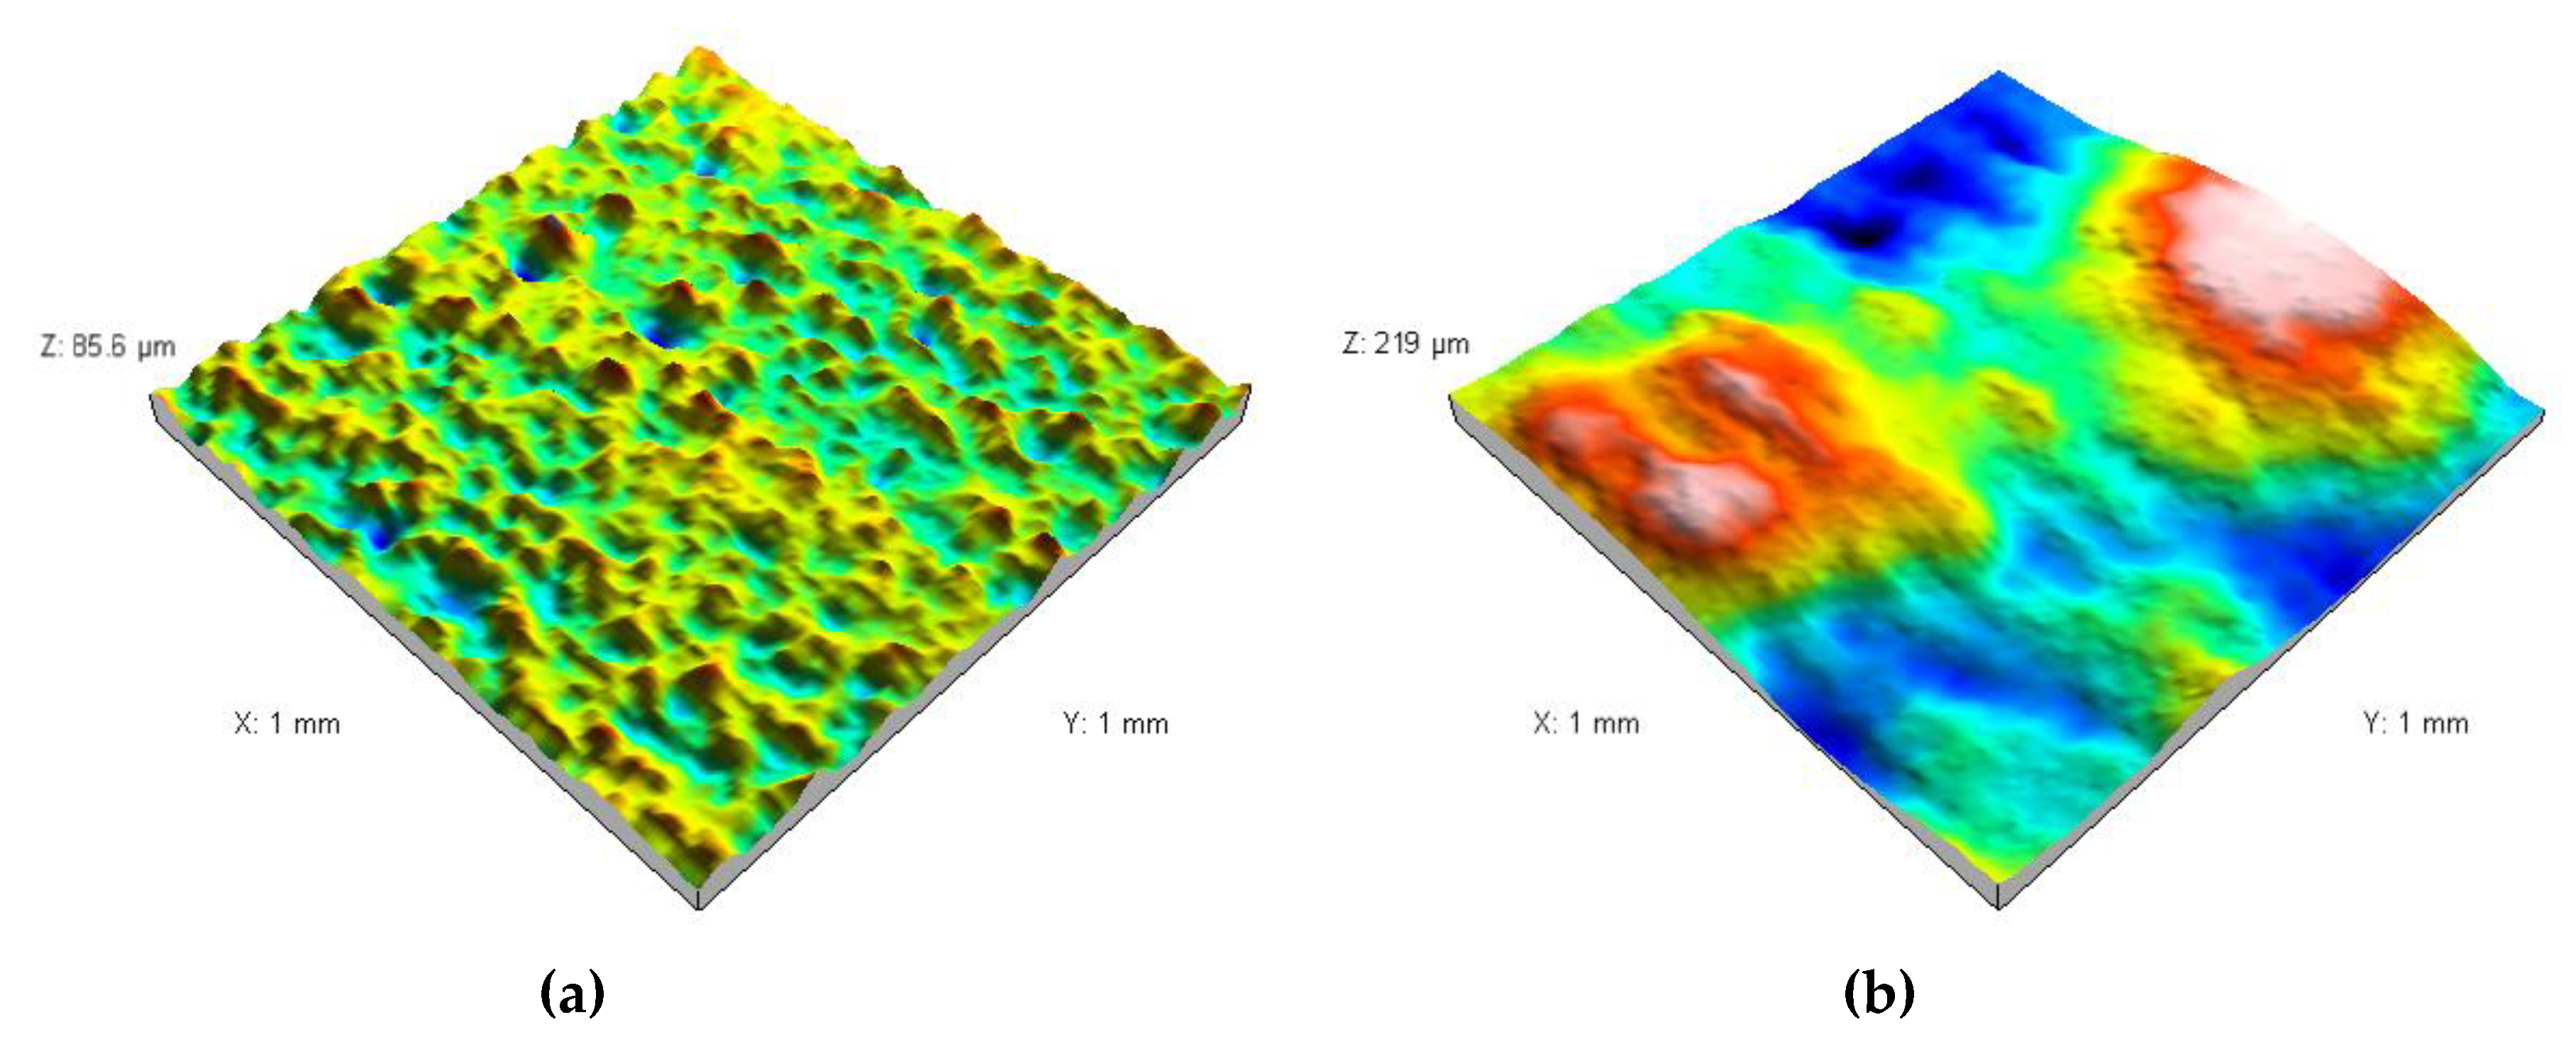
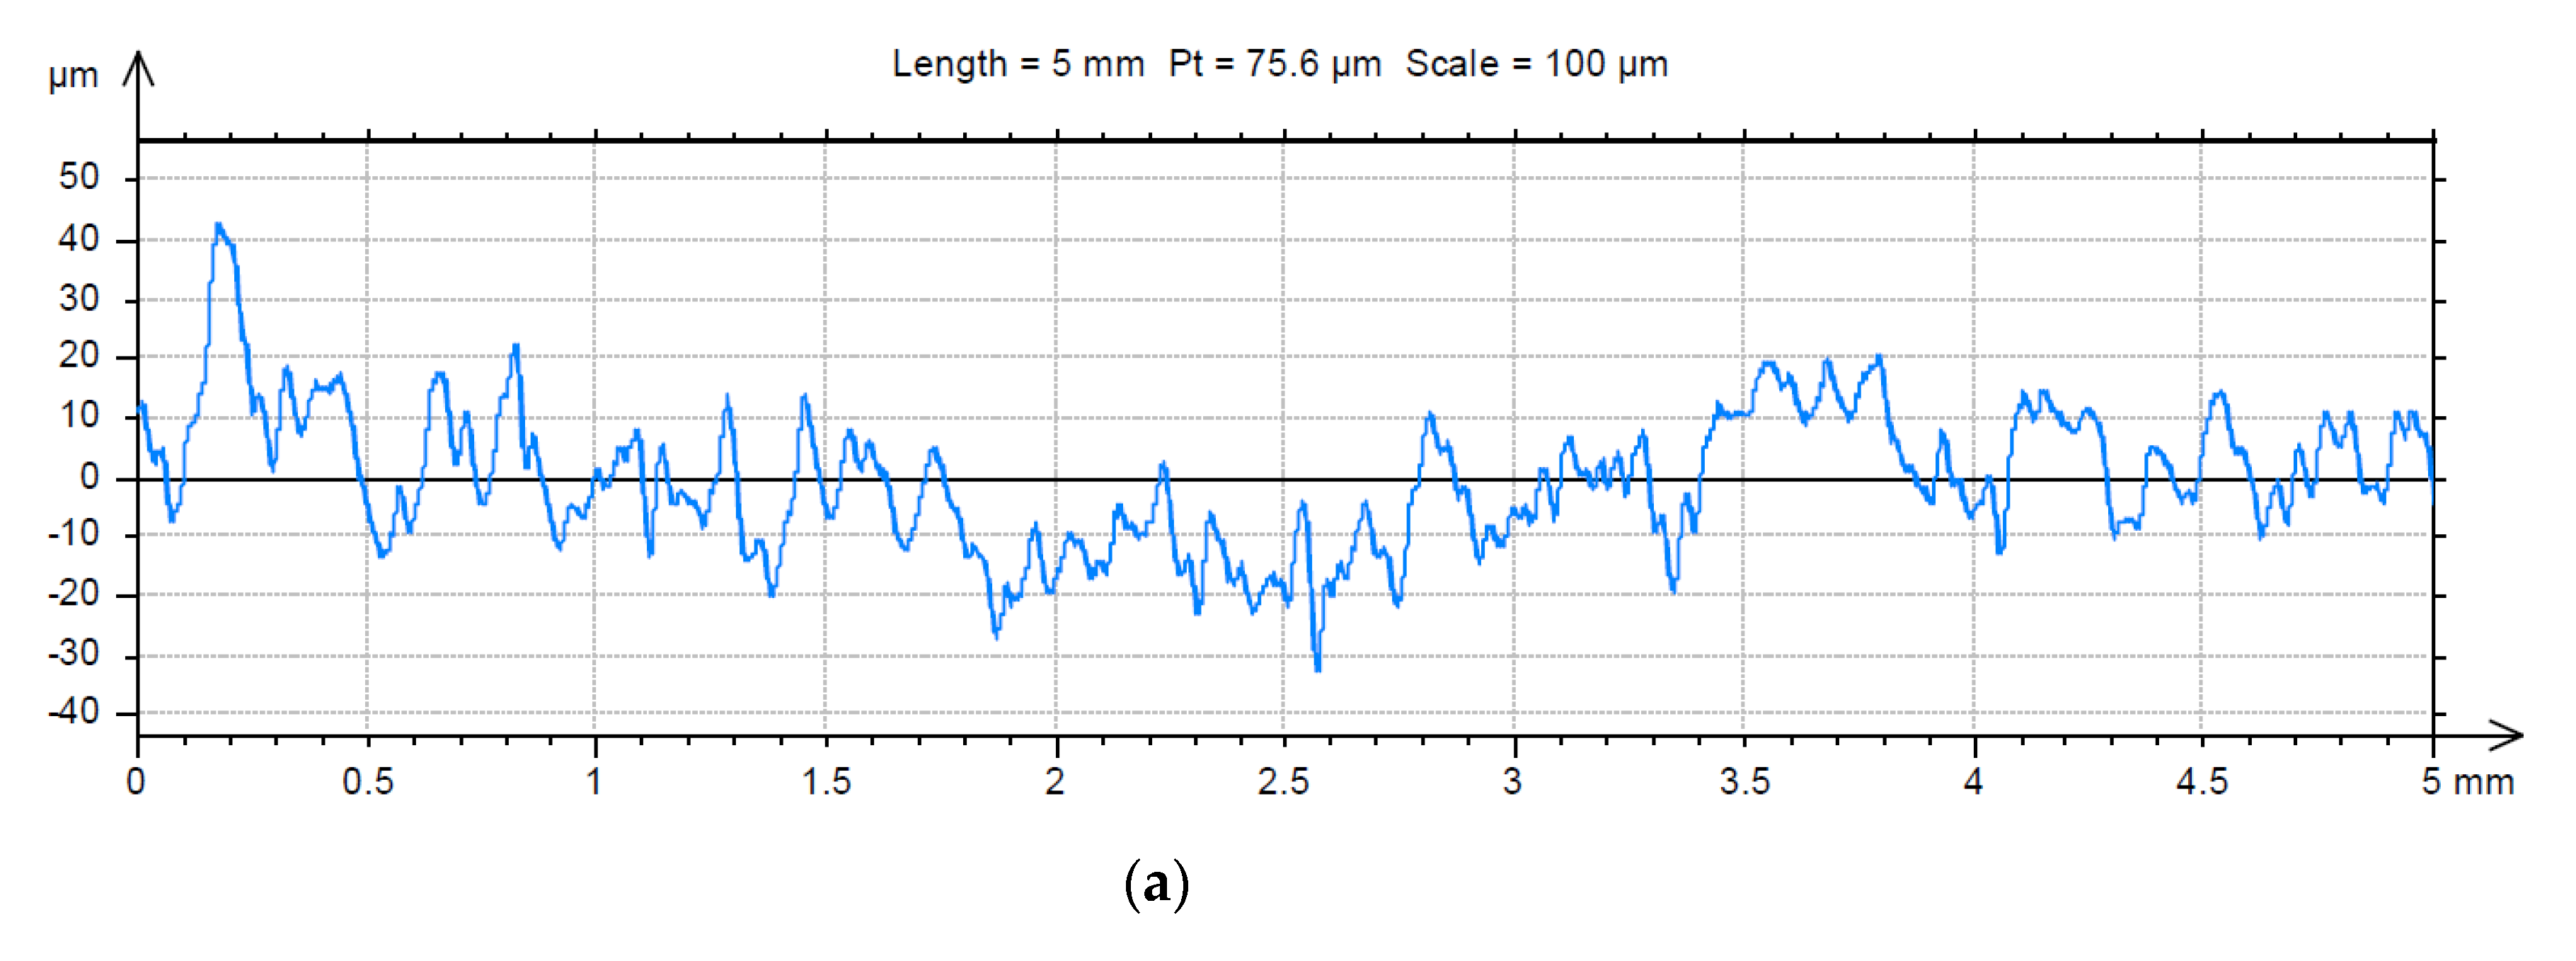
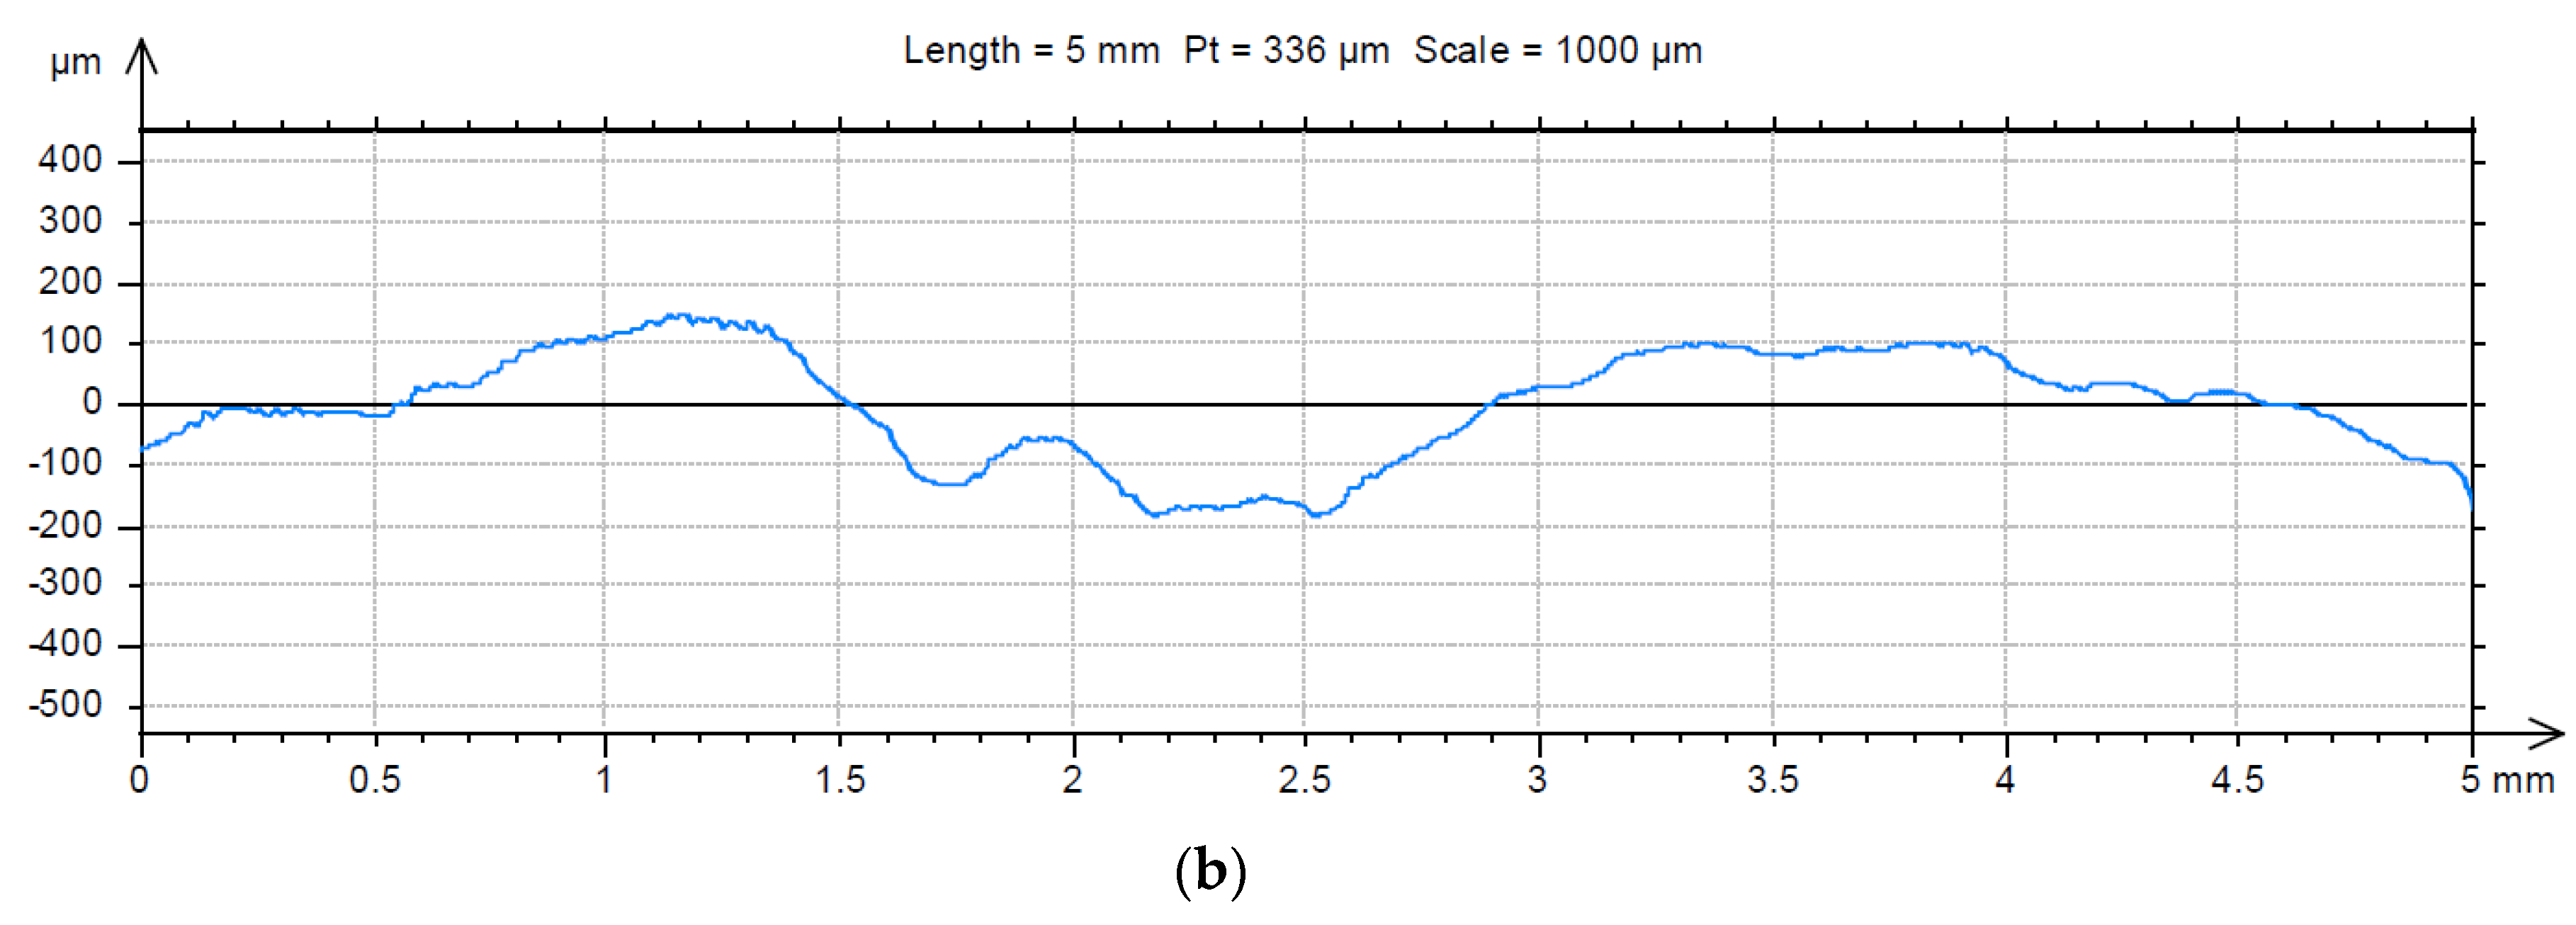
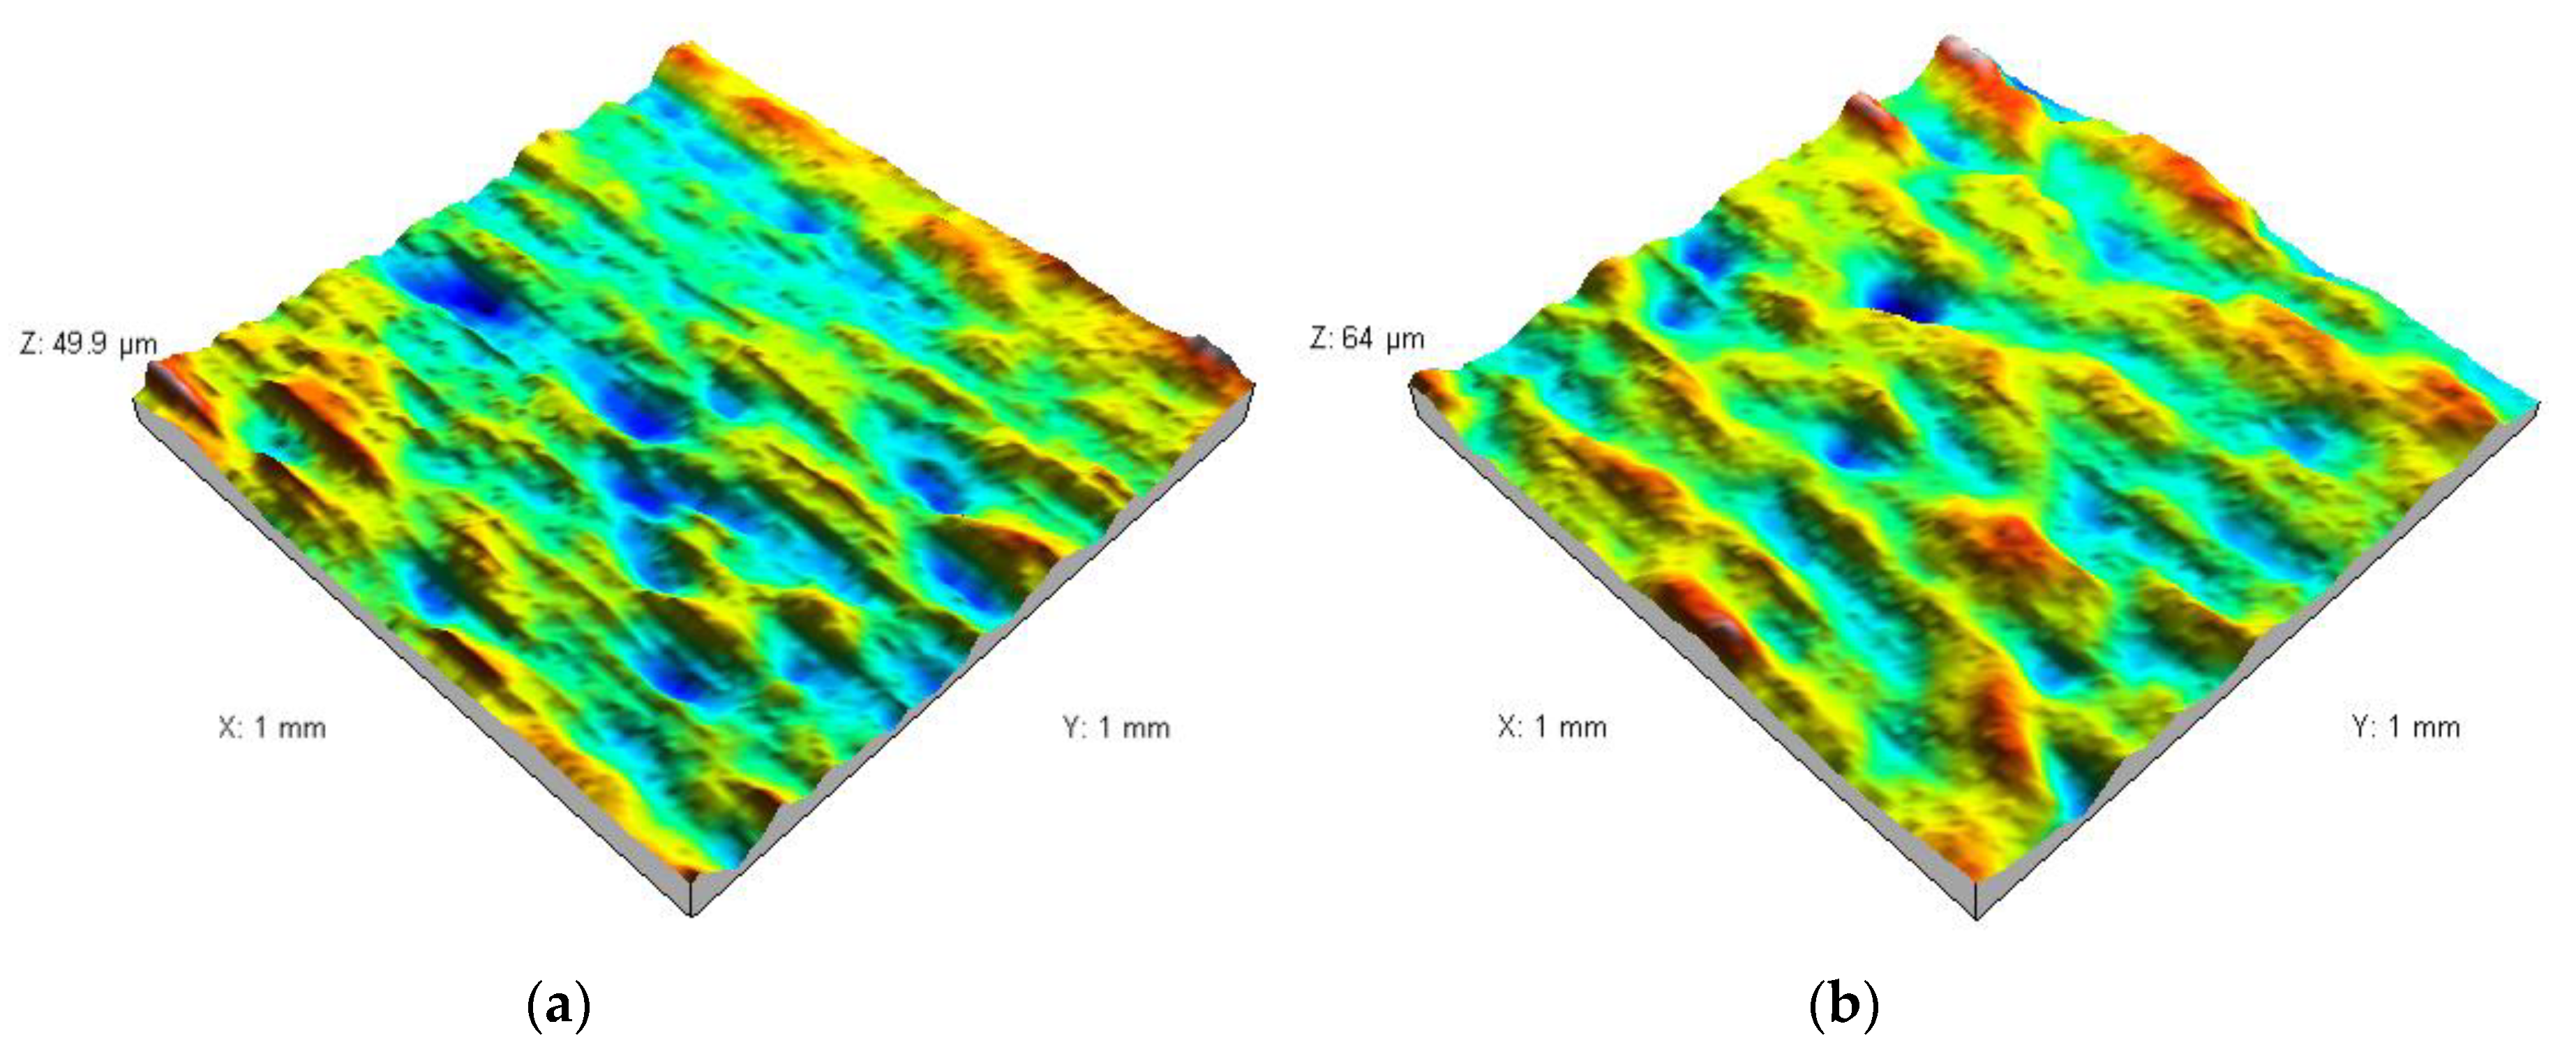
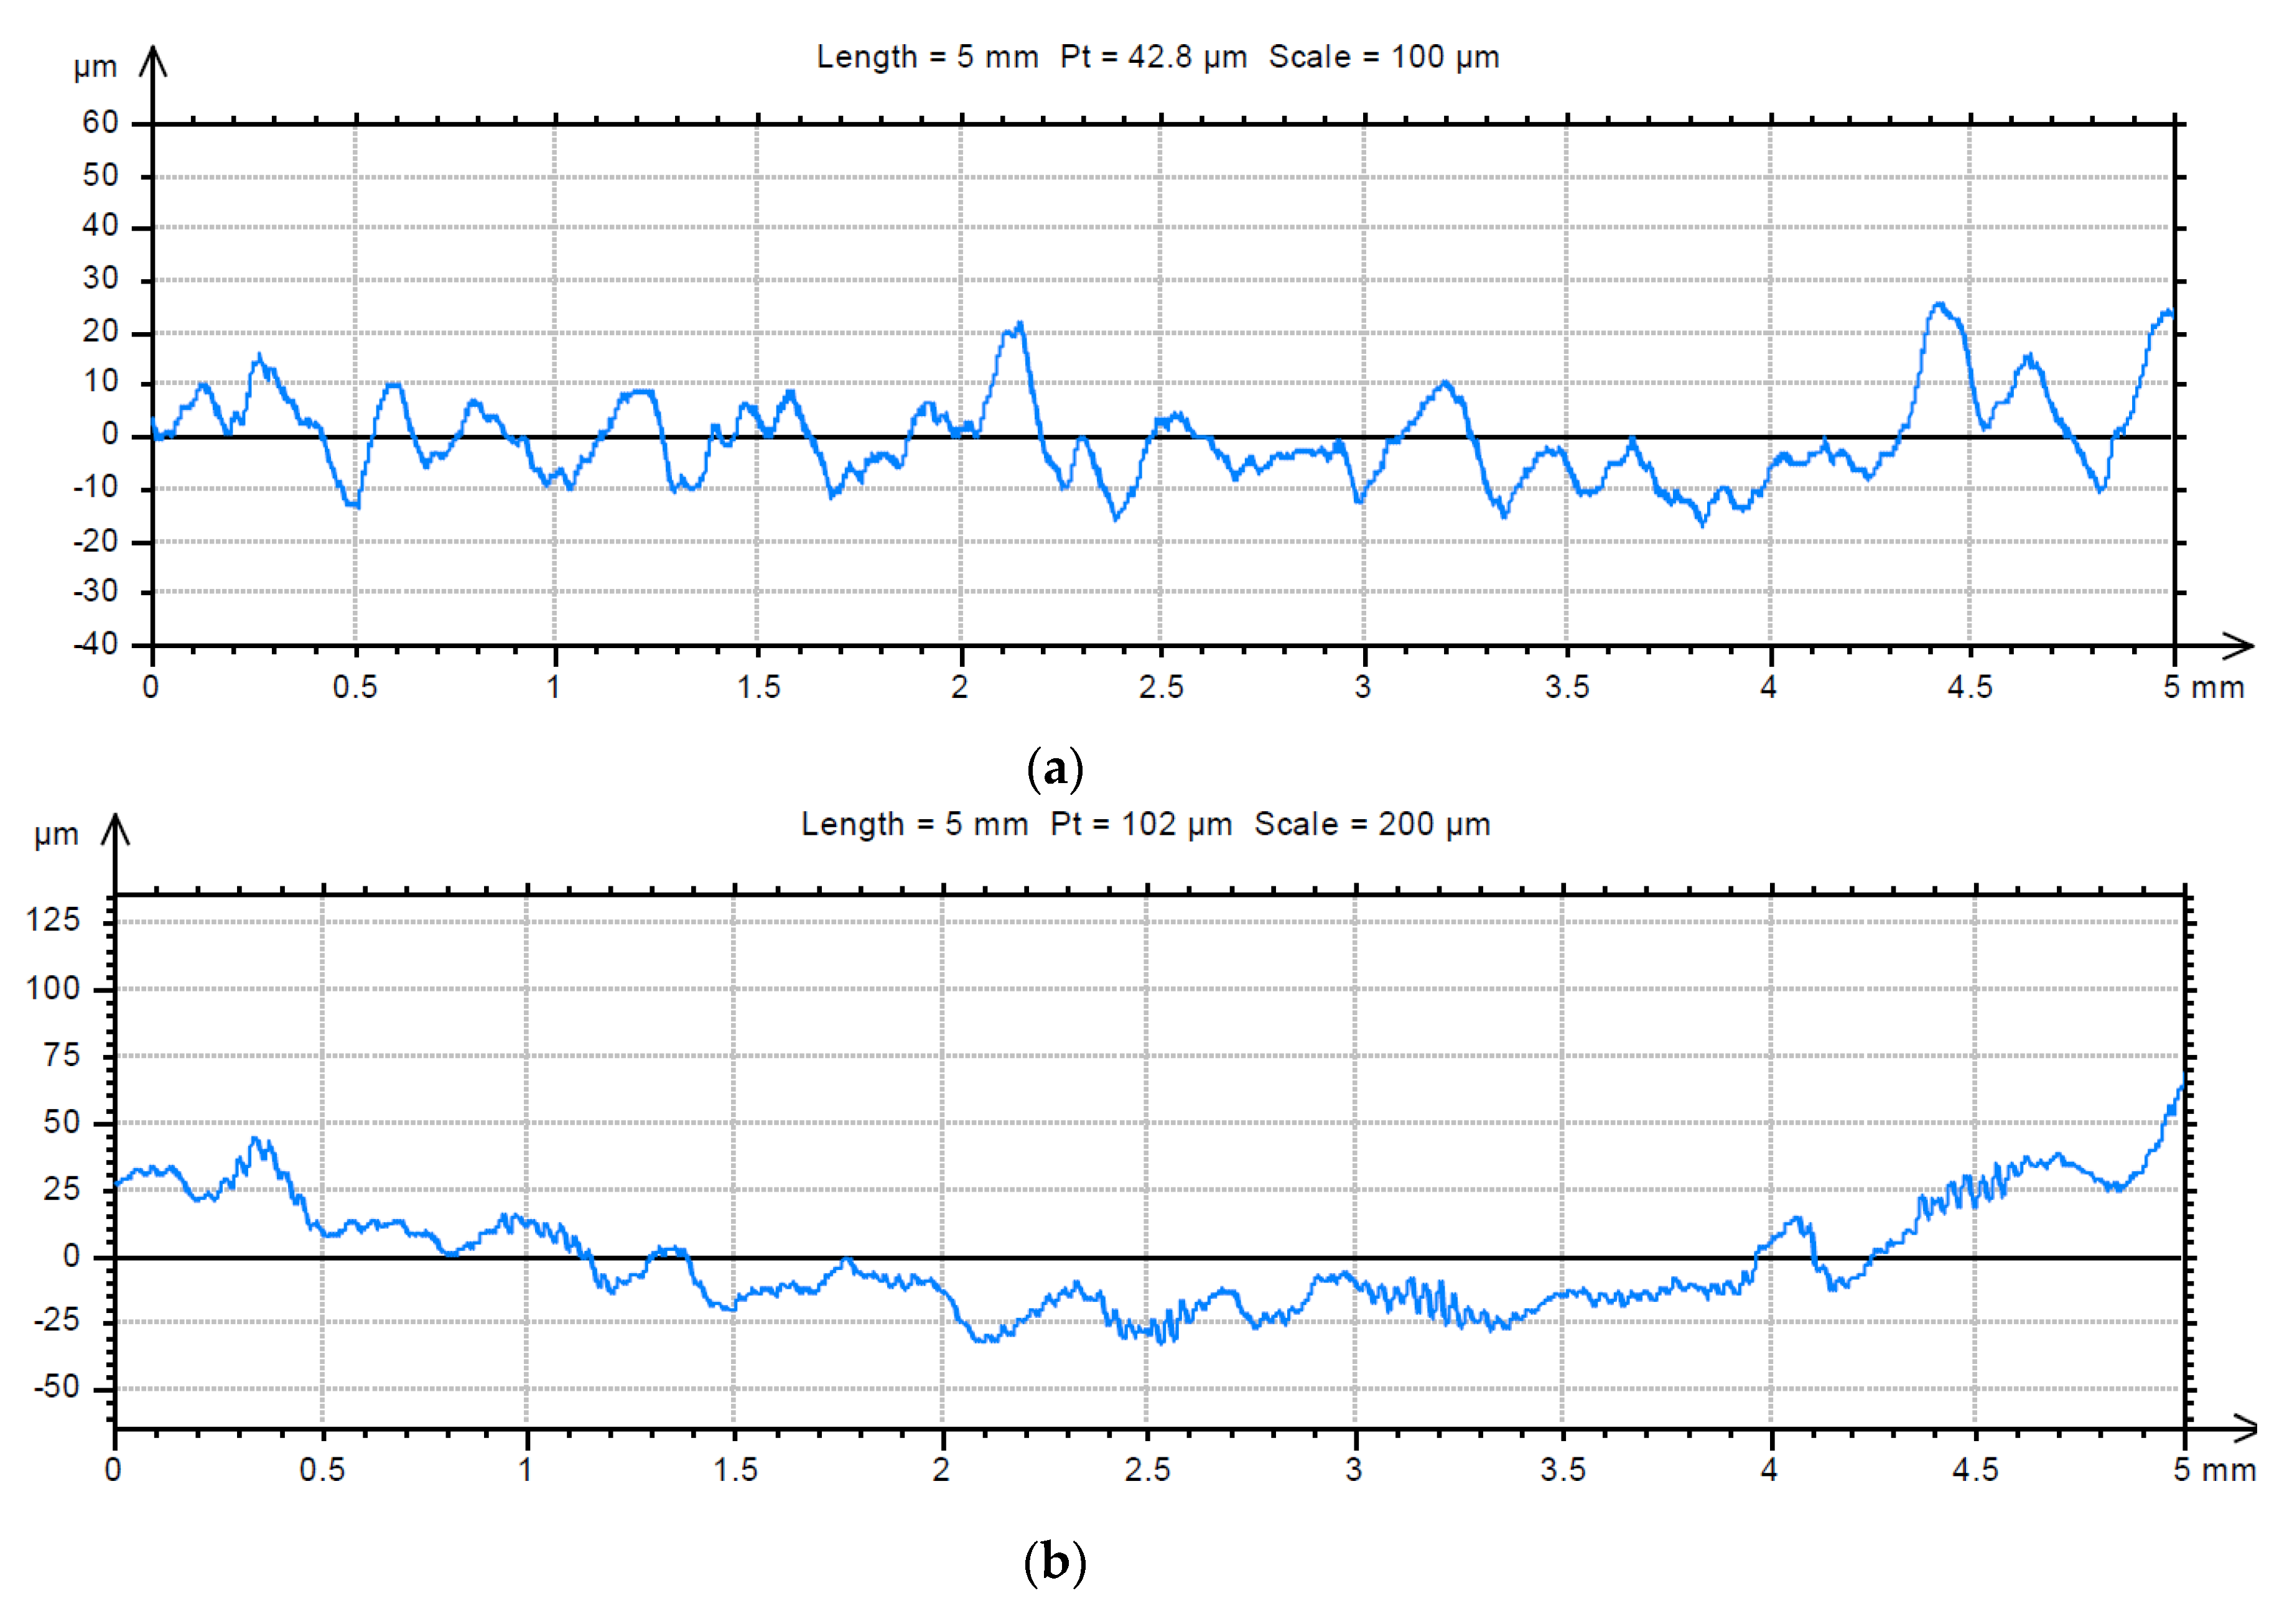
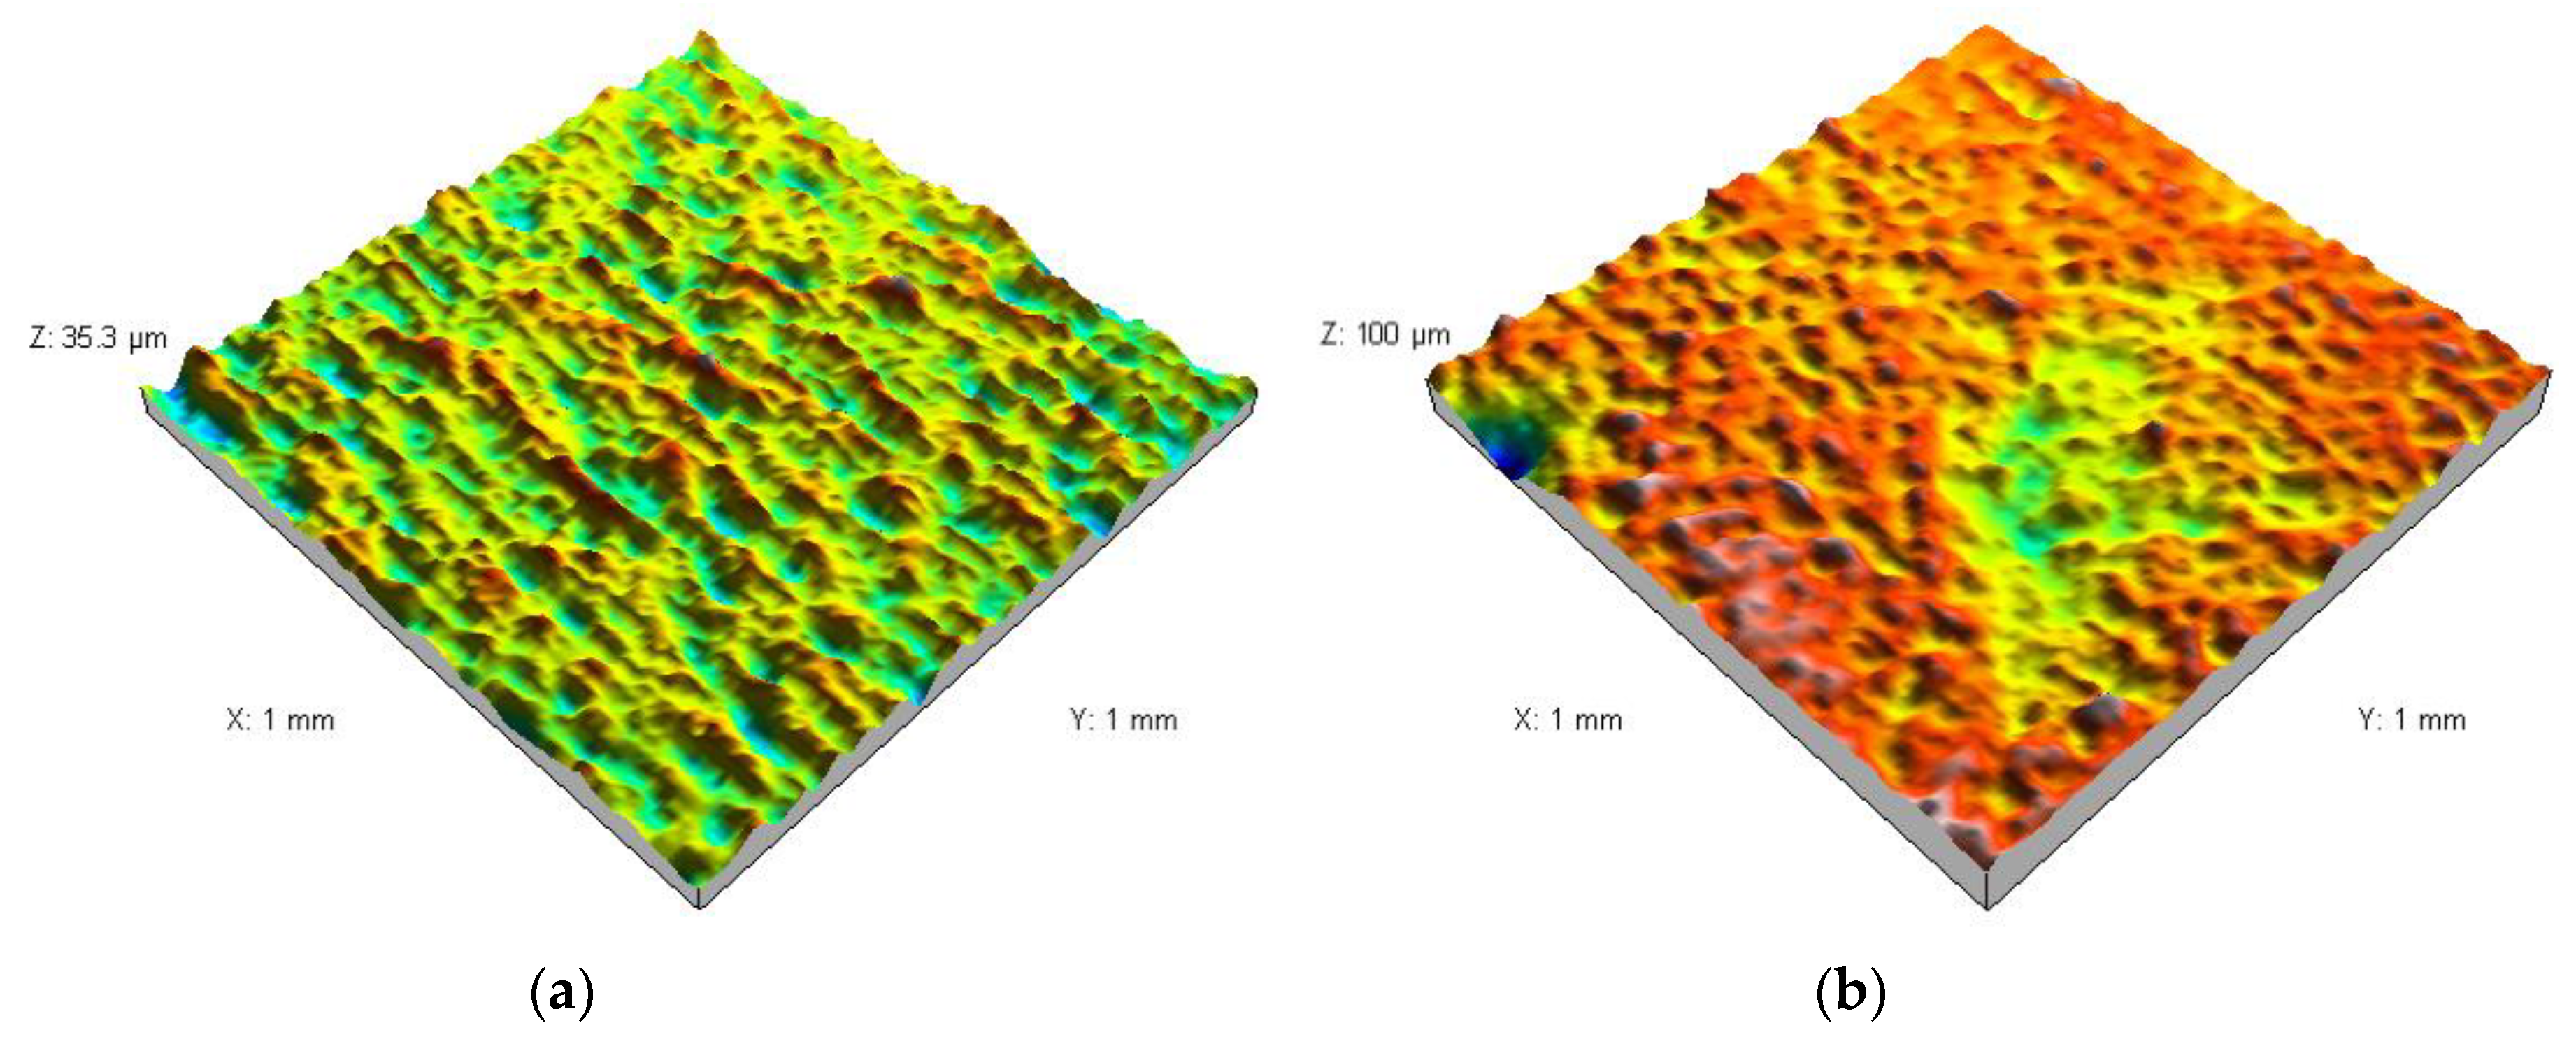
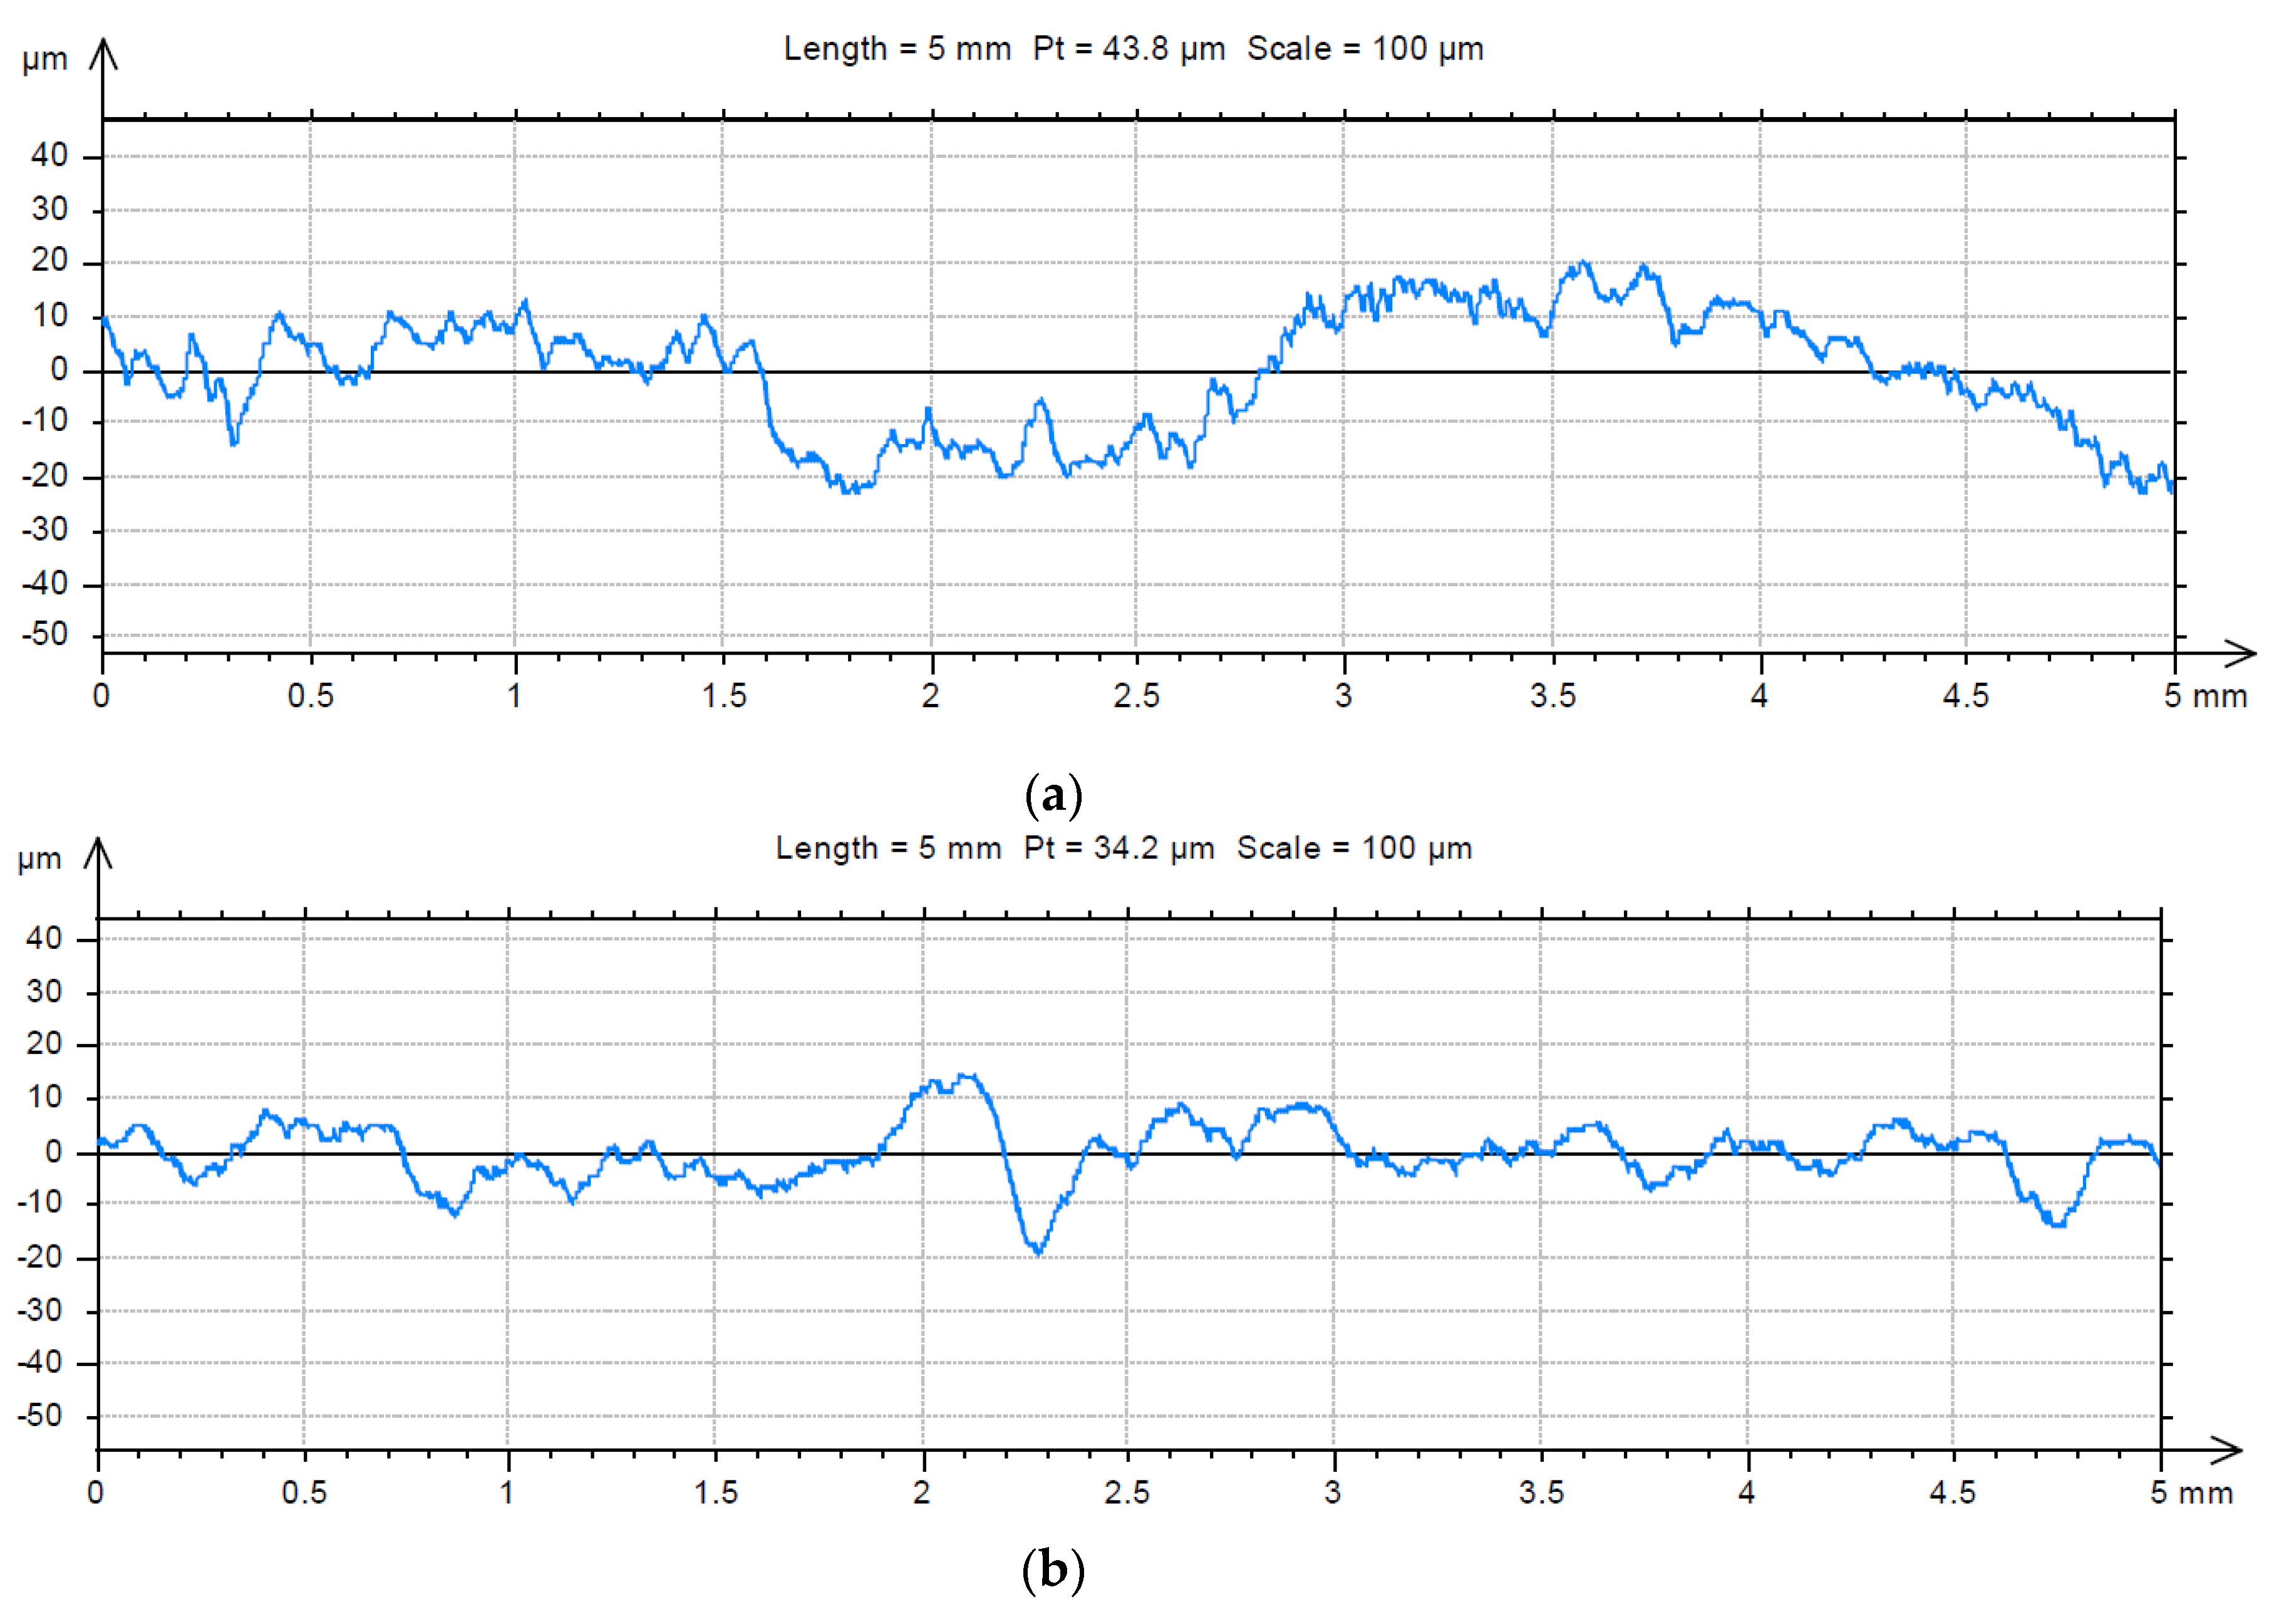
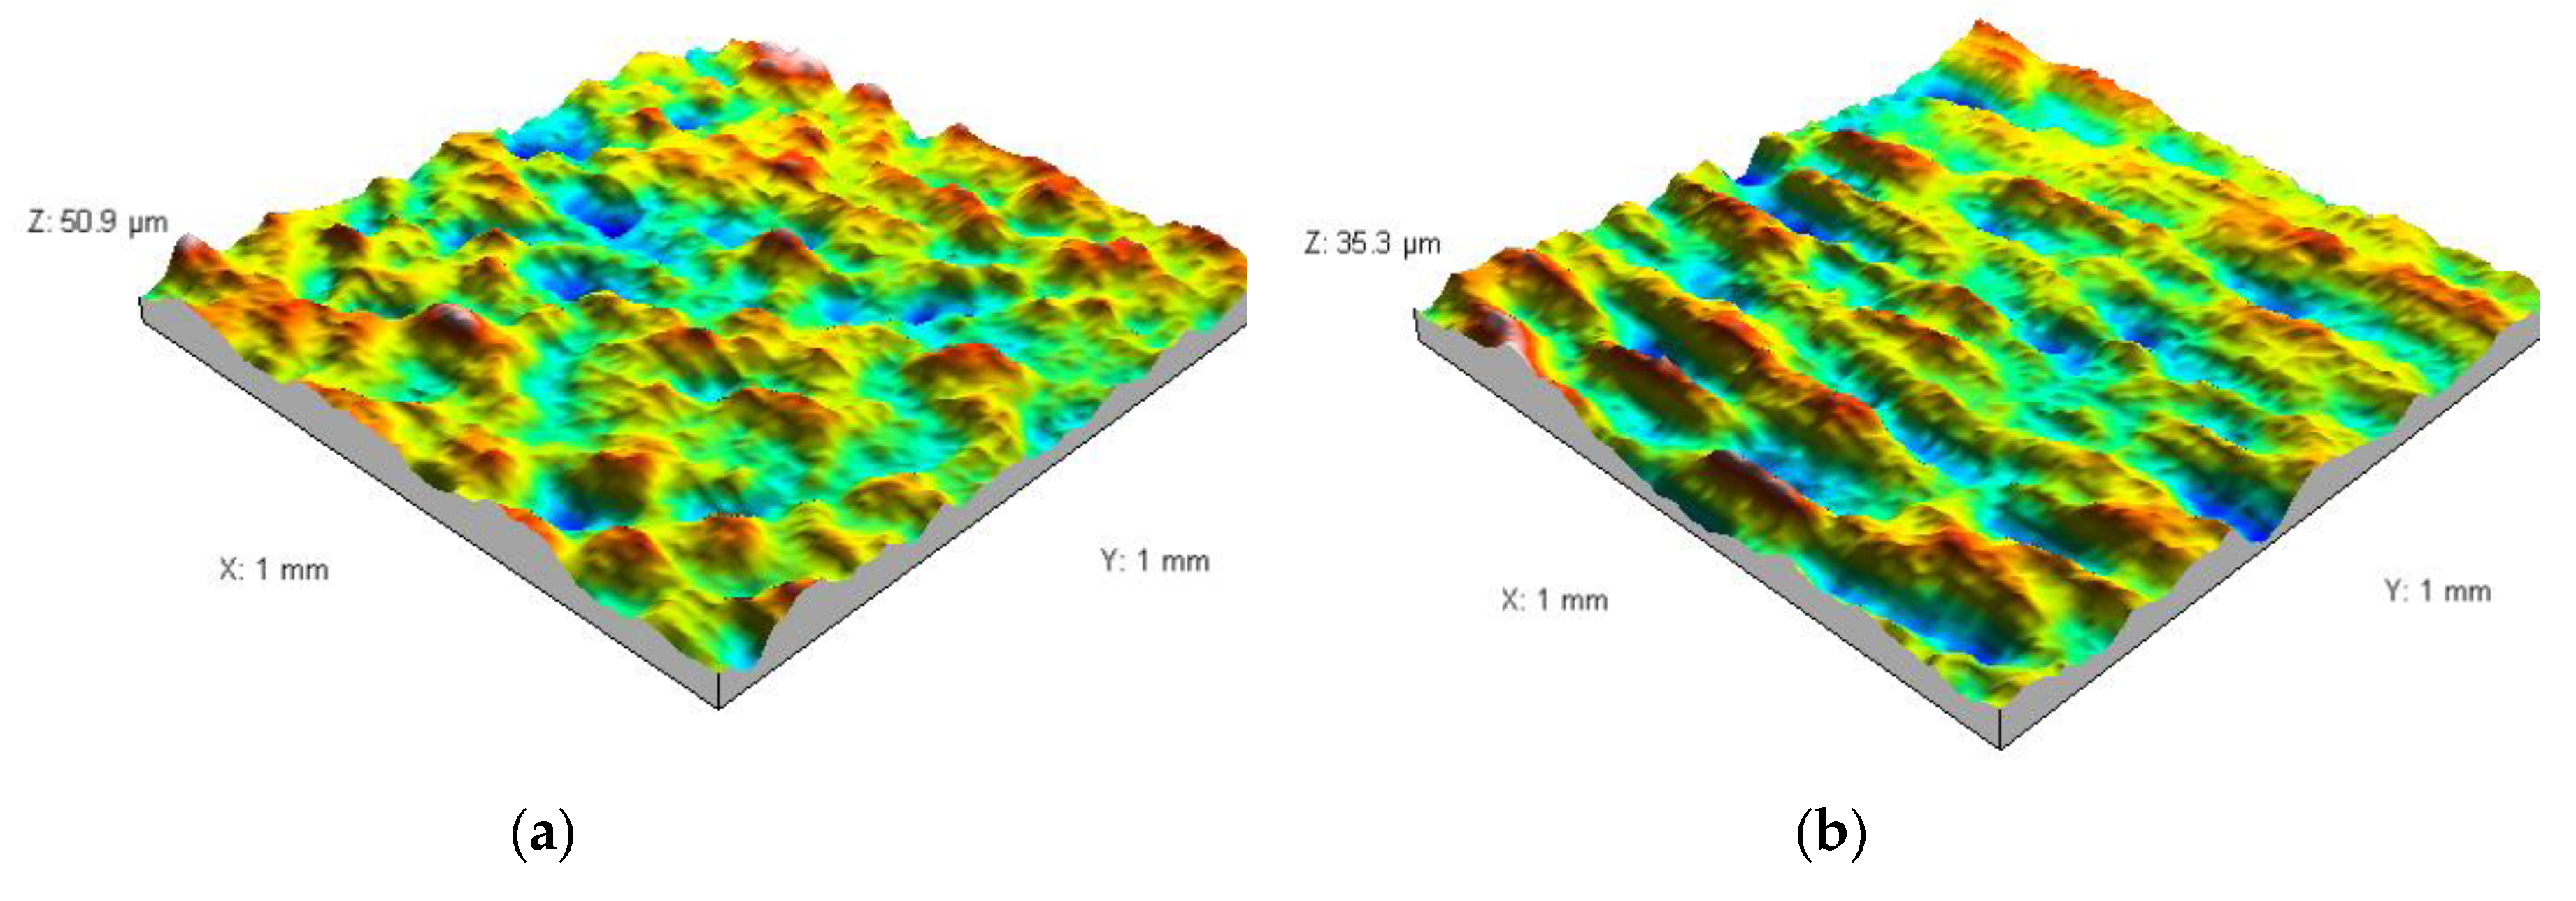
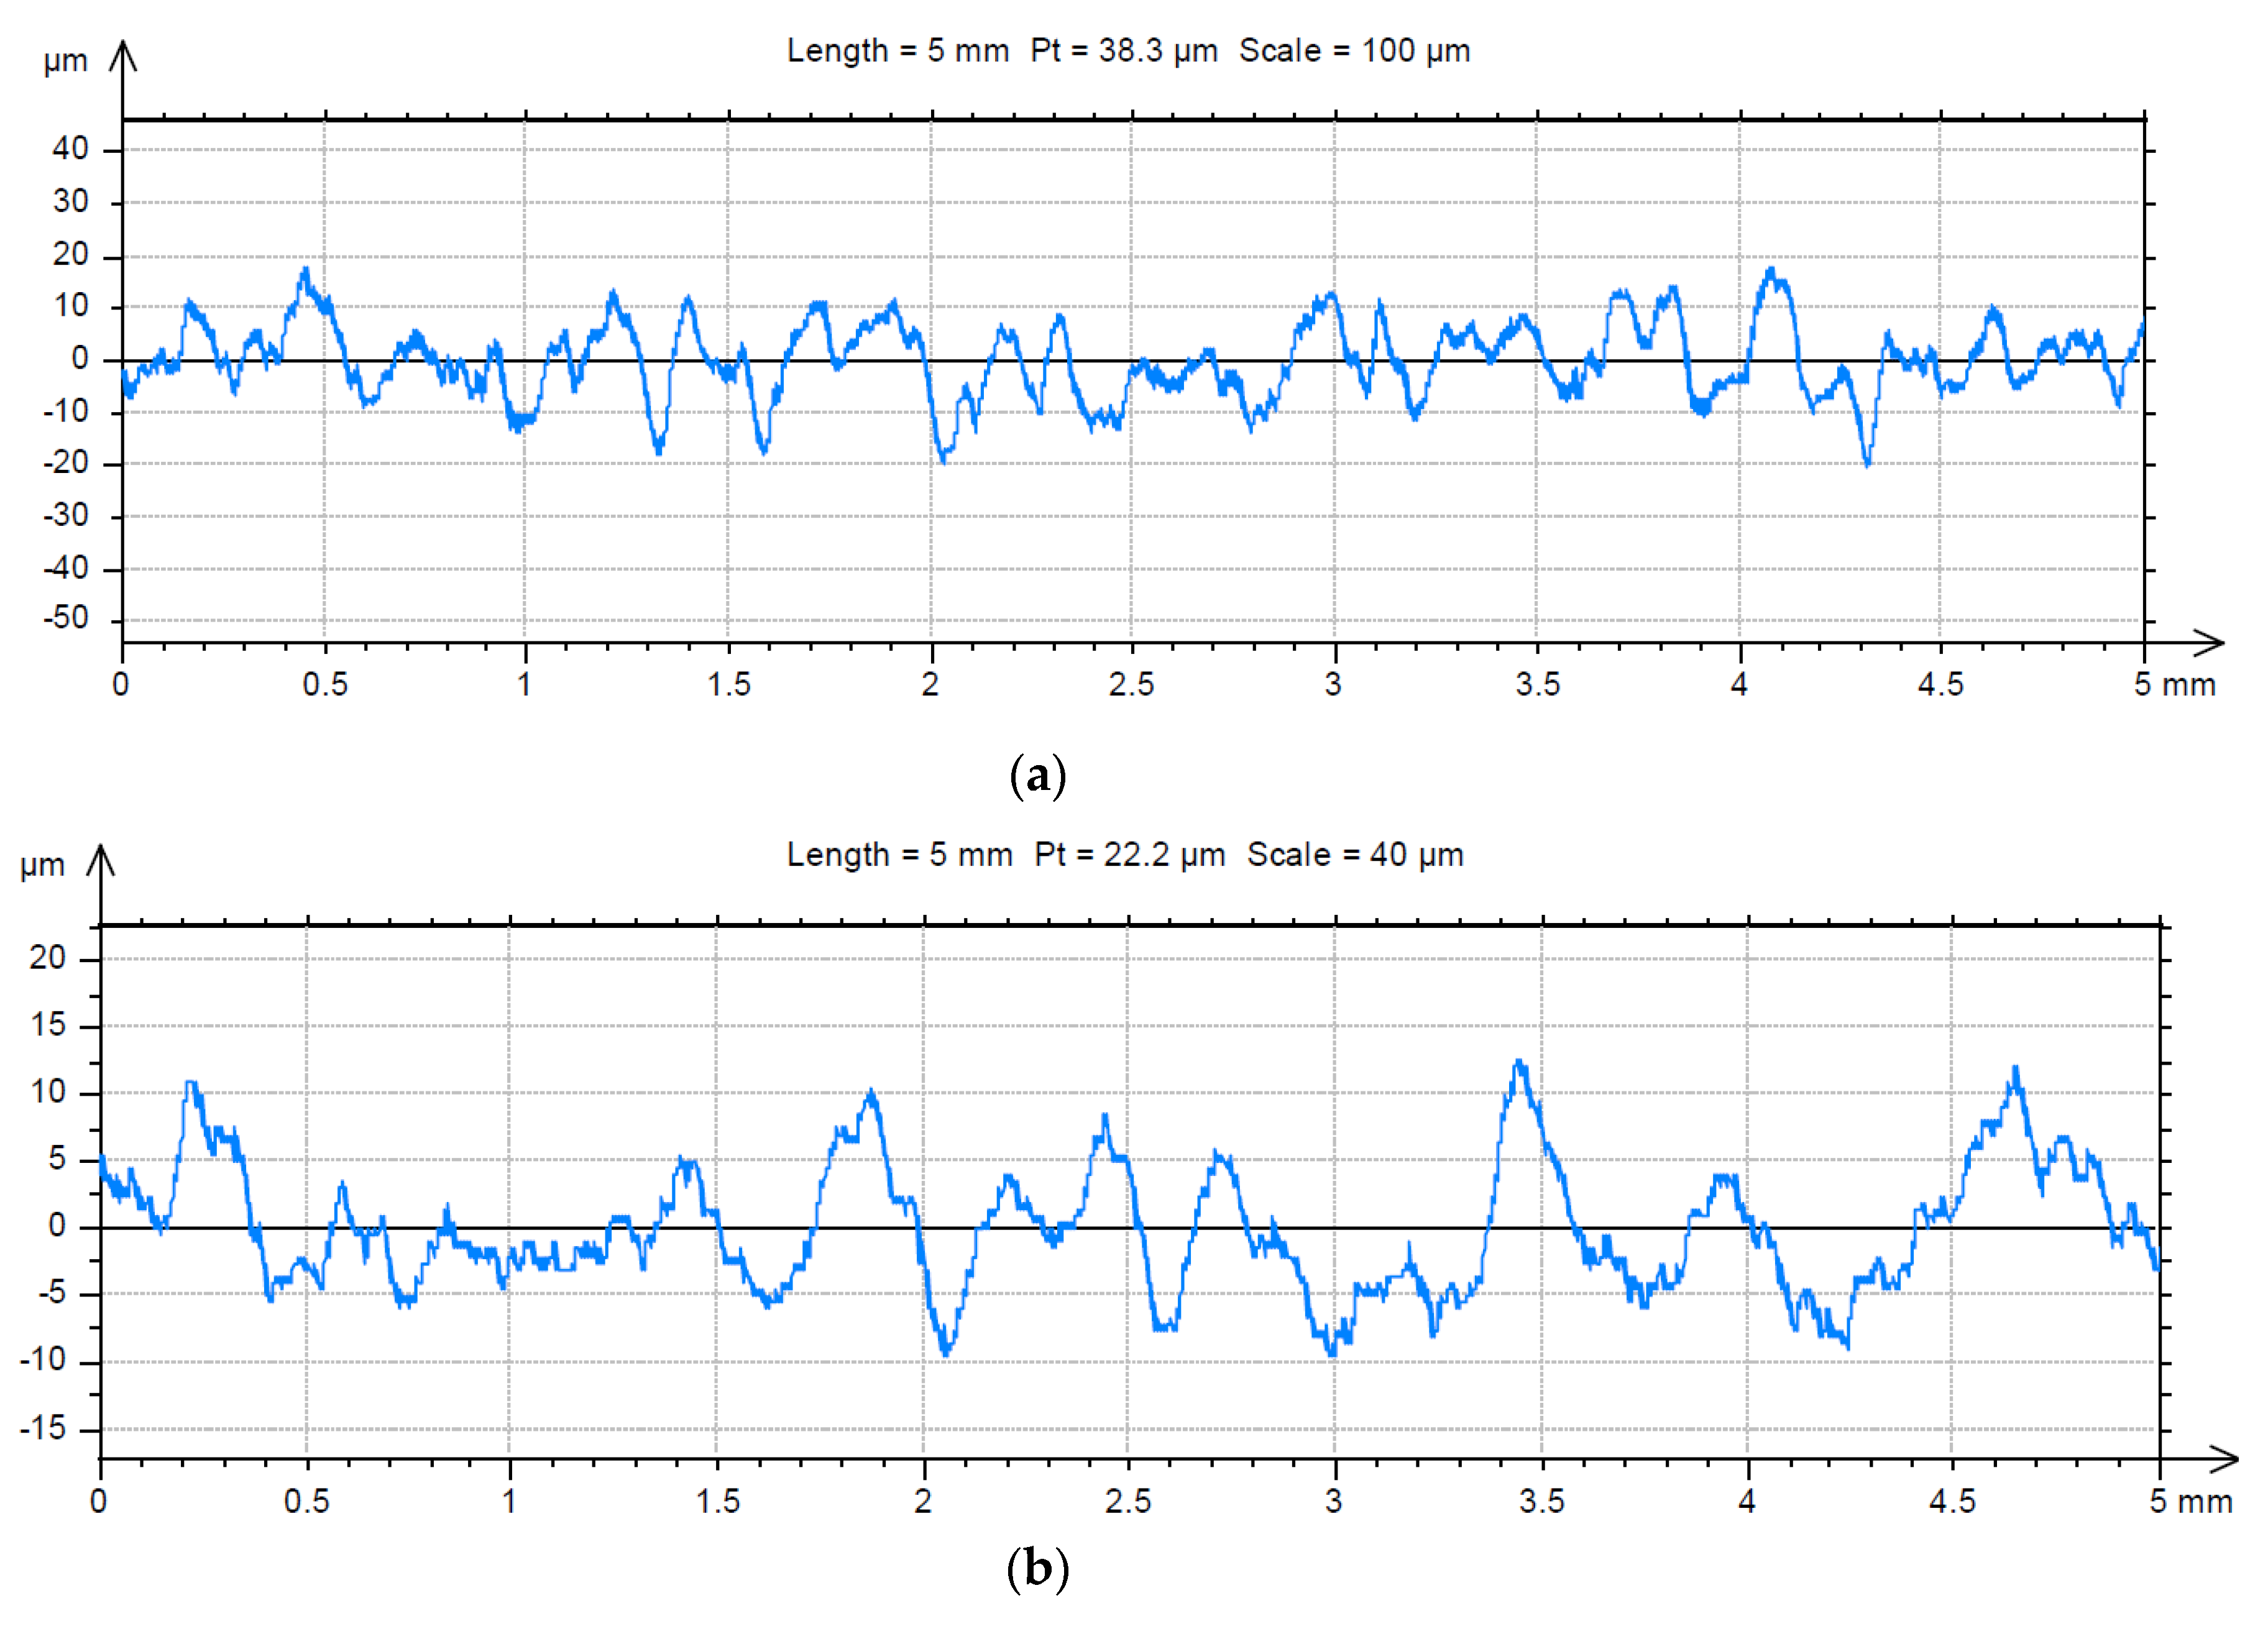
3.2. Analysis of the Surface of Installation Materials
4. Discussion
5. Conclusions
Author Contributions
Funding
Conflicts of Interest
References
- Inkinen, J.; Kaunisto, T.; Pursiainen, A.; Miettinen, I.T.; Kusnetsov, J.; Riihinen, K.; Keinänen-Toivola, M.M. Drinking water quality and formation of biofilms in an office building during its first year of operation, a full scale study. Water Res. 2014, 49, 83–91. [Google Scholar] [CrossRef] [PubMed]
- Azara, A.; Castiglia, P.; Piana, A.; Masia, M.D.; Palmieri, A.; Arru, B.; Maida, G.; Dettori, M. Derogation from drinking water quality standards in Italy according to the European Directive 98/83/EC and the Legislative Decree 31/2001-a look at a recent past. Ann. Ig. 2018, 30, 517–526. [Google Scholar] [PubMed]
- European Commission. Proposal for a DIRECTIVE OF THE EUROPEAN PARLIAMENT AND OF THE COUNCIL on the Quality of Water INTENDED for Human Consumption (Recast); COM/2017/0753 final-2017/0332 (COD); European Commission: Brussels, Belgium, 2017. [Google Scholar]
- Zacheus, O.M.; Iivanainen, E.K.; Nissinen, T.K.; Lehtola, M.J.; Martikainen, P.J. Bacterial biofilm formation on polyvinyl chloride, polyethylene and stainless steel exposed to ozonated water. Water Res. 2000, 34, 63–70. [Google Scholar] [CrossRef]
- Lehtola, M.J.; Miettinen, I.T.; Keinänen, M.M.; Kekki, T.K.; Laine, O.; Hirvonen, A.; Vartiainen, T.; Martikainen, P.J. Microbiology, chemistry and biofilm development in a pilot drinking water distribution system with copper and plastic pipes. Water Res. 2004, 38, 3769–3779. [Google Scholar] [CrossRef] [PubMed]
- Lehtola, M.J.; Laxander, M.; Miettinen, I.T.; Hirvonen, A.; Vartiainen, T.; Martikainen, P.J. The effects of changing water flow velocity on the formation of biofilms and water quality in pilot distribution system consisting of copper or polyethylene pipes. Water Res. 2006, 40, 2151–2160. [Google Scholar] [CrossRef] [PubMed]
- Niquette, P. Impacts of pipe materials on densities of fixed bacterial biomass in a drinking water distribution system. Water Res. 2000, 34, 1952–1956. [Google Scholar] [CrossRef]
- Młyńska, A.; Zielina, M. A comparative study of portland cements CEM I used for water pipe renovation in terms of pollutants leaching from cement coatings and their impact on water quality. J. Water Supply Res. Technol.-Aqua 2018, 67, 685–696. [Google Scholar]
- Manuel, C.M.; Nunes, O.C.; Melo, L.F. Dynamics of drinking water biofilm in flow/non-flow conditions. Water Res. 2007, 41, 551–562. [Google Scholar] [CrossRef] [Green Version]
- Papciak, D.; Tchórzewska-Cieslak, B.; Pietrucha-Urbanik, K.; Pietrzyk, A. Analysis of the biological stability of tap water on the basis of risk analysis and parameters limiting the secondary growth of microorganisms in water distribution systems. Desalin. Water Treat. 2018, 117, 1–8. [Google Scholar] [CrossRef]
- Wolska, M.; Mołczan, M. Assessment of the Stability of Water Entering the Water Supply Network. Environ. Prot. 2015, 37, 51–56. Available online: http://www.os.not.pl/docs/czasopismo/2015/4-2015/Wolska_4-2015.pdf (accessed on 7 May 2019). (in Polish).
- Rabin, R. The Lead Industry and Lead Water Pipes “A MODEST CAMPAIGN.”. Am. J. Public Health 2008, 98, 1584–1592. [Google Scholar] [CrossRef]
- Pietrzyk, A.; Papciak, D. The influence of water treatment technology on the process of biofilm formation on the selected installation materials. J. Civ. Eng. Environ. Archit. 2017, 64, 131–142. [Google Scholar]
- Bucheli-Witschel, M.; Kötzsch, S.; Darr, S.; Widler, R.; Egli, T. A new method to assess the influence of migration from polymeric materials on the biostability of drinking water. Water Res. 2012, 46, 246–260. [Google Scholar] [CrossRef] [PubMed]
- Chowdhury, S. Heterotrophic bacteria in drinking water distribution system: A review. Environ. Monit. Assess. 2012, 184, 6087–6137. [Google Scholar] [CrossRef] [PubMed]
- Schwartz, T.; Hoffmann, S.; Obst, U. Formation and bacterial composition of young, natural biofilms obtained from public bank-filtered drinking water systems. Water Res. 1998, 32, 2787–2797. [Google Scholar] [CrossRef]
- Waines, P.L.; Moate, R.; Moody, A.J.; Allen, M.; Bradley, G. The effect of material choice on biofilm formation in a model warm water distribution system. Biofouling 2011, 27, 1161–1174. [Google Scholar] [CrossRef] [PubMed]
- Yu, J.; Kim, D.; Lee, T. Microbial diversity in biofilms on water distribution pipes of different materials. Water Sci. Technol. 2010, 61, 163–171. [Google Scholar] [CrossRef] [PubMed]
- Waller, S.A.; Packman, A.I.; Hausner, M. Comparison of biofilm cell quantification methods for drinking water distribution systems. J. Microbiol. Methods 2018, 144, 8–21. [Google Scholar] [CrossRef] [PubMed]
- Lehtola, M.J.; Miettinen, I.T.; Lampola, T.; Hirvonen, A.; Vartiainen, T.; Martikainen, P.J. Pipeline materials modify the effectiveness of disinfectants in drinking water distribution systems. Water Res. 2005, 39, 1962–1971. [Google Scholar] [CrossRef] [PubMed]
- Mandelbrot, B.B. Fractals: Form, Chance and Dimension; Freeman: San Francisco, CA, USA, 1977. [Google Scholar]
- Konkol, J.; Prokopski, G. The necessary number of profile lines for the analysis of concrete fracture surfaces. Struct. Eng. Mech. 2007, 25, 565–576. [Google Scholar] [CrossRef]
- Wolska, M. Efficiency of removal of biogenic substances from water in the process of biofiltration. Desalin. Water Treat. 2015, 57, 1354–1360. [Google Scholar] [CrossRef]
- Obiri-Danso, K.; Weobong, C.A.A.; Jones, K. Aspects of health-related microbiology of the Subin, an urban river in Kumasi, Ghana. J. Water Health 2005, 3, 69–76. [Google Scholar] [CrossRef] [PubMed] [Green Version]
- Djuikom, E.; Njine, T.; Nola, M.; Sikati, V.; Jugnia, L.B. Microbiological water quality of the Mfoundi River watershed at Yaoundé, Cameroon, as inferred from indicator bacteria of fecal contamination. Environ. Monit. Assess. 2006, 122, 171–183. [Google Scholar] [CrossRef] [PubMed]
- Donlan, R.M. Biofilms: Microbial Life on Surfaces. Emerg. Infect. Dis. 2002, 8, 881–890. [Google Scholar] [CrossRef] [PubMed]
- Straub, T.M.; Gerba, C.P.; Zhou, X.; Price, R.; Yahya, M.T. Synergistic inactivation of Escherichia coli and MS-2 coliphage by chloramine and cupric chloride. Water Res. 1995, 29, 811–818. [Google Scholar] [CrossRef]
- Thurman, R.B.; Gerba, C.P.; Bitton, G. The molecular mechanisms of copper and silver ion disinfection of bacteria and viruses. Crit. Rev. Environ. Control 1989, 18, 295–315. [Google Scholar] [CrossRef]
- Stainless Steel Pipes. Available online: http://www.instsani.pl/606/rury-stalowe-nierdzewne (accessed on 14 April 2019).
- Pietrucha-Urbanik, K.; Tchórzewska-Cieślak, B.; Papciak, D.; Skrzypczak, I. Analysis of chemical stability of tap water in terms of required level of technological safety. Arch. Environ. Prot. 2017, 43, 3–12. [Google Scholar] [CrossRef] [Green Version]
- Nawrocki, J.; Raczyk-Stanisławiak, U.; Świetlik, J.; Olejnik, A.; Sroka, M.J. Corrosion in a distribution system: Steady water and its composition. Water Res. 2010, 44, 1863–1872. [Google Scholar] [CrossRef]
- Zamorska, J. Biological Stability of Water after the Biofiltration Process. J. Ecol. Eng. 2018, 19, 234–239. [Google Scholar] [CrossRef]
- Lu, C.; Chu, C. Effects of Acetic Acid on the Regrowth of Heterotrophic Bacteria in the Drinking Water Distribution System. World J. Microbiol. Biotechnol. 2005, 21, 989–998. [Google Scholar] [CrossRef]
- Lehtola, M. Microbially available organic carbon, phosphorus, and microbial growth in ozonated drinking water. Water Res. 2001, 35, 1635–1640. [Google Scholar] [CrossRef]
- Lautenschlager, K.; Boon, N.; Wang, Y.; Egli, T.; Hammes, F. Overnight stagnation of drinking water in household taps induces microbial growth and changes in community composition. Water Res. 2010, 44, 4868–4877. [Google Scholar] [CrossRef] [PubMed]
- Kooij, D. Potential for biofilm development in drinking water distribution systems. J. Appl. Microbiol. 1998, 85, 39S–44S. [Google Scholar] [CrossRef] [PubMed]
- Augustynowicz, J.; Niereniński, M.; Jóżwiak, A.; Prędecka, A.; Russel, S. The influence of basic physicochemical parameters on the number of psychrophilic and mesophilic bacteria in the Vistula River waters. Water-Environ.-Rural Areas 2017, 17, 5–13. Available online: file:///C:/Users/HP/Downloads/Augustynowicz%20i%20in%20(1).pdf (accessed on 7 May 2019). (in Polish).
- Hallam, N.; West, J.; Forster, C.; Simms, J. The potential for biofilm growth in water distribution systems. Water Res. 2001, 35, 4063–4071. [Google Scholar] [CrossRef]
- Gillespie, S.; Lipphaus, P.; Green, J.; Parsons, S.; Weir, P.; Juskowiak, K.; Jefferson, B.; Jarvis, P.; Nocker, A. Assessing microbiological water quality in drinking water distribution systems with disinfectant residual using flow cytometry. Water Res. 2014, 65, 224–234. [Google Scholar] [CrossRef] [PubMed]
- Francisque, A.; Rodriguez, M.J.; Miranda-Moreno, L.F.; Sadiq, R.; Proulx, F. Modeling of heterotrophic bacteria counts in a water distribution system. Water Res. 2009, 43, 1075–1087. [Google Scholar] [CrossRef] [PubMed]


| Parameter | Analytical Method/Standard |
|---|---|
| pH | Multifunction meter CX-505 (Elmetron, Poland) |
| Temperature | Multifunction meter CX-505 (Elmetron, Poland) |
| Conductivity | Multifunction meter CX-505 (Elmetron, Poland) |
| Turbidity | 2100P ISO turbidimeter (Hach, Germany) |
| Oxidizability | The permanganate method with KMnO4 (according PN EN ISO 8467:2001) |
| Total organic carbon (TOC) | TOC analyzer Sievers 5310 C (SUEZ, Boulder, CO, USA) |
| UV absorbance | Spectrophotometric method using Hach–Lange DR 500 spectrophotometer (Germany) |
| Dissolved oxygen | Electrochemical method using a Hach–Lange oxygen probe (Germany) |
| Ammonium nitrogen | Spectrophotometric method 8155 (sachet tests—amonia salicylate (1) and cyanurate (2)) using Hach-Lange DR 500 spectrophotometer (Germany) |
| Nitrite nitrogen | Colorimetric method by Nitrite Test Merck 1.14408 (Germany) |
| Nitrate nitrogen | Spectrophotometric method 8039 (sachet tests—NitraVer5) using Hach–Lange DR 500 spectrophotometer (Germany) |
| Phosphates | Spectrophotometric method 8048 (sachet tests—PhosVer3) using Hach–Lange DR 500 spectrophotometer (Germany) |
| Total and free chlorine | Spectrophotometric method 8167 and 8021 (sachet tests—DPD reagent) using Hach-Lange DR 500 spectrophotometer (Germany) |
| The total number of psychrophilic bacteria (at 22 °C) and mesophilic bacteria (at 37 °C) | Heterotrophic plate count (HPC) method using R2A Agar (CM0906) manufactured by Oxoid Thermo Scientific (UK) (incubation 7 days) and an A Agar (P-0231) manufactured by BTL Sp. z o.o. Department of Enzymes and Peptones (Poland) (incubation 2 day-mesophilic bacteria and 3 day psychrophilic bacteria) |
| Escherichiacoli | Membrane filtration procedure using Endo agar WG ISO 9308-1 (BTL, Poland) |
| Parameter | Unit | Inlet | Outlet | ||||||
|---|---|---|---|---|---|---|---|---|---|
| Min | Max | Mean | σ | Min | Max | Mean | σ | ||
| pH | - | 7.01 | 7.69 | 7.54 | 0.17 | 7.17 | 7.74 | 7.60 | 0.14 |
| Temperature | °C | 14.47 | 20.3 | 17.75 | 1.99 | 10.09 | 23.9 | 21.53 | 3.54 |
| Conductivity | µs/cm | 383 | 506 | 430 | 35.31 | 475 | 662 | 543 | 53.07 |
| Turbidity | NTU | 0.16 | 1.33 | 0.40 | 0.35 | 0.58 | 4.5 | 1.41 | 1.08 |
| Oxidizability | mg O2/L | 0.50 | 2.10 | 1.41 | 0.47 | 0.80 | 2.60 | 1.73 | 0.56 |
| TOC | mg C/L | 0.98 | 2.05 | 1.52 | 0.26 | 1.99 | 5.00 | 2.44 | 0.86 |
| UV absorbance | UV254 nm | 1.48 | 2.76 | 2.15 | 0.35 | 2.42 | 3.70 | 2.89 | 0.60 |
| Dissolved oxygen | mg O2/L | 12.56 | 16.30 | 14.32 | 1.13 | 5.83 | 10.25 | 9.25 | 1.23 |
| Ammonium nitrogen | mg N-NH4+/L | 0.00 | 0.070 | 0.018 | 0.028 | 0.00 | 0.11 | 0.018 | 0.031 |
| Nitrite nitrogen | mg N-NO2−/L | 0.00 | 0.037 | 0.003 | 0.010 | 0.001 | 0.037 | 0.0071 | 0.04 |
| Nitrate nitrogen | mg N-NO3−/L | 0.09 | 0.90 | 0.49 | 0.29 | 0.20 | 1.50 | 0.52 | 0.376 |
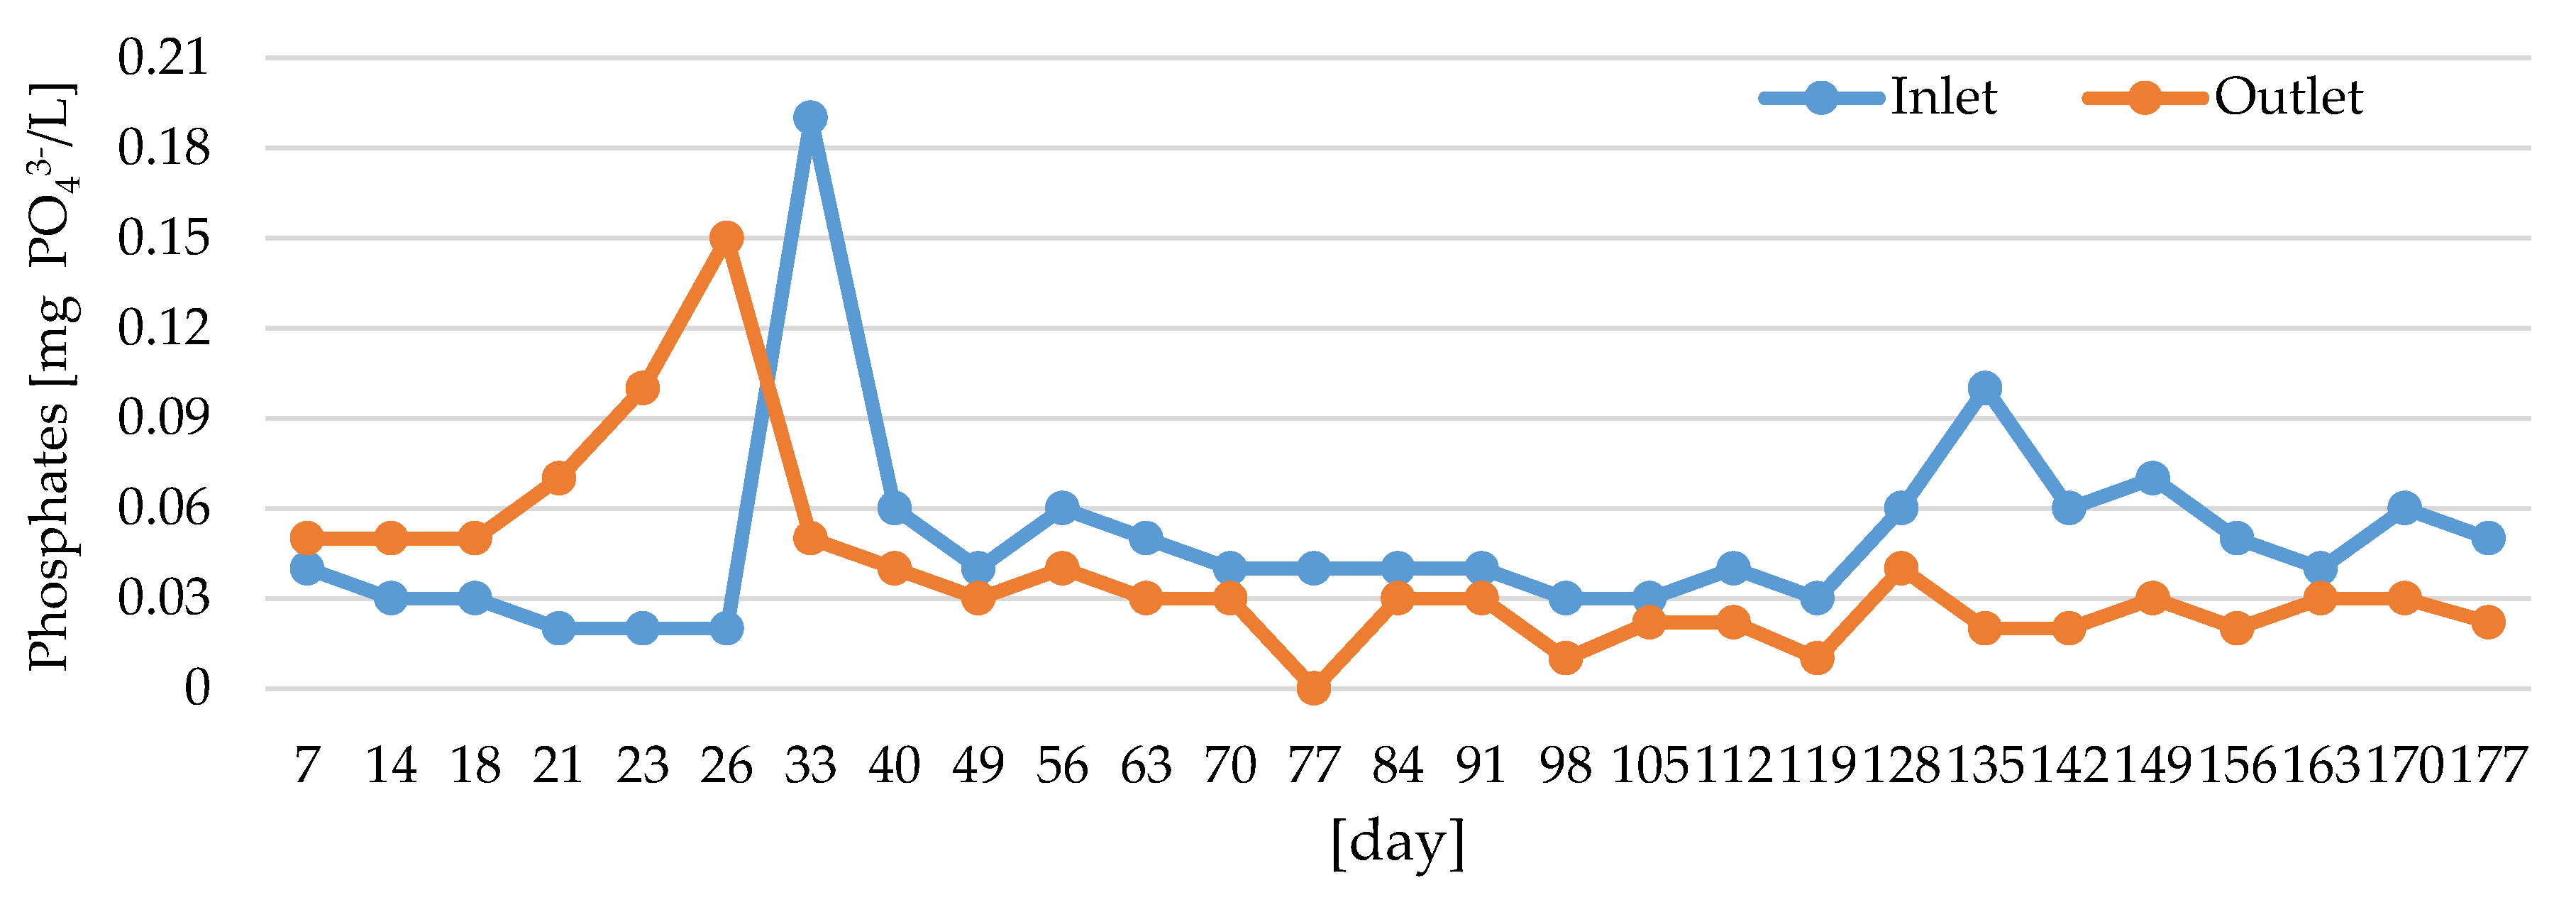
| Phosphates | mg PO43-/L | 0.02 | 0.19 | 0.053 | 0.047 | 0.00 | 0.15 | 0.038 | 0.037 |
| Total chlorine | mg Cl2/L | 0.01 | 0.21 | 0.102 | 0.07 | 0.01 | 0.07 | 0.027 | 0.017 |
| Free chlorine | mg Cl2/L | 0.01 | 0.08 | 0.033 | 0.02 | 0.00 | 0.04 | 0.012 | 0.011 |
| Mesophilic bacteria (R2A) | CFU/mL | 1 | 100 | 30 | 34 | 300 | 5200 | 2393 | 1561 |
| Psychrophilic bacteria (R2A) | CFU/mL | 5 | 90 | 49 | 32 | 450 | 10600 | 4401 | 3721 |
| Escherichiacoli | CFU/100mL | 0.00 | 0.00 | 0.00 | 0.00 | 3.00 | 200.00 | 48 | 57.70 |
| Stability Criterion | Water Treatment Plant | Inlet (24 h) | Outlet (24 h) |
|---|---|---|---|
| Mean | |||
| ΣNinorg ≤ 0.2 mg N/L | 0.930 | 0.510 | 0.540 |
| PO43− ≤ 0.03 mg PO43−/L | 0.027 | 0.053 | 0.038 |
| Dissolved organic carbon (DOC) mg C/L | 2.160 | 1.520 | 2.440 |
| Biodegradable dissolved organic carbon (BDOC) ≤ 0.25 mg C/L | 0.140 | 0.220 | 0.300 |
| Material | The Number of Microorganisms | |||
|---|---|---|---|---|
| Agar A (CFU/cm2) | Agar R2A (CFU/cm2) | ATP (RLU/cm2) | Flow Cytometry (Number of Particles/cm2) | |
| Galvanised steel | M 35, P 170 | M 9900, P 18,950, | 17,390 | 7,951,795 |
| PE | M 60, P 75 | M 9750, P 18,400 | 8507 | 7,992,750 |
| Chromium-nickel steel | M 53, P 45 | M 5200, P 5800 | 5650 | 7,341,230 |
| PVC | M 80, P 75 | M 3300, P 3200 | 4523 | 7,019,205 |
| Material | Fractographical Parameters | |||
|---|---|---|---|---|
| Fractal Dimension D ± Standard Error (-) | Total Height of the Roughness Profile Pt ± Standard Error (µm) | |||
| For Material | For Material with Biofilm | For Material | For Material with Biofilm | |
| Galvanised steel | 1.23 ± 0.016 | 1.18 ± 0.015 | 83.6 ± 6.2 | 393.9 ± 23.4 |
| PE | 1.40 ± 0.015 | 1.41 ± 0.011 | 39.4 ± 2.7 | 93.4 ± 2.9 |
| Chromium-nickel steel | 1.43 ± 0.006 | 1.35 ± 0.006 | 53.6 ± 3.0 | 114.7 ± 4.3 |
| PVC | 1.40 ± 0.029 | 1.39 ± 0.004 | 42.0 ± 1.4 | 30.0 ± 1.3 |
© 2019 by the authors. Licensee MDPI, Basel, Switzerland. This article is an open access article distributed under the terms and conditions of the Creative Commons Attribution (CC BY) license (http://creativecommons.org/licenses/by/4.0/).
Share and Cite
Papciak, D.; Tchórzewska-Cieślak, B.; Domoń, A.; Wojtuś, A.; Żywiec, J.; Konkol, J. The Impact of the Quality of Tap Water and the Properties of Installation Materials on the Formation of Biofilms. Water 2019, 11, 1903. https://doi.org/10.3390/w11091903
Papciak D, Tchórzewska-Cieślak B, Domoń A, Wojtuś A, Żywiec J, Konkol J. The Impact of the Quality of Tap Water and the Properties of Installation Materials on the Formation of Biofilms. Water. 2019; 11(9):1903. https://doi.org/10.3390/w11091903
Chicago/Turabian StylePapciak, Dorota, Barbara Tchórzewska-Cieślak, Andżelika Domoń, Anna Wojtuś, Jakub Żywiec, and Janusz Konkol. 2019. "The Impact of the Quality of Tap Water and the Properties of Installation Materials on the Formation of Biofilms" Water 11, no. 9: 1903. https://doi.org/10.3390/w11091903