Article

Sensitivity of Agricultural Development to Water-Related Drivers: The Case of Andalusia (Spain) †

Department of Agricultural Economics and CEIGRAM, Universidad Politécnica de Madrid, ETSIAAB, Avda. Puerta Hierro 2, 28040 Madrid, Spain
*
Author to whom correspondence should be addressed.
Water 2019, 11(9), 1854; https://doi.org/10.3390/w11091854
Submission received: 11 July 2019 / Revised: 31 August 2019 / Accepted: 2 September 2019 / Published: 5 September 2019
(This article belongs to the Special Issue Sustainable Water Management in Agriculture under Global Change)

Abstract

:
Future agricultural development will be challenged by the impacts of climate change on water, which are expected to be particularly strong in southern European regions. Thus, exploring interrelations between agriculture and water under climate change is essential to frame informed policies that ensure sustainable water management while enhancing food production. Nevertheless, studies that address future agriculture development focus on climate-induced changes in crop productivity and often disregard the water dimension. In this research, we have conducted a sensitivity analysis of agricultural development to drivers of water use in Andalusia in 2050 based on outcomes from the CAPRI-Water model. The results from the analysis show that water cost is the most determinant factor in shaping agricultural land, offsetting the impact of the driver of water availability. In contrast, irrigation water use is driven not only by water cost but also by irrigation efficiency. The magnitude of the sensitivity to these drivers differs significantly across crops. Policies aimed at improving resource use efficiency can contribute to strengthening the resilience and adaptation capacity of future agricultural systems to climate change. To achieve this goal, the policies must consider crop sensitivity to irrigation costs and the potential rebound effect.

1. Introduction

Agricultural development is strongly influenced by environmental and socioeconomic drivers [1,2]. Crop production is very sensitive to climatic conditions and therefore is extremely exposed to climate change that impacts both crop productivity and water availability [3,4]. As the largest water user, agriculture accounts for around 40% of the total water withdrawal in Europe, amounting to more than 80% in southern regions [5]. Hence, understanding how these drivers will influence agriculture over the coming years is essential to frame informed policies that ensure sustainable water management while enhancing food production.
Agricultural policy impact assessments are often supported by agroeconomic models that attempt to represent the sector performance in a simplified manner. This implies including a number of assumptions that lead to uncertainties in model results in addition to the inherent uncertainties linked to an unknown future [6]. This is particularly significant when modelling water use in agriculture because projections for water parameters are highly uncertain, difficult to access, or scarce. That is why there are limited assessments that have analysed the impacts of climate change on agricultural and food markets considering the water dimension, despite the broadly acknowledged need to incorporate the water dimension in climate change research [7,8,9]. Studies that explored economic impacts of water use in agriculture were primarily conducted at the basin, farm, and plot levels, providing relevant insights into agriculture and water interrelations [10,11]. However, these studies generally neglected market feedback, which is an important driver in agricultural production [12].
This challenge has been addressed in the recent upgraded water module within the agroeconomic model, CAPRI (Common Agricultural Policy Regional Impact Analysis) (Blanco et al. [13]). CAPRI-Water has been applied to explore the potential effects of climate change and water availability on agriculture as well as policy instruments, such as water pricing or irrigation efficiency improvement, providing differentiated results at the subnational level, in accordance with the Nomenclature of Territorial Units for Statistics (NUTS) 2 level within the European Union (EU) [13,14]. Although these studies offer valuable insights into uncertainties through scenario analysis, none of these assessments quantify the sensitivity of the results to different drivers.
Sensitivity analysis techniques allocate uncertainty in model results to model inputs, enabling the identification of key drivers of model outcomes (Saltelli [15]). A comprehensive review of the available methods is offered in Borgonovo and Plischke [16] and Pianosi et al. [17]. These tools contribute to strengthening the reliability of model outcomes and are recommended for impact assessment guidelines (e.g., European Commission [18]). In this approach, it is crucial to consider uncertainty-related interests from stakeholders that provide information relevant for decision-making [19,20].
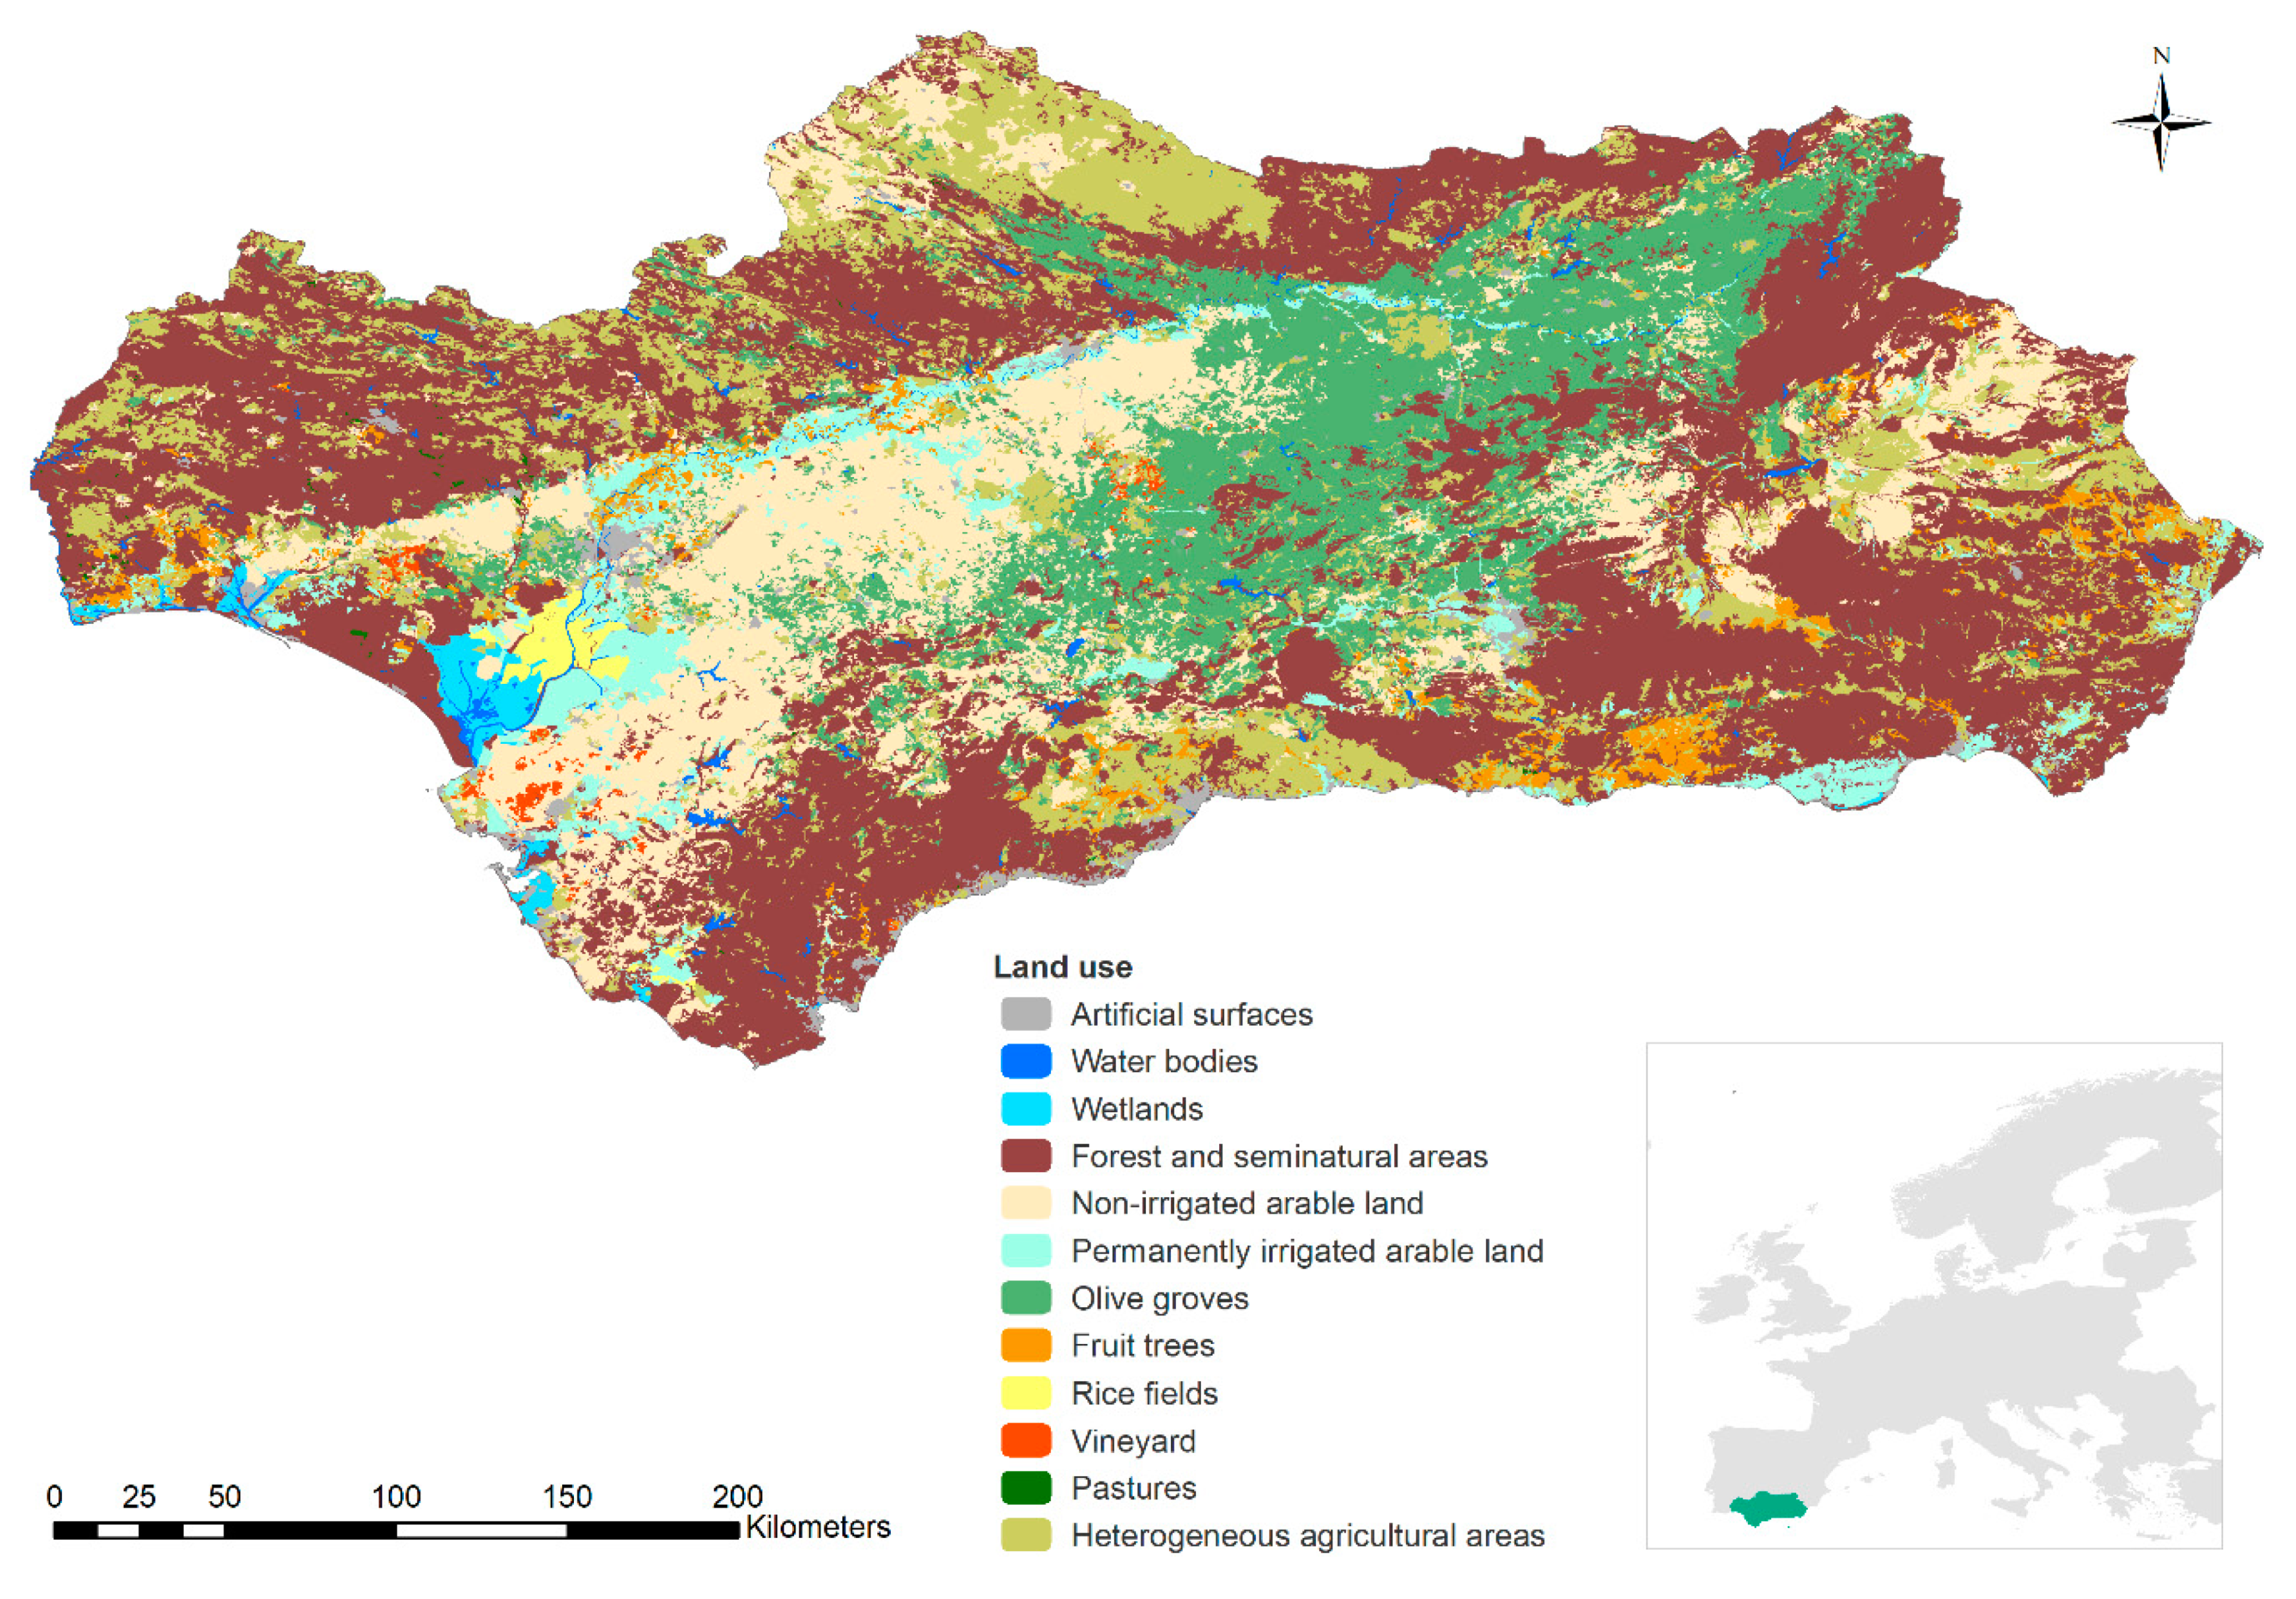
The objective of this research is to perform a sensitivity analysis of the CAPRI-Water results to disentangle the key driving forces of agriculture over the 2050 time-horizon in Andalusia, a southern Spanish region with a strong agricultural sector that largely relies on irrigation. The analysis builds on a sensitivity analysis with finite change decomposition methodology and explores the sensitivity of irrigated land, irrigation water use, and agricultural income to drivers selected in collaboration with stakeholders.
Interactions with decision-makers through two workshops with relevant stakeholders enabled the identification of the main challenges in the water–energy–food (WEF) nexus in Andalusia [21], as well as the key drivers of uncertainty for scenario analysis. Climate change and water availability emerged as the major concerns for the future agricultural development in the region. Additionally, stakeholders’ perceptions were supported by studies that anticipated climate-induced changes in crop productivity in the region [22,23,24], as well as reductions in runoff that might constrain water availability [25,26,27,28] and water withdrawal for irrigation [29]. In a context defined by eventual declines in water availability for agriculture, irrigation efficiency gains emerged as an important factor to sustain irrigated agricultural development. Another important factor that was highlighted by stakeholders was water cost, which was recognised as a strong limiting factor in irrigation due to increased energy cost in the sector [30].
The analysis of these drivers contributes to improving the understanding of the interrelations between agriculture and water under climate change. In addition to investigating uncertainties related to the future development of these drivers, this research explores the interactions between them, which provides significant guidance to inform decision-making for sustainable agriculture and resource use. Another important contribution of this exploratory exercise lies in improving the model parametrisation to better capture water–food interrelations, which will benefit future impact assessments conducted with the model at the EU-wide level. Notwithstanding this, the work is subject to a number of limitations from the hydrological perspective that arise from the technical-economic approach applied and the global economic nature of the model. Unlike many hydrological models that work at the basin level, CAPRI-Water computes irrigation water use at the regional level, which is important for regional decision-makers but also implies that some hydrological conditions are not explicitly modelled.
This article is structured as follows: Section 2 presents the sensitivity analysis method, the study area, and the CAPRI-Water model; Section 3 presents the drivers analysed and the scenario design; Section 4 offers a detailed description of the results obtained; Section 5 focuses on the discussion of results; and Section 6 summarises the main conclusions.

2. Methodology

2.1. Sensitivity Analysis

Sensitivity analysis techniques assign uncertainty in model output to model input, enabling the identification of the key drivers of model results (Saltelli [15]). There are different approaches to conducting a sensitivity analysis that are frequently classified into local and global methods. The local methods explore variations in model results with regards to variations of an input factor around a given point; the global approaches contemplate the whole range of variability of the input factors. Additionally, sensitivity analysis tools can be divided into “one at time” (OAT) and “all at time” (ATT) methods, referring to assessing output variations when changing one input factor at a time or all the input factors at once [16,17,31]. The advantages and disadvantages of the different sensitivity analysis methods have been widely discussed in the literature [32,33]. Whereas local methods are commonly conducted in a deterministic framework by applying OAT techniques, global methods consider the probability distribution of model inputs and are based on ATT tools. As a result, local methods limit the range of uncertainty to the values selected and do not typically address cross-effects, whereas global tools cover the entire range of uncertainty in model inputs and account for interaction effects between parameters.
Global sensitivity analysis generally builds on Monte Carlo simulation to generate random draws that follow the distribution of model inputs [34,35], yet the number of simulations required increases exponentially when we have multi-variate distributions. In addition to the extreme computational cost of large-scale economic models, applying probabilistic approaches may prompt unfeasible parameter distributions because economic models include sets of parameters that are correlated.
Bearing in mind the complexity of the global agroeconomic model CAPRI, we apply a local method as an alternative to global methods, thereby assuming a set of plausible values instead of probability distributions for the parameters. To overcome limitations of OAT methods, which only capture individual effects, we have chosen a method that investigates both individual and interaction effects at a feasible computational cost. Therefore, we have applied sensitivity analysis with finite changes, a method that decomposes the finite change in model output (∆y) triggered by a shift in model input x from the reference case ( x 0 ) to the sensitivity case ( x 1 ) (Equations (1) and (2)) (Borgonovo [36]).
Δ y = g ( x 1 ) g ( x 0 ) = i = 1 n Δ i   g + i < j n Δ i , j   g + Δ 1 , 2 , n g
where:
Δ i   g = g ( x 1 0 ,   x 2 0 , x i 1 0 ,   x i 1 ,   x i + 1 0 ,   , x n 0 ) g ( x 0 ) Δ i , j   g = g ( x 1 0 ,   x 2 0 , x i 1 0 ,   x i 1 ,   x i + 1 0 ,   , x j 1 0 ,   x j 1 ,   x j + 1 0 , x n 0 ) Δ i   g Δ j   g g ( x 0 )
The first order terms Δ i g quantify the individual effect of changing input x i alone from the reference to the sensitivity case. The second order terms Δ i , j f express the amount of change in the model outcome due to the interaction effects between input factors x i and x j and are computed as simultaneously changing both inputs to x i 1 and x j 1 and subtracting the individual effects. Higher-order terms ( Δ 1 , 2 , n g ) follow the same rationale.
Sensitivity indices capture individual and interaction effects according to the following definitions:
φ l 1 = Δ l   g
φ l T =   Δ l   g + l j n Δ l , j   g + Δ 1 , 2 , n g
φ l I = φ l T φ l 1
φ l 1 depicts the individual effect of input l on the model output explained by the change of input x i l alone (Equation (3)). φ l T expresses the total effect of input l derived from the shift in input x i l , along with interaction effects (Equation (4)). φ l I represents interaction effects and is computed by subtracting individual effects from the total effects (Equation (5)).
According to Equation (6), with n being the number of parameters analysed, the total effects can be calculated in n model runs, instead of 2 n runs that is expected in a two-level factorial design. Moreover, the estimation of φ l 1 requires n model runs. Therefore, the total computational cost equals to 2 n + 1 model runs, which makes this method highly suitable for large models.
φ l T = Δ y Δ y ( l ) = g ( x 1 ) g ( x ( l ) 1 )
where Δ y is the change in y when all inputs vary, Δ y ( l ) . is the change in y when all inputs vary except x l , and x ( l ) 1 is the outcome when changing all inputs at the sensitivity case while keeping x l at the reference case.
Sensitivity indices can be represented in generalised tornado diagrams where, for each input, individual, interaction, and total effects on the model outcome are displayed as horizontal bars ranked from the most to the least significant input according to the total effects [37].
This approach has been recently applied to assess the sensitivity of long-term CO2 emissions to the different drivers under the Shared Socioeconomic Pathways (SSPs) (Marangoni et al. [38]). Further application areas include those in operational decision-making [39,40].

2.2. Study Area

Located in southern Spain, Andalusia is the most populous Spanish region, with 8.4 million people, and the second largest region, comprising 87,600 km2 (Figure 1). The regional economy builds on the services sector, which accounts for 75.5% of gross domestic product (GDP) and employs 2.3 million people (76.6% of the total people employed). The industrial sector represents 12.7% of GDP and employs 264,000 people, of which 60,200 people work in the food industry. The primary sector accounts for 5.5% of GDP and provides employment for 263,100 people. The trade of agri-food products plays an important role in the regional economy, representing one-third of total exports. The value of agri-food exports has increased sharply since 1990, amounting to EUR 10,787 million in 2017. In terms of commodities, the region is a major provider of vegetables and fruits to the European market and a worldwide exporter of olive oil [41].
The Utilised Agricultural Area (UAA) (Andalusian Yearbook of Agricultural and Fishery Statistics (2016)) in Andalusia covers 4.7 million ha, of which one million ha are under irrigation, representing over one-quarter of the total irrigated land in Spain. The soil and climate diversity in the region leads to an extraordinary variety of agricultural production. The agricultural potential largely depends on irrigated agriculture, which generates more than 64% of production in Andalusia and accounts for 63% of agricultural employment [42]. Olive trees are by far the most predominant irrigated crop, encompassing 46% of the irrigated land in Andalusia, followed by cereals (14%), vegetables (12%), industrial crops (9%), citrus (8%), fruit trees (5%) and fodder crops (2%). The share of irrigated land differs largely across crops, from 20% of total cultivated area in the case of cereals to 32% in the case of olive groves and up to almost 100% in the case of fruits and vegetables. In terms of water use, the survey of water use in agriculture (2016) from the National Institute of Statistics (INE) reveals that arable crops account for 30% of the agricultural water withdrawal in the region (mainly due to rice and cotton production), followed by fruit trees (22%), olive trees (19%), and vegetables (10%). According to the Regional Economic Accounts of Agriculture, fruits and vegetables are the largest contributors to the agricultural production value, representing more than 60% of the total crop production value. Meanwhile, olive oil accounts for 22% of the total value, whereas cereals and oilseeds contributions are in the order of 3% and 4%, respectively.
In total, irrigated agriculture accounts for about 80% of total water withdrawals in the region [43]. As for the source of water, 71% of irrigation water is derived from surface water, 28% from groundwater, and 1% from non-conventional water resources (i.e., reutilisation, desalinisation). The high water demand combined with wide fluctuations in available water due to rainfall variability has created a delicate water balance in the different river basins of the region [44,45]. Efforts of public administrations to reduce water use in agriculture through different irrigation plans have targeted the improvement and development of water infrastructure, as well as the replacement of the traditional surface irrigation systems with drip and sprinkler irrigation methods [46,47]. As a result, drip irrigation systems cover 64% of irrigated land, whereas sprinkler systems and surface irrigation span 13% and 23% of irrigated land, respectively. This modernisation process has reduced average gross water use to 3572 m3/ha, though this figure varies significantly across crops (e.g., fruits and vegetables use over 5000 m3/ha) [47].
The implementation of more efficient irrigation systems has played an important role in the attainment of short-term water savings, but might trigger an increase in water demand in the medium term. The rebound effect arises from the growing interest in high value crops, such as fruits, due to guarantees of higher water supply and better quality of irrigation systems [48,49], and also from decoupled payments of the Common Agricultural Policy (CAP) that encourage agricultural production adaptation to market [30,50,51]. Despite the efforts to promote water conservation, a recent report on the implementation of the Water Framework Directive (WFD) shows that water abstraction remains high, with the water exploitation index (WEI+)—that relates water abstraction with its long-term annual average available renewable water resources—over the threshold of 40% due mainly to irrigation water withdrawn in some river basins, such as the Guadalquivir, the largest river basin in Andalusia [52].
In addition, an unexpected effect of irrigation plans has been the dramatic rise in the energy dependence of the agricultural sector following the replacement of traditional irrigation systems with pressurised systems. The higher energy requirements, along with the energy market liberalisation in 2008, have dramatically increased irrigation costs [53,54].

2.3. The CAPRI-Water Model

CAPRI is a global agroeconomic model developed for policy impact assessment purposes with a focus on the EU (Britz and Witzke [55]). The comparative-static structure of the model enables the evaluation of agricultural and environmental policies by comparison of potential scenarios against a baseline or reference scenario over a future horizon. The model draws upon two core modules: the supply module and the market module. The supply module builds on regional agricultural nonlinear programming models that capture farming decisions at the NUTS 2 level in the EU, Norway, the Western Balkans, and Turkey, while considering price changes in world markets for about 60 commodities (primary and secondary agricultural products) from the market module.
CAPRI captures the interplay between agricultural production and the environment in detail and is able to compute a number of agro-environmental indicators (e.g., nutrient balances, greenhouse gas emissions). As a major strength, the model is highly suitable to assess climate change impacts on agricultural and food systems based on climate-induced changes in crop yields, as provided by crop models [12,56]. The recent update of the model further enhances its capacity to explore climate change impacts on agriculture by considering the water dimension. The interface between agriculture and water is likely to become increasingly significant under climate change conditions [57] and, thus, there is a need to explore the water–food nexus.
The CAPRI-Water model incorporates irrigation water use in the standard supply module (Blanco et al. [13]). Within the irrigation sub-module, land is differentiated into non-irrigable (water comes from rainfall) and irrigable (equipped for irrigation and likely to be irrigated) based on the data from the Farm Structure Survey (FSS) issued by EUROSTAT (EUROSTAT—Statistical office of the European Union). Irrigable land constitutes the maximum threshold to irrigated land at the NUTS 2 level. An activity is considered irrigable when it has been reported to be under irrigation in at least one Member State.
Input–output coefficients are defined for both rain-fed and irrigation options for all irrigable activities, adding irrigation water use in the case of irrigation variants. Crop net actual irrigation water use is computed for each crop and NUTS 2 region based on theoretical crop-specific water requirements and effective rainfall obtained from the CROPWAT model, rain-fed/irrigation shares and crop yields. The distinction between rain-fed and irrigation yields builds on the ratio of potential yield/water limited yield obtained from the World Food Studies (WOFOST) model. Gross irrigation water use is calculated considering water application and transport efficiencies from the literature. Water application efficiency relies on the irrigation method and management practices, ranging from 0.6 to 0.9 [58]. Regional water application efficiency is estimated based on the reference values for each irrigation method (surface, sprinkler and drip irrigation) and the share of area covered by irrigation methods from the FSS. Water transport efficiency depends on the water infrastructure conditions (e.g., permeability of canals) and varies between 0.60 and 0.95 according to Brouwer et al. [58]. Total water availability for irrigation at the regional level is included as a threshold; thus, total water use by crops cannot exceed potential water availability.
The CAPRI-Water baseline represents the projected agricultural situation up to 2050 under status quo policy (i.e., CAP 2014–2020). It builds on the EU medium-term outlook for agricultural markets and income [59] up to 2030 and projections from other well-established models for the long run (e.g., GLOBIOM). Socio-economic drivers are in line with the Shared Socioeconomic Pathway (SSP) 2. Climate change impacts on crop productivity build on the Representative Concentration Pathway (RCP) 6.0., considering the median case crop yield scenario from the 15 possible Global Circulation Model (GCM) and Global Gridded Crop Model (GGCM) combinations, as in van Meijl et al. [60]. The median scenario for RCP 6.0 draws on the combination of the GCM HadGEM2-ES [61] and the GGCM DSSAT [62]. With regards to irrigation efficiency, the current baseline considers an annual growth rate of 0.05% according to OECD [63].

3. Identification of Key Water Drivers

3.1. Drivers Selection and Definition

Drivers for this analysis were identified through a stakeholder consultation process in the framework of the Andalusian case study within the H2020 SIM4NEXUS project. Exploring uncertainty-related concerns from stakeholders is an essential element to derive valuable insights for decision-making [19,20]. In this approach, the drivers of future irrigated agriculture development in Andalusia were selected over the course of two workshops, gathering 14 stakeholders from different public and private sectors. The first workshop aimed to identify the main challenges in the WEF nexus. Climate change and water were recognised by all the stakeholders as major challenges to promoting sustainable agriculture in the region [21]. (According to stakeholders, other drivers with significant roles in the nexus were energy cost, irrigation water use, food production, socio-economic factors, and environmental conservation. For further detail, please see Martinez et al. [21].). In the second workshop, the focus was on policy scenarios to tackle the identified challenges. Water availability for agriculture, irrigation efficiency, and water costs were highlighted among the main drivers of uncertainty.

3.1.1. Water Availability for Irrigation

Climate change is likely to exacerbate water stress in Andalusia over coming years. Roudier et al. [64] have foreseen more severe and longer droughts in the region mainly due to less precipitation and higher evapotranspiration. Donelly et al. [65] concluded that observed reductions in runoff in southern Spain in response to different levels of global warming might constrain water availability and agricultural production. Furthermore, Garrote et al. [29] highlighted a reduction in the maximum potential water withdrawal for irrigation in virtually all of the Mediterranean basins, with the most significant decrease being observed in the Guadalquivir basin.
According to the Centre for Public Works Studies and Experimentation (CEDEX) from the Spanish Ministry of Public Works and Transport, under RCP 8.5, the estimated average reduction in runoff for the different river basins of the region ranges from 10% to 12% for the period 2010–2040 and from 18% to 20% for the period 2040–2070 in comparison to the reference period 1961–2000. When considering RCP 4.5, the estimated reduction varies between 2% and 7% for the period 2010–2040, and 8% and 12% for the period 2040–2070 [25].
Specific projections of water availability for agriculture under climate change are highly uncertain and are not easily accessible. For this exploratory analysis, we assume a range of variation for water availability in agriculture from 2% to 20%, as considered for runoff in CEDEX [25].

3.1.2. Irrigation Efficiency

Irrigation efficiency is defined as the ratio between crop water consumption to satisfy evapotranspiration and irrigation water withdrawal [66,67]. In this regard, Perry [67] stated the need to differentiate between consumed water, which can be beneficial for irrigated crops (i.e., water transpiration) or non-beneficial (i.e., evaporation from water surface), and non-consumed water in irrigation, which can either be recovered for other uses (i.e., return flows) or non-recovered (e.g., flow to saline groundwater). Irrigation efficiency embraces water conveyance efficiency, associated with water transport and distribution, and water application efficiency, related to irrigation methods (i.e., surface, drip, and sprinkler irrigation). The different irrigation plans implemented from 2002 substantially enhanced irrigation efficiency in Andalusia, resulting in an average water use efficiency of 0.76 in the region [47]. The impact of the irrigation modernisation plans on consumed water and its implications for irrigation return flows are not well established, but some estimations show that, in the Guadalquivir river basin, irrigation consumptive water represents 93% of water use and return flows amount to 7% of water use [47]. Improvements in irrigation efficiency might continue in the future with the implementation of water policies [68] and the adoption of new technologies [69,70,71]. Nevertheless, the pace of growth remains uncertain, as it depends on diverse factors such as investments in more efficient techniques and agricultural practices.
A number of studies have recently explored future developments in irrigation efficiency under different assumptions. Fisher et al. [72] assumed an efficiency gain of 10% from 2000 to 2030 and a further 10% increment from 2030 to 2080 across regions. Schmitz et al. [73] stated that there would be an increase in irrigation efficiency based on GDP per capita growth over time. The Water Future and Solutions Initiative (WFaS) has addressed the need for comparable and consistent global water scenarios by incorporating the water dimension within the SSP framework [74]. Thus far, qualitative scenario assumptions are available for the agricultural sector on the basis of storyline features for each driver under each SSP [75]. First attempts to quantitatively explore water scenarios under SSPs include, for instance, that of Hanasaki et al. [76], who simulated different scenarios compatible with the SSP framework with high, medium and low irrigation efficiency changes, assuming per cent changes per year of 0.3, 0.15 and 0.0, respectively. Bijl et al. [77] and Doelman et al. [78] simulated irrigation efficiency through the progressive reduction of the gap between water withdrawal and consumption of 0.1% and 0.04% for SSP1 and SSP2, respectively, while irrigation efficiency would remain at present levels under SSP3.
Due to the absence of common quantitative water scenarios for the agricultural sector at present, we have considered two alternative options where the best-case scenario assumes an annual growth rate of irrigation efficiency of 0.1% (equivalent to a cumulative total change of 4%) and the worst-case scenario considers no change in irrigation efficiency over the coming decades.

3.1.3. Water Cost

Irrigation costs comprise system operation and maintenance, energy, and water costs, the weight of each varying based on the origin of water (i.e., groundwater, surface water, etc.) and across river basins [79]. On average, operation and maintenance costs represent 42% of total irrigation costs, whereas energy costs accounts for 37% and water costs are 21% in Andalusian irrigated agriculture [27].
System operation and maintenance costs cover benefits related to developing, managing, and maintaining public water infrastructure [79]. Energy costs in irrigated agriculture, associated with the implementation of pressurised systems, have notably augmented in recent years due to higher energy requirements of modernised irrigation systems and higher energy tariffs. According to Corominas [53], energy demand in irrigated agriculture in Spain doubled from 1980 to 2007, increasing from 775 kWh/ha to 1560 kWh/ha. Energy tariffs for irrigation have undergone a significant increase from 2009 following the replacement of the state-regulated tariff system with market-oriented pricing. In contrast, water costs, which include tariffs and fees for water services, have remained broadly stable during recent decades [79].
Average irrigation water costs in Andalusia amount to EUR 0.08 per m3 [30]. Future trends are difficult to predict as they are subject to energy market developments and energy and water policies, thereby remaining extremely uncertain. To investigate the potential effect of this driver, we have assumed an increase of EUR 0.01 per m3 in the baseline by 2050 (+13% compared to average water costs at present) and two alternative options reflecting either no changes in water cost or an increment of EUR 0.02 per m3 (+25% compared to average water costs at present). It should be noted that the CAPRI-Water baseline implicitly considers the variation in water costs as forecast by official projections. To avoid overestimation of future water costs, simulations are run based on conservative values.

3.2. Scenario Framework

The scenario framework that was designed to perform the sensitivity analysis draws on a reference scenario and two alternative scenarios where key drivers inform alternative model inputs. Scenarios are run for the year 2050 to capture climate change effects on agriculture.
The reference scenario builds on the CAPRI-Water baseline. To account for uncertainties in future water availability, the reference scenario additionally assumes an average decrease of 10% in water availability for agriculture in Andalusia in 2050, according to CEDEX [25]. Furthermore, we have assumed an increase in water costs in 2050 of EUR 0.01 per m3 to capture potential future water cost developments.
The alternative scenarios attempt to represent two sensitivity cases, the worst-case and the best-case scenarios, where the input parameter for the different drivers shifts from the reference value to better and worse values, respectively. The worst-case scenario assumes a 20% reduction in water availability, no change in irrigation efficiency rate and a rise in water costs of EUR 0.02 per m3 in 2050. The best-case scenario considers a 2% reduction in water availability, irrigation efficiency gains of 0.1% per year and no changes in water costs in 2050 (Table 1).
To conduct the sensitivity analysis, we have first computed individual effects by changing each driver one at time from the reference value to the alternative values defined in scenarios X1 and X2. Then, we have shifted all drivers to either X1 or X2 except the one of interest to estimate its total effect. The interaction effect is calculated as the difference between total and individual effects. As the objective of this research is to explore the sensitivity of the model outcome to the selected drivers in the particular case of Andalusia, shifts in the drivers are only introduced for this single region and scenarios are run considering no changes in food prices. This procedure leads to two important assumptions that need to be considered when interpreting results: we assume no changes in all other regions and changes in Andalusia do not affect other regions.

4. Results

4.1. Scenario Results

The results from CAPRI-Water show that the impacts of climate change on water availability for agriculture as well as future changes in irrigation efficiency and water costs will significantly affect the agricultural sector in Andalusia. Table 2 summarises outcomes from the reference, the worst-case, and the best-case scenarios for rain-fed land, irrigated land, irrigation water use, and income for main crops in Andalusia over the horizon of 2050.
Under the worst-case scenario (X1), CAPRI-Water anticipates a 10.4% decrease in the total irrigated land, which particularly affects cereals and olives for oil and, to a lesser extent, oilseeds. In contrast, irrigated land allocated to vegetables remains virtually unchanged and irrigated land for citrus fruits decreases slightly. In line with the decline in irrigated area, the total irrigation water use falls by 5.5%. Whereas irrigation water use decreases for cereals, oilseeds and olives for oil, citrus fruits experience a limited decline and other fruits and vegetables show an increase in water use.
Looking at the best-case scenario results (X2), the total irrigated land is projected to increase by 14.1% and irrigation water use by 8.3%. The largest effects are observed for cereals, which undergo an expansion in irrigated land of about 300%, accompanied by a similar increment in irrigation water use.
The total change in agricultural income is expected to range between −1% and +1%, with notable differences among crops. Income from cereals, citrus fruits and olives for oil vary around 3%, while remaining basically unchanged for vegetables and other fruits both in the best-case and worst-case scenarios.

4.2. Sensitivity Analysis

The results of the sensitivity analysis of total irrigated land to the different drivers are presented in Figure 2, which also depicts the sensitivity results for irrigated cereals and citrus fruits (results for oilseeds, olives for oil and vegetables are presented in Supplementary Materials Figure S1). The overall variation in total irrigated land is decomposed into sensitivity indices that depict total, individual, and interaction effects of each driver, expressed as a percentage difference from the reference scenario. The left side of the figure represents sensitivity indices when drivers shift from the reference value to the worst-case scenario (X1) and the right side depicts sensitivity indices when values change to the best-case scenario (X2).
The total irrigated land decline in X1 and expansion in X2 is induced mainly from the individual effects of water costs. The effect of irrigation efficiency is negligible, whereas the variations in water availability appears not to have an effect.
The observed pattern in total irrigated land is reproduced when looking at crop-specific results, yet the magnitude of effects is very different. Whereas increased water costs trigger a reduction in citrus irrigated land by around 4% in scenario X1, variation in cereals irrigated land is above 50%. This change is even higher in scenario X2, where lower water costs induce a large increase in irrigated land allocated to cereals. Meanwhile, vegetables irrigated land remains virtually unchanged in both scenarios (Figure S1).
Sensitivity of irrigation water use (total, used for cereals, and used for citrus fruits) to the different drivers is reported in Figure 3 (results for oilseeds, olives for oil, and vegetables are presented in Supplementary Materials Figure S2). In this case, the results are driven both by water costs and irrigated efficiency. These drivers lead to inverse changes in irrigation water use and, thereby, counteract each other. The magnitude of sensitivity to water costs and irrigation efficiency varies across crops. In the case of citrus fruits, the increase and decrease in water use in scenarios X1 and X2, respectively, are around 5% and are driven by both water costs and irrigation efficiency to a similar extent, countering their effects and triggering limited changes in water use. With regard to cereals, variations in irrigation water use are in the order of 300% and stem mostly from changes in water cost. In contrast to the observed pattern, irrigation water use for vegetables slightly increases in the worst-case scenario and decreases in the best-case scenario (Figure S2).
In terms of agricultural income, as observed in Figure 4, variations in results are driven essentially by water costs, which explain around 95% of the change in income in all the crops analysed. The increase in water costs in scenario X1 causes a decline in the total agricultural income in the region, while lower water costs in scenario X2 lead to increased income. Total income variations in both scenarios are around 1%, while observed changes for cereal and citrus fruits income are in the order of 3%. As for irrigated land and irrigation water use, income from vegetables barely changes between scenarios (Figure S3).

5. Discussion

Agricultural development in Andalusia over the horizon to 2050 will be affected by different factors. Based on a reference scenario that accounts for climate-induced changes in crop productivity under RCP 6.0, we have analysed the sensitivity of irrigated land, irrigation water use, and agricultural income to shifts in three drivers: water availability for irrigation, irrigation efficiency, and water cost.
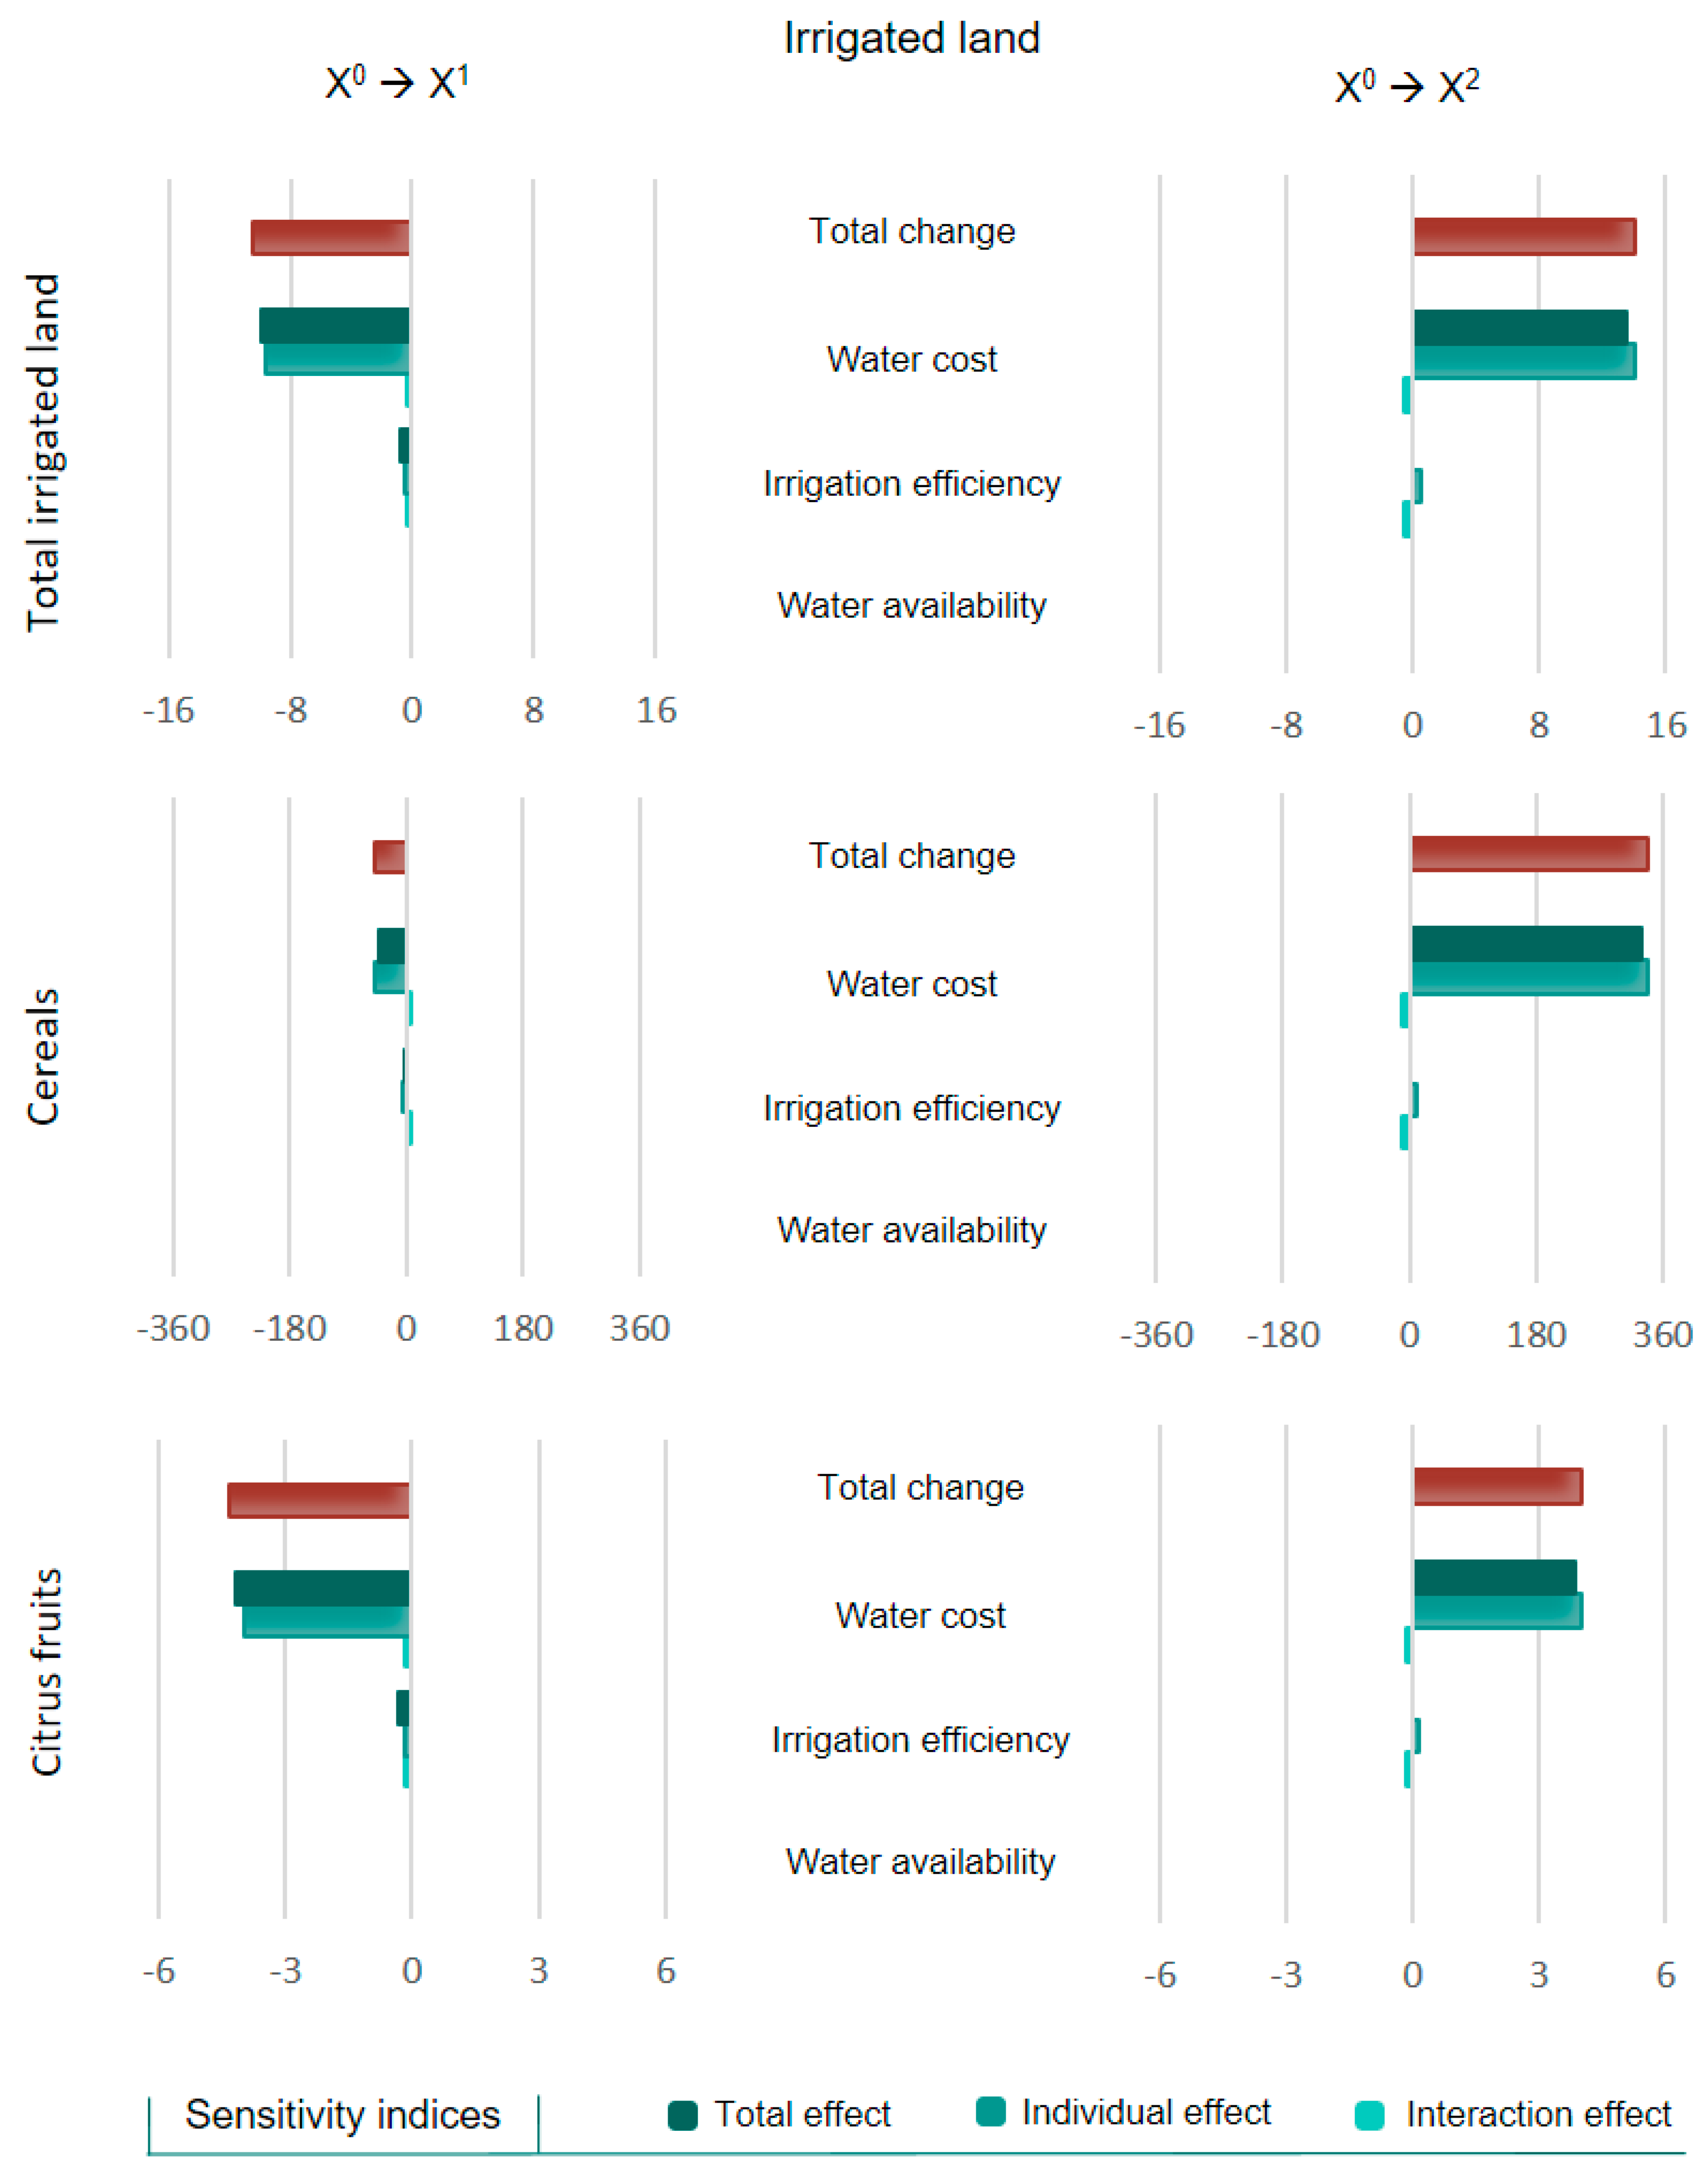
Irrigated land is fundamentally driven by water costs in irrigation. The decline or expansion in irrigated land arises from increased or decreased water costs in the worst- and best-case scenarios, respectively. The same pattern applies to crop-specific irrigated land, although there are significant differences on the magnitude of sensitivity between crops. Citrus fruits and vegetables are less sensitive to changes in water cost than cereals due to higher water productivity that enable these productions to afford higher water costs. These future trends are consistent with observed adjustments in cropping patterns that benefit more profitable crops in response to increased water cost (Fernandez Garcia et al. [49]). Moreover, these trends are also in line with perspectives from stakeholders, who anticipate a decline in irrigated land for cereals (e.g., maize, rice) over the coming years in favour of more profitable crops such as fruits.
Our results indicate that water availability for agriculture does not significantly influence the agricultural landscape. This fact may arise from the underlying assumption about water cost in the reference scenario (i.e., increased water cost of EUR 0.01/m3) and denotes a high responsiveness of the model to this parameter. The high irrigation costs prevailing in Andalusia entail that a small change in water costs might trigger significant effects on water use. Yet, results should be interpreted with caution, considering that data and projections on water use and water costs are highly uncertain. Furthermore, we have observed that water cost is a limiting factor on irrigation in Andalusia, as opined by stakeholders and stated by other authors (Rodríguez-Diaz et al. [80], Fernandez Garcia et al. [49]).
Irrigation water use is not only driven by water cost but also by irrigation efficiency. These two factors behave in opposite directions and counteract each other. Lower water cost boosts irrigation water use, whereas irrigation efficiency gains lower it. The sensitivity to each of these drivers depends critically on the crop. Citrus fruits are sensitive to water costs and irrigation efficiency, whereas cereals are more sensitive to water cost. In the best-case scenario, irrigation efficiency gains lead to a reduction in water use for citrus fruits, while cereals experience a significant increase prompted by lower water costs. In contrast, in the worst-case scenario, irrigation water use exhibits a notable decrease for cereals while declining slightly for citrus fruits. Accordingly, citrus irrigation water use barely changes in the scenarios analysed, while cereal water use varies substantially. This suggests that water is allocated with priority to higher-profitability crops under resource restrictions (Garcia-Vila et al. [50]) and also that increased water cost effects on water use diverge substantially among crops (Garcia-Vila et al. [50], Berbel et al. [81]).
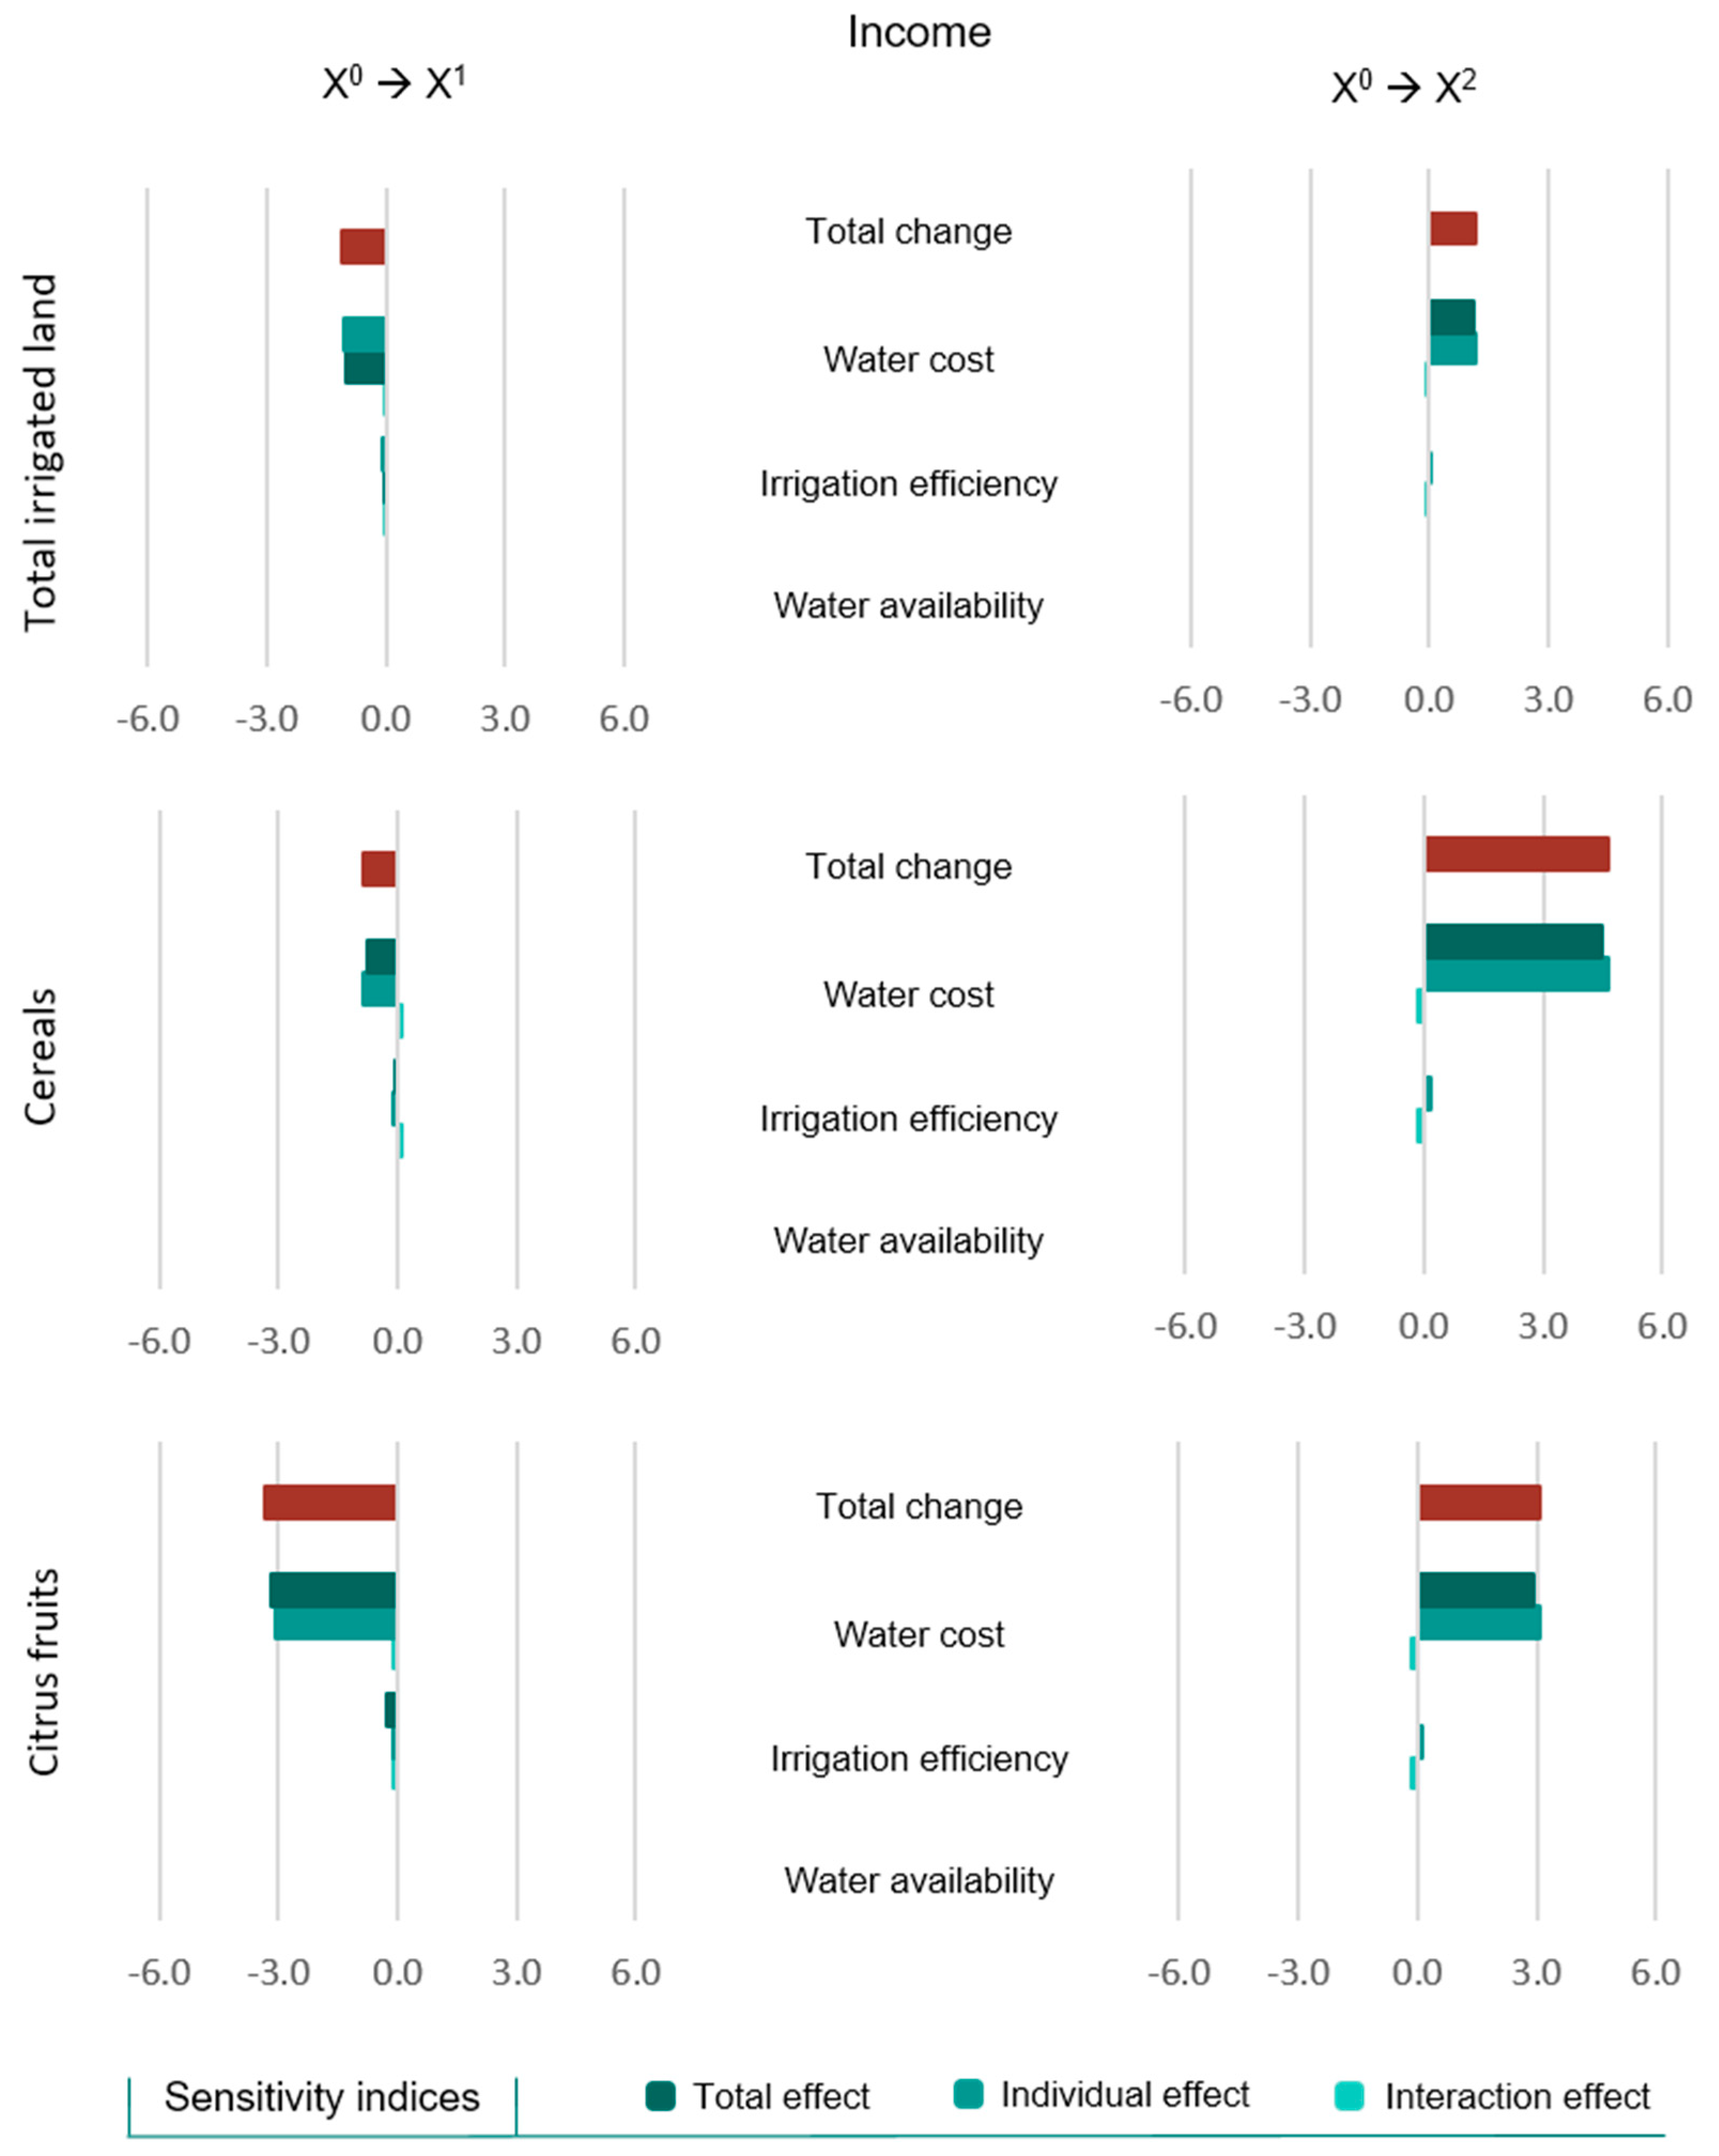
Significant variations in irrigated land and irrigation water use lead to small changes in total agricultural income in the region, which ranges between −1.1% and +1.2% in the worst- and best-case scenarios, respectively. This can be explained by the allocation of water to high-value crops, such as vegetables and fruits, that cushions impacts on income. While most crops decrease water use under the worst-case scenario, vegetables and other fruits experience an increase. These results are in line with insights from stakeholders who foresee the allocation of water resources increasingly based on water productivity.
The sensitivity of agricultural development to the different drivers analysed offers relevant information for decision-making. Climate change is projected to impact agriculture in the region through changes in crop productivity and water availability [25,65]. Notwithstanding this, variations in water costs potentially induced by future socio-economic development (e.g., water pricing, use of non-conventional water resources such as desalinisation and reuse, and evolution of energy markets) emerge as major drivers of the Andalusian agricultural sector, with different effects depending on the crop. This suggests that crop-specific responses to changes in water costs need to be considered when designing policies that target water use efficiency in agriculture, such as water pricing. Responsiveness of fruits and vegetables to variations in water costs is limited, resulting in unchanged or even increased water use when the water costs rise. This entails that high water prices are required to induce a decline in water use, with a negative impact on agricultural income (Esteve et al. [81], Expósito and Berbel [82], Gutierrez-Martin and Gómez-Gómez [83], Perez-Blanco et al. [84]). In addition, increased water costs linked to the energy dependence of irrigated agriculture need to be considered when addressing the sustainability of the sector. Harmonised agricultural and energy policies are needed to account for the increasing interconnections between agriculture and energy sectors. According to stakeholders, more flexible energy regulations are required to alleviate the cost burden of energy. In the meantime, efforts from agricultural policies are also required to support measures that enhance energy efficiency and promote the introduction of renewable energies in agriculture [85,86,87,88]. On-farm-energy solar generation has proven to be a suitable alternative to reduce energy costs in irrigation. For instance, Carrillo-Cobo et al. [89] estimated a reduction in energy costs of 60% in the Bembézar MI irrigation district (Andalusia) driven by the implementation of photovoltaic energy. Additionally, the recent change in energy legislation (i.e., the Royal Decree 244/2019, 5 April, that specifies the arrangements for administrative, technical and economic conditions for electric energy self-consumption), which eliminates taxes to electric energy self-consumption in Spain, might boost the expansion of solar energy in agriculture, with implications for irrigation costs that will need to be further assessed under tailored water cost scenarios.
Furthermore, the observed expansion in permanent crops in the region to the detriment of annual crops also has political implications. In comparison with annual crops, fruit tree production is generally more water-intensive and more sensitive to extreme events, which are expected to be more frequent under climate change conditions [64]. This points to the need for adaptation strategies that enhance the resilience of agricultural systems to the impacts of climate change by improving agricultural water management to reduce water losses (i.e., non-beneficial water evaporation from soil) [10,90], water governance (i.e., water rights, water markets) [10,91], and water use efficiency [62,92]. In this regard, irrigation efficiency gains can contribute to lower water use and reduce crop-responsiveness to water costs. As illustrated by Berbel et al. [11], who conducted a microeconomic analysis to investigate the effects of irrigation efficiency enhancement on water use and water consumption on maize in the Mediterranean, water demand functions are more inelastic as irrigation efficiency increases.
Nevertheless, measures are required to reduce the rebound effect observed in recent decades, which led to an increase in water consumption and water use as a consequence of improved water use efficiency [51,93]. A number of studies have attempted to assess the impact of irrigation water use improvements on water saving, highlighting that the expansion of irrigated land and changes in crop patterns are major factors behind this effect [93,94]. Our results show that irrigation efficiency enhancement generally reduces water use, yet this factor has only a minor effect on irrigated land increases [11]. Nevertheless, changes in crop patterns are expected, with an increase in irrigated land devoted to permanent crops, in line with empirical studies [49,50] and prospects from stakeholders. Therefore, political instruments are needed to govern irrigated land and allotment of water saved. Furthermore, promoting lower water-intensive crops and deficit irrigation, as well as agricultural management practices that enhance water conservation, might contribute to improving the sustainability of water resources [10,94,95,96].
The analysis conducted offers valuable information about future agricultural developments under different assumptions. Using CAPRI-Water enables building the analysis on a baseline calibrated to official projections (i.e., EU agricultural outlook) and accounting for climate-induced impacts on crop productivity in 2050 as provided by well-established crop models. Another advantage of this approach, highlighted as a limitation in other studies [48], is that the analysis of scenarios permits the differentiation of irrigated land expansion driven by increased water use efficiency from the inherent expansion of irrigated land over time. Nonetheless, the global nature and EU regional focus of the model lead to some limitations regarding the introduction of the water dimension mainly due to data constraints. CAPRI-Water draws on EU-wide harmonised data sources to model agricultural water use at the regional level within Europe. Regional water databases are often incomplete for some variables that are basin-specific and are not generally reported in EU-wide statistics. Whereas the model computes water use, water return flows are not explicitly considered, as is done by other economic studies performed at basin-scale, irrigated area or field levels, where data can be more easily available [10,11,90,97]. This limits the assessment of the potential effects of increased irrigation efficiency on groundwater recharge [98,99] and redistribution of water between different uses [13]. Furthermore, the model does not differentiate water by origin, which limits the analysis of the differential impact of climate change on surface and groundwater [25].
In comparison to the global sensitivity analysis, the approach applied in this study is more restricted with regards to the number of factors and the range of uncertainty considered (Saltelli et al. [33], Pianosi et al. [17]). Focussing on only three drivers, even if they have been clearly identified by stakeholders, inevitably reduces the scope of the analysis and narrows the range of uncertainty considered. Nevertheless, this type of local sensitivity analysis is well suited to understand model behaviour and results variation in response to the shifts in model parameters rather than to explore the whole range of results uncertainty (Borgonovo [36], Borgonovo and Plischke [16]). The use of worst-case and best-case scenarios has proven to be effective to assess the impacts of changes in drivers. Notwithstanding this, the approach applied would benefit from the analysis of other drivers that have been shown to have an impact on water use in agriculture, such as CAP payments, or policy measures, such as subsidies for using non-conventional water resources.

6. Conclusions

This study explores major drivers of agricultural development in Andalusia under climate change in 2050 using the CAPRI-Water model. The application of sensitivity analysis with finite changes decomposition enables computation of individual and interaction effects of selected drivers using a computationally feasible number of model runs, which is essential for a large modelling system such as CAPRI.
The results from the analysis indicate that the cost of water is the most determining factor in shaping agricultural land, with the magnitude of the sensitivity to this driver differing across crops. Furthermore, the most influential factors with respect to irrigation water use are water cost and irrigation efficiency, which counteract each other. The relevance of these drivers largely depends on the crop: while citrus fruits water use is driven by irrigation efficiency, cereal water use is mostly determined by water costs. Unexpectedly, variations in water availability for agriculture does not seem to have a significant effect on irrigated land and irrigation water use. This is consistent with results from other studies where water cost emerges as a limiting factor in irrigation despite the availability of water for agriculture.
Identifying the main drivers of future agricultural development provides meaningful information for developing policies that effectively enhance sustainable agriculture and water management in Andalusia. Tariff-based policies to promote resource use efficiency, such as water pricing in irrigation, must consider crop sensitivity to water cost shifts and its implications for income. Furthermore, greater consistency between agricultural and energy policies is required to reduce the cost burden on energy and promote energy use efficiency in irrigated agriculture. Additionally, policies aimed at improving water use efficiency can contribute to strengthening the resilience and adaptation capacity of future agricultural systems to climate change, though instruments are required to deal with the rebound effect.
This analysis offers valuable insights into the contribution of different scenario drivers to model results that might support decision-making in agriculture under a climate change context. Additionally, this exercise can support model diagnostics and help to define parameters for which projections are either not readily available or are surrounded by high uncertainty. Nevertheless, the application of a global agroeconomic model involves a number of constraints in comparison to the assessments based upon hydrological models. The application of a holistic approach to analyse the water–food nexus is subject to the complex nature of the interrelations within the nexus and data limitations that, in this particular case, do not enable us to explicitly account for return flows. This constrains the analysis of the potential effects on water redistribution between different uses and groundwater recharge.
Notwithstanding these issues, further research is needed to explore drivers’ effects under different assumptions. Attention needs to be also focussed on the impact of other drivers beyond the water dimension, such as CAP payments, and policy measures, such as subsidies for using desalinated water.

Supplementary Materials

The following are available online at https://www.mdpi.com/2073-4441/11/9/1854/s1, additional results for oilseeds, olive for oil and vegetables that depict sensitivity of irrigated agricultural land (Figure S1), irrigation water use (Figure S2) and income (Figure S3) to scenario drivers.

Author Contributions

Conceptualization, P.M. and M.B.; Methodology, P.M. and M.B.; Formal analysis, P.M.; Writing—original draft preparation, P.M.; Writing—review and editing, P.M. and M.B.; Supervision, M.B.

Funding

This research was funded by the European Union’s Horizon 2020 research and innovation programme, under Grant Agreement NO 689150 SIM4NEXUS, and the MINECO/ERDF in the framework of the 2013–2016 R&D National Plan, ECO2015-64438-R SYNERCAP.

Acknowledgments

We would like to thank to all the stakeholders who participate in the workshops for their invaluable contribution to the development of this research.

Conflicts of Interest

The authors declare no conflict of interest.

References

  1. FAO. The Future of Food and Agriculture—Trends and Challenges; Food and Agriculture Organisation: Rome, Italy, 2017. [Google Scholar]
  2. Serraj, R.; Pingali, P.L. (Eds.) Agriculture & Food Systems to 2050: Global Trends, Challenges and Opportunities; World Scientific Publishing Company Pte. Limited: Singapore, 2019. [Google Scholar]
  3. Byers, E.; Gidden, M.; Leclère, D.; Balkovic, J.; Burek, P.; Ebi, K.; Greve, P.; Grey, D.; Havlik, P.; Hillers, A.; et al. Global exposure and vulnerability to multi-sector development and climate change hotspots. Environ. Res. Lett. 2018, 13, 055012. [Google Scholar] [CrossRef] [Green Version]
  4. Ciscar, J.C.; Ibarreta, D.; Soria, A.; Dosio, A.; Toreti, A.; Ceglar, A.; Fumagalli, D.; Dentener, F.; Lecerf, R.; Zucchini, A.; et al. Climate Impacts in Europe: Final Report of the JRC PESETA III Project, EUR 29427 EN; Publications Office of the European Union: Luxembourg, 2018. [Google Scholar] [CrossRef]
  5. EEA. Water Use in Europe—Quantity and Quality Face Big Challenges; European Environmental Agency: Copenhagen, Denmark, 2018. [Google Scholar]
  6. Walker, W.E.; Harremoës, P.; Rotmans, J.; van Der Sluijs, J.P.; van Asselt, M.B.A.; Janssen, P.; Krayer von Krauss, M.P. Defining uncertainty: A conceptual basis for uncertainty management in model-based decision support. Integr. Assess. 2003, 4, 5–17. [Google Scholar] [CrossRef]
  7. Sauer, T.; Havlik, P.; Schneider, U.A.; Schmid, E.; Kindermann, G.; Obersteiner, M. Agriculture and resource availability in a changing world: The role of irrigation. Water Resour. Res. 2010, 46. [Google Scholar] [CrossRef] [Green Version]
  8. Sulser, T.B.; Ringler, C.; Zhu, T.J.; Msangi, S.; Bryan, E.; Rosegrant, M.W. Green and blue water accounting in the Ganges and Nile basins: Implications for food and agricultural policy. J. Hydrol. 2010, 384, 276–291. [Google Scholar] [CrossRef]
  9. Liu, J.; Hertel, T.W.; Taheripour, F.; Zhu, T.; Ringler, C. International trade buffers the impact of future irrigation shortfalls. Glob. Environ. Chang. 2014, 29, 22–31. [Google Scholar] [CrossRef] [Green Version]
  10. Ward, F.A.; Pulido-Velázquez, M. Water conservation in irrigation can increase water use. Proc. Natl. Acad. Sci. USA 2008, 105, 18215–18220. [Google Scholar] [CrossRef] [PubMed] [Green Version]
  11. Berbel, J.; Gutiérrez-Martín, C.; Expósito, A. Impacts of irrigation efficiency improvement on water use, water consumption and response to water price at field level. Agric. Water Manag. 2018, 203, 423–429. [Google Scholar] [CrossRef]
  12. Blanco, M.; Ramos, F.; Van Doorslaer, B.; Martínez, P.; Fumagalli, D.; Ceglar, A.; Fernández, F.J. Climate change impacts on EU agriculture: A regionalized perspective taking into account market-driven adjustments. Agric. Syst. 2017, 156, 52–66. [Google Scholar] [CrossRef]
  13. Blanco, M.; Witzke, P.; Barreiro Hurle, J.; Martinez, P.; Salputra, G.; Hristov, J. CAPRI Water 2.0: An Upgraded and Updated CAPRI Water Module, EUR 29498 EN; Publications Office of the European Union: Luxembourg, 2018. [Google Scholar] [CrossRef]
  14. Blanco, M.; Witzke, P.; Pérez Domínguez, I.; Salputra, G.; Martínez, P. Extension of the CAPRI Model with an Irrigation Sub-Module, EUR 27737 EN; Publications Office of the European Union: Luxembourg, 2015. [Google Scholar] [CrossRef]
  15. Saltelli, A. Sensitivity analysis for importance assessment. Risk Anal. 2002, 22, 579–590. [Google Scholar] [CrossRef]
  16. Borgonovo, E.; Plischke, E. Sensitivity analysis: A review of recent advances. Eur. J. Oper. Res. 2016, 248, 869–887. [Google Scholar] [CrossRef]
  17. Pianosi, F.; Beven, K.; Freer, J.; Hall, J.W.; Rougier, J.; Stephenso, D.B.; Wagener, T. Sensitivity analysis of environmental models: A systematic review with practical workflow. Environ. Model. Softw. 2016, 79, 214–232. [Google Scholar] [CrossRef]
  18. EC. Better Regulation Guidelines; European Commission: Strasbourg, France, 2015. [Google Scholar]
  19. Gabbert, S.; Van Ittersum, M.; Kroeze, C.; Stalpers, S.; Ewert, F.; Olsson, J.A. Uncertainty analysis in integrated assessment: The users’ perspective. Reg. Environ. Chang. 2010, 10, 131–143. [Google Scholar] [CrossRef]
  20. Höllermann, B.; Evers, M. Perception and handling of uncertainties in water management—A study of practitioners’ and scientists’ perspectives on uncertainty in their daily decision-making. Environ. Sci. Policy 2017, 71, 9–18. [Google Scholar] [CrossRef]
  21. Martinez, P.; Blanco, M.; Castro-Campos, B. The Water–Energy–Food Nexus: A Fuzzy-Cognitive Mapping Approach to Support Nexus-Compliant Policies in Andalusia (Spain). Water 2018, 10, 664. [Google Scholar] [CrossRef]
  22. Tanasijevic, L.; Todorovic, M.; Pereira, L.S.; Pizzigalli, C.; Lionello, P. Impacts of climate change on olive crop evapotranspiration and irrigation requirements in the Mediterranean region. Agric. Water Manag. 2014, 144, 54–68. [Google Scholar] [CrossRef]
  23. Saadi, S.; Todorovic, M.; Tanasijevic, L.; Pereira, L.S.; Pizzigalli, C.; Lionello, P. Climate change and Mediterranean agriculture: Impacts on winter wheat and tomato crop evapotranspiration, irrigation requirements and yield. Agric. Water Manag. 2015, 147, 103–115. [Google Scholar] [CrossRef]
  24. Zhao, G.; Webber, H.; Hoffmann, H.; Wolf, J.; Siebert, S.; Ewert, F. The implication of irrigation in climate change impact assessment: A European-wide study. Glob. Chang. Biol. 2015, 21, 4031–4048. [Google Scholar] [CrossRef]
  25. CEDEX. Evaluación del impacto del cambio climático en los recursos hídricos y sequías en España; Centro de Estudios y Experimentación en Obras Públicas; Ministerio de Fomento, Gobierno de España: Madrid, España, 2017.
  26. Garrote, L.; Iglesias, A.; Granados, A. Country-level assessment of future risk of water scarcity in Europe. Proc. Int. Assoc. Hydrol. Sci. 2018, 379, 455–462. [Google Scholar] [CrossRef] [Green Version]
  27. Betts, R.A.; Alfieri, L.; Bradshaw, C.; Caesar, J.; Feyen, L.; Friedlingstein, P.; Gohar, L.; Koutroulis, A.; Lewis, K.; Morfopoulos, C.; et al. Changes in climate extremes, fresh water availability and vulnerability to food insecurity projected at 1.5 degrees C and 2 degrees C global warming with a higher-resolution global climate model. Philos. Trans. Ser. A Math. Phys. Eng. Sci. 2018, 376. [Google Scholar] [CrossRef]
  28. Bisselink, B.; Bernhard, J.; Gelati, E.; Adamovic, M.; Guenther, S.; Mentaschi, L.; De Roo, A. Impact of a Changing Climate, Land Use, and Water Usage on Europe’s Water Resources, EUR 29130 EN; Publications Office of the European Union: Luxembourg, 2018. [Google Scholar] [CrossRef]
  29. Garrote, L.; Iglesias, A.; Granados, A.; Mediero, L.; Martin-Carrasco, F. Quantitative assessment of climate change vulnerability of irrigation demands in Mediterranean Europe. Water Res. Manag. 2015, 29, 325–338. [Google Scholar] [CrossRef]
  30. Corominas, J. Análisis de las modernizaciones de regadíos en Andalucía; Consejería de Agricultura y Pesca, Junta de Andalucía: Sevilla, Spain, 2011.
  31. Norton, J. An introduction to sensitivity assessment of simulation models. Environ. Model. Softw. 2015, 69, 166–174. [Google Scholar] [CrossRef]
  32. Saltelli, A.; Annoni, P. How to avoid a perfunctory sensitivity analysis. Environ. Model. Softw. 2010, 25, 1508–1517. [Google Scholar] [CrossRef]
  33. Saltelli, A.; Aleksankina, K.; Becker, W.; Fennell, P.; Ferretti, F.; Holst, N.; Li, S.; Wu, Q. Why so many published sensitivity analyses are false: A systematic review of sensitivity analysis practices. Environ. Model. Softw. 2019, 114, 29–39. [Google Scholar] [CrossRef]
  34. Iooss, B.; Lemaître, P. A review on global sensitivity analysis methods. In Uncertainty Management in Simulation-Optimization of Complex Systems; Springer: Boston, MA, USA, 2015. [Google Scholar]
  35. Saltelli, A.; Ratto, M.; Andres, T.; Campolongo, F.; Cariboni, J.; Gatelli, D.; Saisana, M.; Tarantola, S. Global Sensitivity Analysis: The Primer; John Wiley & Sons: Hoboken, NJ, USA, 2008. [Google Scholar]
  36. Borgonovo, E. Sensitivity analysis with finite changes: An application to modified EOQ models. Eur. J. Oper. Res. 2010, 200, 127–138. [Google Scholar] [CrossRef]
  37. Eschenbach, T.G. Spiderplots versus Tornado Diagrams for Sensitivity Analysis. Interfaces 2010, 22, 40–46. [Google Scholar] [CrossRef]
  38. Marangoni, G.; Tavoni, M.; Bosetti, V.; Borgonovo, E.; Capros, P.; Fricko, O.; Gernaat, D.E.H.J.; Guivarch, C.; Havlik, P.; Huppmann, D.; et al. Sensitivity of projected long-term CO2 emissions across the Shared Socioeconomic Pathways. Nat. Clim. Chang. 2017, 7, 113. [Google Scholar] [CrossRef]
  39. Borgonovo, E.; Smith, C.L. A study of interactions in the risk assessment of complex engineering systems: An application to space PSA. Oper. Res. 2011, 59, 1461–1476. [Google Scholar] [CrossRef]
  40. Borgonovo, E.; Peccati, L. Managerial insights from service industry models: A new scenario decomposition method. Ann. Oper. Res. 2011, 185, 161–179. [Google Scholar] [CrossRef]
  41. Junta de Andalucía. Informe Económico 2017; Consejería de Economía y Conocimiento, Junta de Andalucía: Seville, Spain, 2018. (In Spanish) [Google Scholar]
  42. Massot, A. Research for Agri-Comitee–Agriculture in Andalusia; European Parliament, Directorate General for Internal Policies: Brussels, Belgium, 2016. [Google Scholar] [CrossRef]
  43. Junta de Andalucía. Informe de Medio Ambiente de Andalucía 2017; Consejería de Medio Ambiente y Ordenación del Territorio, Junta de Andalucía: Seville, Spain, 2018. (In Spanish) [Google Scholar]
  44. Berbel, J.; Pedraza, V.; Giannoccaro, G. The trajectory towards basin closure of a European river: Guadalquivir. Int. J. River Basin Manag. 2013, 11, 111–119. [Google Scholar] [CrossRef]
  45. Peña-Gallardo, M.; Gámiz-Fortís, S.R.; Castro-Diez, Y.; Esteban-Parra, M.J. Comparative analysis of drought indices in Andalusia during the period 1901–2012. Cuadernos de Investigacion Geográfica 2016, 42, 67–88. [Google Scholar] [CrossRef]
  46. MAPA. Plan Nacional de Regadíos Horizonte 2008; Ministerio de Agricultura, Pesca y Alimentación, Gobierno de España: Madrid, España, 2001. (In Spanish)
  47. Junta de Andalucía. Agenda Del Regadío Andaluz H-2015; Consejería De Agricultura, Pesca y Alimentación, Junta De Andalucía: Seville, Spain, 2011. (In Spanish) [Google Scholar]
  48. Berbel, J.; Expósito, A.; Gutiérrez-Martín, C.; Mateos, L. Effects of the Irrigation Modernization in Spain 2002–2015. Water Resour. Manag. 2019, 33, 1–15. [Google Scholar] [CrossRef]
  49. Fernández García, I.; Rodriguez Díaz, J.; Camacho Poyato, E.; Montesinos, P.; Berbel, J. Effects of modernization and medium term perspectives on water and energy use in irrigation districts. Agric. Syst. 2014, 131, 56–63. [Google Scholar] [CrossRef]
  50. García-Vila, M.; Lorite, I.J.; Soriano, M.A.; Fereres, E. Management trends and responses to water scarcity in an irrigation scheme of Southern Spain. Agric. Water Manag. 2008, 95, 458–468. [Google Scholar] [CrossRef]
  51. Lopez-Gunn, E.; Zorrilla, P.; Prieto, F.; Llamas, M.R. Lost in translation? Water efficiency in Spanish agriculture. Agric. Water Manag. 2012, 108, 83–95. [Google Scholar] [CrossRef]
  52. EC. Report from the Commission to the European Parliament and the Council on the Implementation of the Water Framework Directive (2000/60/EC) and the Floods Directive (2007/60/EC), Second River Basin Management Plans, First Flood Risk Management Plans; European Commission: Brussels, Belgium, 2019. [Google Scholar]
  53. Corominas, J. Agua y energía en el riego en la época de la sostenibilidad. Ingeniería del Agua 2010, 17, 219–233. [Google Scholar] [CrossRef]
  54. Rodríguez-Díaz, J.A.; Pérez-Urrestarazu, L.; Camacho-Poyato, E.; Montesino, P. The paradox of irrigation scheme modernization: More efficient water use linked to higher energy demand. Span. J. Agric. Res. 2011, 9, 1000–1008. [Google Scholar] [CrossRef]
  55. Britz, W.; Witzke, H.P. CAPRI Model Documentation, 2014. University of Bonn, 2014. Available online: http://www.capri-model.org/docs/capri_documentation.pdf (accessed on 10 May 2019).
  56. Shrestha, S.; Ciaian, P.; Himics, M.; Van Doorslaer, B. Impacts of Climate Change on EU Agriculture. Rev. Agric. Appl. Econ. 2013, 16, 24–39. [Google Scholar] [CrossRef]
  57. IPCC. Climate Change 2013: The Physical Science Basis. Contribution of Working Group I to the Fifth Assessment Report of the Intergovernmental Panel on Climate Change; Stocker, T.F.D., Qin, G.K., Plattner, M., Tignor, S.K., Allen, J., Boschung, A., Nauels, Y., Xia, V., Bex, V., Midgley, P.M., Eds.; Cambridge University Press: Cambridge, UK; New York, NY, USA, 2013; p. 1535. [Google Scholar]
  58. Brouwer, C.; Prins, K.; Heibloem, M. Irrigation water management: Irrigation scheduling. Train. Man. 1989, 4, 66. [Google Scholar]
  59. EC. EU Agricultural Outlook for the Agricultural Markets and Income 2017–2030; European Commission, DG Agriculture and Rural Development: Brussels, Belgium, 2017. [Google Scholar]
  60. Van Meijl, H.; Havlik, P.; Lotze-Campen, H.; Stehfest, E.; Witzke, P.; Domínguez, I.P.; Bodirsky, B.L.; van Dijk, M.; Doelman, J.; Fellmann, T.; et al. Comparing impacts of climate change and mitigation on global agriculture by 2050. Environ. Res. Lett. 2018, 13, 064021. [Google Scholar] [CrossRef] [Green Version]
  61. Jones, J.W.; Hoogenboom, G.; Porter, C.H.; Boote, K.J.; Batchelor, W.D.; Hunt, L.A.; Wilkens, P.W.; Singh, U.; Gijsman, A.J.; Ritchie, J.T. The DSSAT cropping system model. Eur. J. Agron. 2003, 18, 235–265. [Google Scholar] [CrossRef]
  62. Elliott, J.; Deryng, D.; Müller, C.; Frieler, K.; Konzmann, M.; Gerten, D.; Glotter, M.; Flörke, M.; Wada, Y.; Best, N.; et al. Constraints and potentials of future irrigation water availability on agricultural production under climate change. Proc. Natl. Acad. Sci. USA 2014, 111, 3239–3244. [Google Scholar] [CrossRef] [PubMed]
  63. OECD. Water and Climate Change Adaptation: Policies to Navigate Uncharted Waters, OECD Studies on Water; OECD Publishing: Paris, France, 2013. [Google Scholar]
  64. Roudier, P.; Andersson, J.C.; Donnelly, C.; Feyen, L.; Greuell, W.; Ludwig, F. Projections of future floods and hydrological droughts in Europe under a+ 2 C global warming. Clim. Chang. 2016, 135, 341–355. [Google Scholar] [CrossRef]
  65. Donnelly, C.; Greuell, W.; Andersson, J.; Gerten, D.; Pisacane, G.; Roudier, P.; Ludwig, F. Impacts of climate change on European hydrology at 1.5, 2 and 3 degrees mean global warming above preindustrial level. Clim. Chang. 2017, 143, 13–26. [Google Scholar] [CrossRef] [Green Version]
  66. Seckler, D.; Molden, D.; Sakthivadivel, R. The concept of efficiency in water resources management and policy. In Water Productivity in Agriculture: Limits and Opportunities for Improvement; Kijne, J.W., Barker, R., Molden, D., Eds.; International Water Management Institute (IWMI): Colombo, Sri Lanka, 2003; pp. 37–51. [Google Scholar]
  67. Perry, C. Efficient irrigation; inefficient communication; flawed recommendations. Irrig. Drain. 2007, 56, 367–378. [Google Scholar] [CrossRef]
  68. EC. A Blueprint to Safeguard Europe’s Water Resources; European Commission: Brussels, Belgium, 2012. [Google Scholar]
  69. Morillo, J.G.; Martín, M.; Camacho, E.; Díaz, J.R.; Montesinos, P. Toward precision irrigation for intensive strawberry cultivation. Agric. Water Manag. 2015, 151, 43–51. [Google Scholar] [CrossRef]
  70. González Perea, R.; García, I.F.; Arroyo, M.M.; Díaz, J.R.; Poyato, E.C.; Montesinos, P. Multiplatform application for precision irrigation scheduling in strawberries. Agric. Water Manag. 2017, 183, 194–201. [Google Scholar] [CrossRef]
  71. Intrigliolo, D.S.; Alarcón, J. El riego de precisión. El nuevo desafío de los regadíos modernizados. In Efectos de la Modernización de Regadío en España; Berbel, J., Gutiérrez-Martin, C., Eds.; Cajamar Caja Rural: Almería, Spain, 2017; pp. 273–308. (In Spanish) [Google Scholar]
  72. Fischer, G.; Tubiello, F.N.; Van Velthuizen, H.; Wiberg, D.A. Climate change impacts on irrigation water requirements: Effects of mitigation, 1990–2080. Technol. Forecast. Soc. Chang. 2007, 74, 1083–1107. [Google Scholar] [CrossRef]
  73. Schmitz, C.; Lotze-Campen, H.; Gerten, D.; Dietrich, J.P.; Bodirsky, B.; Biewald, A.; Popp, A. Blue water scarcity and the economic impacts of future agricultural trade and demand. Water Resour. Res. 2013, 49, 3601–3617. [Google Scholar] [CrossRef]
  74. Wada, Y.; Flörke, M.; Hanasaki, N.; Eisner, S.; Fischer, G.; Tramberend, S.; Satoh, Y.; van Vliet, M.T.H.; Yillia, P.; Ringler, C.; et al. Modeling global water use for the 21st century: Water Futures and Solutions (WFaS) initiative and its approaches. Geosci. Model. Dev. 2016, 9, 175–222. [Google Scholar] [CrossRef]
  75. Tramberend, S.; Wiberg, D.; Wada, Y.; Flörke, M.; Fischer, G.; Satoh, Y.; Yillia, P.; van Vliet, M.; Hizsnyik, E.; Nava, L.F.; Blokker, M.; Hanasaki, N. Building Global Water Use Scenarios. Interim Report IR-15-014; International Institute for Applied Systems Analysis: Laxenburg, Austria, 2015. [Google Scholar]
  76. Hanasaki, N.; Fujimori, S.; Yamamoto, T.; Yoshikawa, S.; Masaki, Y.; Hijioka, Y.; Kainuma, M.; Kanamori, Y.; Masui, T.; Takahashi, K.; et al. A global water scarcity assessment under Shared Socio-economic Pathways–Part 1: Water use. Hydrol. Earth Syst. Sci. 2013, 17, 2375–2391. [Google Scholar] [CrossRef]
  77. Bijl, D.L.; Biemans, H.; Bogaart, P.W.; Dekker, S.C.; Doelman, J.C.; Stehfest, E.; van Vuuren, D.P. A global analysis of future water deficit based on different allocation mechanisms. Water Resour. Res. 2018, 54, 5803–5824. [Google Scholar] [CrossRef]
  78. Doelman, J.C.; Stehfest, E.; Tabeau, A.; van Meijl, H.; Lassaletta, L.; Gernaat, D.E.; Hermans, K.; Harmsen, M.; Daioglou, V.; et al. Exploring SSP land-use dynamics using the IMAGE model: Regional and gridded scenarios of land-use change and land-based climate change mitigation. Glob. Environ. Chang. 2018, 48, 119–135. [Google Scholar] [CrossRef] [Green Version]
  79. Calatrava, J.; García-Valiñas, M.; Garrido, A.; González-Gómez, F. Water pricing in Spain: Following the footsteps of somber climate change projections. In Water Pricing Experiences and Innovations; Springer: Cham, Germany, 2015; pp. 313–340. [Google Scholar]
  80. Rodríguez-Díaz, J.A.; Camacho-Poyato, E.; Blanco-Pérez, M. Evaluation of water and energy use in pressurized irrigation networks in Southern Spain. J. Irrig. Drain. Eng. 2011, 137, 644–650. [Google Scholar] [CrossRef]
  81. Berbel, J.; Schellekens, J.; Expósito, A.; Borrego, M.; & Montilla-Lopez, N. Review of Alternative Water Allocation Options. Deliverable to Task A4B of the BLUE2 Project. Study on EU Integrated Policy Assessment for the Freshwater and Marine Environment, on the Economic Benefits of EU Water Policy and on the Costs of Its Non-Implementation. Report to Directorate General for the Environment of the European Commission; European Commission: Brussels, Belgium, 2018. [Google Scholar]
  82. Esteve, P.; Varela-Ortega, C.; Blanco-Gutiérrez, I.; Downing, T.E. A hydro-economic model for the assessment of climate change impacts and adaptation in irrigated agriculture. Ecol. Econ. 2015, 120, 49–58. [Google Scholar] [CrossRef] [Green Version]
  83. Expósito, A.; Berbel, J. Why is water pricing ineffective for deficit irrigation schemes? A case study in southern Spain. Water Resour. Manag. 2017, 31, 1047–1059. [Google Scholar] [CrossRef]
  84. Gutierrez-Martin, C.; Gomez, C.G. Assessing irrigation efficiency improvements by using a preference revelation model. Span. J. Agric. Res. 2011, 9, 1009–1020. [Google Scholar] [CrossRef] [Green Version]
  85. Pérez-Blanco, C.D.; Delacámara, G.; Gómez, C.M. Water charging and water saving in agriculture. Insights from a Revealed Preference Model in a Mediterranean basin. Environ. Model. Softw. 2015, 69, 90–100. [Google Scholar] [CrossRef]
  86. Fernández García, I.; Montesinos, P.; Poyato, E.C.; Díaz, J.R. Energy cost optimization in pressurized irrigation networks. Irrig. Sci. 2016, 34, 1–13. [Google Scholar] [CrossRef]
  87. Rocamora, C.; Vera, J.; Abadía, R. Strategy for efficient energy management to solve energy problems in modernized irrigation: Analysis of the Spanish case. Irrig. Sci. 2013, 31, 1139–1158. [Google Scholar] [CrossRef]
  88. Tarjuelo, J.M.; Rodriguez-Diaz, J.A.; Abadía, R.; Camacho, E.; Rocamora, C.; Moreno, M.A. Efficient water and energy use in irrigation modernization: Lessons from Spanish case studies. Agric. Water Manag. 2015, 162, 67–77. [Google Scholar] [CrossRef]
  89. Carrillo-Cobo, M.T.; Camacho-Poyato, E.; Montesinos, P.; Díaz, J.A.R. Assessing the potential of solar energy in pressurized irrigation networks. The case of Bembézar MI irrigation district (Spain). Span. J. Agric. Res. 2014, 12, 838–849. [Google Scholar] [CrossRef]
  90. Perry, C.; Steduto, P.; Allen, R.G.; Burt, C.M. Increasing productivity in irrigated agriculture: Agronomic constraints and hydrological realities. Agric. Water Manag. 2009, 96, 1517–1524. [Google Scholar] [CrossRef] [Green Version]
  91. Gómez Gómez, C.M.; Pérez-Blanco, C.D.; Adamson, D.; Loch, A. Managing water scarcity at a river basin scale with economic instruments. Water Econ. Policy 2018, 4, 1750004. [Google Scholar] [CrossRef]
  92. Fader, M.; Shi, S.; Bloh, W.V.; Bondeau, A.; Cramer, W. Mediterranean irrigation under climate change: More efficient irrigation needed to compensate for increases in irrigation water requirements. Hydrol. Earth Syst. Sci. 2016, 20, 953–973. [Google Scholar] [CrossRef]
  93. Perry, C.; Steduto, P.; Karajeh, F. Does Improved Irrigation Technology Save Water? Food and Agriculture Organization: Rome, Italy, 2017. [Google Scholar]
  94. Berbel, J.; Gutiérrez-Martín, C.; Rodríguez-Díaz, J.A.; Camacho, E.; Montesinos, P. Literature review on rebound effect of water saving measures and analysis of a Spanish case study. Water Resour. Manag. 2015, 29, 663–678. [Google Scholar] [CrossRef]
  95. Alarcón, J.; Garrido, A.; Juana, L. Modernization of irrigation systems in Spain: Review and analysis for decision making. Int. J. Water Resour. Dev. 2016, 32, 442–458. [Google Scholar] [CrossRef]
  96. Grafton, R.Q.; Williams, J.; Perry, C.J.; Molle, F.; Ringler, C.; Steduto, P.; Udall, B.; Wheeler, S.A.; Wang, Y.; Garrick, D.; et al. The paradox of irrigation efficiency. Science 2018, 361, 748–750. [Google Scholar] [CrossRef] [Green Version]
  97. Blanco, M.; Viladrich-Grau, M. La creación de un centro de intercambio de derechos de agua en la Cuenca del Segre y la contribución de los flujos de retorno. Inf. Tec. Econ. Agrar. 2014, 4, 374–399. [Google Scholar] [CrossRef]
  98. Foster, S.S.D.; Perry, C.J. Improving groundwater resource accounting in irrigated areas: A prerequisite for promoting sustainable use. Hydrogeol. J. 2010, 18, 291–294. [Google Scholar] [CrossRef]
  99. Jiménez-Martínez, J.; Candela, L.; Molinero, J.; Tamoh, K. Groundwater recharge in irrigated semi-arid areas: Quantitative hydrological modelling and sensitivity analysis. Hydrogeol. J. 2010, 18, 1811–1824. [Google Scholar] [CrossRef]
Figure 1. Location and types of land use in Andalusia.
Water 11 01854 g001
Figure 2. Sensitivity of irrigated agricultural land (total, cereals, citrus fruits) to scenario drivers when shifting from the reference to the worst-case scenario (left) and to the best-case scenario (right). The total change in irrigated land is decomposed into changes due to total, individual and interaction effects of each driver. The results are presented as % change from the reference scenario.
Water 11 01854 g002
Figure 3. Sensitivity of irrigation water use (total, cereals and citrus fruits) to scenario drivers when shifting from the reference to the worst-case scenario (left) and to the best-case scenario (right). The total change in irrigation water use is decomposed into changes due to total, individual and interaction effects of each driver. The results are presented as % change from the reference scenario.
Water 11 01854 g003
Figure 4. Sensitivity of income (total, cereals and citrus fruits) to scenario drivers when shifting from the reference to the worst-case scenario (left) and to the best-case scenario (right). The total change in income is decomposed into changes due to total, individual and interaction effects of each driver. The results are presented as % change from reference scenario.
Water 11 01854 g004
Table 1. Scenario framework.
DriverReference Scenario (X0)Worst-Case Scenario (X1)Best-Case Scenario (X2)
Water availability for agricultureAverage reduction of 10% in 2050 on CEDEX (2017)Reduction of 20% in 2050 Reduction of 2% in 2050
Irrigation efficiencyIncrease of 0.05% y−1 up to 2050 according to OECD (2013)No change in irrigation efficiencyIncrease of 0.10% y−1 up to 2050
Irrigation costIncrease of EUR 0.01 per m3 in 2050.Increase of EUR 0.02 per m3 in 2050.No change in water cost in 2050
Table 2. Results from the reference, worst-case and best-case scenarios for rain-fed land, irrigated land, irrigation water use and income for main crops in Andalusia in 2050. The values are presented in absolute terms for the reference scenario and percentage change from the reference for the worst and best case scenarios. The units are 1000 ha for land, million m3 for water use, and million euro for income.
Simulated Scenarios
Reference (X0)Worst-Case (X1)Best-Case (X2)
Utilized agricultural areaRain−fed land4054.92.3−3.1
Irrigated land849.0−10.414.1
Irrigation water use2938.8−5.58.3
Income7297.93−1.11.2
CerealsRain−fed land467.01.4−10.1
Irrigated land13.0−48.9340.2
Irrigation water use49.3−28.4268.5
Income286.53−0.94.7
OilseedsRain−fed land225.31.4−1.2
Irrigated land26.6−9.88.9
Irrigation water use117.57−6.75.1
Income177.55−1.91.8
VegetablesRain−fed land
Irrigated land59.39−0.10.1
Irrigation water use371.444.1−4.0
Income1707.60−0.10.1
Citrus FruitsRain−fed land30.29.9−9.2
Irrigated land74.6−4.34.0
Irrigation water use535.91−0.60.0
Income412.46−3.33.1
Other fruitsRain−fed land69.930.00.0
Irrigated land14.32−1.00.8
Irrigation water use89.223.2−3.2
Income744.24−0.30.3
Olives for oilRain−fed land1496.15.1−4.7
Irrigated land613.6−12.011.1
Irrigation water use1605.98−9.27.3
Income1646.03−3.22.9

