Morphological Changes of the Lower Tedori River, Japan, over 50 Years


1
Faculty of Water Resources Engineering, Thuyloi University, 175 Tay Son, Dong Da, Hanoi 116705, Vietnam
2
Faculty of Geosciences and Civil Engineering, Kanazawa University, Kakuma-machi, Kanazawa 920-1192, Japan
*
Author to whom correspondence should be addressed.
Water 2019, 11(9), 1852; https://doi.org/10.3390/w11091852
Submission received: 30 July 2019
/
Revised: 2 September 2019
/
Accepted: 3 September 2019
/
Published: 5 September 2019
(This article belongs to the Section Hydrology)
Abstract
:Long-term variation in the morphological characteristics of rivers is complicated as a result of temporally and spatially variable natural processes and anthropogenic disturbances. Better understanding of their relationship is therefore important for river basin management. The present study conducted a detailed analysis of a long-term dataset consisting of a 58-year topographic survey and related data on human impact to clarify the long-term variation in the morphological characteristics of the lower Tedori River in Japan. An empirical model was established through the assessment of spatiotemporal variations in nonlinear rates of adjustment. The results indicated that sediment extraction and dam construction profoundly affected the morphological characteristics of the lower Tedori River and that the vertical adjustment of the river channel experienced five phases. Degradation occurred from 7 to 16 km upstream from the river mouth over all phases. Two aggradation phases following two degradation phases were observed from the river mouth to 2 km upstream. Aggradation and degradation phases appeared alternately from 2 to 7 km. The representative nonlinear rates of vertical adjustment in the second phase were the highest compared with those in the other phases in the entire reach. The correlation analysis revealed that the incision phase was mostly coupled with channel narrowing, while widening followed the deposition phase. It was deduced from aerial photo analysis and a comparison between slope and empirical critical slope that the pattern in the lower Tedori River was braided during the period 1950–2000.
1. Introduction
The long-term variation in the morphological characteristics of rivers is complicated as a result of temporally and spatially variable natural processes and anthropogenic disturbances. Natural processes can progress exceedingly slowly and be practically imperceptible by human standards [1]. In contrast, human activities can have a significant and rapid impact on natural processes and trends, resulting in a compressed time scale for river adjustments [2]. Many researchers have made efforts to equate the morphological responses of rivers to associated driving factors. In order to sustainably manage river systems, it is necessary to further investigate the characteristics of variation in river morphology at various temporal and spatial scales.
In Japan, the morphology of pristine rivers is due to the combination of steep landforms and frequent storms, and changes are often accelerated by the effects of earthquakes and volcanic eruptions [3]. Japanese rivers differ from most continental rivers in the world because they are short, steep, and exhibit very flashy flow regimes [4]. Since around 1960, when Japan entered a period of high economic growth, a substantial amount of sand and gravel has been extracted from rivers to be used as concrete aggregate. Additionally, many dams have been built to control floods, generate electricity, and secure water for various uses. This has seriously affected the morphology of several Japanese rivers. Several previous studies on Japanese rivers clarified the long-term impacts of sand and gravel mining and/or dam construction on riverbed degradation. The correlation between variation in the riverbed elevation, sand and gravel extraction, and dam construction was observed in the lower Tenryu River [5]. Sato et al. [6] indicated that due to the dredging of a sandbar in the early 1970s, the longitudinal profile of the Samegawa River in the region 1 km from the river mouth degraded significantly.
Recently, the Tedori River, located in the mid-northern part of Japan (Figure 1), has been seriously affected by continuous anthropogenic activities such as dredging, sand and gravel mining, and multipurpose construction. These activities have disturbed the previous equilibrium condition of the river. In particular, a significant amount of sediment was moved out due to mining and was trapped in the Tedorigawa Dam. This induced intensive changes in the morphological characteristics between 1950 and 2007. Dang et al. [7,8] conducted a detailed analysis of temporal and spatial trends in the vertical adjustment associated with human activities at the lower Tedori River from 1950 to 2007. However, a mutual relationship among hydromorphological characteristics of the Tedori River has not been fully addressed yet.
This paper aims to quantify variations in several morphological characteristics of the lower Tedori River. First, magnitude and nonlinear rates of vertical adjustment are captured. Then, variations in bankfull width, slope, specific stream energy, and mean sediment diameter are described. Finally, the intercorrelation among morphologic characteristics is discussed. The paper adds novel findings to prior studies dealing with similar Japanese rivers, suggesting an empirical model of riverbed elevation change using an intercorrelated analysis of river morphology characteristics.
2. Study Area
2.1. General Setting
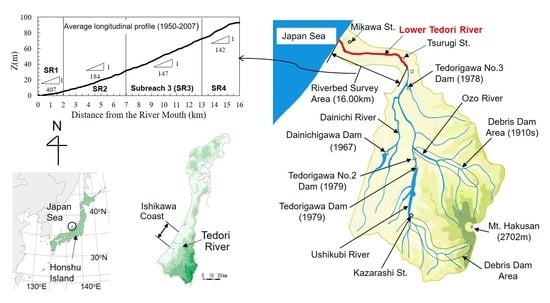
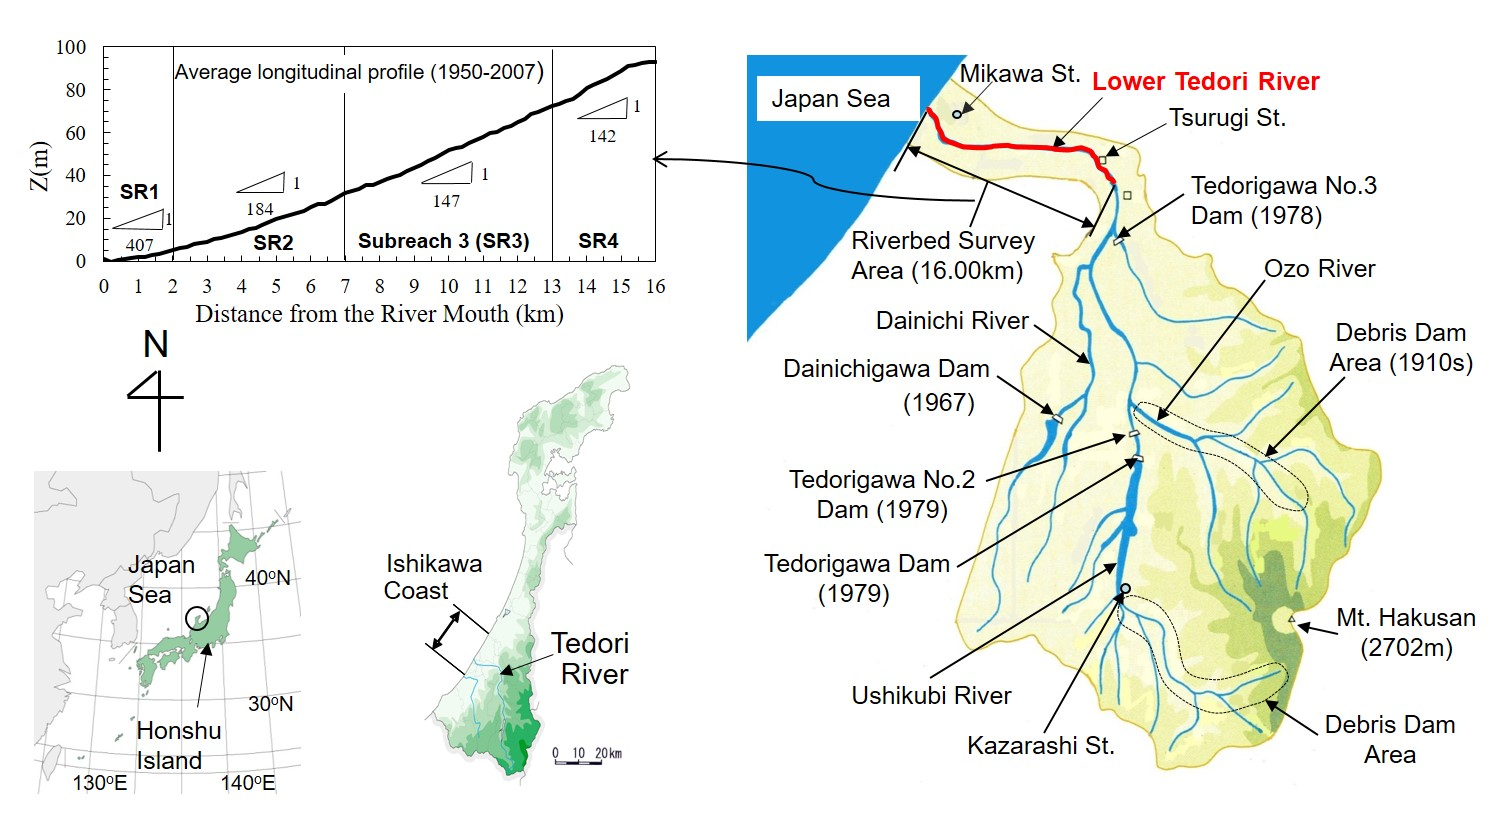
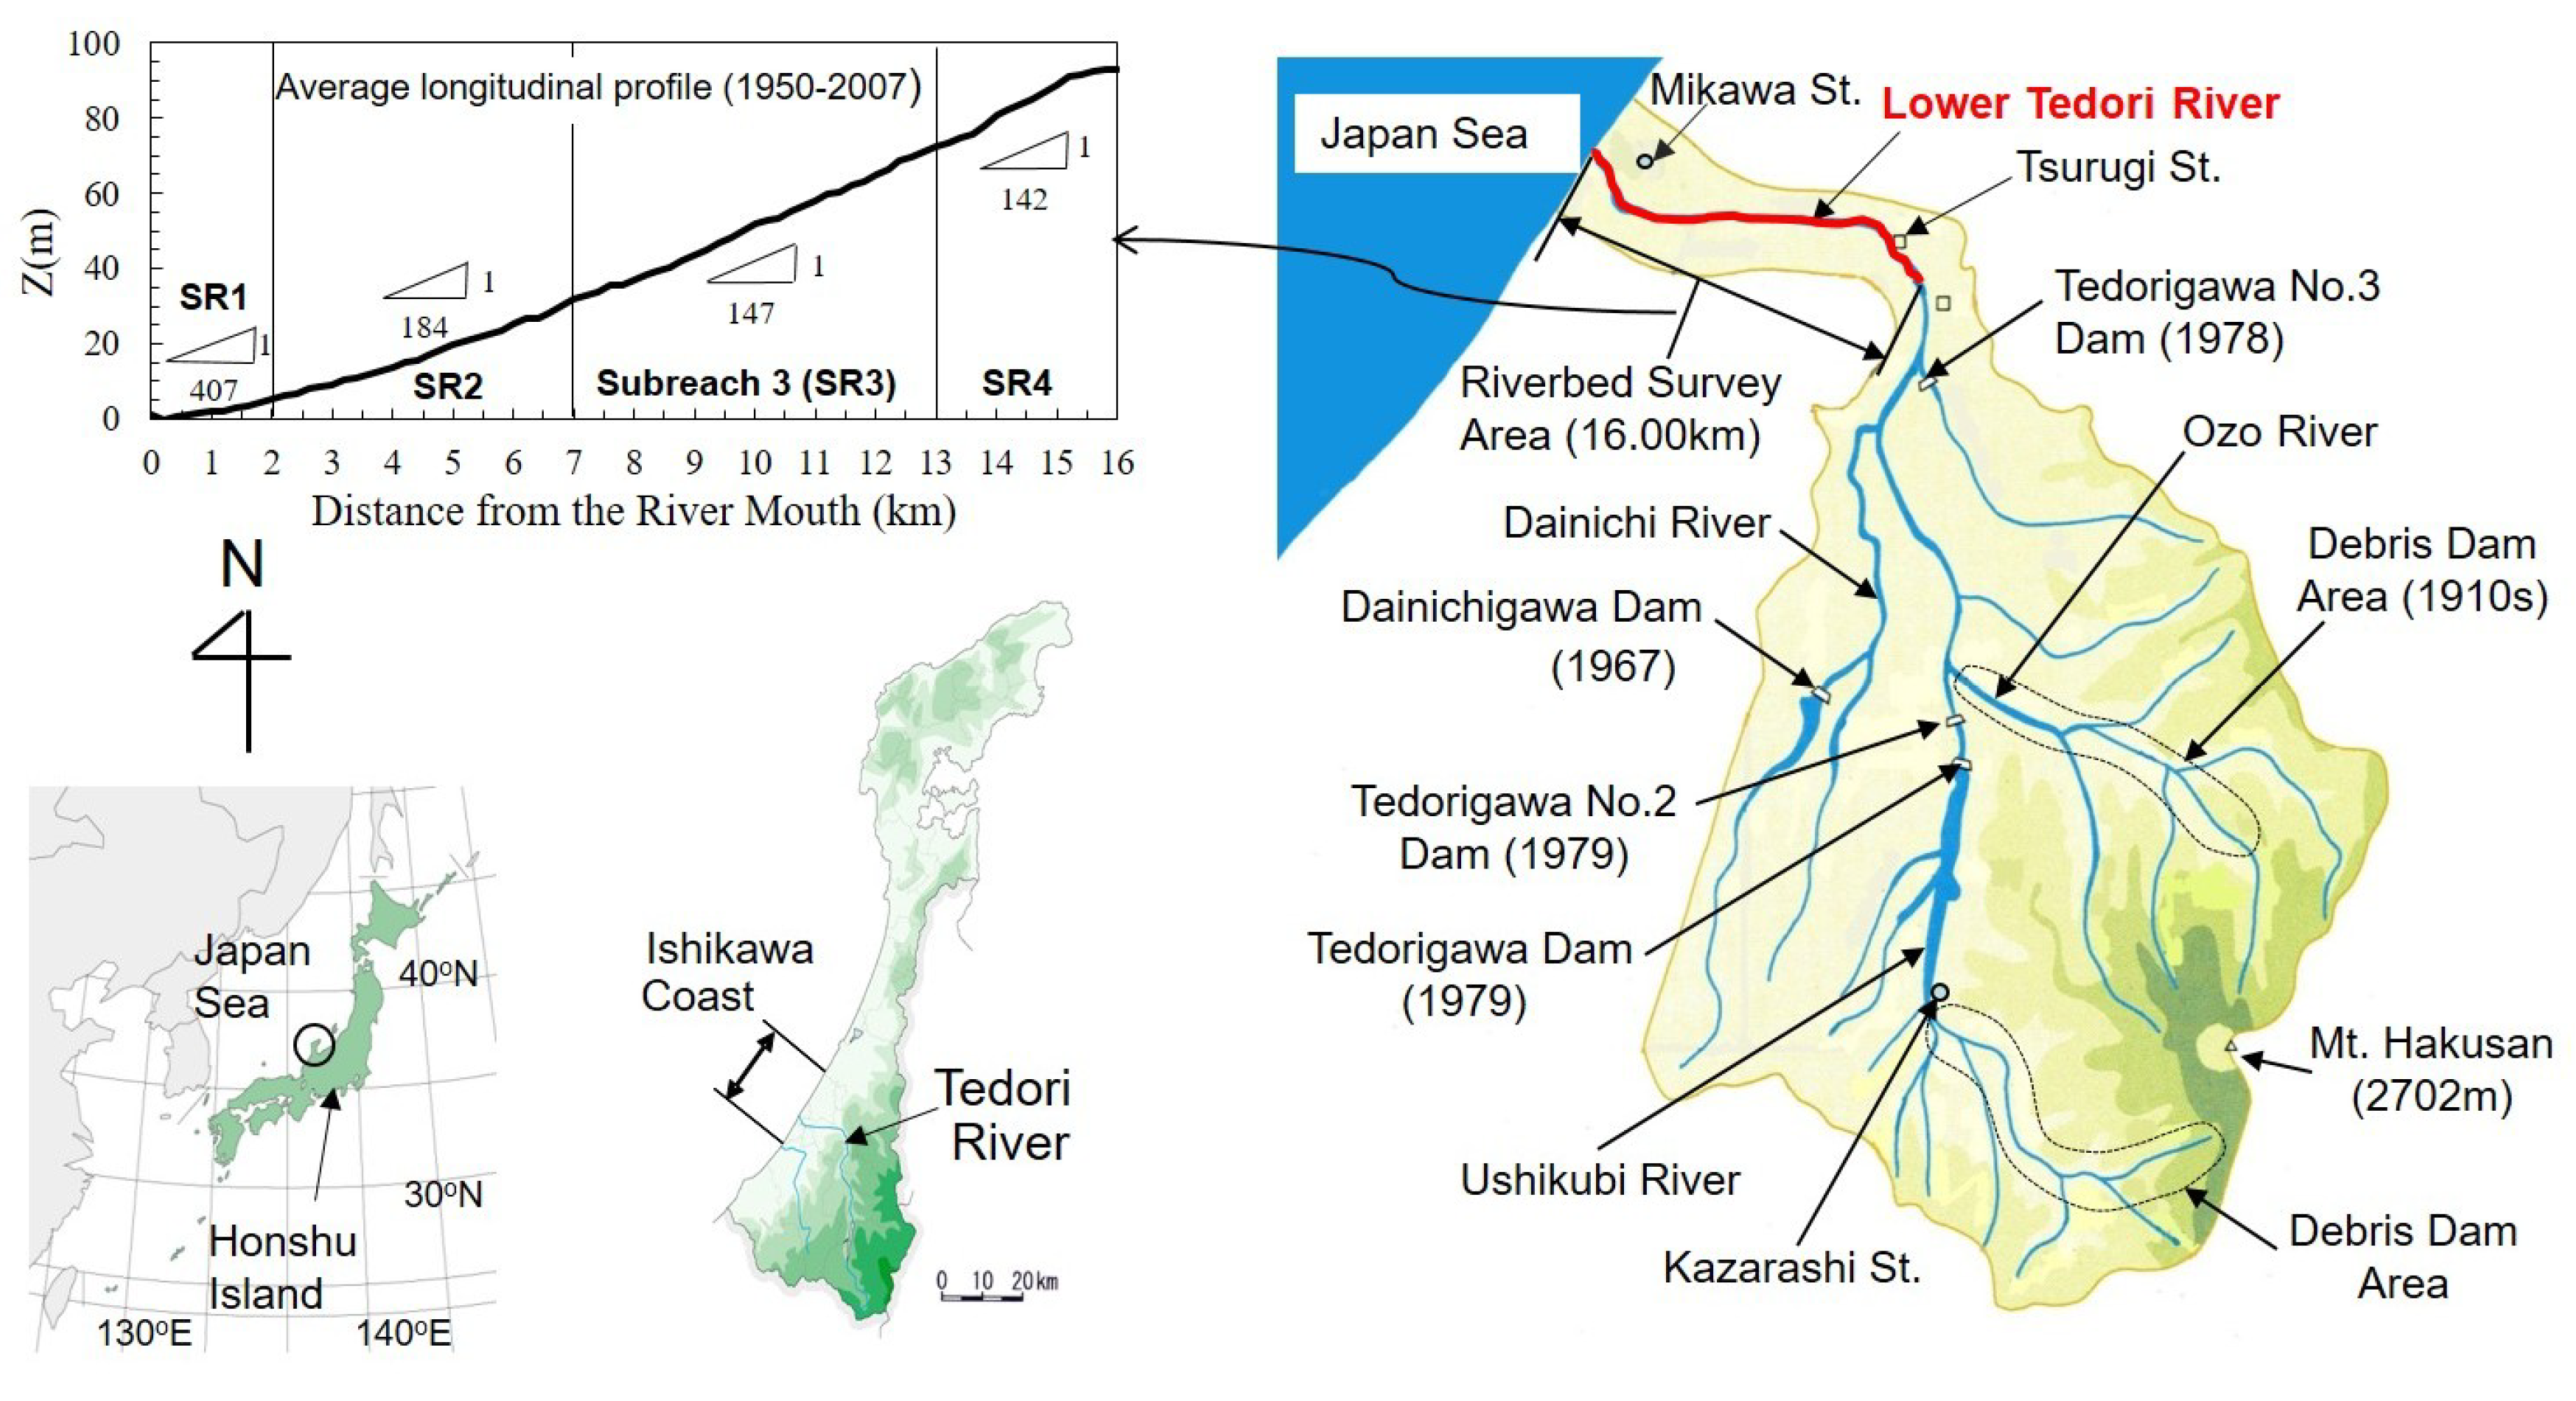
The Tedori River, which originates at Mt. Hakusan, with the highest elevation of 2702 m, has a catchment area of 809 km2 and a channel length of 72 km (Figure 1). The main tributary of the Tedori River is the Ushikubi River, with other tributaries being the Ozo River, the Dainichi River, and other small rivers. The lower Tedori River (LTR) referred to in the remainder of this paper (the reach downstream of the Tedorigawa Dam) is the portion between the river mouth and 16 km upstream. The Tedori River is one of the steepest in Japan, with an average slope of 0.037 and 0.0069 for the entire stretch of the river and the LTR, respectively. The river pattern of the LTR is mainly braided. Based on homogeneity related to slope, width, and the mean diameter of bed material, the LTR can be divided into four subreaches (SRs) located the following distances from the river mouth: SR 1: 0–2 km: SR 2: 2–7 km; SR 3: 7–13 km; and SR 4: 13–16 km [9].
The climate of the catchment area is dominated by monsoon winds blowing in from the Japan Sea. The mean annual rainfall in the Tedori River catchment is about 2600 mm/yr on the plains and 3300–3600 mm/yr in the mountain ranges.
The drainage area is underlaid by various lithologies, including ancient Hida metamorphic rocks and volcanic rocks from eruptions of Mt. Hakusan. Nobi rhyolites (pyroclastic rock) from the Mesozoic to the Cenozoic eras are distributed around the Mt. Hakusan area, while Tedori layers are present in the area east of the Tedorigawa Dam and the Ozo River. Both the Tedori layers and Nobi rhyolites are prone to massive collapse. Therefore, a large amount of gravel- and sand-sized sediment has been flowing into the Tedori River.
2.2. Human Impact on the Tedori River Basin
Recently, several anthropogenic activities have exerted significant influence on the behavior of the LTR to different extents. Such activities, including debris dam construction, dredging, sand and gravel mining, and dam construction have reduced the sediment supply and changed the flow regime of the LTR. Since the 1910s, approximately 150 debris dams have been erected to monitor and control debris production and sediment runoff along the upstream segment of the river in the Hakusan Mountains. Sediment trapped by debris dams amounted to 9.2 × 10⁶ m3 by 1991. To enhance the conveying capacity of the LTR, dredging activity (DA) was performed in the 0–4.8 km subreach from 1949 to 1963. The total volume of dredged sediment was 2.1 × 10⁶ m3.
In the post-World War II period, there was intensive sand and gravel mining (SGM) in the area from the river mouth to 15 km upstream. During the mid-1960s, SGM was at its highest rate, causing substantial degradation of the riverbed. To deal with this problem, a law was passed in the mid-1970s to prevent the overmining of sand and gravel. Mining was then completely prohibited in 1991. The total amount of sand and gravel extracted was 8.9 × 10⁶ m3, computed on the basis of licenses issued by local authorities over the period 1950–1991. In reality, the volume of mined sediment could be greater than the official volume [10].
Moreover, due to Tedorigawa Dam operation (TDO) from 1980 and several other dams in prior years (Figure 1), all the bed load and some of the suspended sediment originating from one of the main tributaries (the Ushikubi River) were trapped. The accumulated sediment retained by the Tedorigawa Dam amounted to 8.2 × 10⁶ m3 by 2005. The aforementioned human activities significantly reduced the bed sediment volume of the downstream Tedori River, consequently inducing a fatal imbalance between supplied and transported sediment in this area. Furthermore, the operation of a number of dams, especially TDO from 1980, has played an important role in altering the flow regime and sediment transporting capacity. Based on flow data measured at the Tsurugi station about 14 km upstream from the river mouth (Figure 1), two separate hydrologic periods were considered, 1928–1979 and 1980–2006. Two series of data indicated that TDO reduced the magnitude and frequency of large floods. The mean annual maximum flood discharge (1144 m3/s; recurrence interval (RI) = 2.5 years) in the post-dam period was 35% less than in the pre-dam period (1755 m3/s; RI = 2.3 years). In this study, these values were taken as reference channel-forming discharges.
3. Materials and Methods
3.1. Data
Datasets were provided by the Hokuriku Regional Development Bureau of the Ministry of Land, Infrastructure, Transport, and Tourism of Japan (HRDB). Thirty-six annual surveys of the riverbed topography (1950–1979, 1991, 1997, 1998, 2002, 2003, and 2007) were collected. Each annual survey consisted of 81 river cross-sections at intervals of 200 m along the 0–16 km reach. The bed elevation was measured relative to the Tokyo Peil (TP), which is the standard ground elevation in Japan based on the mean sea level of Tokyo Bay. Then, volumes of sand and gravel mined from the river channel were gathered from 1951 to 1991 on the basis of annual permissions issued by local governments. The volume of material dredged annually in maintenance activities was obtained for the period 1949–1963 as well. Moreover, the annual maximum river discharge (Qmax) measured at the Tsurugi station was examined from 1928 to 2006. Finally, sequential aerial photographs at a scale of 1:15,000 were obtained for the years 1955, 1968, 1984, 1995, and 2000. In general, the 58-year span of the data surveyed with high resolution provided good data coverage in time and space to capture the main trends of long-term variation in the river morphology and its controlling factors.
3.2. Methods
3.2.1. Vertical Adjustment Rate
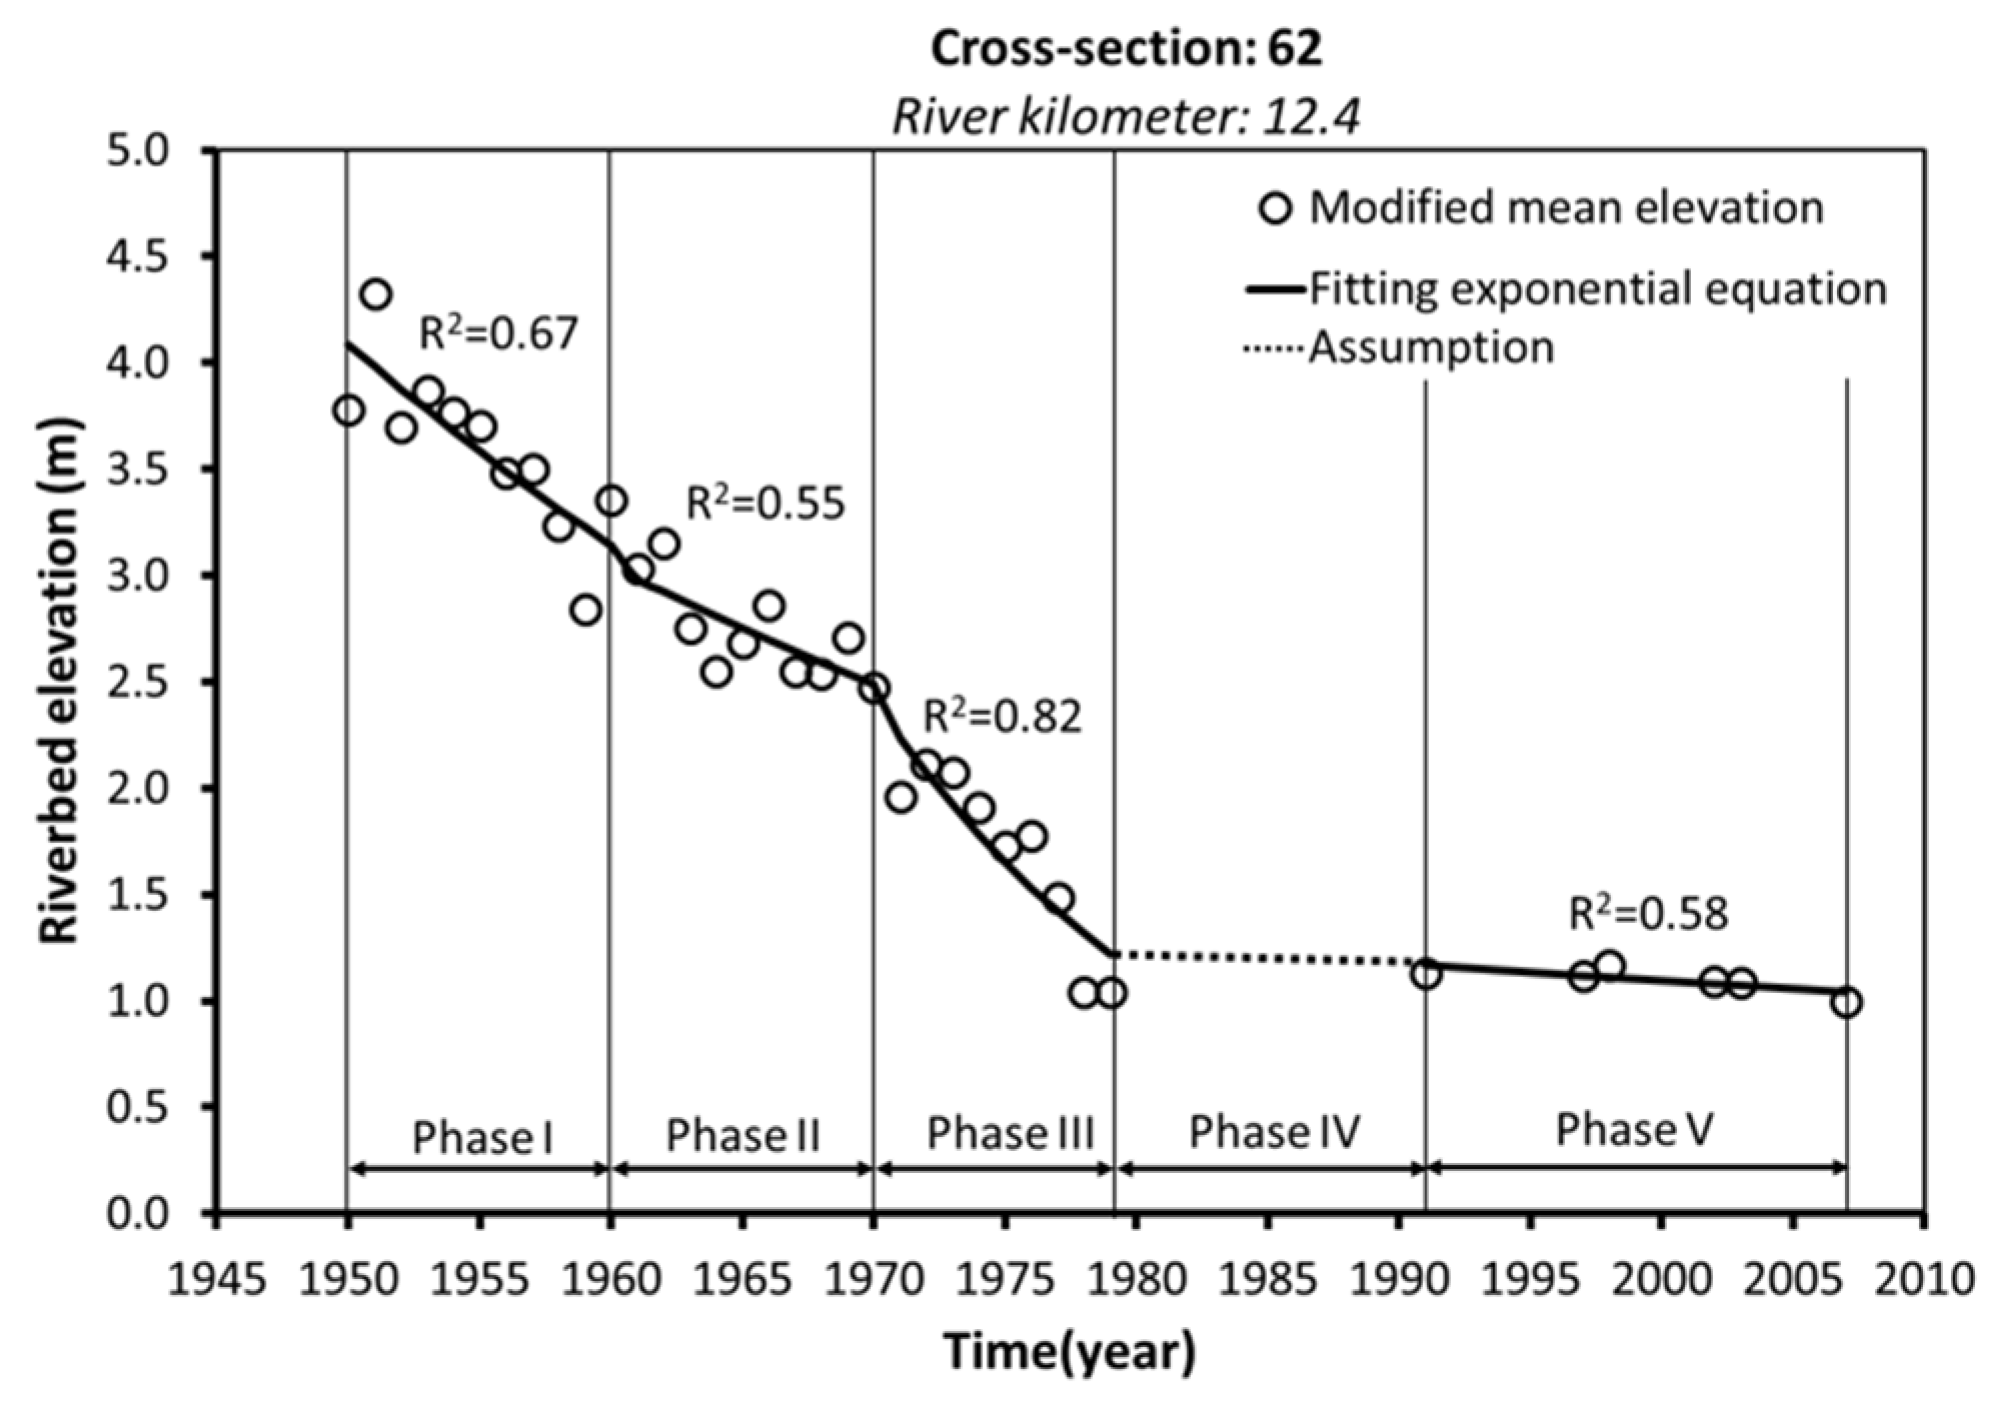
The characteristics of the vertical adjustment of the riverbed are best mathematically expressed by nonlinear decay functions [1]. However, the mathematical form of the function strongly depends on the specific characteristics of the river. Based on the availability of cross-sectional data of the LTR, an empirical model of variation of riverbed elevation was established for two periods, 1950–1979 and 1991–2007. Note that there is a gap between the two periods because of a lack of field data. Through observing several representative cross-sections, we recognized that riverbed elevation experienced five phases of vertical adjustment (Figure 2); the first three phases from 1950–1979, the fourth phase from 1980–1991 (gap period), and the fifth phase from 1991 to 2007. It is known that among various human activities, bed sediment extraction causes instant degradation of the riverbed elevation. During the period 1950–1979, SGM was conducted in the reach of 0–15 km. Therefore, depending on the sediment volume extracted, variation in the riverbed occurred in three phases during 1950–1979. In the fourth phase, variation in the riverbed was dominated by both SGM and TDO. The fifth phase was affected only by TDO.
To clarify temporally and spatially nonlinear variations in riverbed elevation, the nonlinear function should be used to fit the elevation measured over time at a site [1,2]. Temporal adjustment of riverbed elevation at a cross-section of the Tedori River can be described well by exponential functions. The general form is:
where Z(t) is riverbed elevation averaged at a cross-section for a given year, in TP; Zmin is the lowest riverbed elevation during a given period for each cross-section, in TP; a is the coefficient determined by regression analysis, representing riverbed elevation at initial year to = 0 deduced from the regression model, in TP; b is the coefficient determined by regression analysis, expressing the rate of change in riverbed elevation per year: b > 0 for degradation, b < 0 for aggradation; c is the coefficient ensuring that the left side of Equation (1) is always positive, and c was taken as 1 m for this study; and t is the time since the onset of each phase in the adjustment process, in years.
Z(t) − (Zmin − c) = aebt
To eliminate the effect of the longitudinal position of cross-sections on coefficient b, riverbed elevation was extracted by (Zmin − c) before being fitted by the exponential function as shown in Equation (1). Equation (1) was then applied to all cross-sections. Note that transitional years between two successive phases were addressed based on the criterion that goodness of fit with the riverbed was simultaneously attained in both phases. Accordingly, the transitional years between phases I and II varied from 1958 to 1962 and between phases II and III from 1968 to 1973, depending on the location of the cross-section. The vertical adjustment rate (b-value) for phases I, II, III, and V was determined from Equation (1). For phase IV, due to limited data, b-value was calculated by dividing the vertical adjustment by the duration of the fourth phase.
3.2.2. Bankfull Width
To investigate the relationship between horizontal and vertical adjustment of the river channel, temporal changes in bankfull channel width were examined. Bankfull channel width at each cross-section was defined based on the width of the water surface at bankfull discharge. Leopold [11] stated that most investigations have concluded that the recurrence intervals of bankfull discharge ranged from 1.0 to 2.5 years. Here, bankfull discharge was taken to be equal to mean annual maximum flood discharge in the pre-dam period (1755 m3/s; RI = 2.3 years). Bankfull channel width was then estimated based on numerical simulations using the RIC–Nays model [12]. The RIC–Nays model is a two-dimensional process-based numerical model for flow and morphology. Two-dimensional unsteady flow is computed based on the shallow-water equations expressed in a general coordinate system. The morphological computation involves a combination of flow field, sediment transport, and bed level changes.
The hydraulic model established for the LTR was first calibrated and validated against the water marks measured at the historic flood events in 2002 and 2006. The model was then simulated with a bankfull discharge of 1755 m3/s and the riverbed topographies of 1950, 1960, 1970, 1978, 1991, and 2002, and the bankfull channel width of each cross-section was computed for those years.
3.2.3. Total Stream Power and Specific Stream Power
Total stream power (TSP; Wm–1) is defined as the total supply of kinetic power per unit length of the stream. TSP is mostly dissipated in maintaining fluid flow against fluid shear resistance [13]:
TSP = γQS
The specific stream power (SSP; Wm–2) quantifies the potential energy dissipation of a column of fluid over unit bed area:
where γ is the unit weight of water (9800 N/m3); Q is discharge (m3/s), which is the mean annual flood discharge, 1144 m3/s for the post-dam period (1980–2007) and 1755 m3/s for the pre-dam period (1950–1979); S is energy slope (m/m), which is nearly equal to bed slope; and W is the bankfull channel width (m).
4. Results and Discussion
4.1. Vertical Variation in Riverbed Elevation
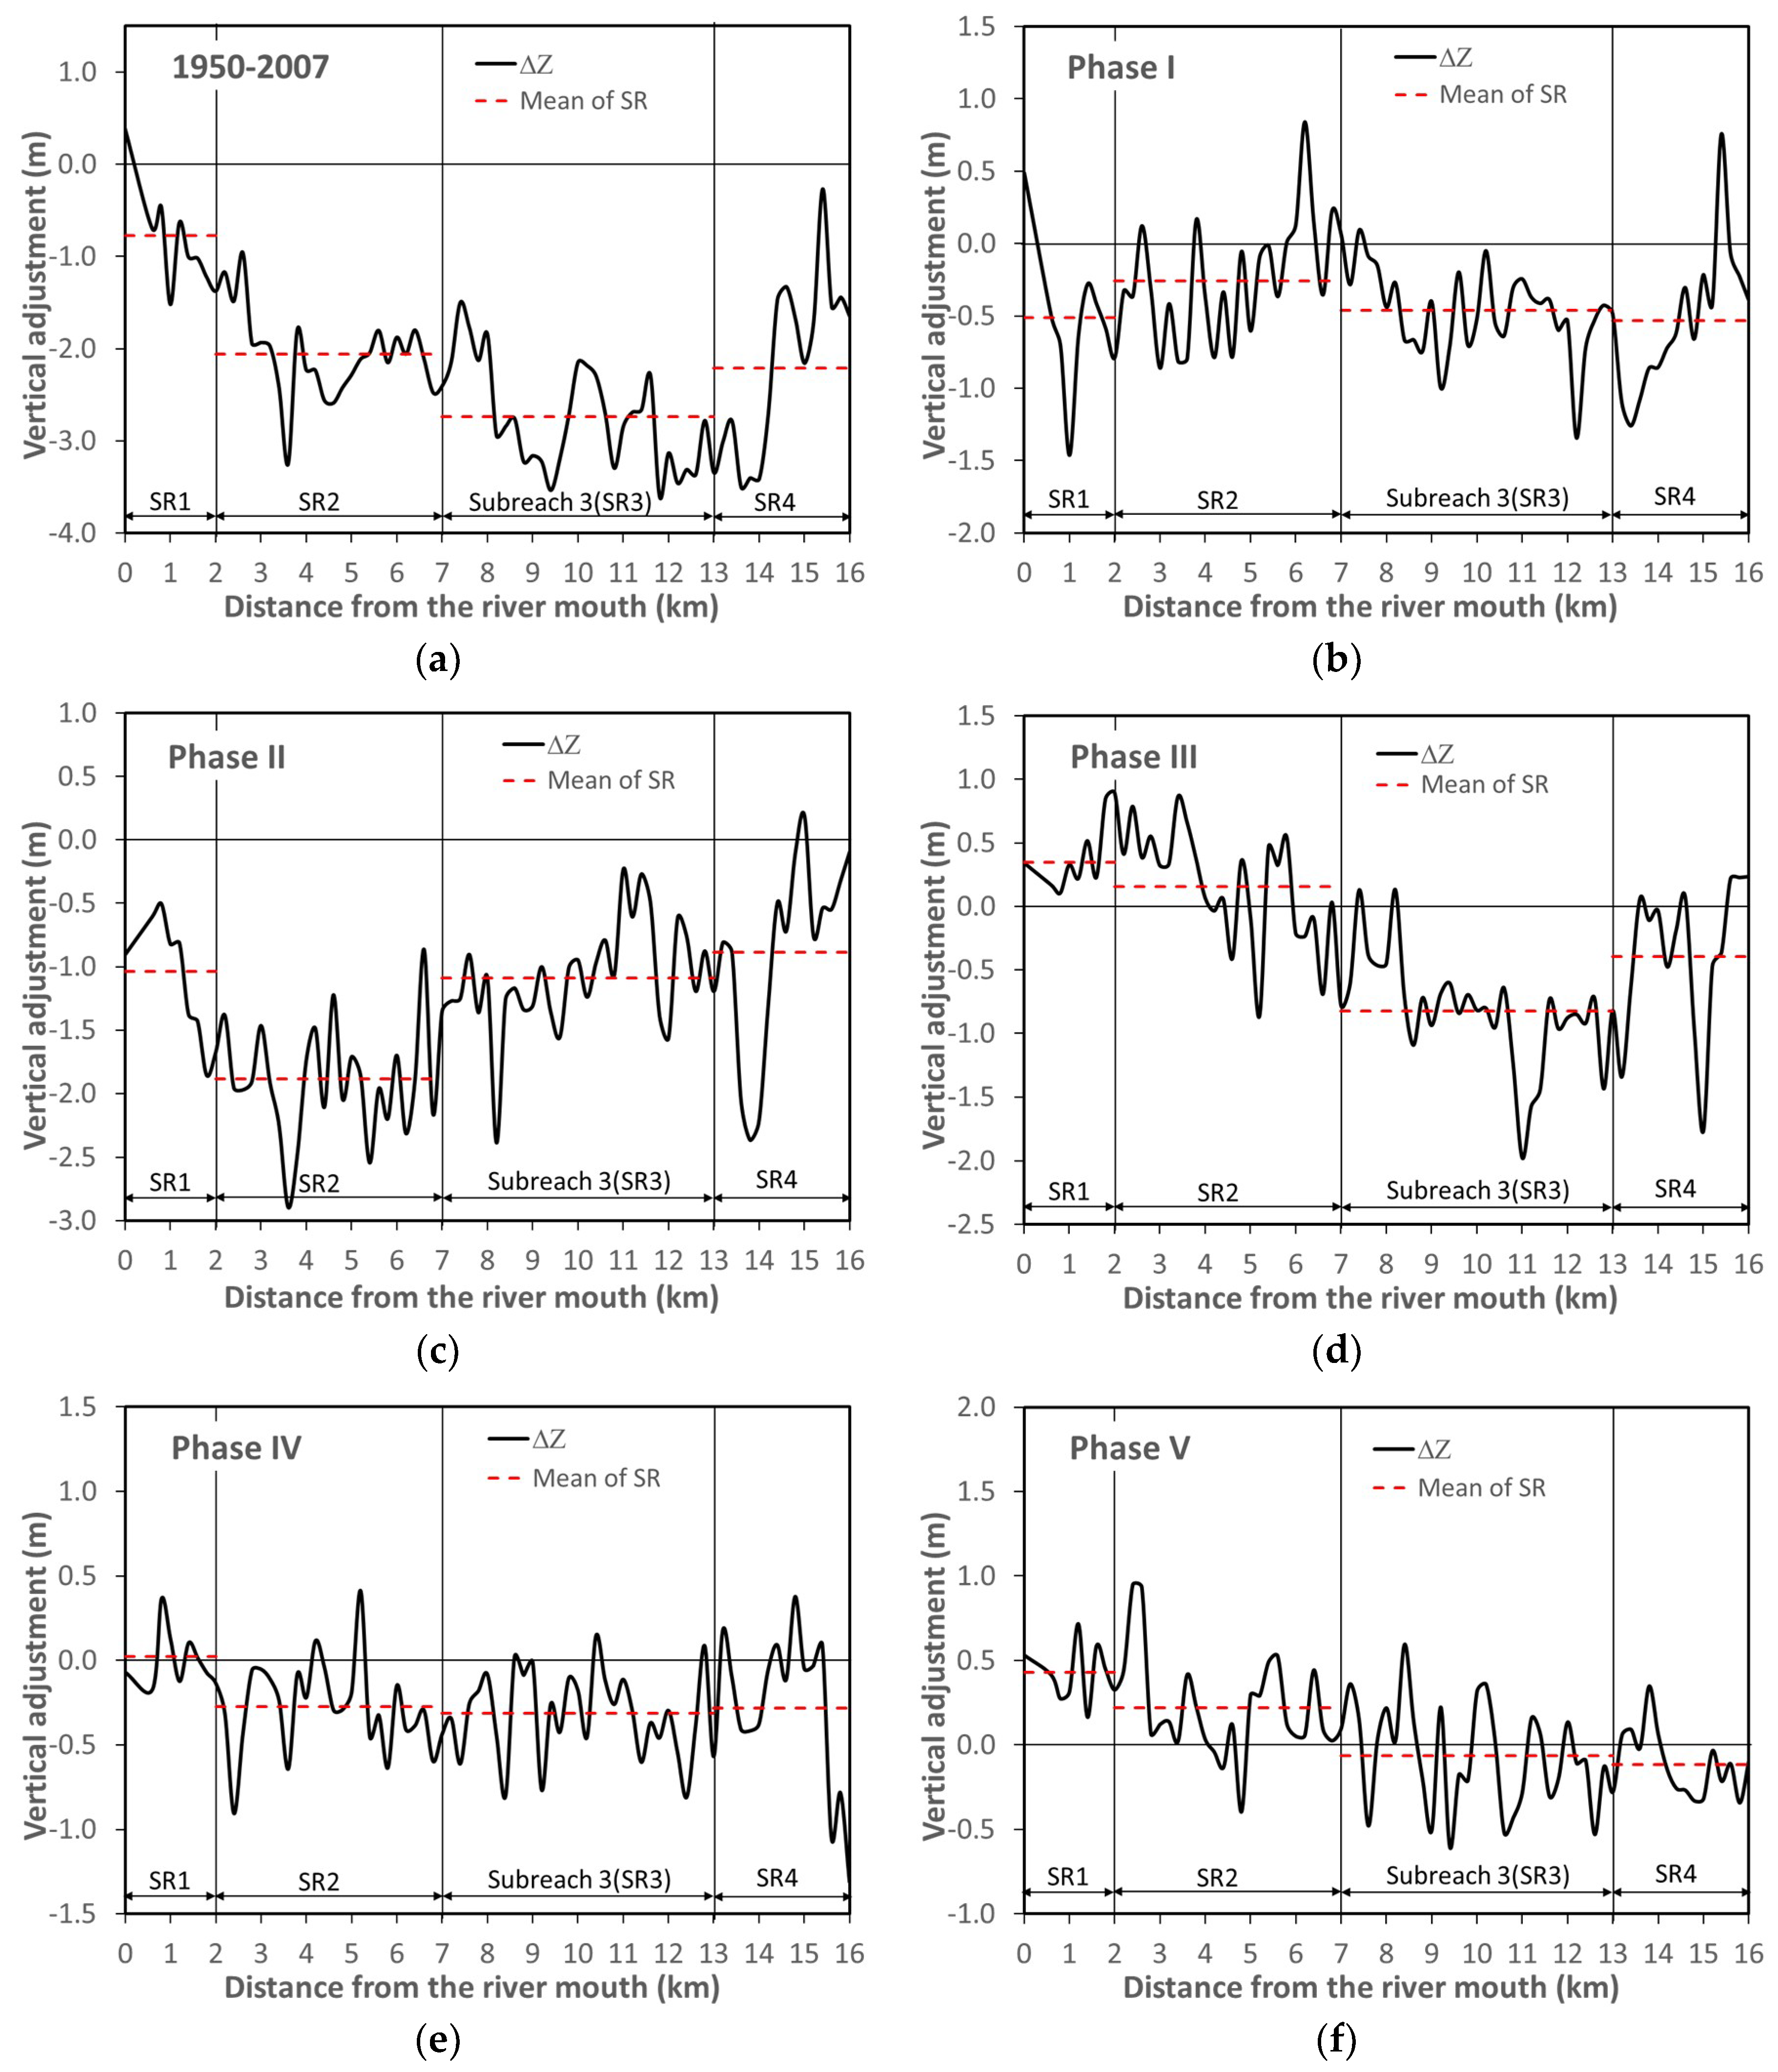
The characteristics of vertical adjustment significantly change at various temporal and spatial scales. In order to examine the variability, annual longitudinal profiles were first established based on the mean riverbed elevation at each cross-section. The vertical adjustment of each cross-section over a period was then computed as the change in mean riverbed elevation between the first and last year of each period. Furthermore, the vertical adjustment of a subreach (∆zs) was defined by averaging the vertical adjustments of cross-sections located in each SR. Figure 3a shows that an overall eroding tendency was observed during the period 1950–2007 in the LTR. The degradation was highest at SR 3, with ∆zs of −2.74 m, and lowest at SR 1, with ∆zs of −0.77 m. The amount of degradation of SR 2 and SR 4 was nearly equal, with ∆zs of −2.06 m and −2.2 m, respectively.
4.2. Variation in b-Value
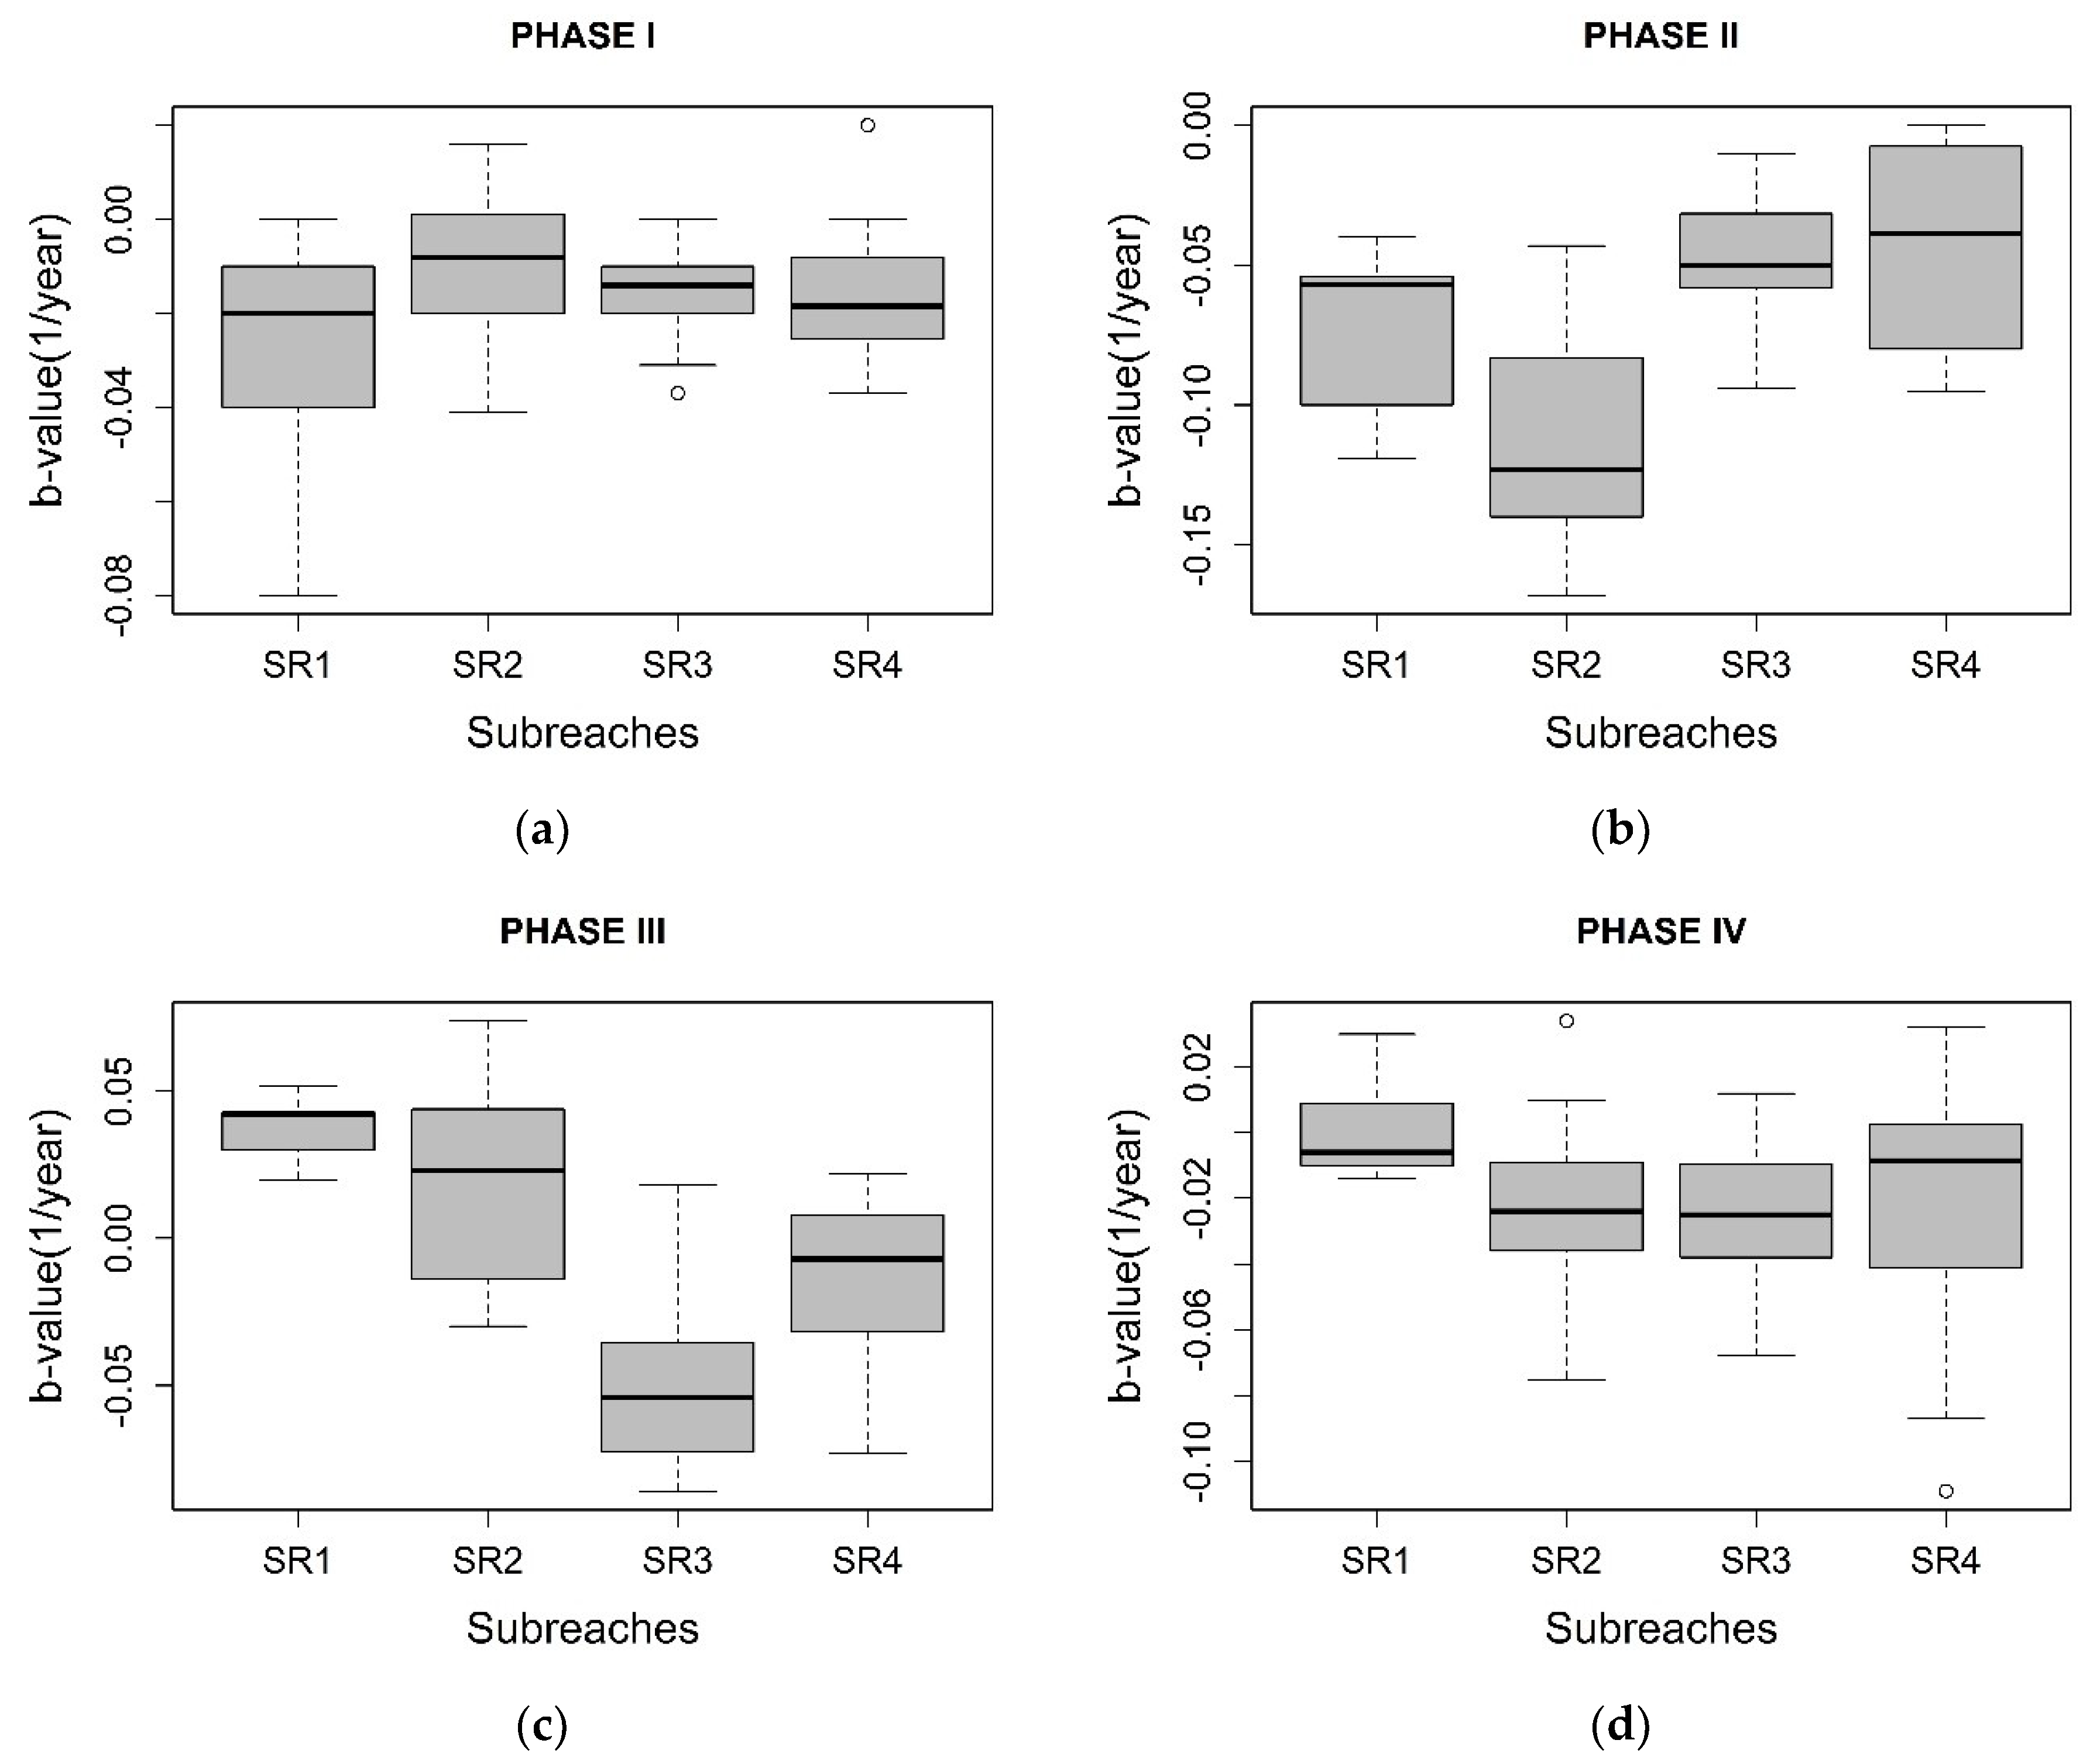
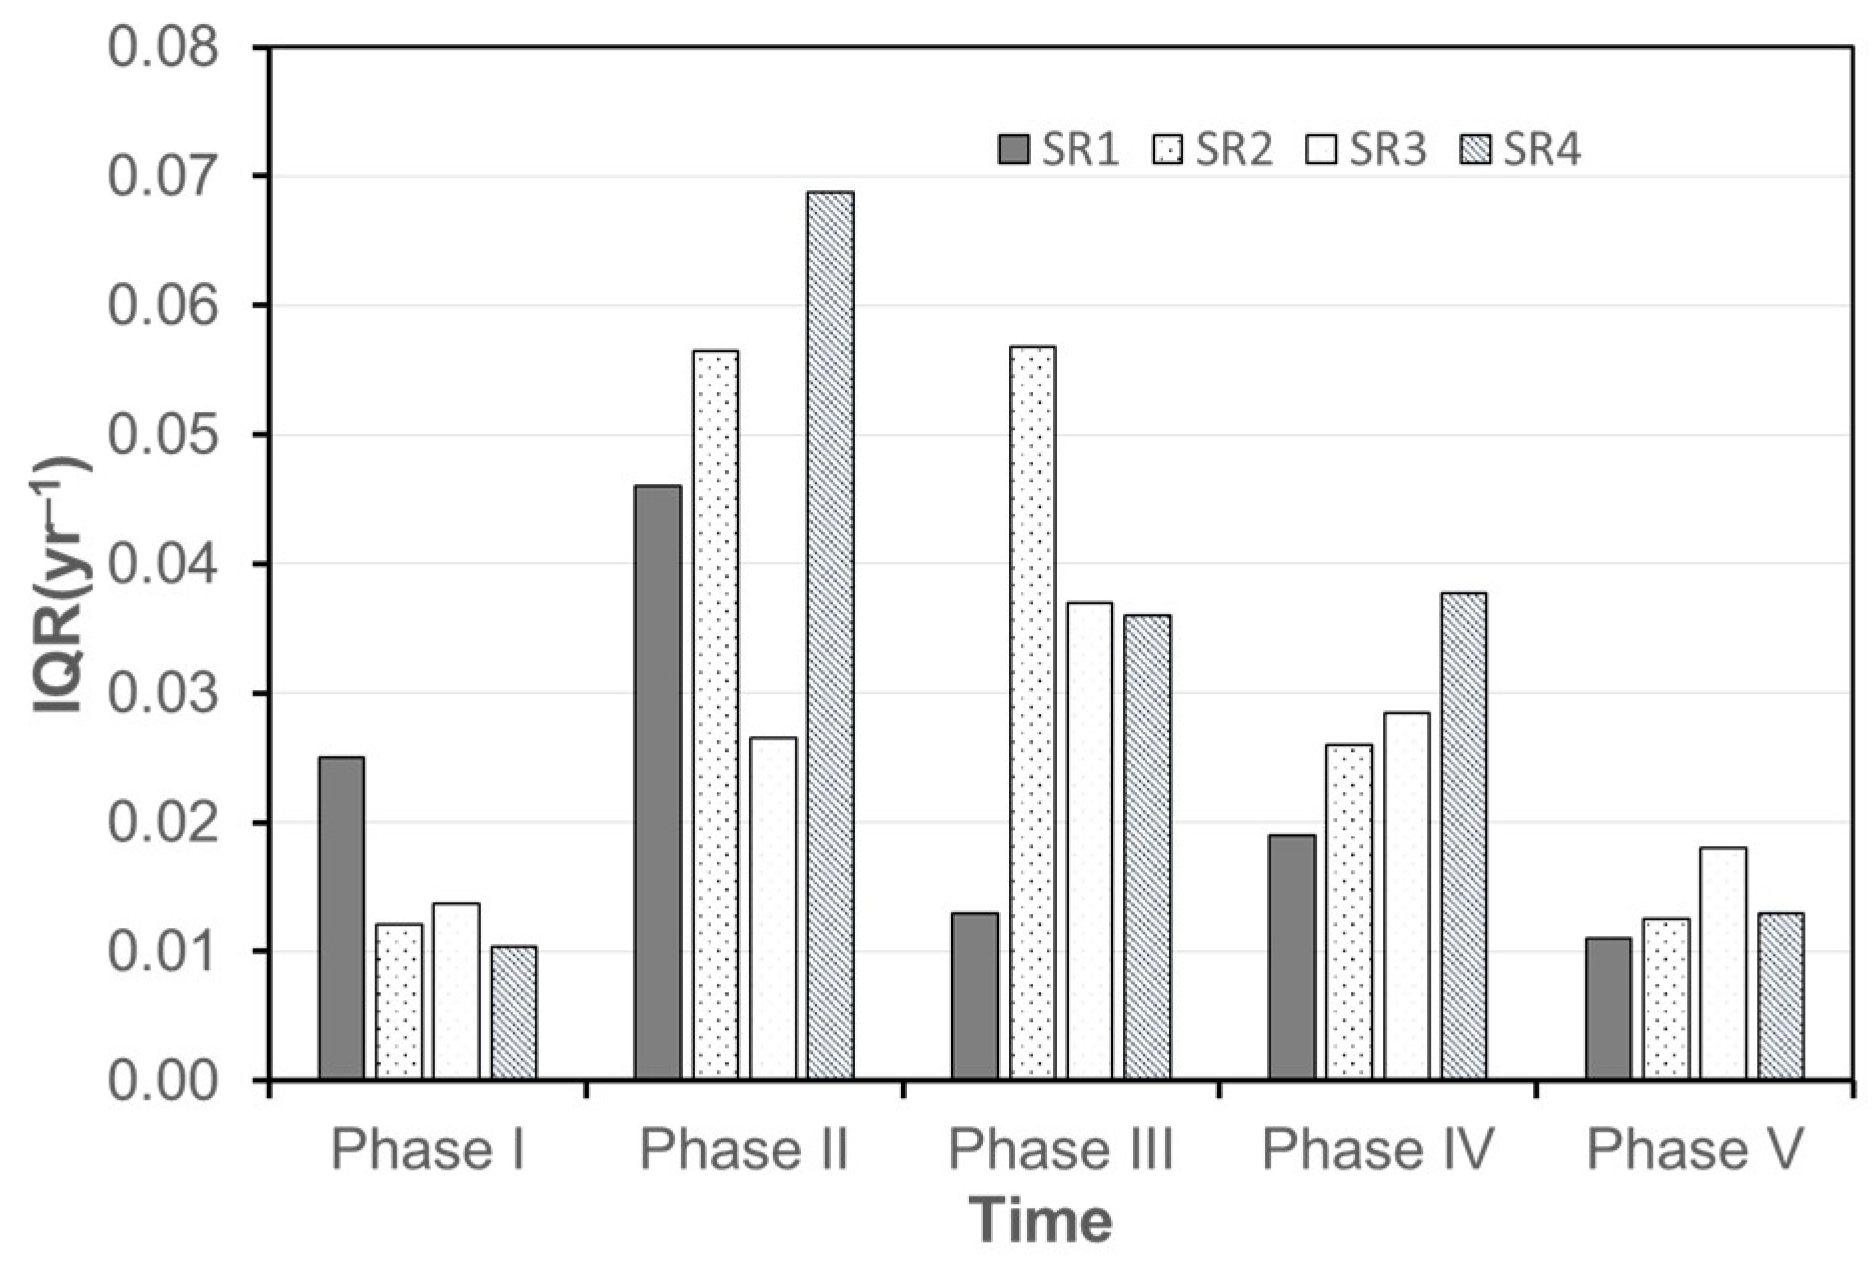
In order to quantify the deviation and median of nonlinear rates of vertical adjustment (b-value) at four SRs for different phases, we used box plots (Figure 4). The box plots indicate lower quartile, median, upper quartile, and interquartile range (IQR) of b-value. Whiskers from each end of the box show the data range or, if smaller, the most extreme values within 1.5 times the interquartile range from the ends of the box. Outliers beyond the ends of the whiskers are marked with “o”. Here, the median of a box plot is considered to represent the nonlinear rate of vertical adjustment of an SR, and IQR (Figure 5) as a measure of the strength of deviation of vertical adjustment rates in each SR. In phase I, homogeneous distribution with a relatively narrow range was observed at all subreaches (Figure 4). Nearly all b-values were negative, except for some data greater than the first quartile at SR 2 and an outlier in SR 3. The representative vertical adjustment rates hardly changed in space. The variation was in the range from −0.02 to −0.01 yr−1. Spatial variation in b-value at SR 3 was less than that at other subreaches. The representative erosion rates of four subreaches in phase II were the highest compared with other phases. SR 4 showed symmetric distribution, whereas the remaining subreaches had skewed distribution. The lowest representative vertical adjustment rate was found at SR 2. IQR for SR 1, SR 2, and SR 3 became large in phase II compared with other phases (Figure 5).
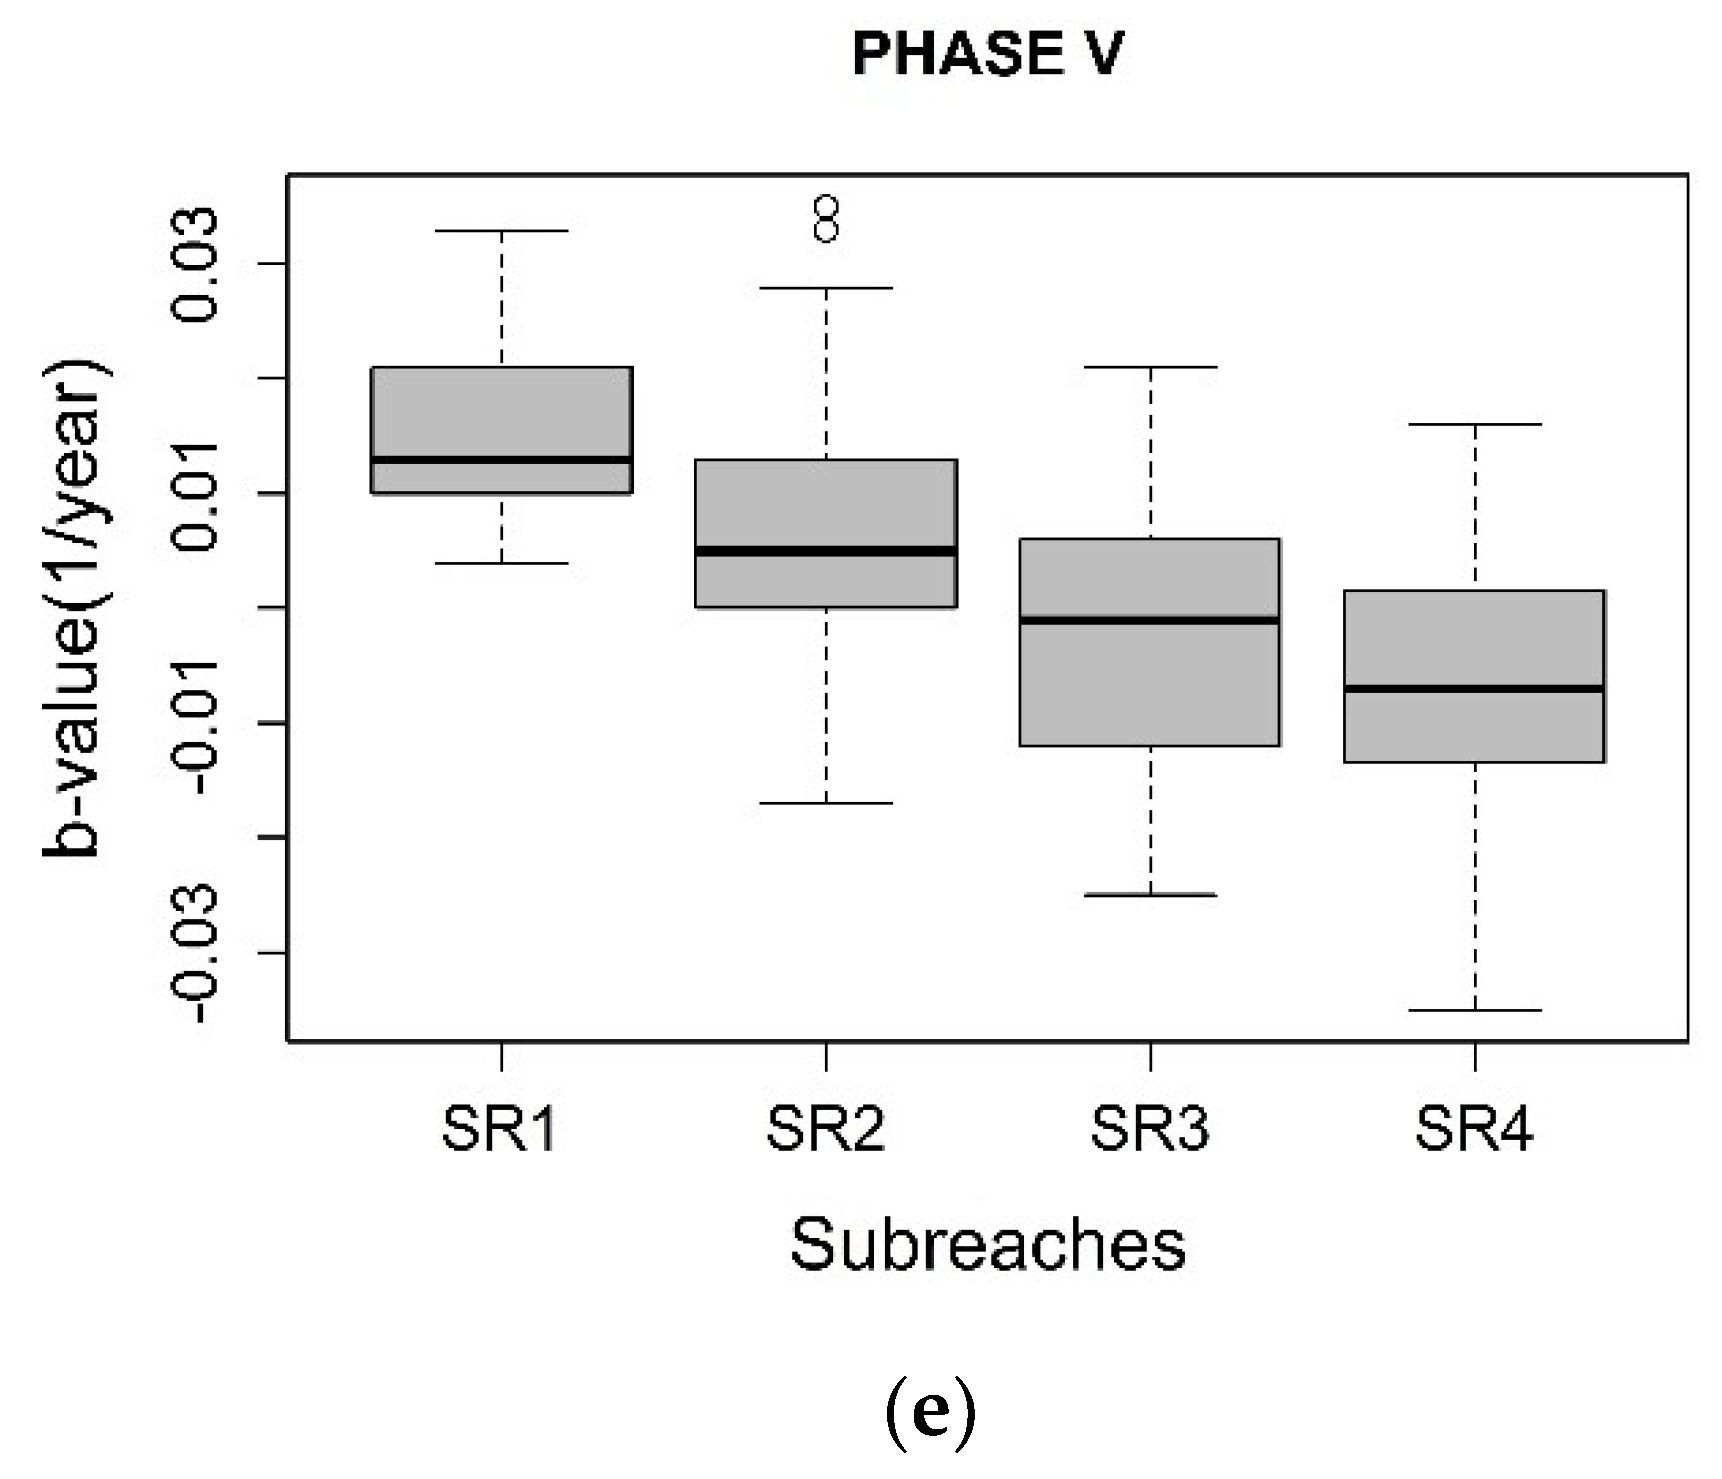
In phase III, the highest deposition rate in the range of 0.03–0.06 yr−1 occurred at the whole SR 1, whereas a serious erosion rate from −0.09 to −0.04 yr–1 was observed at almost the entire range of SR 3. Both deposition and erosion were observed at SR 2 and SR 4. The range of deviation in vertical adjustment rates was similar at SR 3 and SR 4 (Figure 4). In phase III, IQR of SR 1 was the minimum, while IQR of SR 2 was the maximum. In phase IV, the representative rate and IQR of SR 2 were the same as those of SR 3. Although the median vertical adjustment rate of SR 1 was nearly equivalent to that of SR 4, the range of deviation in the vertical adjustment rate of SR 1 was nearly half that of SR 4. In phase V, there was a gradual decrease in representative vertical adjustment rates from SR 1 to SR 4. A deposition trend was exhibited at SR 1 and SR 2, whereas erosion occurred at SR 4. SR 3 was considered as transitional because both deposition and erosion were witnessed there (Figure 4). The ranges of deviation in vertical adjustment rates for SR 1, SR 2, and SR 4 were similar and smaller than that of SR 3 (Figure 5).
Overall, b-values extracted from Equation (1) fully captured the temporal and spatial trends in vertical adjustment. The variation of trends in representative b-values was analagous to that in ∆zs mentioned previously. This proves that the way to define b-values based on Equation (1) could be better than methods used in several previous studies. Rinaldi and Simon [2] utilized a dimensionless exponential function to extract a nonlinear rate of vertical adjustment (k) for riverbed elevation in the Arno River, central Italy. In their study, the resulting variations in k could not totally capture the characteristics of vertical adjustment of the Arno River. For example, it was seen that the values of k in different phases were nearly the same, while the corresponding degradation amounts of these phases were quite different. Dang et al. [7] applied an exponential function to define the nonlinear rate of vertical adjustment (b) of the Tedori River, Japan. Because the Zmin of each phase was not subtracted from the mean riverbed elevation prior to conducting nonlinear regression analysis, b tended to reach zero with distance downstream and could not fully describe the trend of vertical adjustment.
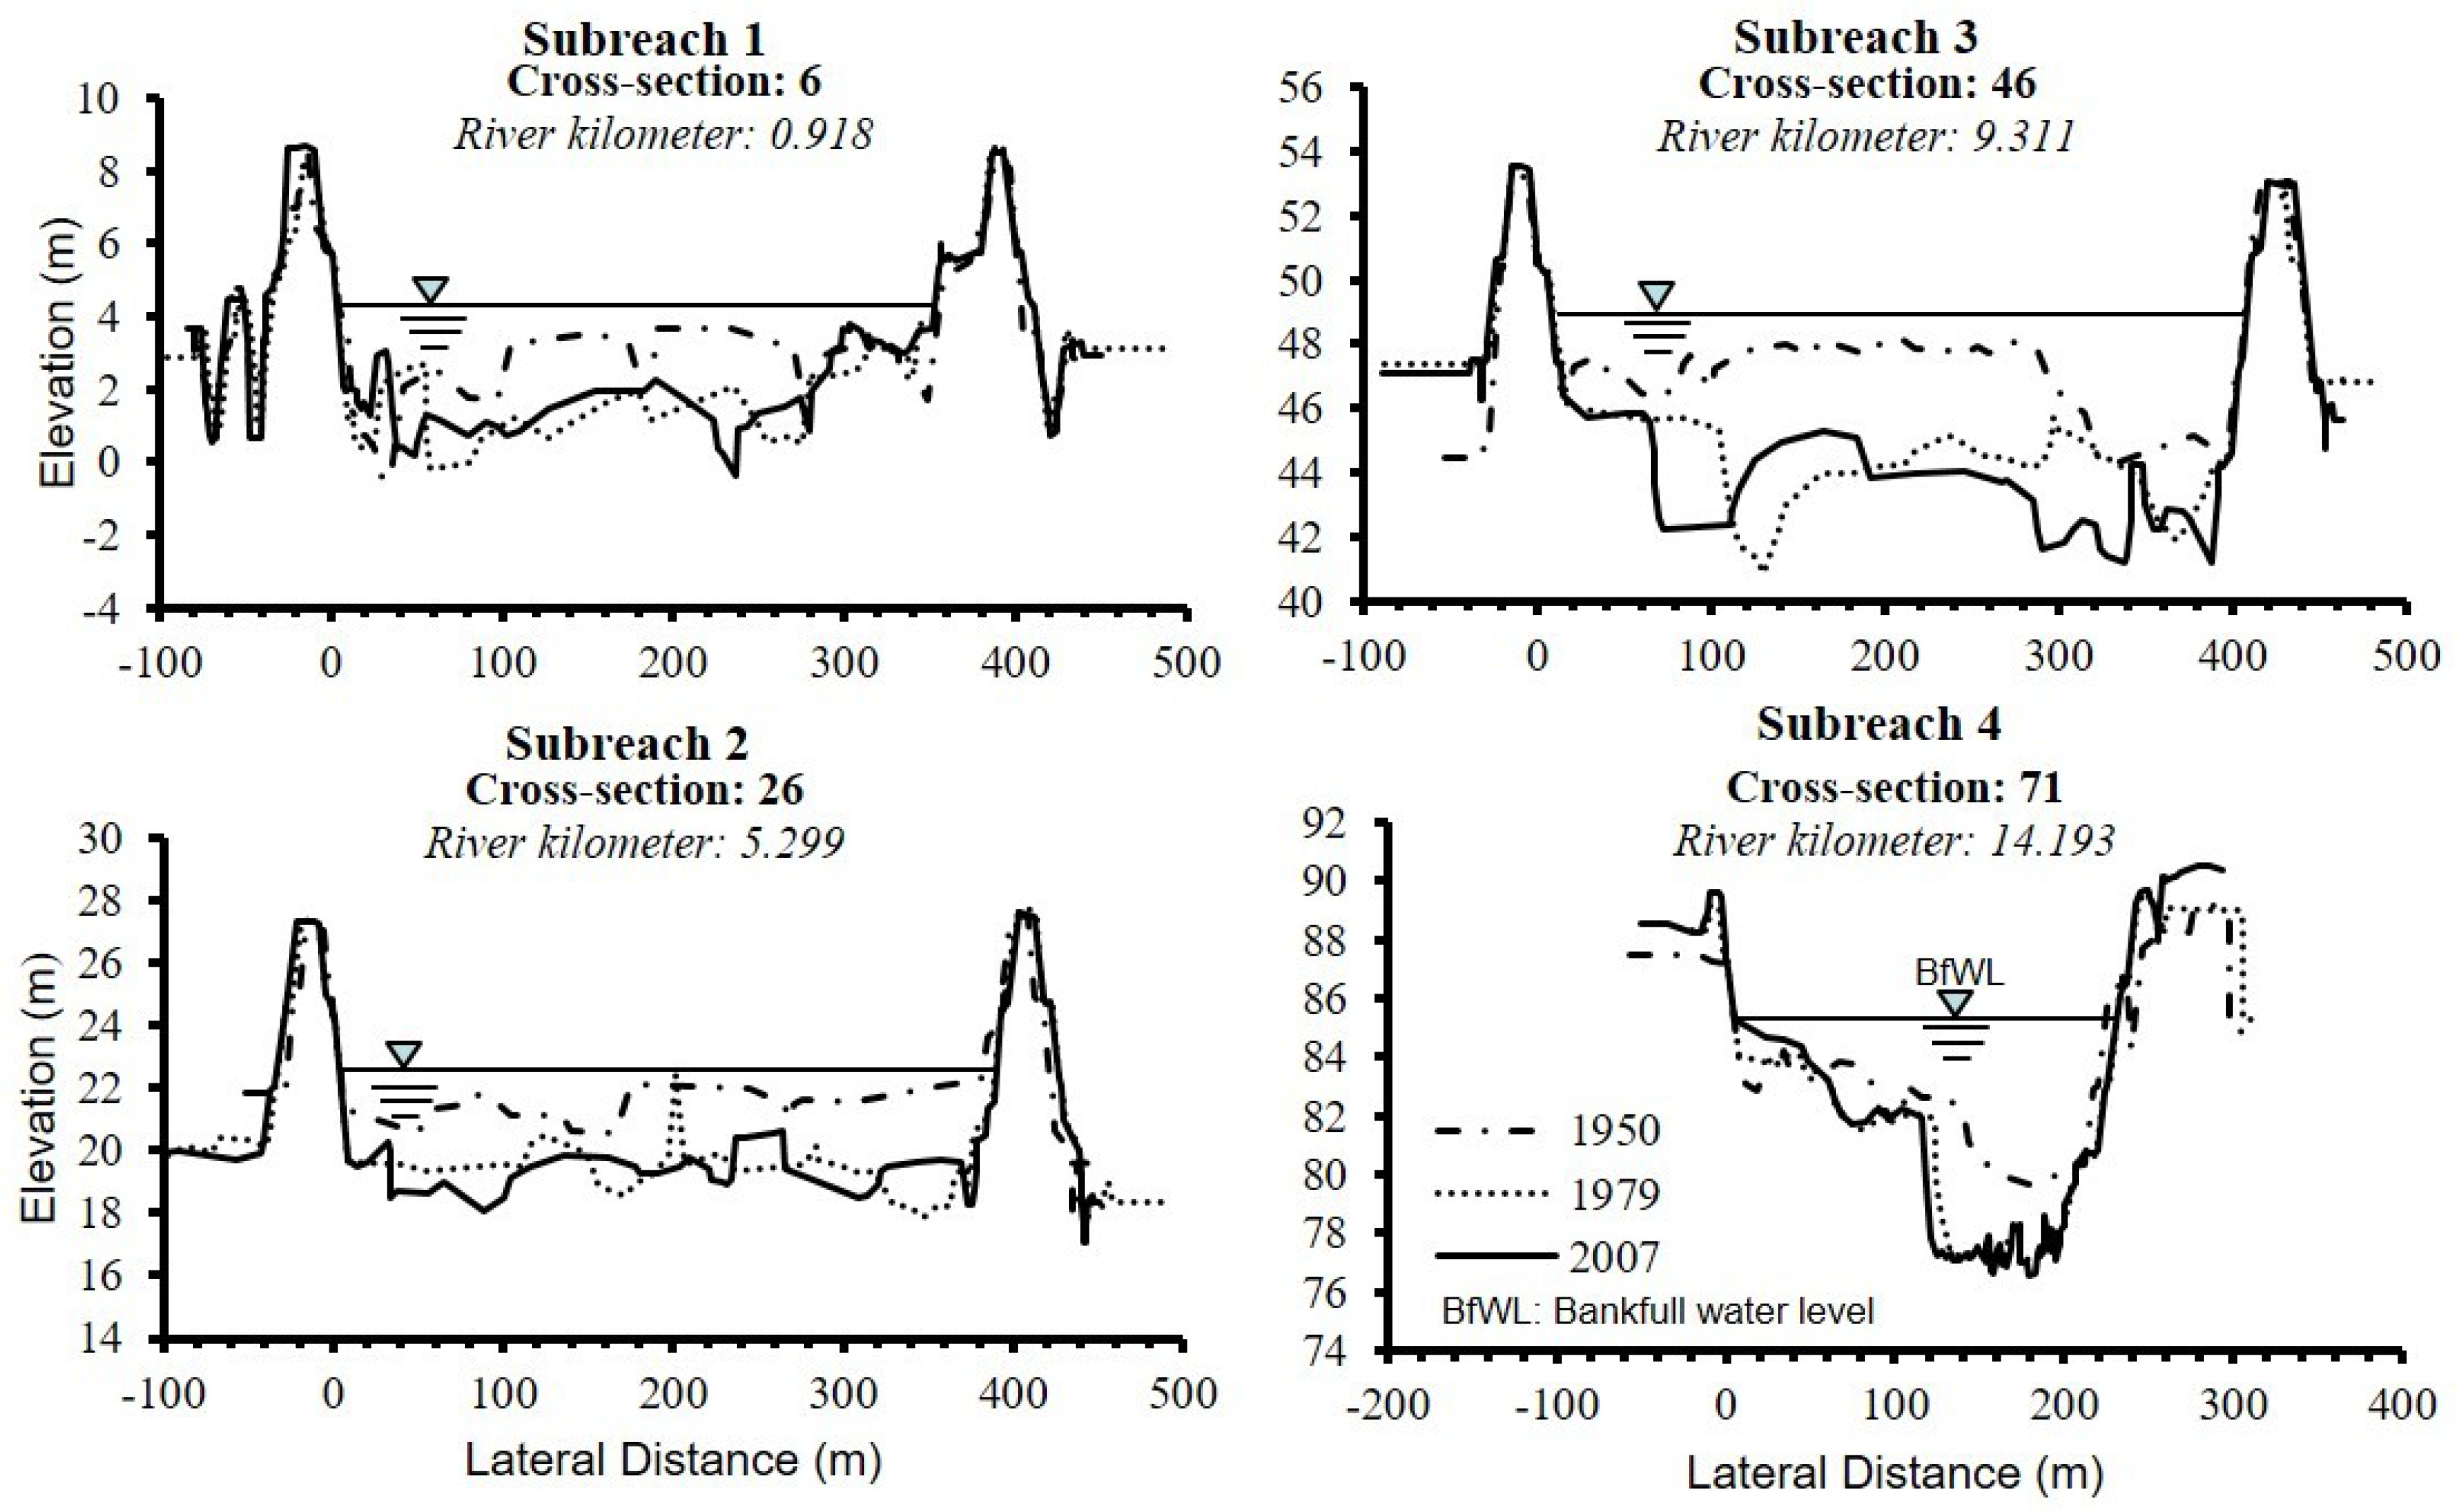
4.3. Lateral Variation
To investigate the transversal variation of riverbed elevation, four representative cross-sections located at the middle of each subreach are shown (Figure 6). The horizontal line represents the bankfull level. The first notable point is that there was only degradation throughout the entire extent of a cross-section in the period 1950–1979, while both degradation and aggradation took place simultaneously in different parts of a given cross-section over the period 1979–2007. The synchronous degradation in the former period could be closely related to extensive SGM that was conducted in the whole bed. One reason for the latter is the total absence of SGM from 1991 and the transversal nonuniformity of erosion and deposition induced by the irregularity of the flow velocity field in which either scouring or settling of sediment particles can prevail in different parts of a given river channel cross-section [14]. In reality, a change in structure of the flow velocity field along the cross-sectional direction was attributed to several factors, such as seasonal variation in flow discharge and sediment supply, and the presence and destruction of turbulent eddy currents. This process led to the development of bars and islands in the river channel.
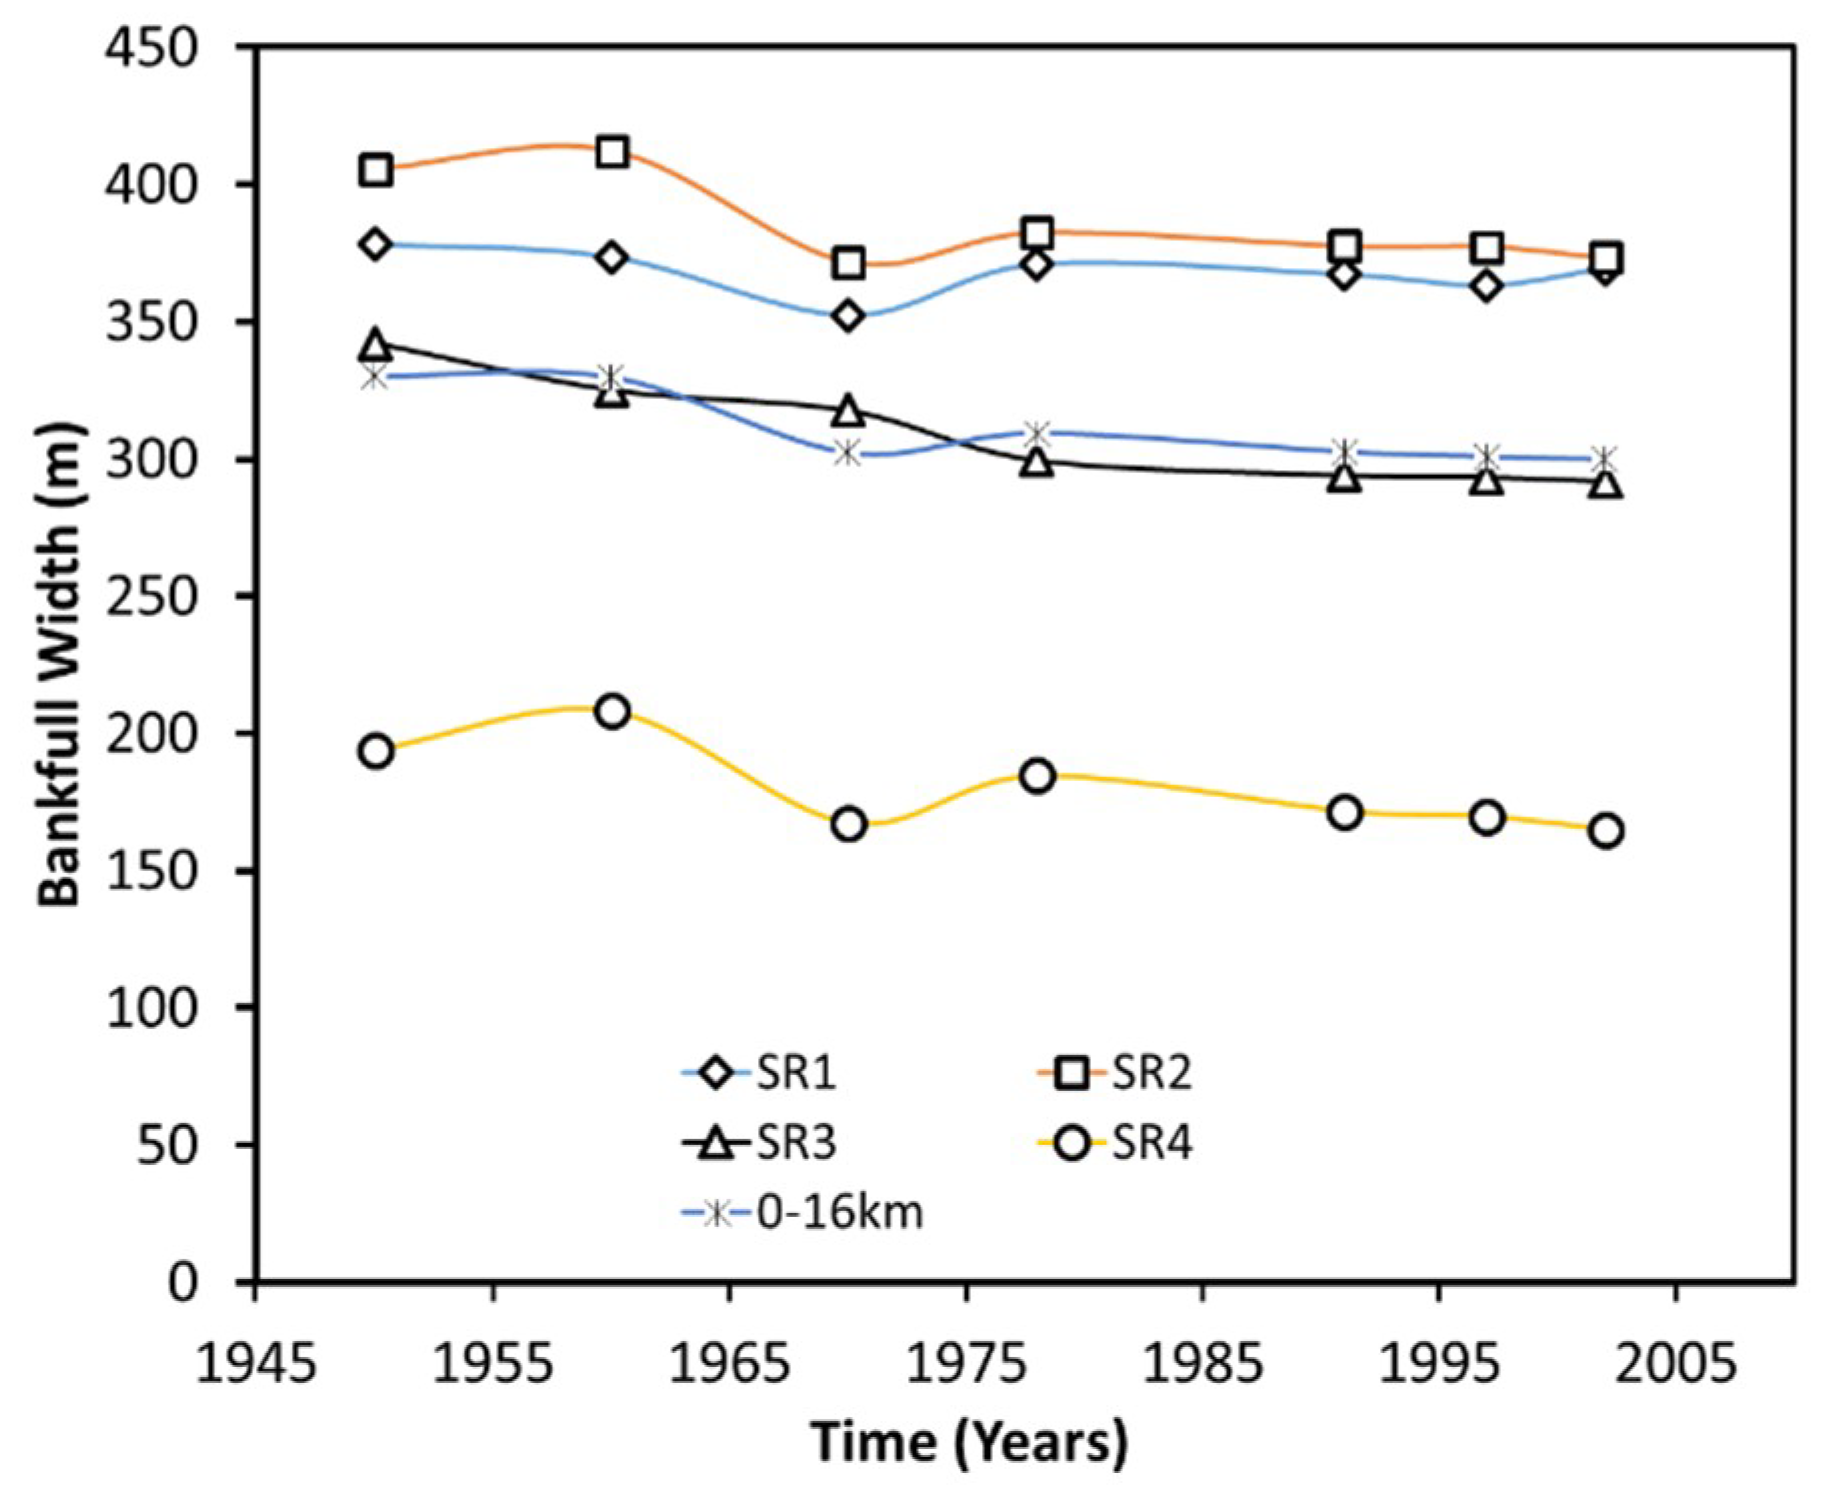
4.4. Variations in Bankfull Channel Width
The bankfull channel widths averaged over SR were computed for 1950, 1960, 1970, 1978, 1991, 1997, and 2002, as shown in Figure 7. The average channel width of the entire study reach decreased from 330 m in 1950 to 300 m in 2002. The temporal variation in channel width indicates that a significant decrease in channel width took place simultaneously in the four subreaches from 1950 to 1970, coinciding with the trend of considerable erosion in this period along the LTR. Similarly, a rapid decrease in channel width was still observed in SR 3 during 1970–1978. Contrary to this phenomenon, channel width increased by an average of 15 m in SR 1 and SR 2 as a direct consequence of the aggradation trend from 1970 to 1978. Channel width in the entire reach slightly decreased from 1978–1991 and subsequently remained stable during the last period, 1991–2002.
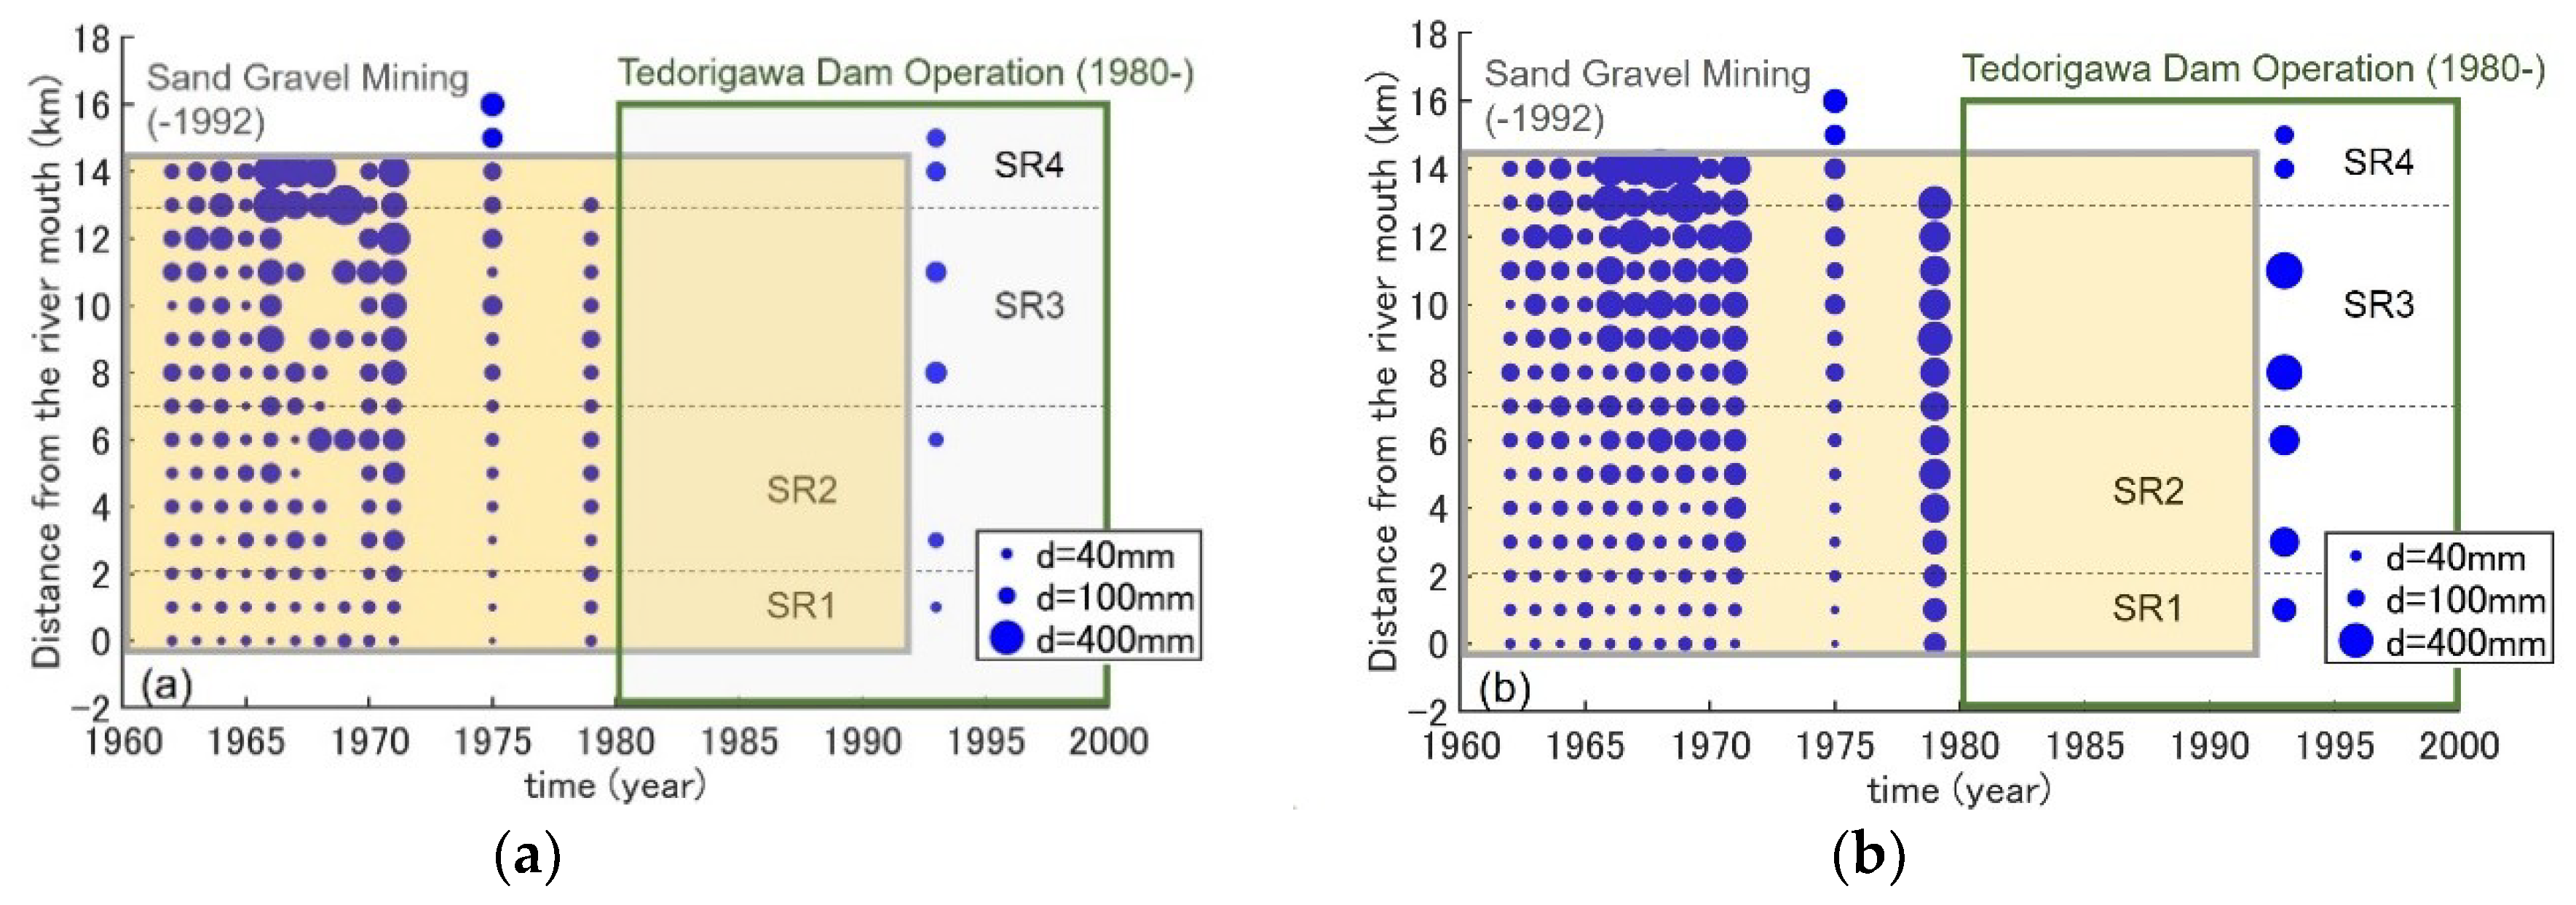
4.5. Variation in Sediment Characteristics
Longitudinal variation in sediment diameter was examined next. A general downstream reduction in grain size accompanying a general decrease in bed slope was observed (Figure 8). The decline in grain size also reflects the attrition of gravel in transit along the rivers [15]. During 1965–1975, sediment mean diameter (dm) increased in the reach of 4.5–14 km, ranging from 150 to 400 mm in the river channel and 100 to 200 mm in the lateral area. From 1979 to 1993, dm for the river channel decreased to 50–100 mm, while on the lateral area, dm coarsened in a range from 200 to 400 mm in the reach of 3–14 km. Similar to previous studies on SGM effects [16,17], it was considered that SGM was responsible for the coarser dm value in the riverbed for two reasons: first, an amount of sand- and gravel-sized grain was moved out of the river, leaving the bed sediment layer with larger grains; and second, SGM triggered erosion upstream and downstream of the excavation pit, and finer sediment was thus transported to the downstream area.
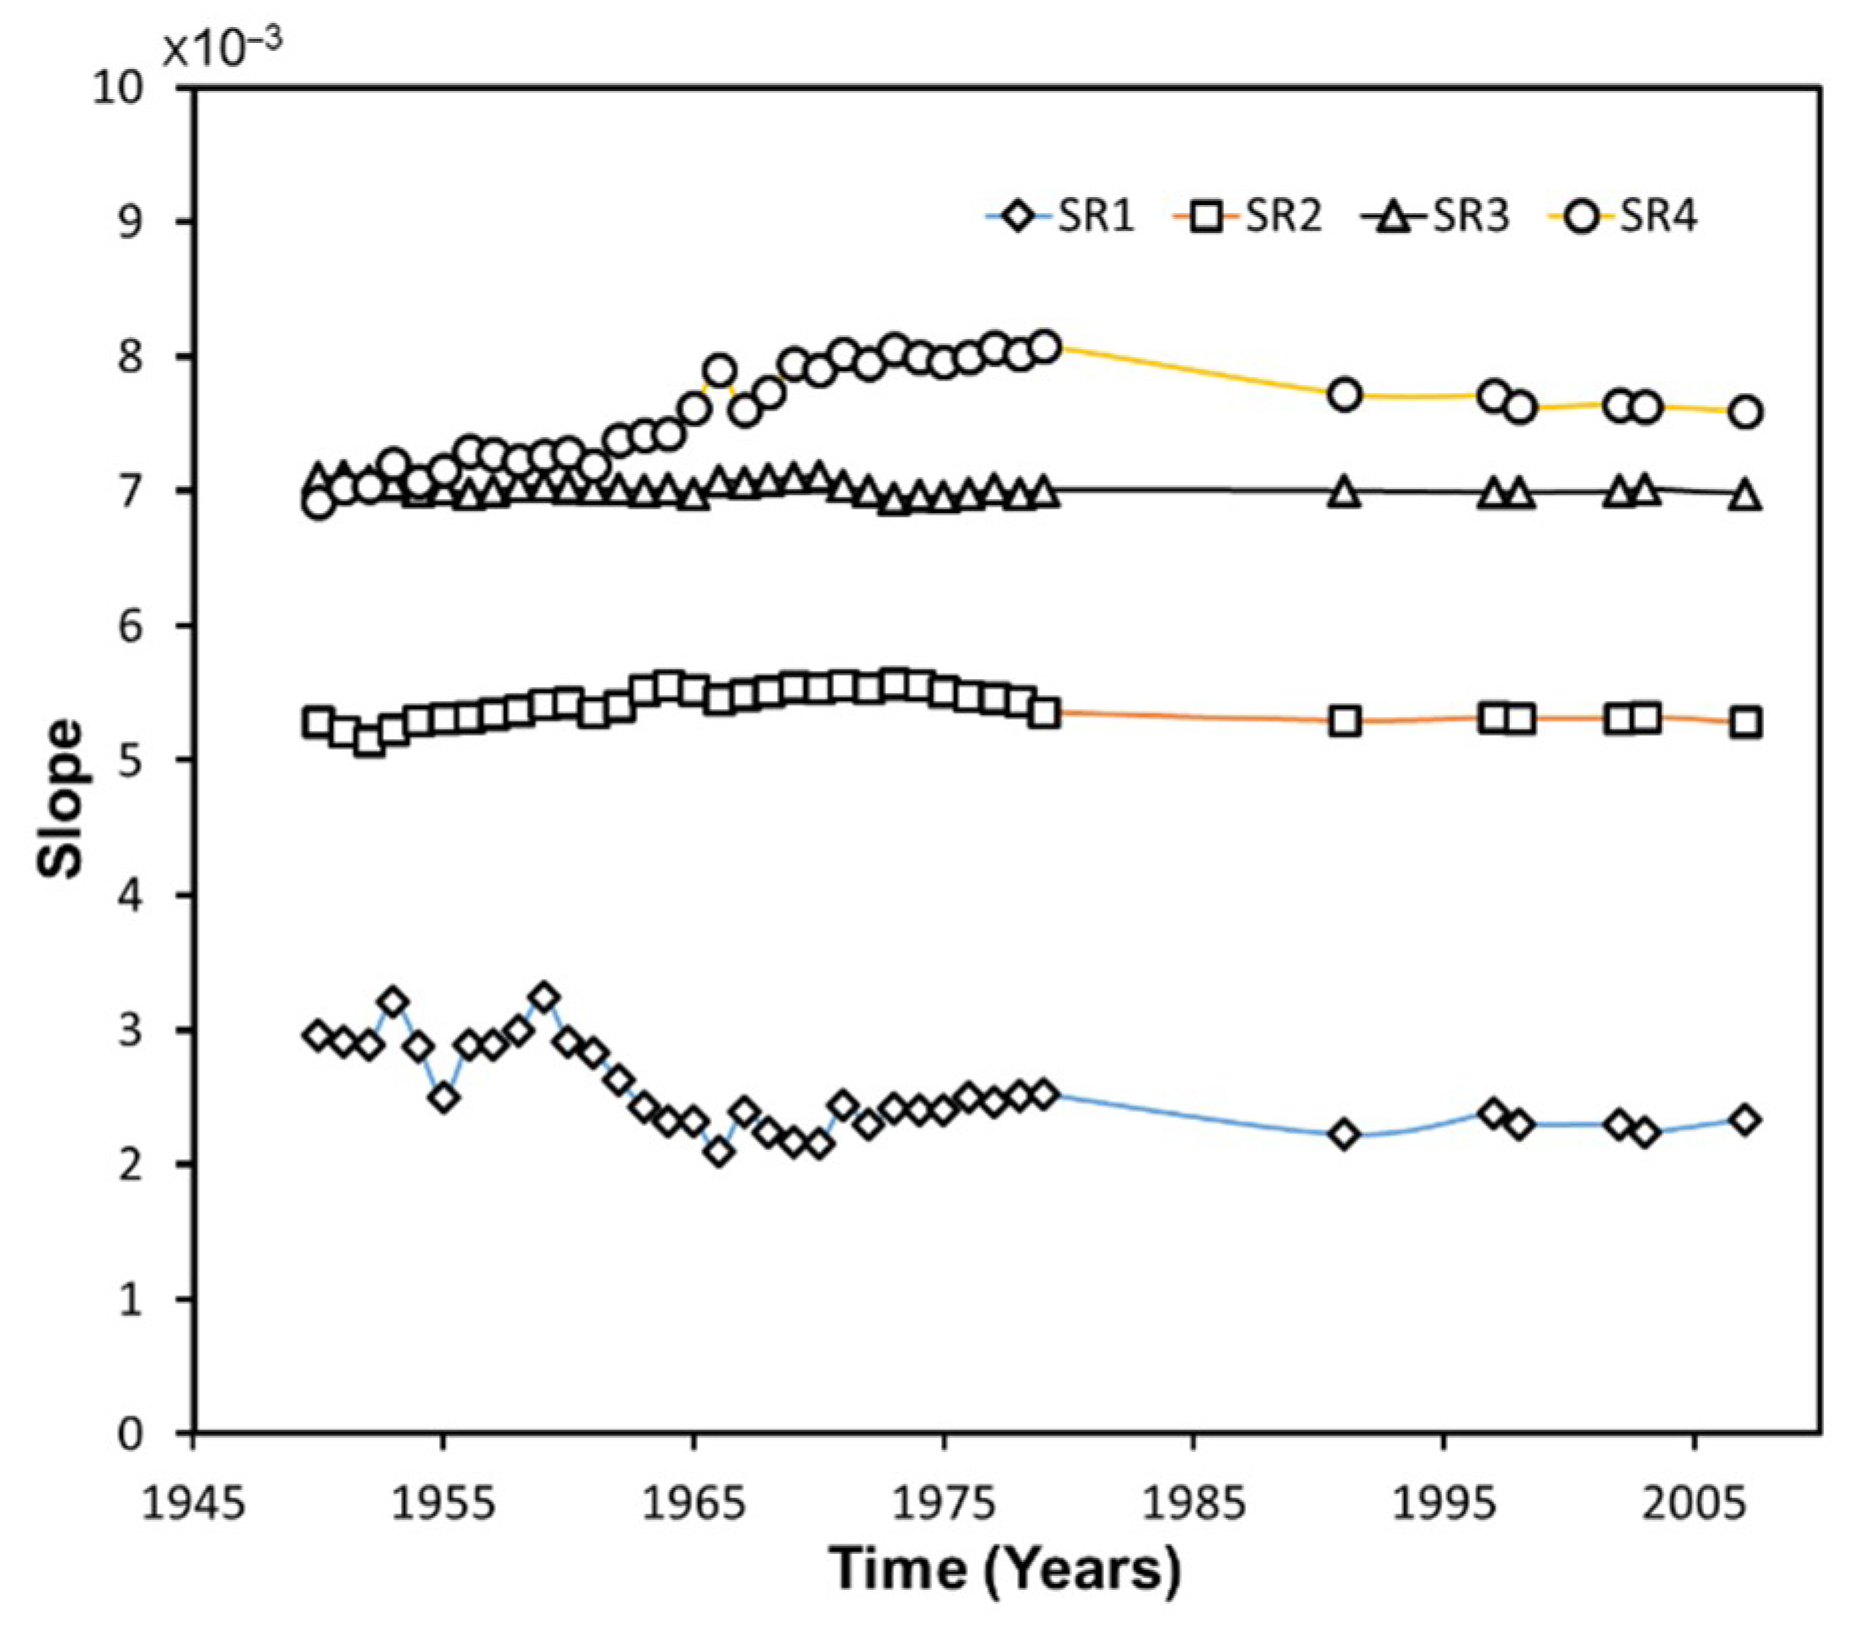
4.6. Variation in Slope
As a consequence of the direct effects of human activities or changes in other controlling factors, the slope of the Tedori River (S) varied temporally and spatially at different rates during the period 1950–2007 (Figure 9). Due to unavailable topographical data, a gap appeared in the period 1980–1990. It was found that variation in channel slope in SRs 1 and 4 was more significant than that in other SRs. Commonly, the slope of the four SRs varied considerably from 1950 to 1991, and subsequently remained stable until 2007. Over the period 1950–1970, S of SR 1 decreased by 30%, while there was only a slight variation in S in SRs 2 and 3. Possibly, SGM lowered the riverbed of SR 3 by the same magnitude, and consequently S remained at a nearly constant level. According to Dang et al. [8], from the 1950s to the 1960s, the amount of SGM decreased by 50% at the downstream end of SR 1 and increased by 10% at the upstream end. Additionally, SGM upstream decreased the sediment load supplied to SR 1. These actions decreased S in SR 1 to establish a new equilibrium condition. Lane [18] concluded that when a sediment load decreases from an equilibrium condition in a stream, the equilibrium state will be lost; a new state of equilibrium can then be restored in the form of reduced slope. The behavior observed in this study was consistent with the finding of Lane [18]. From 1950 to 1972, S in SR 4 increased by 15% because there were SGM activities in the downstream portion but not in the upstream. Subsequently, the opposite trend was observed in SR 4 as a result of laws preventing the overmining of sand and gravel in the mid-1970s. A change in the S, therefore, could be considered as a response of the Tedori River to anthropogenic activities, especially SGM.
4.7. Variation in Total Stream Power and Specific Stream Power
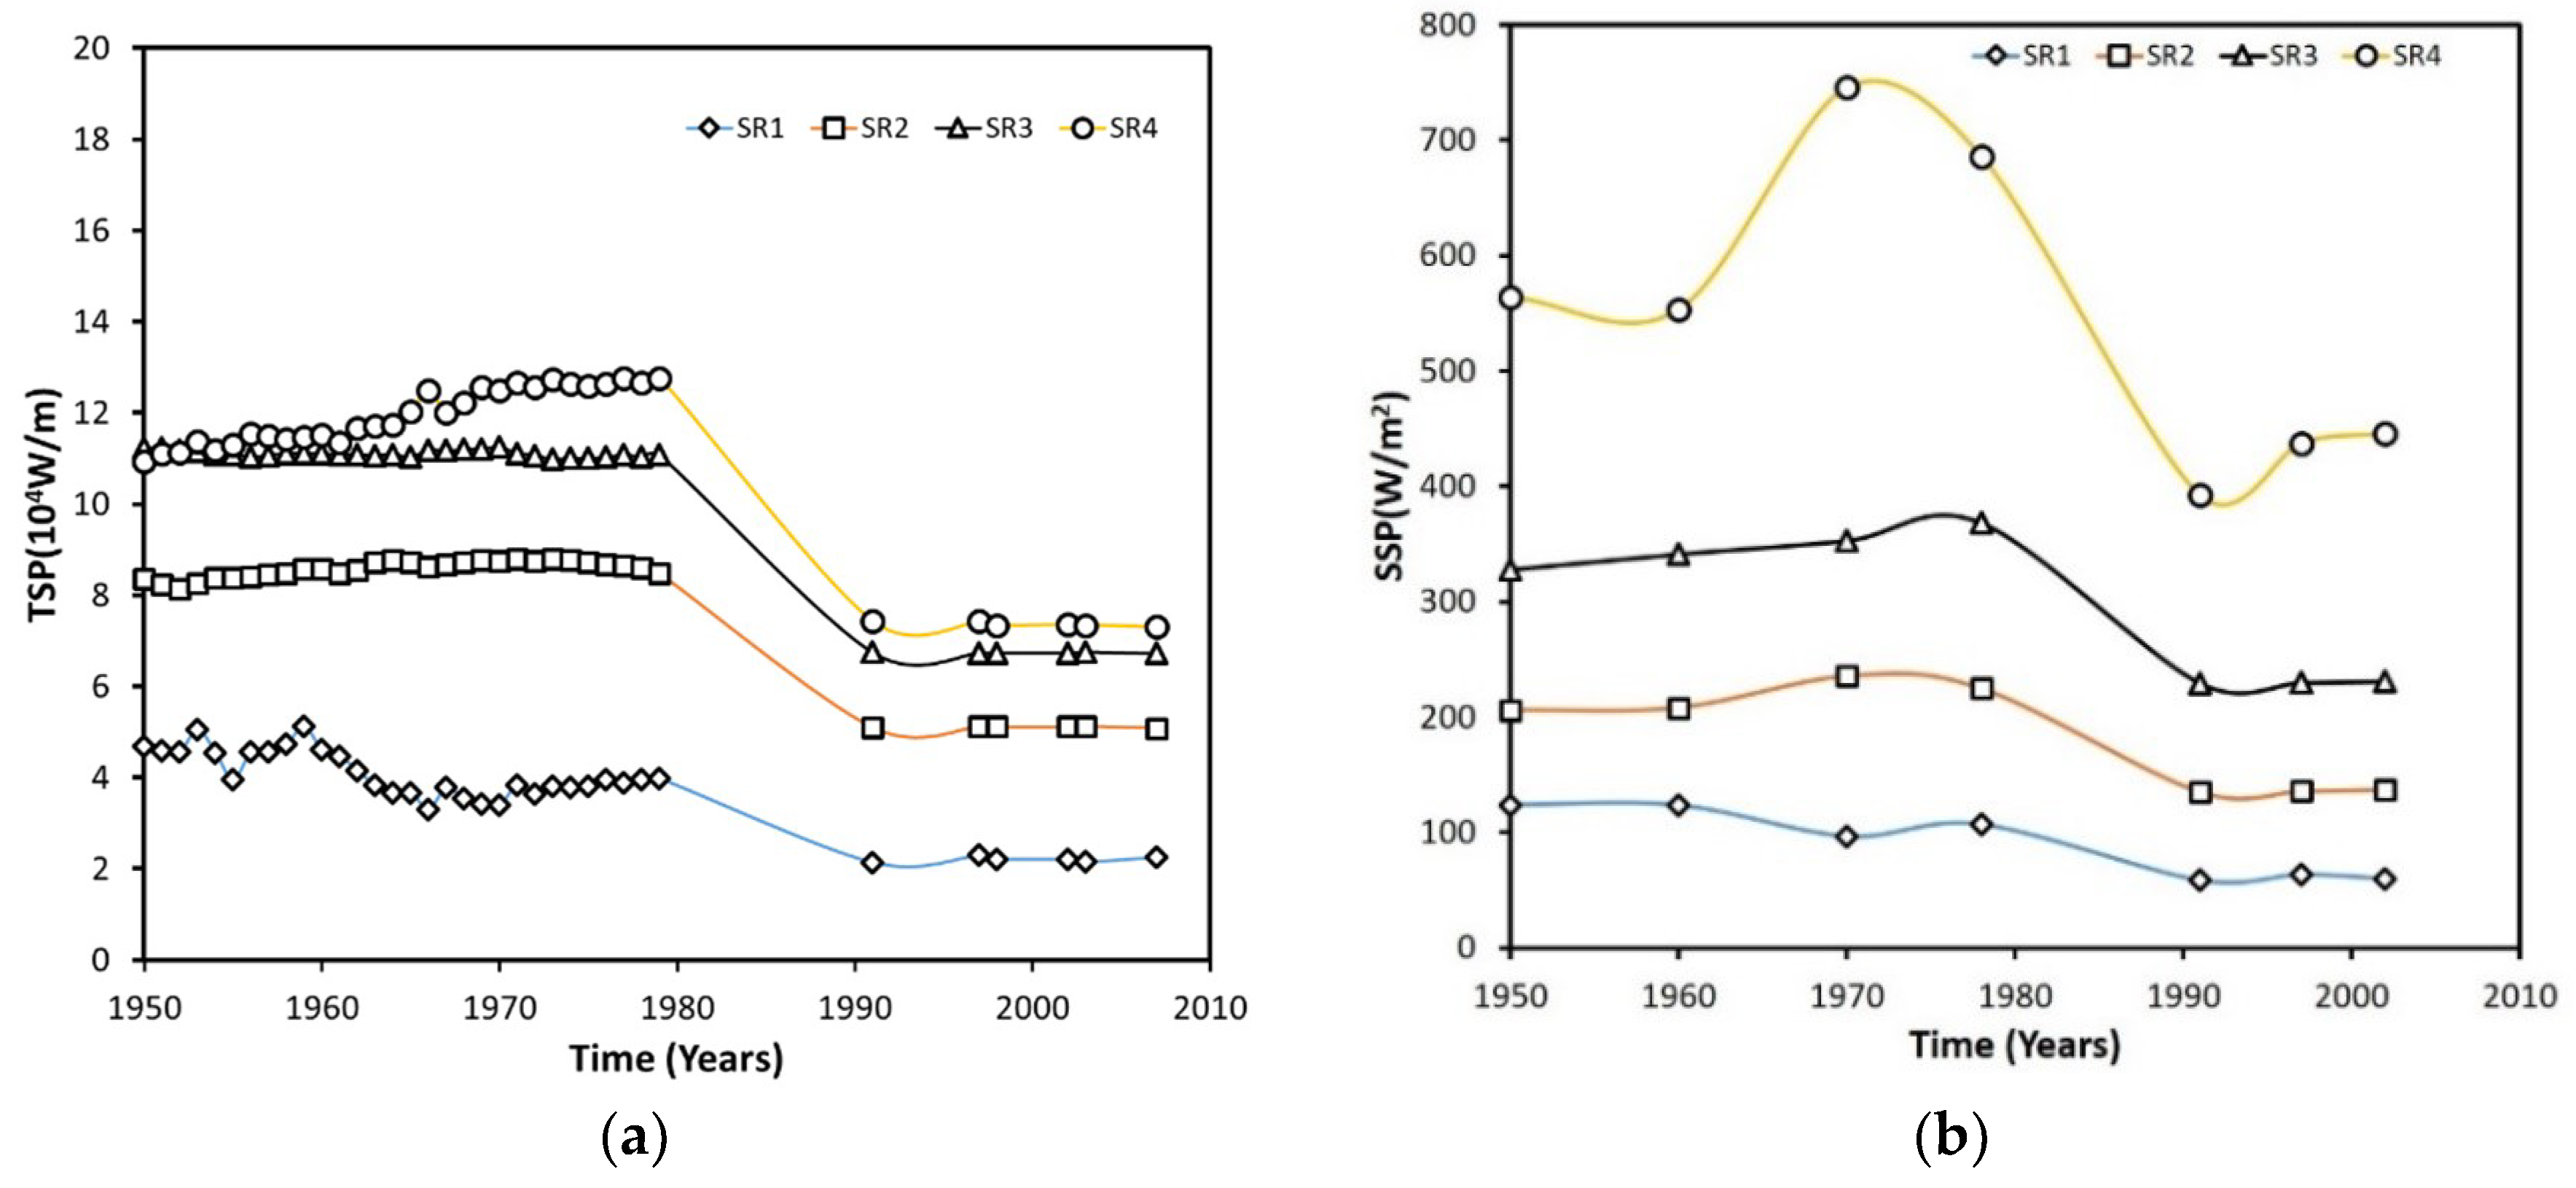
Temporal variations in both TSP and SSP were investigated for four SRs of the LTR. There was similarity between variations in S and TSP during the period 1950–1979: TSP of SR 2 and SR 3 was nearly unchanged, while TSP of SR 4 increased by 17% and TSP of SR 1 decreased by 15% during the period 1950–1979 (Figure 10a). Variation in TSP of an SR was mainly attributed to an imbalance in the amount of SGM at the upstream and downstream ends of the SR. In addition, TSP of four SRs decreased significantly due to a reduction in mean annual flood discharge by 35% induced by TDO since 1980. TSP was nearly steady from 1991 to 2007 at four SRs as a result of no SGM in this period. Prior to 1991, the variation trend in SSP was identical to that in the S and TSP. Since 1991, except for SR 4, SSP at the other three SRs stood at stable levels. The SSP of SR 4 was much higher and fluctuated more than that of the other SRs. The SSP in SR 4 was highest in 1970 because of the smallest bankfull width together with high slope (Figure 10b). The discrepancy between TSP of two consecutive SRs increased with distance downstream. In contrast, the discrepancy between SSP of two consecutive SRs decreased with distance downstream.
4.8. Relationship between Vertical Variation of Riverbed Elevation and Related Bankfull Width
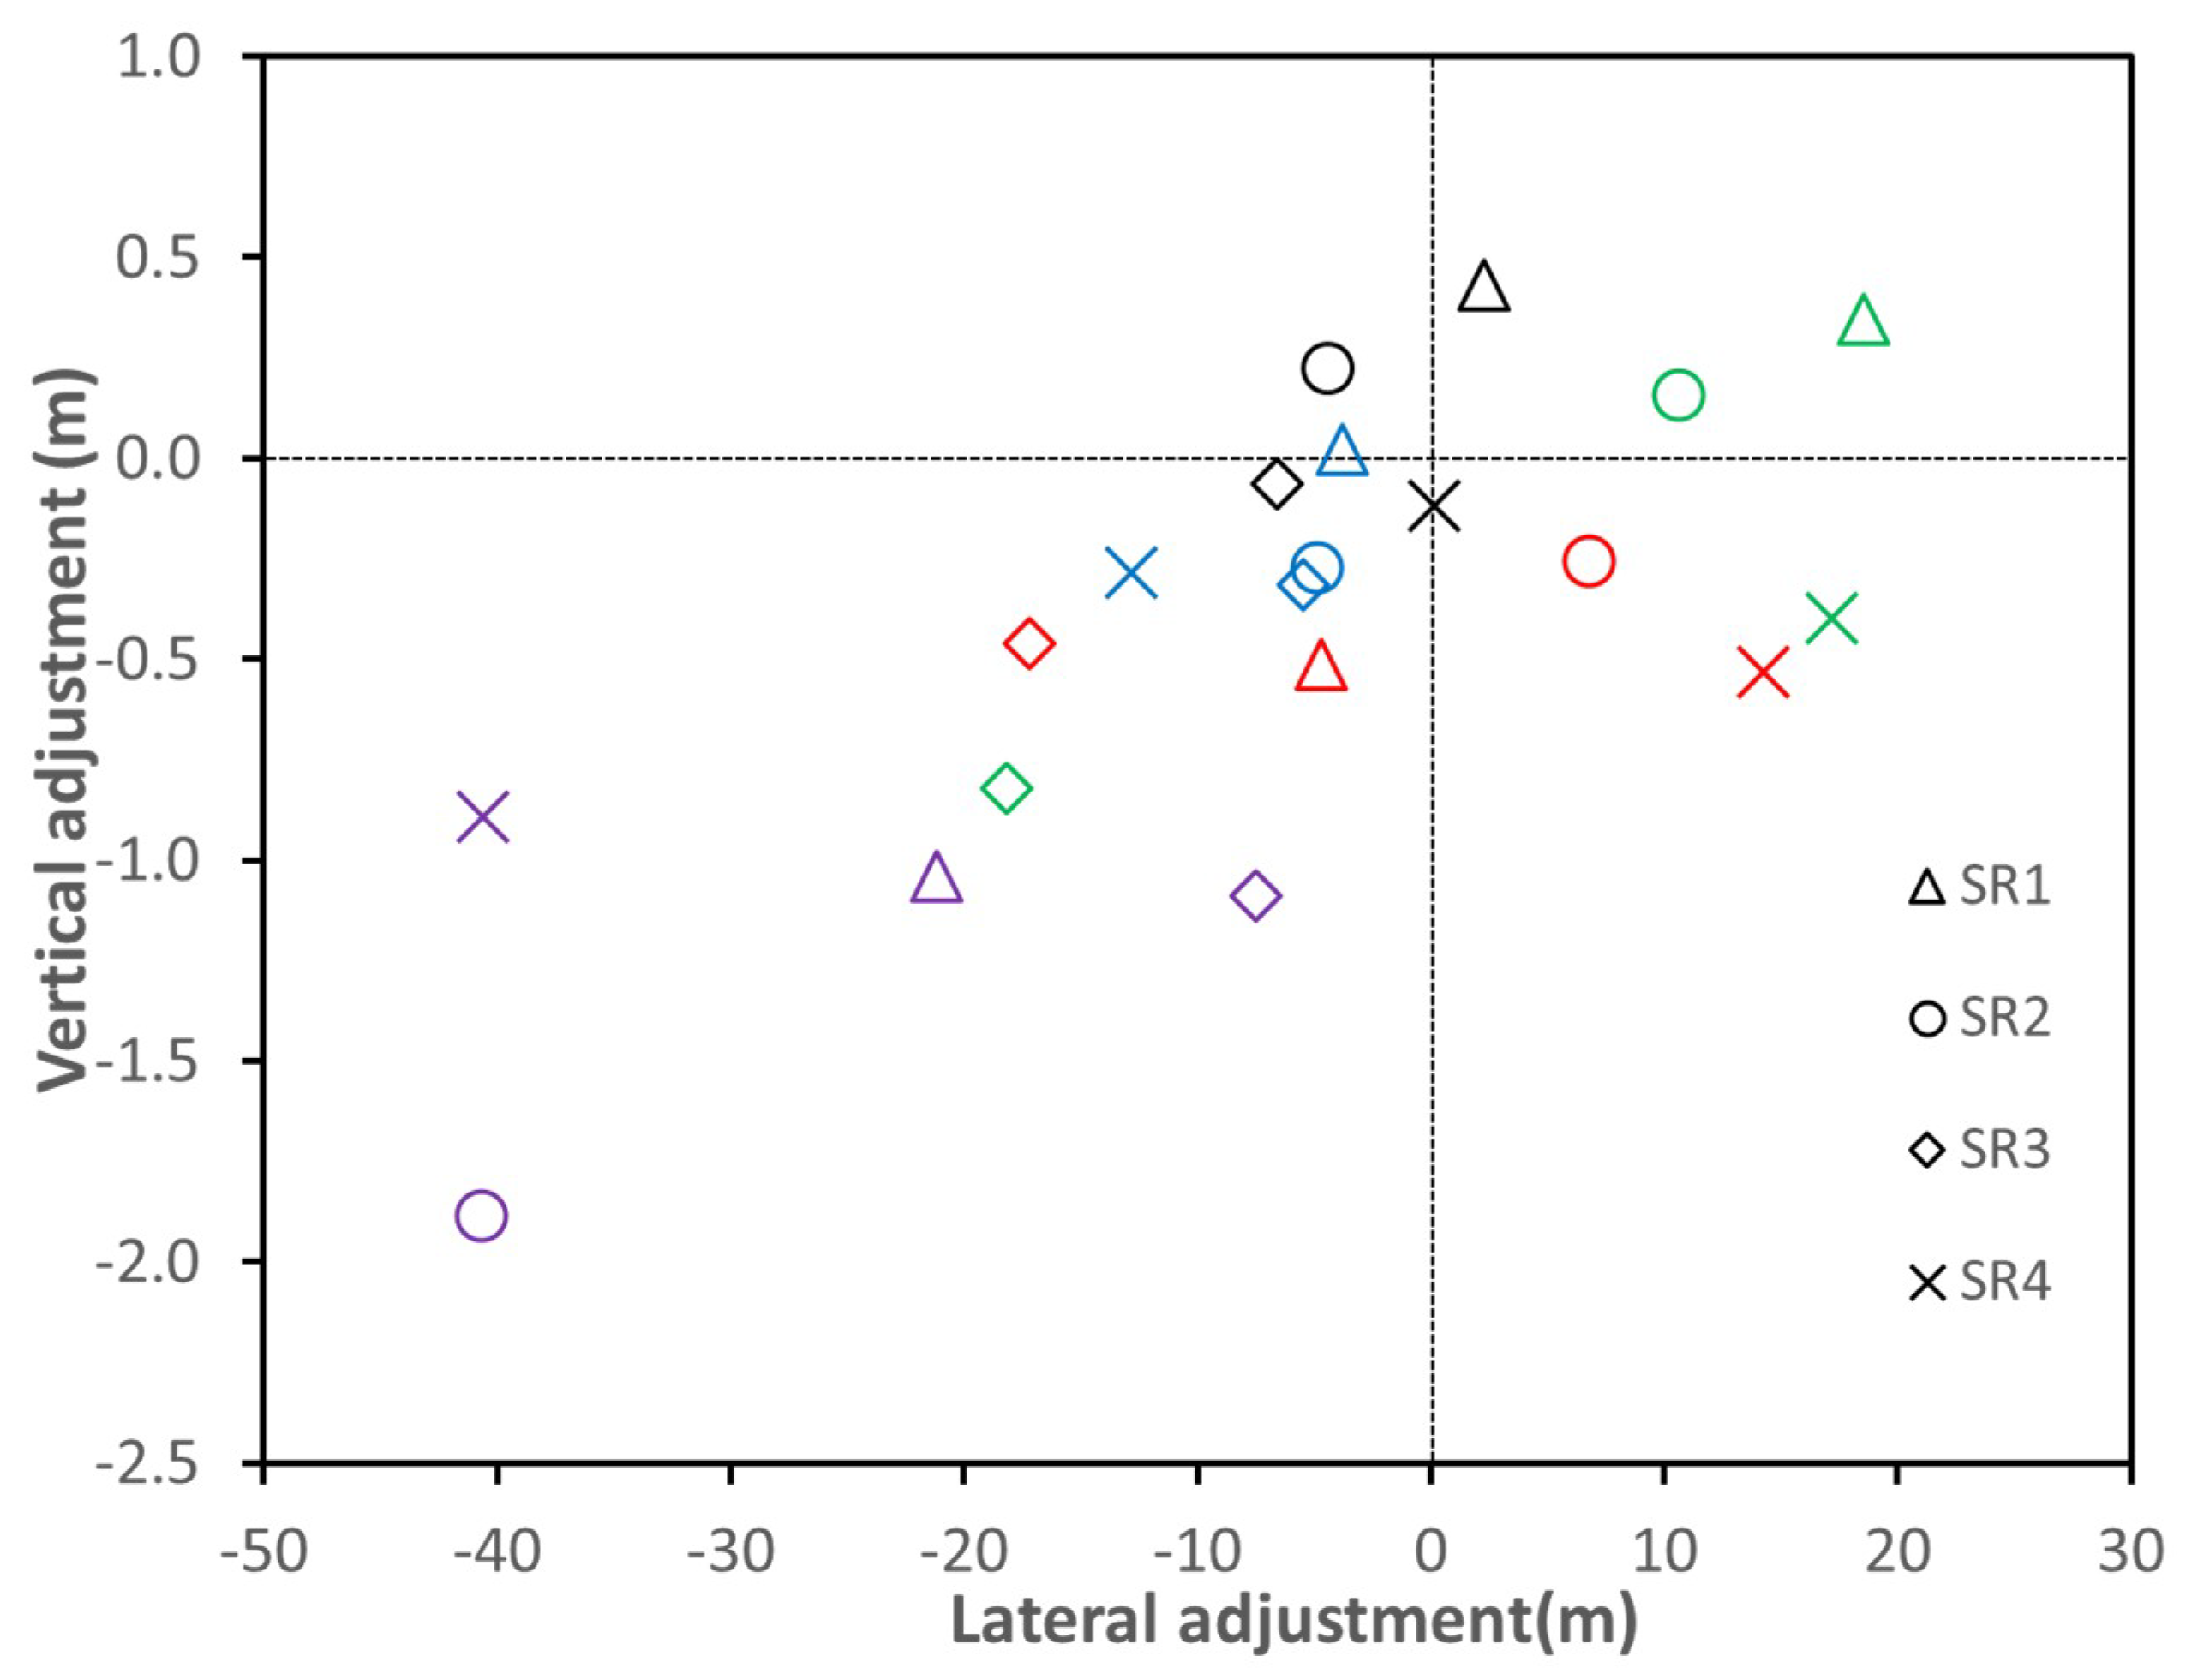
The correlation between vertical adjustment of the average elevation of cross-sections and changes of bankfull channel width in the LTR was examined for four SRs from 1950 to 2002 (Figure 11). It was observed that vertical adjustment was not statistically correlated (Spearman’s rank correlation p >> 0.05) with the corresponding lateral adjustment at four SRs. In SR 1, some sections showed channel incision together with narrowing, while others showed widening and channel deposition. A lower riverbed elevation made the flow more concentrated in the main course of the channel, leading to a decreased bankfull channel width. In contrast, an increased riverbed elevation made the flow more dispersed, inducing an increased bankfull channel width. Similarly, channel incision and narrowing simultaneously occurred during four phases at SR 3. This coupled tendency of the LTR is similar to that of some Italian rivers, including the Piave, the Po, and the Tevere [19]. In this case, the riverbank protection implemented earlier was considered to be effective as a countermeasure against the instability of the riverbank induced by river degradation. The embankment confined the river channel, resulting in no widening due to bank failure in the LTR in SR 1 and SR 3. The early presence of bank protection along the LTR might have triggered the erosion in the riverbed.
Besides the coupled tendency observed at SR 1 and SR 3, SR 2 and SR 4 still experienced channel widening and incision at the same time. This phenomenon can be explained by considering that the sediment supply coming from upstream reaches was decreased due to the low connectivity with the mountain reach. In addition, the severe incision could have induced a very coarse sublayer (Figure 9), and the bed was armored. This mechanism led to erosion of the banks rather than further incision of the channel.
4.9. Role of SSP in Vertical Adjustment
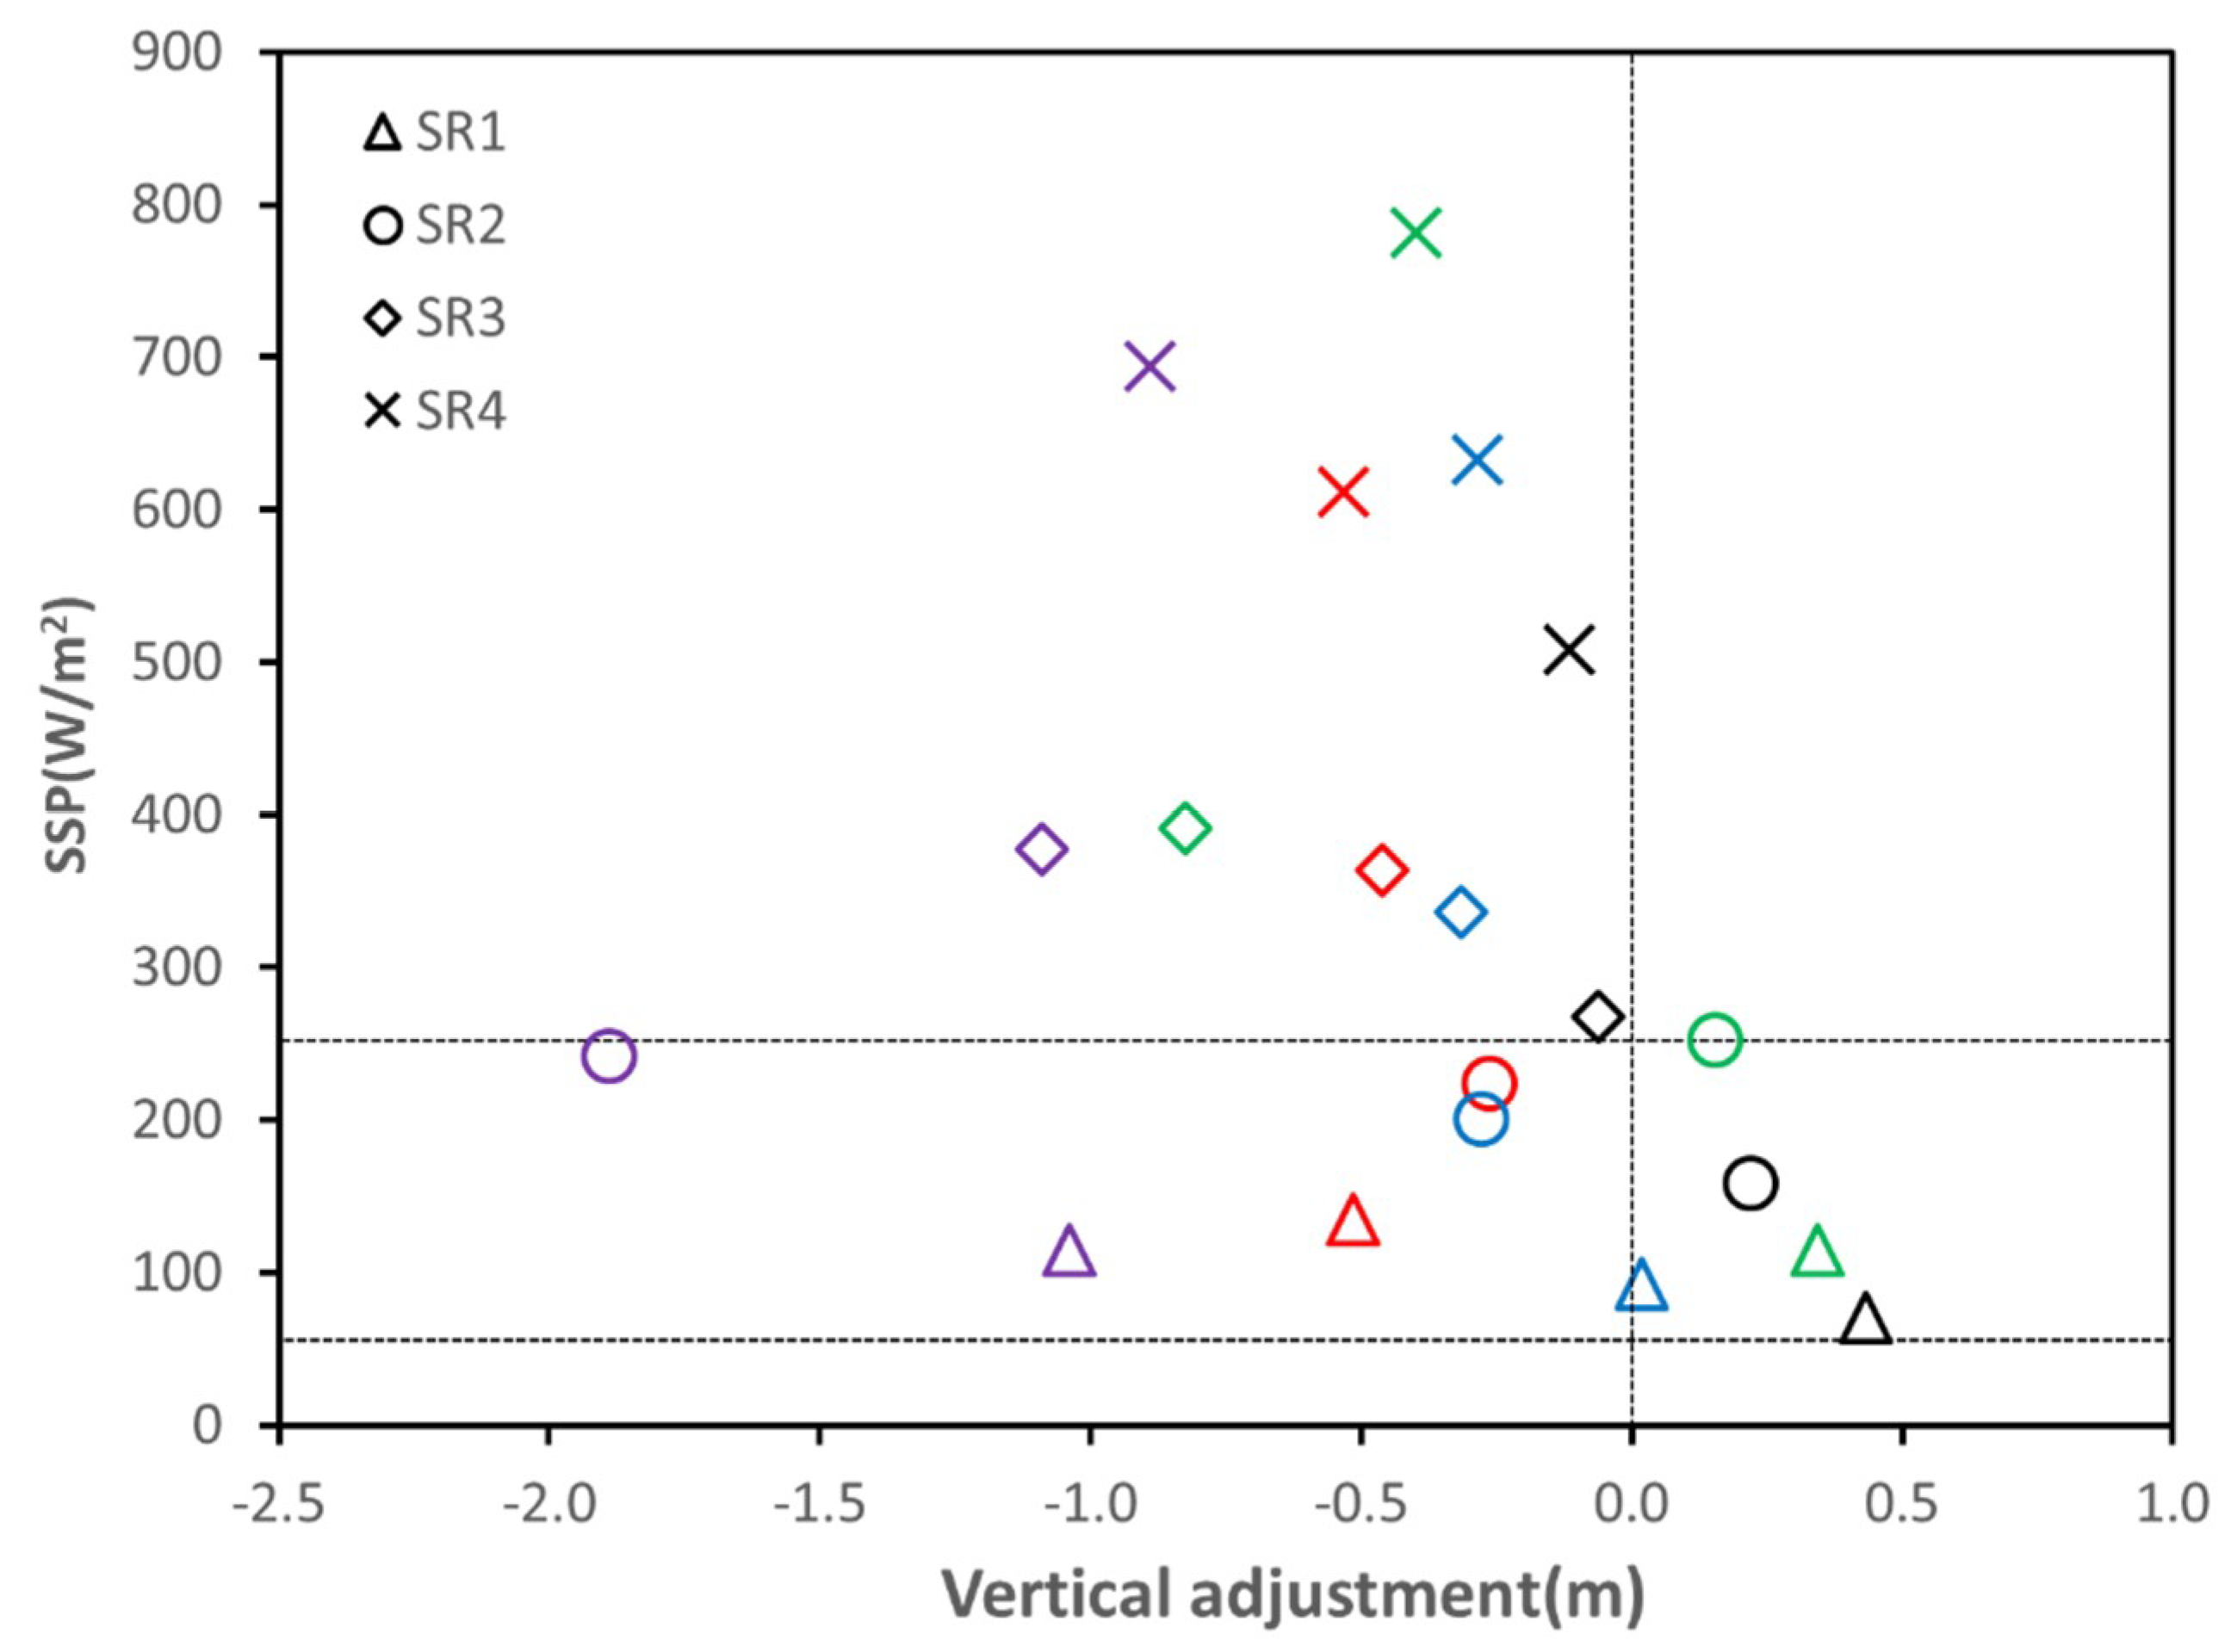
Spatial variation in SSP and its association with vertical adjustment are shown in Figure 12. The results indicate that SSP was scattered in SR 3 and SR 4 but concentrated in SR 1 and SR 2. It seems that erosion was featured in SR 3 and SR 4 when SSP was greater than 231 W/m2. With SSP less than 231 W/m2, both deposition and incision were observed at SR 1 and SR 2. The SSP threshold of 60 W/m2 could be considered as the minimum energy to trigger the formation of erosion features. This value is higher than the threshold of transition from erosion to deposition between 30 and 35 W/m2 published previously [20]. Statistical correlation between SSP and vertical adjustment was examined using Spearman’s correlation, which is a statistical measure of the strength of a monotonic relationship between paired data. A strongly negative correlation (ρ = −0.9, p-value < 0.1) was observed at SR 3. No statistically significant correlation between SSP and vertical adjustment was identified at the other three SRs (p >> 0.1). Therefore, statistical correlation between SSP and vertical adjustment varied at different SRs.
4.10. Relationship between TSP and Sediment Diameter
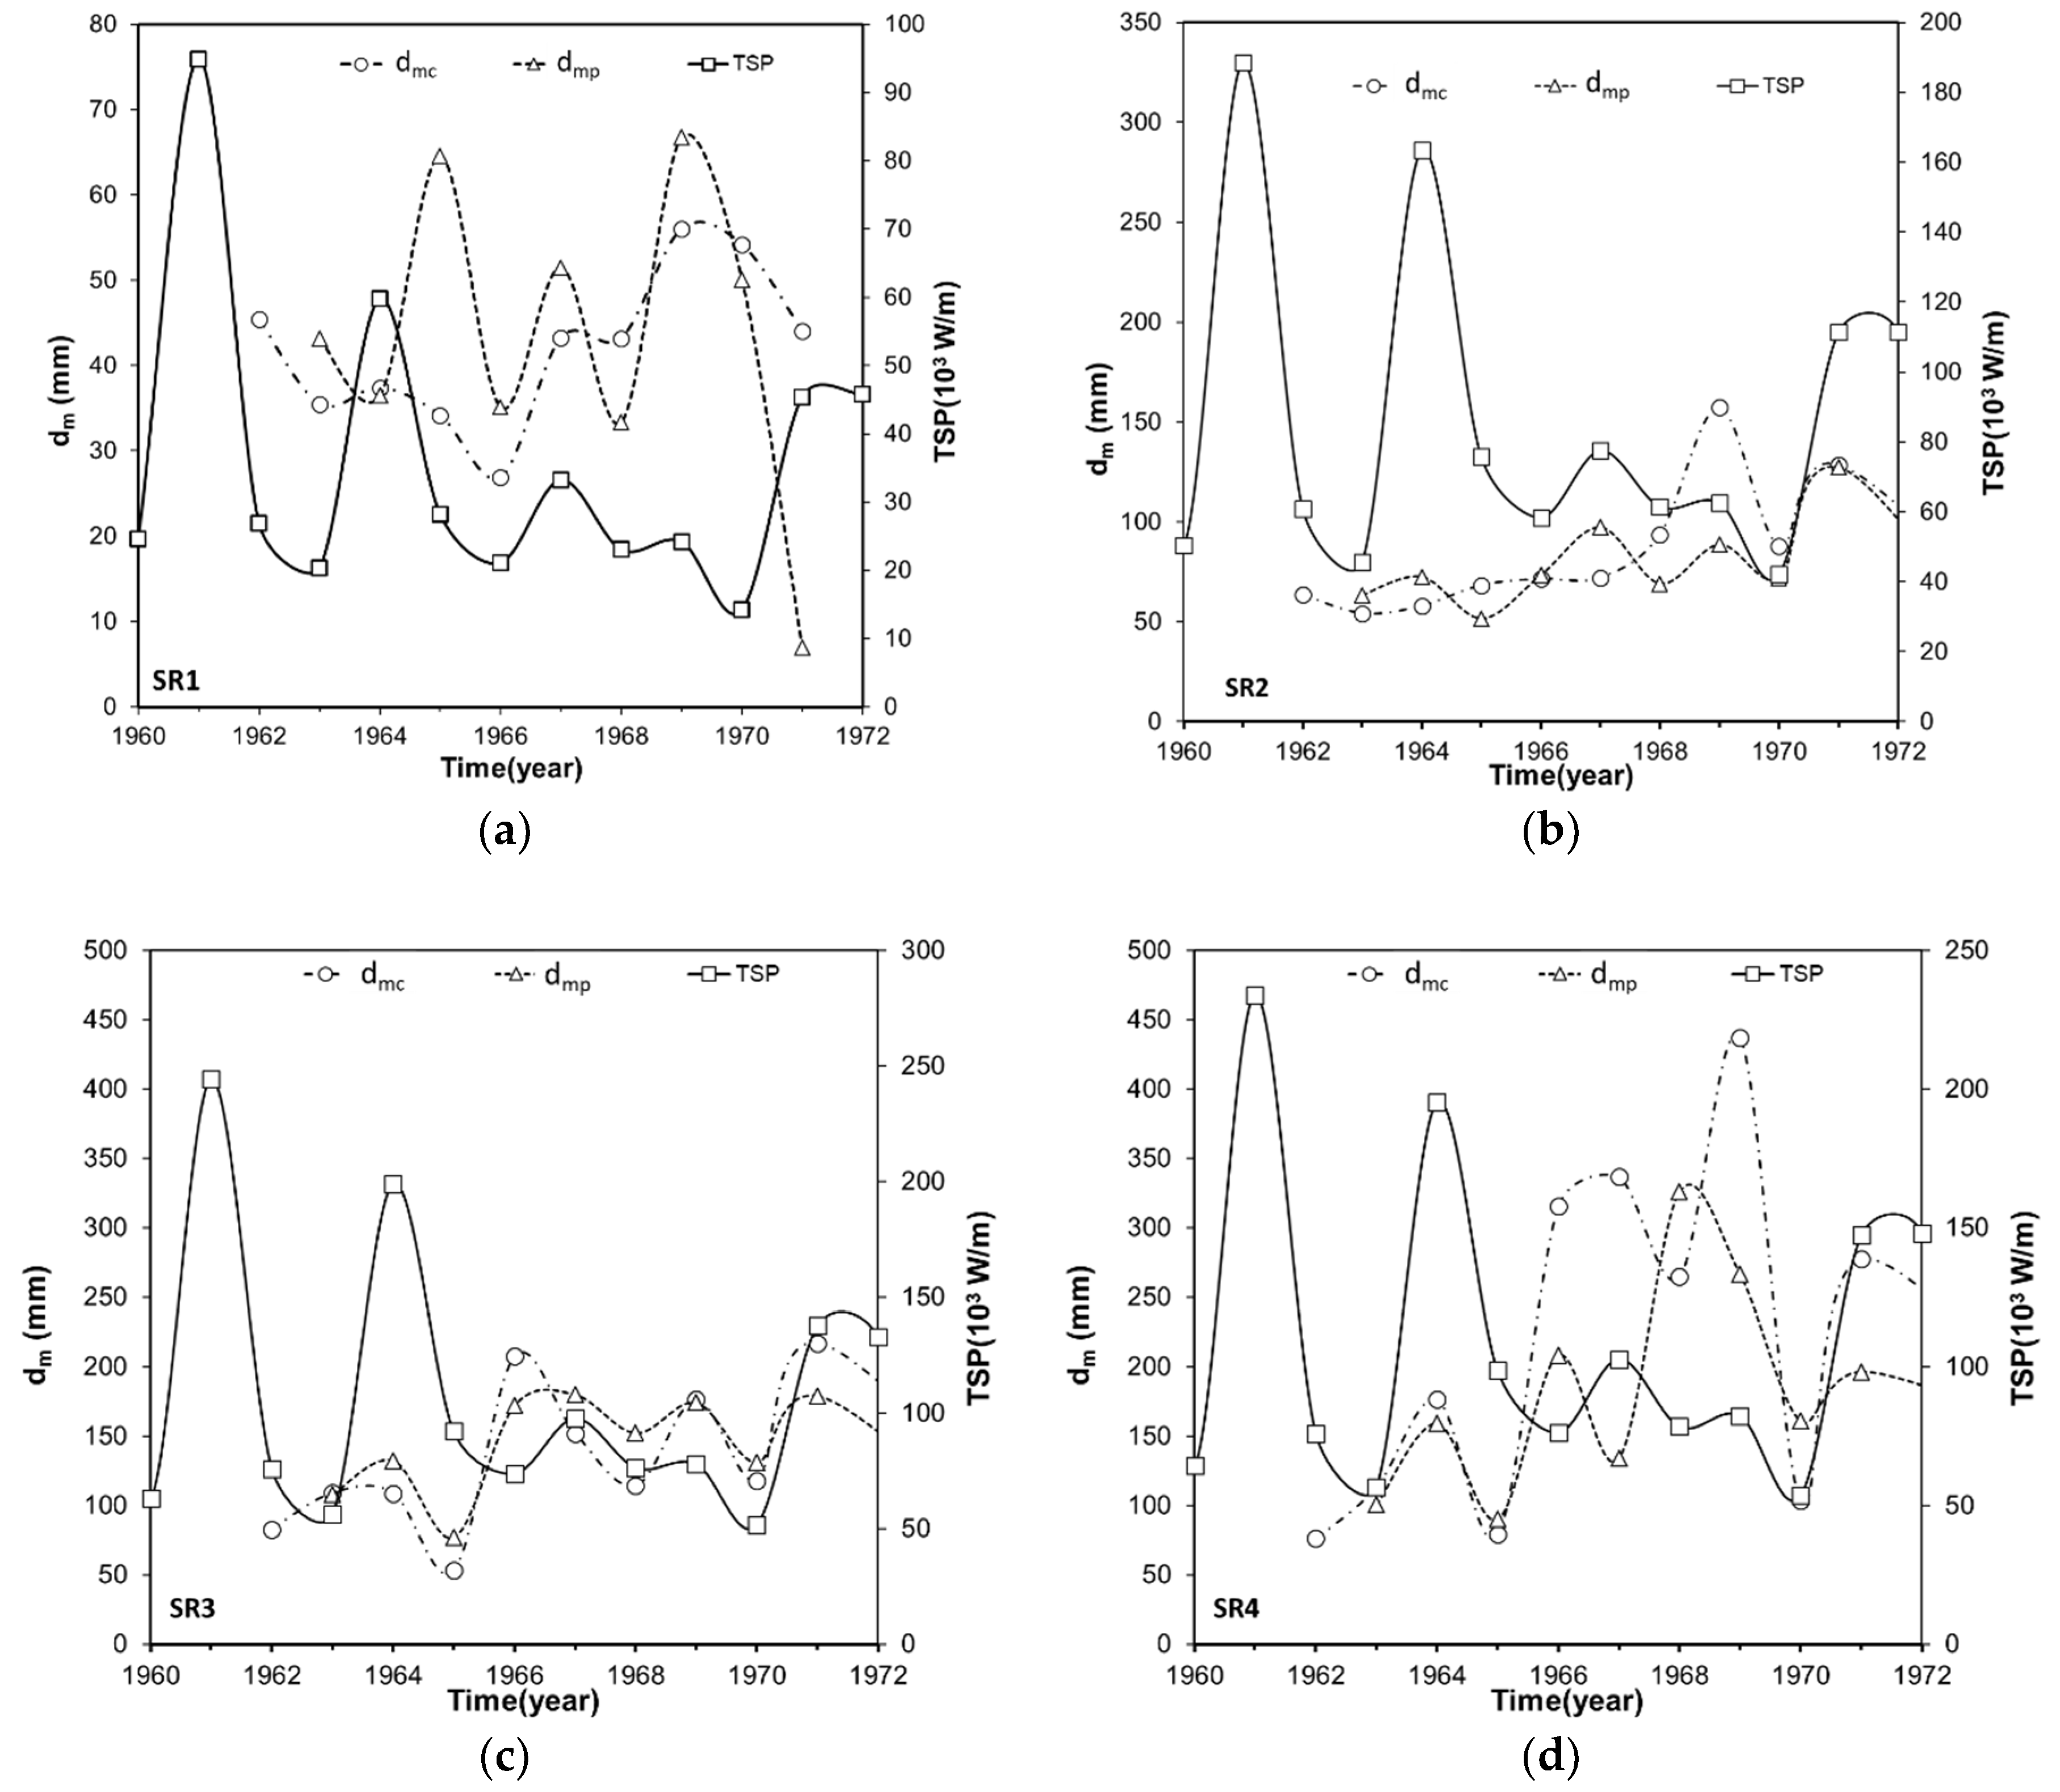
Variation in median sediment diameter (dm) in both the river channel and the flood plain was examined in relation to SGM, based on available annual surveys of sediment samples from 1963 to 1971. Figure 13 shows temporal variation in dm in relation to temporal variation in TSP. In SRs 1, 2, and 3 (Figure 13a–c), temporal variation in both dmc (median sediment diameter in the river channel) and dmp (median sediment diameter in the lateral area) is closely related to temporal variation in TSP during 1963–1971. In SR 4 (Figure 13d), the variation in dmp had no relation to TSP from 1966 to 1969, although a close relationship was also observed between dmc and TSP from 1963 to 1971. In particular, in 1966 and 1968, when the minimum values of TSP were measured, maximum values of dmp were recorded (Figure 13d). The results of Spearman’s correlation analysis between TSP and dmc and dmp revealed no statistical correlation between them (|ρ| < 0.5, p >> 0.1). This unusual relationship could be related to the effect of intensive SGM in the lateral area of SR 4, as gravel and sand extraction might have made the bed surface more armored.
4.11. Relationship between River Pattern and Other River Characteristics
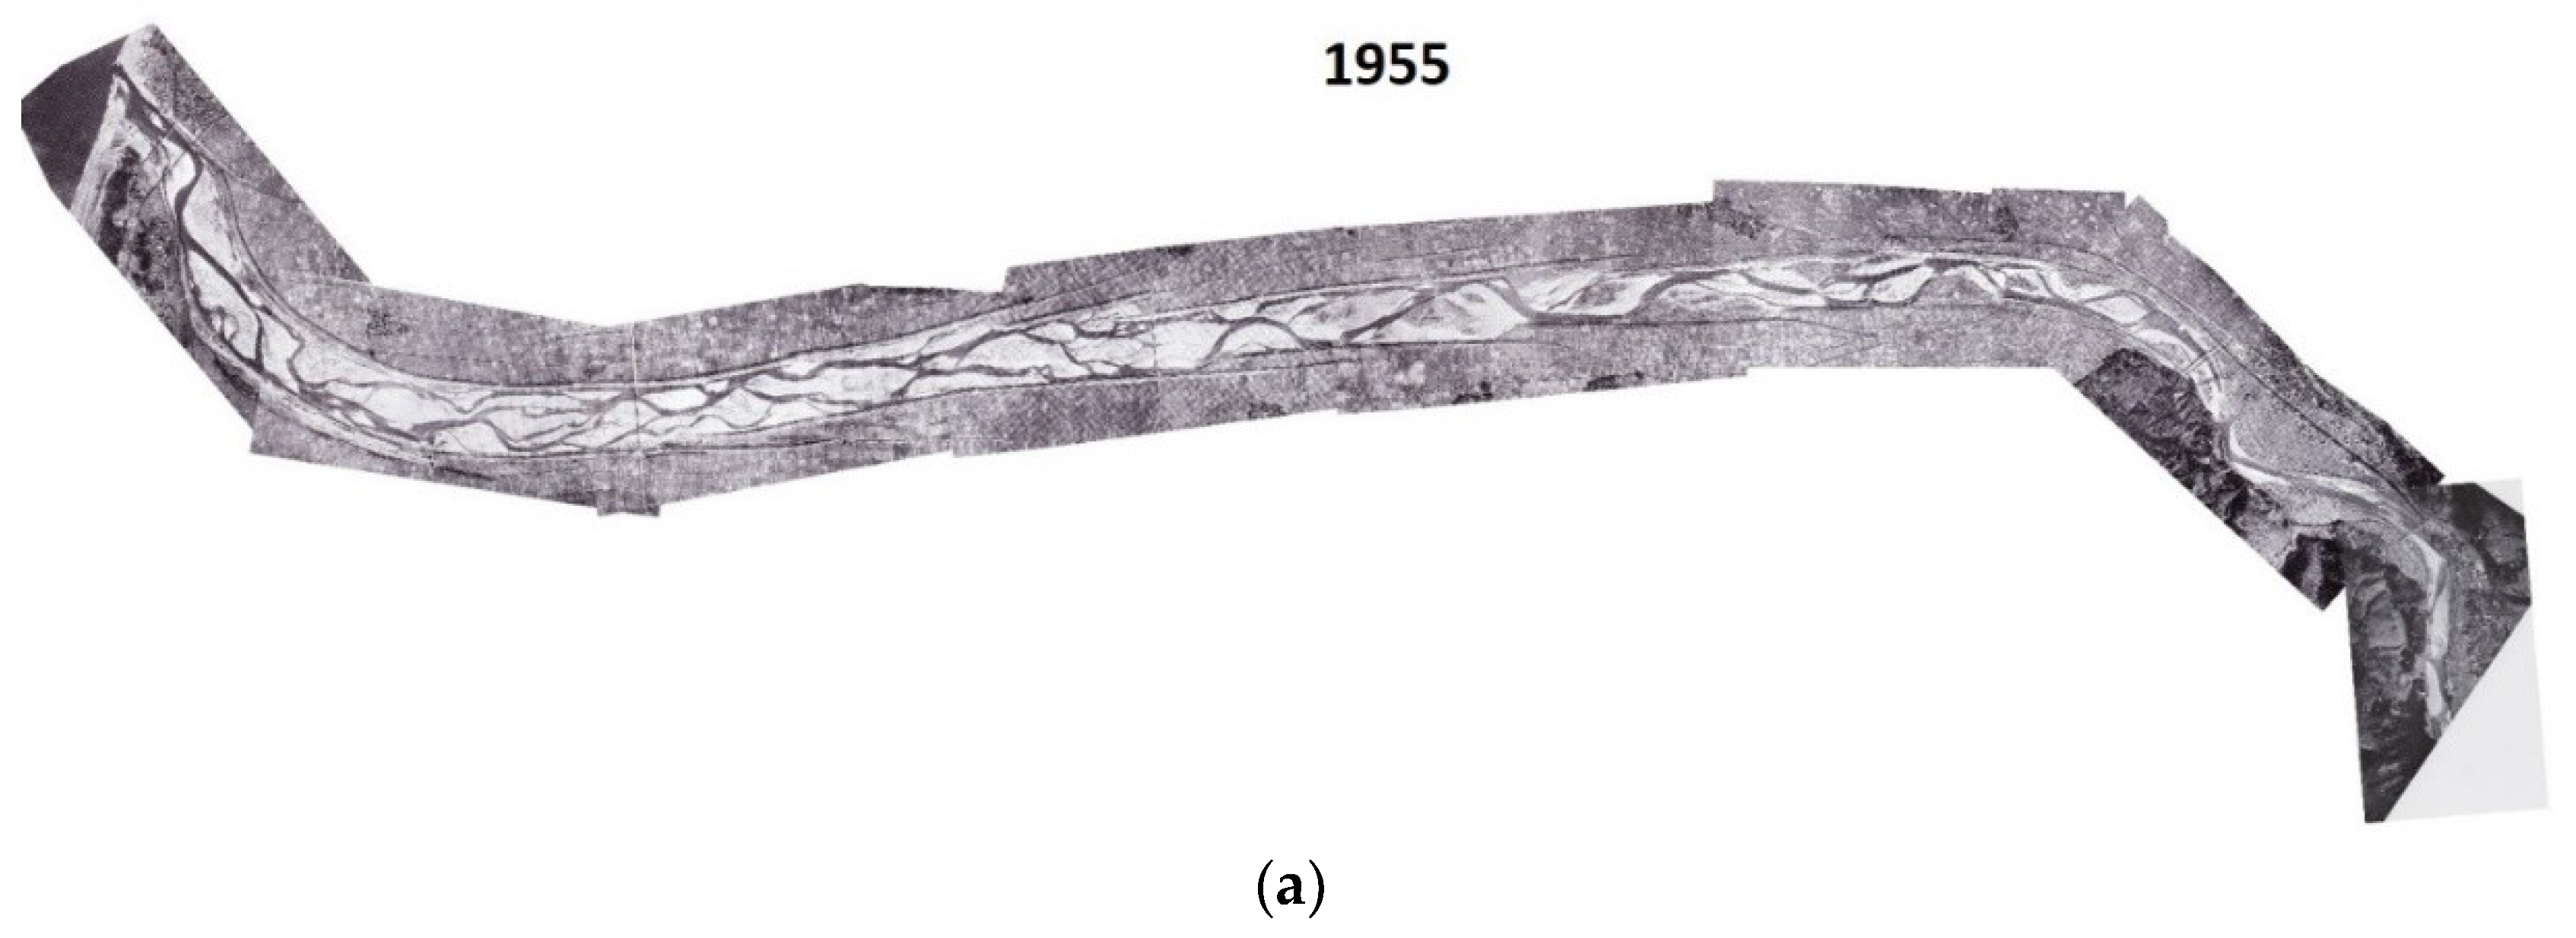
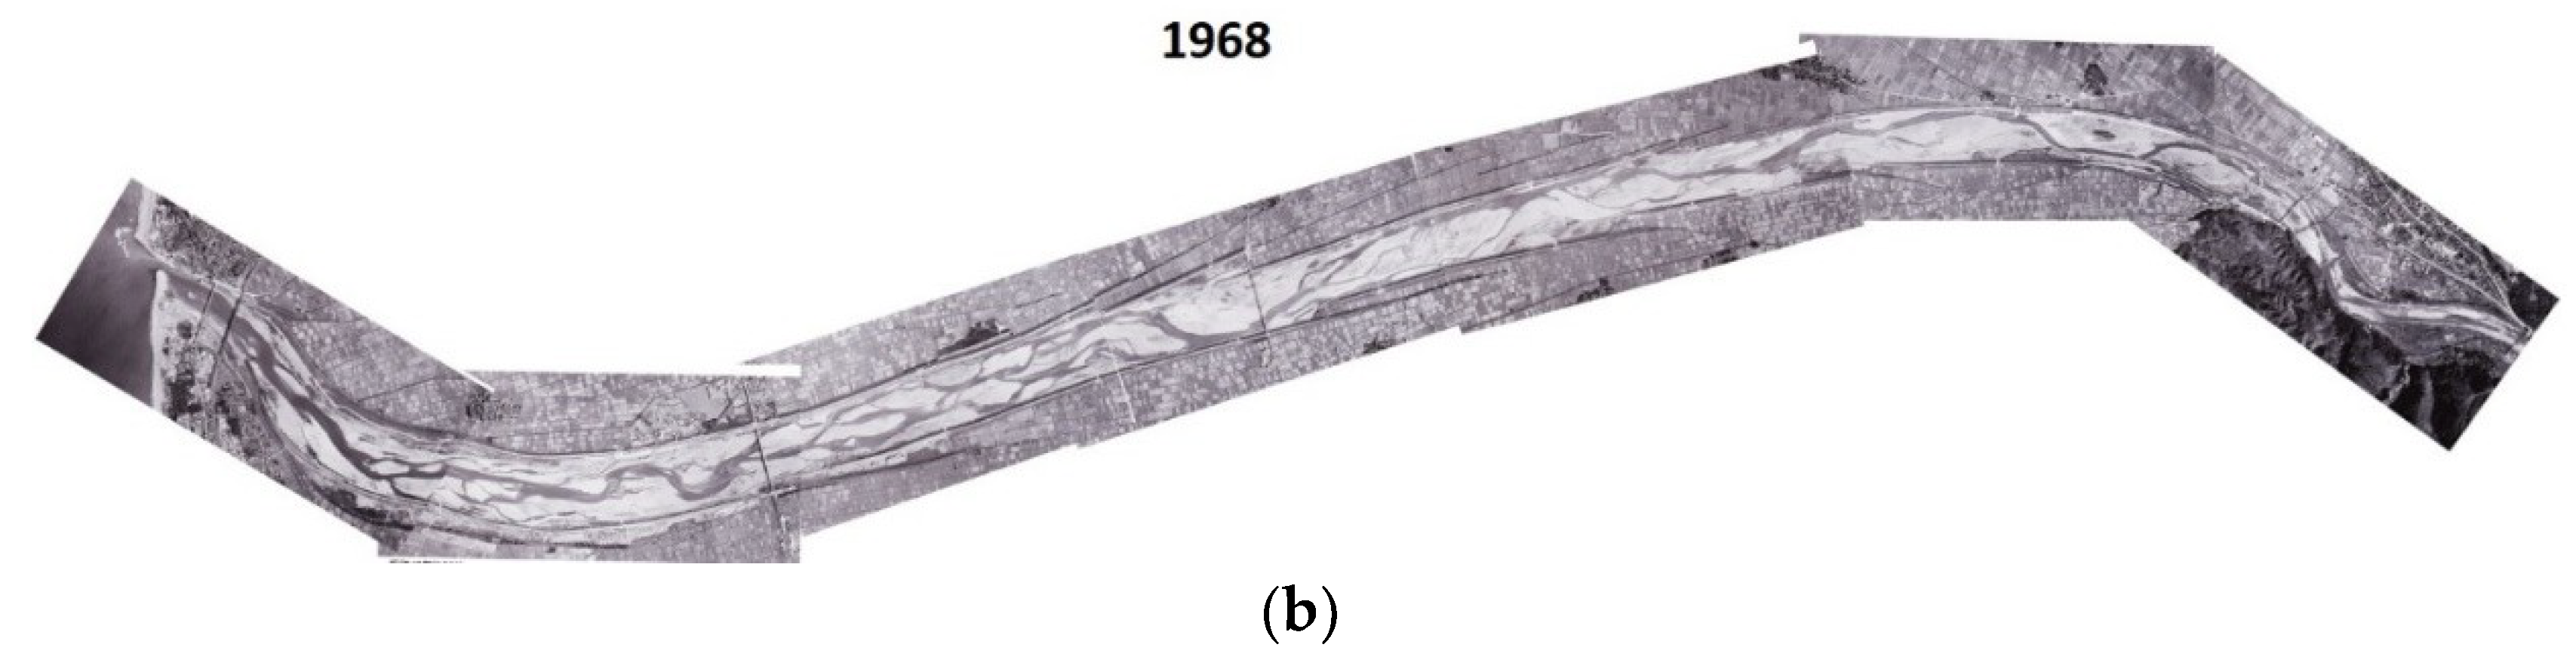
Finally, variation in the river configuration of the LTR was observed based on sequential aerial photographs at a scale of 1:15,000 for 1955, 1968, 1984, 1995, and 2000 (only photographs for 1955 and 1968 are shown in Figure 14). Commonly, a braided pattern was observed. In general, the braided pattern of a river is formed as a result of local sorting and deposition of coarse material that cannot be locally transported. The coarse material grows into a central bar and subsequently an island [21]. The braided pattern of the LTR was studied based on slope, bankfull discharge, and mean sediment diameter. According to the studies of Leopold and Wolman [22] and Henderson [23], the river pattern becomes braided if the river slope (S) is greater than the critical slope (S*):
S > S*
Here, based on the available data of slopes, mean annual and bankfull discharge, and mean sediment diameter, the patterns of the Tedori River were estimated according to Equation (4) for several periods (Table 1). From Table 1, it was deduced that, despite significant degradation due to SGM, the LTR had a braided pattern in all examined periods.
Overall, a series of findings obtained in this study through comprehensive inter-correlated analysis are of significance for a better understanding of how river channels respond to human impacts such as SGM and dam operation.
5. Conclusions
A better understanding of changes in river morphology is fundamental to enable the sustainable management of river basins. The present study conducted a comprehensive analysis of a 58-year topographic survey of the LTR in Japan and related data on human impact to clarify the long-term variation in morphological characteristics. The empirical model successfully described vertical adjustment of the LTR in five phases. The nonlinear rate extracted from the empirical model fully captured the characteristics of vertical adjustment of the LTR. The principal features observed in this study are summarized as follows: Degradation occurred at SR 3 and SR 4 over all phases. Aggradation and degradation phases appeared alternately at SR 2. Aggradation phases following degradation phases were observed at SR 1. These are the typical responses of gravel-bed rivers in Japan where SGM has been prohibited. It is also shown that variation in bankfull width was accompanied by variation in riverbed elevation; specifically, decreased bankfull width was generally coupled with riverbed degradation, and increased bankfull width was coupled with riverbed aggradation. The river pattern is deduced to have stayed braided during the period 1950–2000 as a result of mutual interaction among high slopes, mean sediment diameter, and bankfull discharge. The findings obtained in the present study will provide basic scientific/engineering information for the effective management of the river. The obtained results are also useful as they can be used to understand and compare the behavior of other rivers of a similar type over the world.
Author Contributions
The authors designed the framework for the analysis together: D.M.H. analyzed the data and wrote the manuscript; S.U. collected the data and provided suggestions and improvements to the manuscript; M.Y. guided the study and provided the suggestions and improvements to the manuscript. All authors read and approved the manuscript.
Funding
The study was partially supported by a Grant-in-Aid for Scientific Research from the Japan Society for the Promotion of Science.
Acknowledgments
The authors are grateful to the Hokuriku Regional Development Bureau, Ministry of Land, Infrastructure, Transport, and Tourism of Japan, for providing the field data.
Conflicts of Interest
The authors declare no conflict of interest.
References
- Simon, A. A model of channel response in disturbed alluvial channels. Earth Surf. Process. Landf. 1989, 14, 11–26. [Google Scholar] [CrossRef]
- Rinaldi, M.; Simon, A. Bed-level adjustments in the Arno River, central Italy. Geomorphology 1998, 22, 57–71. [Google Scholar] [CrossRef]
- Oguchi, T.; Saito, K.; Kadomura, H.; Grossman, M. Fluvial geomorphology and paleohydrology in Japan. Geomorphology 2001, 39, 3–19. [Google Scholar] [CrossRef]
- Yoshimura, C.; Omura, T.; Furumai, H.; Tockner, K. Present state of rivers and streams in Japan. River Res. Appl. 2005, 21, 93–112. [Google Scholar] [CrossRef]
- Huang, G. Time lag between reduction of sediment supply and coastal erosion. Int. J. Sediment Res. 2011, 26, 27–35. [Google Scholar] [CrossRef]
- Sato, S.; Kajimura, T.; Abe, M.; Isobe, M. Sand Movement and Long-Term Beach Evolution in a Fluvial System Composed of the Samegawa River and the Nakoso Coast. Coast. Eng. J. 2004, 46, 219–241. [Google Scholar] [CrossRef]
- Dang, M.H.; Umeda, S.; Yuhi, M. Long-term riverbed response of lower Tedori River, Japan, to sediment extraction and dam construction. Environ. Earth Sci. 2014, 72, 2971–2983. [Google Scholar] [CrossRef]
- Dang, M.H.; Yuhi, M.; Umeda, S. Human Impact on Morphology and Sediment Budget in the Tedori River, Japan; Advances in River Sediment Research; CRC Press: Boca Raton, FL, USA, 2013; pp. 289–297. [Google Scholar]
- Teramoto, A.; Nakamura, S.; Tsujimoto, T. Change of bar formation and bank erosion in the Tedori River. Adv. River Eng. JSCE 2003, 9, 329–334. [Google Scholar]
- Yamamoto, Y.; Kawai, K.; Takan, T. Sedimentation control of coastal zone with large-scale sandy beach. Proc. Civ. Eng. Ocean JSCE 2008, 24, 1339–1344. (In Japanese) [Google Scholar] [CrossRef]
- Leopold, L.B. A View of the River; Harvard University Press: Cambridge, MA, USA, 1994. [Google Scholar]
- Jang, C.-L.; Shimizu, Y. Numerical Simulation of Relatively Wide, Shallow Channels with Erodible Banks. J. Hydraul. Eng. 2005, 131, 565–575. [Google Scholar] [CrossRef] [Green Version]
- Bagnold, R.A. Bed load transport by natural rivers. Water Resour. Res. 1977, 13, 303–312. [Google Scholar] [CrossRef]
- Alekseevskiy, N.; Berkovich, K.; Chalov, R. Erosion, sediment transportation and accumulation in rivers. Int. J. Sediment Res. 2008, 23, 93–105. [Google Scholar] [CrossRef]
- Collins, B.D.; Dunne, T. Gravel transport, gravel harvesting, and channel-bed degradation in rivers draining the southern olympic mountains, Washington, U.S.A. Environ. Earth Sci. 1989, 13, 213–224. [Google Scholar] [CrossRef]
- Kondolf, G.M. Geomorphic and environmental effects of instream gravel mining. Landsc. Urban Plan. 1994, 28, 225–243. [Google Scholar] [CrossRef]
- Rinaldi, M.; Wyżga, B.; Surian, N. Sediment mining in alluvial channels: Physical effects and management perspectives. River Res. Appl. 2005, 21, 805–828. [Google Scholar] [CrossRef]
- Lane, E.W. The importance of fluvial morphology in hydraulic engineering. Am. Soc. Civ. Eng. Proc. 1955, 81, 1–17. [Google Scholar]
- Surian, N.; Rinaldi, M. Morphological response to river engineering and management in alluvial channels in Italy. Geomorphology 2003, 50, 307–326. [Google Scholar] [CrossRef]
- Bizzi, S.; Lerner, D.N. The Use of Stream Power as an Indicator of Channel Sensitivity to Erosion and Deposition Processes. River Res. Appl. 2015, 31, 16–27. [Google Scholar] [CrossRef]
- Akhtar, M.; Sharma, N.; Ojha, C. Braiding process and bank erosion in the Brahmaputra River. Int. J. Sediment Res. 2011, 26, 431–444. [Google Scholar] [CrossRef]
- Leopold, L.B.; Wolman, M.G. River Channel Pattenrs: Rraided, Meandering and Straight; Physiographic and Hydraulic Studies of Rivers, Geological Survey Professional Paper 282-B; United States Government Pringing Office: Washington, DC, USA, 1957; p. 85.
- Henderson, F.M. Stability of Alluvial Channels. J. Hydraul. Div. 1963, 87, 109–138. [Google Scholar]
Figure 1.
Study area.

Figure 2.
Fitting exponential equations to temporal vertical adjustment at the 62nd cross-section.

Figure 3.
Vertical adjustment of riverbed elevation: (a) vertical adjustment in the period from 1950–2007, (b) vertical adjustment in phase I, (c) vertical adjustment in phase II, (d) vertical adjustment in phase III, (e) vertical adjustment in phase IV, and (f) vertical adjustment in phase V.
Figure 3.
Vertical adjustment of riverbed elevation: (a) vertical adjustment in the period from 1950–2007, (b) vertical adjustment in phase I, (c) vertical adjustment in phase II, (d) vertical adjustment in phase III, (e) vertical adjustment in phase IV, and (f) vertical adjustment in phase V.

Figure 4.
Temporal and spatial variations in nonlinear rate of vertical adjustment (b-value).


Figure 5.
Temporal and spatial variations in interquartile range of the vertical adjustment rate.

Figure 6.
Superimposed cross-sectional profiles of the Tedori River at four cross-sections for 1950, 1979, and 2007. (River kilometers mentioned here are referred from the river mouth. Elevation was measured relative to Tokyo Peil (TP), the standard ground elevation in Japan based on the mean sea level of Tokyo Bay).

Figure 7.
Temporal trends of average channel width in four subreaches.

Figure 8.
Temporal and spatial variations in sediment mean diameter in (a) main course and (b) lateral area.
Figure 8.
Temporal and spatial variations in sediment mean diameter in (a) main course and (b) lateral area.

Figure 9.
Spatial and temporal variations in slopes.

Figure 10.
Spatial and temporal variations in (a) total stream power (TSP) and (b) specific stream power (SSP).
Figure 10.
Spatial and temporal variations in (a) total stream power (TSP) and (b) specific stream power (SSP).

Figure 11.
Relationship between change in riverbed elevation and change in bankfull width. (Red means phase I; purple means phase II; green means phase III; blue means phase IV; black means phase V).
Figure 11.
Relationship between change in riverbed elevation and change in bankfull width. (Red means phase I; purple means phase II; green means phase III; blue means phase IV; black means phase V).

Figure 12.
Relationship between specific stream power (SSP) and vertical adjustment. (Red means phase I; purple means phase II; green means phase III; blue means phase IV; black means phase V).
Figure 12.
Relationship between specific stream power (SSP) and vertical adjustment. (Red means phase I; purple means phase II; green means phase III; blue means phase IV; black means phase V).

Figure 13.
Temporal variation in total stream power and sediment mean diameter (dm) of lower Tedori River (LTR).
Figure 13.
Temporal variation in total stream power and sediment mean diameter (dm) of lower Tedori River (LTR).

Figure 14.
Comparison of aerial photographs of LTR over two dates.


Table 1.
Patterns of the Tedori River for several periods.
| No. | Period | Patterns of Tedori River | |
|---|---|---|---|
| S* = 0.013 (Qb)−0.44 [22] | S* = 0.002 d501.15 Qb−0.46 [23] | ||
| 1 | 1950–1961 | Braided | N/A |
| 2 | 1962–1971 | Braided | Braided |
| 3 | 1972–1979 | Braided | N/A |
| 4 | 1991, 1993, 1997,1998, 1999, 2002, 2003, 2007 | Braided | N/A |
Note: Dates were divided based on the availability of data including slopes and median grain size of sediment. Qb, bankfull discharge (1144 m3/s for post-dam period (1980–2007) and 1755 m3/s for pre-dam period (1950–1979)); d50, median grain size of sediment in the river channel; N/A, not available.
© 2019 by the authors. Licensee MDPI, Basel, Switzerland. This article is an open access article distributed under the terms and conditions of the Creative Commons Attribution (CC BY) license (http://creativecommons.org/licenses/by/4.0/).
Share and Cite
MDPI and ACS Style
Minh Hai, D.; Umeda, S.; Yuhi, M. Morphological Changes of the Lower Tedori River, Japan, over 50 Years. Water 2019, 11, 1852. https://doi.org/10.3390/w11091852
AMA Style
Minh Hai D, Umeda S, Yuhi M. Morphological Changes of the Lower Tedori River, Japan, over 50 Years. Water. 2019; 11(9):1852. https://doi.org/10.3390/w11091852
Chicago/Turabian StyleMinh Hai, Dang, Shinya Umeda, and Masatoshi Yuhi. 2019. "Morphological Changes of the Lower Tedori River, Japan, over 50 Years" Water 11, no. 9: 1852. https://doi.org/10.3390/w11091852
Note that from the first issue of 2016, this journal uses article numbers instead of page numbers. See further details here.