Next Article in Journal
Algae Growth Distribution and Key Prevention and Control Positions for the Middle Route of the South-to-North Water Diversion Project
Next Article in Special Issue
Correction: Rasheduzzaman, M., et al. Reverse QMRA as a Decision Support Tool: Setting Acceptable Concentration Limits for Pseudomonas aeruginosa and Naegleria fowleri. Water 2019, 11, 1850
Previous Article in Journal
Treatment of a Mature Landfill Leachate: Comparison between Homogeneous and Heterogeneous Photo-Fenton with Different Pretreatments
Previous Article in Special Issue
Legionella pneumophila as a Health Hazard to Miners: A Pilot Study of Water Quality and QMRA
 
 
Correction published on 28 November 2019, see Water 2019, 11(12), 2523.
Article

Reverse QMRA as a Decision Support Tool: Setting Acceptable Concentration Limits for Pseudomonas aeruginosa and Naegleria fowleri

1
Department of Civil, Architectural and Environmental Engineering, Drexel University, 3141 Chestnut Street, Philadelphia, PA 19104, USA
2
The Biodesign Institute Center for Environmental Health Engineering & The School of Sustainable Engineering and the Built Environment, Arizona State University, Tempe, AZ 85281, USA
*
Author to whom correspondence should be addressed.
Water 2019, 11(9), 1850; https://doi.org/10.3390/w11091850
Submission received: 3 July 2019 / Revised: 27 August 2019 / Accepted: 29 August 2019 / Published: 5 September 2019
(This article belongs to the Special Issue Health Risks of Alternative Water Sources)

Abstract

:
Opportunistic premise plumbing pathogens such as Pseudomonas aeruginosa and Naegleria fowleri are a growing concern in building water systems because of their potential risks to human health. The aim of this study was to determine the critical concentrations of P. aeruginosa and N. fowleri in water that are associated with meaningful public health risks. To determine these concentrations, a reverse quantitative microbial risk assessment (QMRA) was conducted. Environmental concentrations of P. aeruginosa and N. fowleri corresponding to the risk target of one micro-disability-adjusted life year (DALY) per person per year and 10−4 annual risks of illness were calculated for several applicable exposure scenarios. To calculate the concentration of P. aeruginosa, cleaning contact lenses with potentially contaminated tap water in the absence of an appropriate cleaning solution was considered. For N. fowleri, two exposure scenarios, recreational exposure (swimming) and nasal cleansing (via the use of a neti pot™ or similar device) were considered. The highest critical concentration for P. aeruginosa was found to be 33 CFU/L with a 95% confidence interval of (2.0, 118) for the drop exposure scenario using the 10−4 annual risk target. For N. fowleri, based on the DALY approach, critical concentrations were 0.000030 N. fowleri/L for swimming and 0.00000060 N. fowleri/L for neti pot™ use scenario. Considering heat inactivation, the critical concentration limits for P. aeruginosa using the DALY approach and the 10−4 annual risk target approach were found to be 0.55 CFU/L and 55 CFU/L, respectively. For N. fowleri, the 10−4 annual risk target approach resulted in 0.022 N. fowleri/L and the DALY approach resulted in 0.00000064 N. fowleri/L for the neti pot™ scenario. For P. aeruginosa, N50 (the median infective dose) and alpha (α) contributed the most and contact rates the least to the variability and uncertainty of the estimates for all the scenarios. For N. fowleri, N50 and contact rates contributed the most and α the least to the variability and uncertainty to calculate the concentrations for all the scenarios. The QMRA framework implemented in this research can be used to incorporate more information regarding opportunistic pathogens to inform management decisions, and to prioritize the best interventions regarding estimated reduction in infections caused by opportunistic pathogens.

Graphical Abstract

1. Introduction

Opportunistic premise plumbing pathogens (OPPPs) such as Pseudomonas aeruginosa (P. aeruginosa), Legionella pneumophila (L. pneumophila), Mycobacterium avium (M. avium), and Naegleria fowleri (N. fowleri) can pose a serious risk to human health, and even death in some cases, when contacted through contaminated water [1,2,3]. OPPPs are responsible for a large number of infections and the risk of infections is increasing significantly day by day [2,3]. For example, the crude national incidence rate of Legionella spp. infections increased by about 350% in the United States, from 0.42 cases per 100,000 persons to 1.89 between 2000 to 2015 [4]. Nearly 40,000 hospitalizations per year have been reported in the United States and the cost of treatment for the relevant diseases (i.e., Legionnaires’ disease, cryptosporidiosis, giardiasis, non-tuberculous mycobacterial infection, and otitis externa) exceeds $900 million [5]. Previous studies have been conducted to provide risk-based boundary concentrations for L. pneumophila [6], but no such studies have been conducted for P. aeruginosa and N. fowleri to protect human health.
P. aeruginosa, a common opportunistic pathogen, has been reported to be responsible for about 17% of nosocomial pneumonia cases and 11% cases of urinary tract infection (UTI) as well as surgical site infections in the US between 1992 and 1997 [7]. Most of the P. aeruginosa infections occur among hospital patients and immunocompromised peoples through exposure to the eyes and ears [1]. Most of these infections can cause severe illness such as meningitis, UTI, community-acquired pneumonia (CAP) [8,9], and even death in extreme cases [10]. Over the years, antimicrobial drug resistance in Pseudomonas has led to serious restrictions in treatment options for such infections [1] which cause about 51,000 healthcare-related infections every year in the US [11]. The most common routes of P. aeruginosa infection are exposure to contaminated water through ingestion and skin contact; and even greater risk of infection may occur due to lung exposure through inhalation [12]. The potential scenarios of P. aeruginosa exposure include swimming in contaminated water, using contaminated hot tubs, cleaning contact lenses with contaminated tap water, and through medical equipment and medical workers in a hospital setting [12,13]. Serious P. aeruginosa infections are usually found in hospitals and/or immunocompromised people [14]. However, healthy people may also develop mild illness after exposure to contaminated water [15]. Eye infection is one of the commonly reported infections due to P. aeruginosa; particularly through the use of contaminated contact lenses [16].
Naegleria fowleri, the only species that has been known to cause primary amoebic meningoencephalitis (PAM), is a free-living amoeba that occurs naturally in soil and water and thrives at temperatures between 25 °C and 42 °C [17]. N. fowleri infections can only occur when contaminated water enters a person’s body through the nose [18]. PAM has an high fatality rate, up to 98% [19,20]. Infection occurs when N. fowleri travels through the nose into the brain through the cribriform plate and begins consuming brain cells (i.e., astrocytes and neurons) [21,22]. Only four people survived out of 143 PAM infections cases reported in the United States during the period of 1962–2017 [23,24]. Most PAM cases are reported in children and young adults with a history of swimming in naturally warm waters; however, it has also been suggested that infection can be caused by inhaling and ingesting contaminated water during bathing and neti pot™ usage [25].
Quantitative microbial risk assessment (QMRA) is the process of estimating the risk, (i.e., the probability of an adverse effect such as infection, illness, and/or death) from exposure to microorganisms, usually waterborne, foodborne, or airborne [26]. A typical QMRA approach starts with an environmental concentration of microorganisms as input and then calculates the associated risk as an output. QMRA studies are typically conducted to calculate the risk of infection and/or illness due to exposures from different concentrations/doses of waterborne pathogens [26,27,28,29,30,31,32,
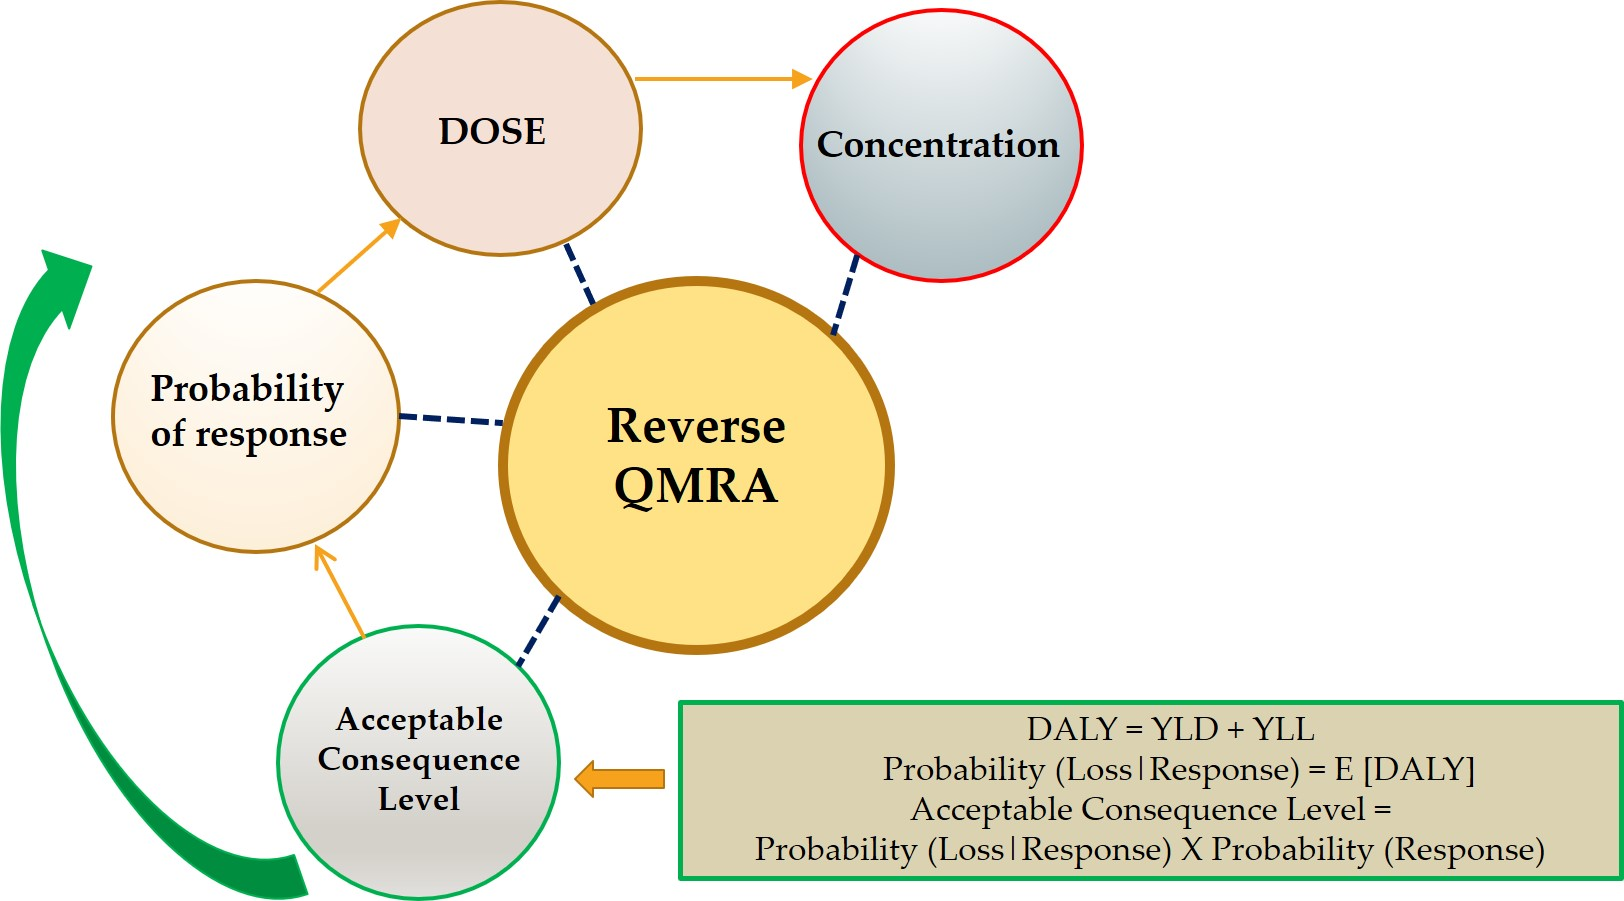
33]. At the same time, the QMRA approach can also be useful in quality control and setting microbial water quality standards where a critical level of risk (i.e., the boundary between actionable and non-actionable risk) can be used to differentiate between acceptable and unacceptable concentrations of microorganisms. The concentrations of P. aeruginosa and N. fowleri in water samples can be determined using microbiological analyses, and then the QMRA-based critical concentrations can be used in interpreting the results of microbial analyses and provide guidance on what concentrations may be considered tolerable (i.e., acceptable risks) and what action levels are required. This process of calculating the critical microbial concentration based on the critical level of risk is referred to as the “reverse QMRA” approach [6,34,35]. While potentially useful in setting up guidelines and monitoring waterborne and airborne microbial risk, reverse QMRA-based studies are rare in the literature, except Hamilton et al., (2019) [6] have recently used this approach to calculate the critical concentration of Legionella pneumophila for indoor residential water usage. To the best of our knowledge, this approach has not been applied to other waterborne opportunistic pathogens.
In this study, our goal was to use a reverse QMRA approach to calculate critical concentrations of P. aeruginosa and N. fowleri based on acceptable risk values in potable and recreational water at point of use systems. Two different health-based target risk values (i.e., 10−4 annual probability of illness [36] and 10−6 disability-adjusted life years per person per year [37]) were considered for this study. Disability-adjusted life years (DALYs) is a commonly used metric used for quantifying the burden of disease from mortality and morbidity [37]. Heating of water is used worldwide to treat and provide safe water [38]. Previous studies recommended heating of water as a sufficient measure to inactivate microbial pathogens [39]. Considering the lack of guidance on the critical concentrations of P. aeruginosa and N. fowleri, the objectives of this study were to (a) calculate the boundary concentrations of P. aeruginosa for contact lens exposure scenarios and of N. fowleri for neti pot™ use and swimming exposure scenarios based on the established target risk values using the reverse QMRA approach and (b) compare the values considering hot water vs. room temperature water usage scenario for contact lens exposure of P. aeruginosa and neti pot™ exposure of N. fowleri.

2. Materials and Methods

Reverse QMRA was used to calculate the concentration for both N. fowleri and P. aeruginosa considering two approaches. The first approach involved the calculation of the concentration corresponding to an annual expected loss of one micro-DALY. In the second approach, the annual probability of response was assumed to be 10−4. Appropriate dose–response models were then selected for both N. fowleri and P. aeruginosa based on the routes of interest and the end response. These models were then used for back-calculating the doses using the appropriate probability of response and suitable dose–response model parameters. Finally, the doses and contact rates were used for calculating the concentrations of the microorganisms. The reaction rate constant (k) was then used to find critical concentration limits for both microorganisms in advance of heat inactivation efforts.

2.1. Risk Characterization

For the DALY metric, the risk target used in this study was based on the reference value suggested by the World Health Organization [37] of one micro-DALY per person per year. The DALY reflects the cumulative number of years lost due to illness, disability, or death. In other words, one DALY is one year of healthy life lost and is calculated as per Equation (1) [37].
DALY = Y L D + Y L L
where YLD is the years lived with disability and YLL is the years of life lost. The expected value of YLD was calculated as per Equation (2) and reflects the number of years a person experienced with any disability due to illness.
E [ Y L D ] = D W × L D × P r o b [ I l l n e s s ] × ( 1 P r o b [ D e a t h | I l l n e s s ] ) + D W × L L × P r o b [ D e a t h | I l l n e s s ] × P r o b [ I l l n e s s ]
where, DW is the disability weight, LL is the average duration of the case until death (years) and LD is years lived with infection/illness for non-fatal cases.
The expected value of YLL was calculated using Equation (3):
E [ Y L L ] = P r o b [ D e a t h | I l l n e s s ] × P r o b [ I l l n e s s ] × L Y L L
where, LYLL is the standard life expectancy at age of death in years, which is calculated by subtracting the median age of infection from standard life expectancy.
Assumptions made in the expected DALYs calculation for P. aeruginosa are presented in Table 1 and for N. fowleri are presented in Table 2.
Assuming a one micro-DALY as the expected annual loss (i.e., risk target), the probability of response (i.e., illness/death) per event/use was calculated using Equation (4). Note that loss can be death, illness or infection [43].
1 × 10 6 DALY s = { E [ Y L L ] + E [ Y L D ] } × N
where N is the number of exposure events per individual annually.
For the second approach, the annual risk of illness was considered as 10−4 and used to solve for the probability of illness per exposure event (Equation (5)) [43].
P r o b [ A n n u a l   I l l n e s s ] = 1 ( 1 P r o b [ I l l n e s s / e v e n t ] ) N .
For P. aeruginosa, N for contact lens exposure was considered 365. For N. fowleri, the number of swims a person will take in a year was considered as seven [44,45] and number of neti pot™ uses per year was considered to be six. The average number of uses for a neti pot™ was a function of sick days and uses per day. In this case, it was assumed that the average person is sick four days per year and that the average number of neti pot™ uses per day while sick is 1.5, resulting in six uses per year [46,47].

2.2. Exposure Routes and Scenarios

The exposure route considered in this study was cleaning contact lenses with potentially contaminated tap water in the absence of an appropriate cleaning solution (Scenario 1). To calculate the concentration of P. aeruginosa, two different contact rate scenarios were considered. First, the volume of the water in contact with a typical contact lens was experimentally measured (Scenario 1a). Four disposable contact lenses (Alcon® Novartis, Fribourg, Switzerland) were dipped in the lab tap water. The wet weight and dry weight of each of the lenses were then measured (Sartorius ENTRIS64-1S Analytical Balance, Göttingen, Germany) three times by re-submersing them in water and blotting them dry with Kim wipes (Kimberly-Clark Corporation, Texas, TX USA) after each measurement. The mean contact volume (0.031 mL ± 0.0045, n = 4) was then calculated by averaging the weight difference between the wet and dry contact lenses and dividing by the density of water. A mean contact rate of 0.062 mL/use was finally calculated by doubling the measured value for a single lens to account for the fact that most users will use two contact lenses. A triangular distribution with a minimum value of 0.052 mL/use and a maximum value of 0.07 mL/use was based on the lower and upper bound of the experimental measurements. In the second method, the contact rate was estimated based on the assumption that drops of contaminated water will be struck to the surface of the contact lens (Scenario 1b). Again, a triangular distribution was assumed with the likeliest value of 0.05 mL/event (i.e., one drop) and minimum and maximum values of 0.01 mL/event and 0.15 mL/event (i.e., three drops), respectively. The scenario to calculate the probability of loss given infection was based on losses due to illness. The scenario assumed that no death occurs.
In case of N. fowleri two exposure scenarios, recreational exposure (swimming) (Scenario 2) and nasal cleansing (via the use of a neti pot™ or similar device) (Scenario 3) were considered. For the swimming scenario, i.e., Scenario 2, infections occurred only from the instillation of N. fowleri into the nasal passages. Due to lack of nasal instillation rate data in literature for Scenario 2, in this study, nasal instillation rate was calculated based on the assumption that it follows a triangular distribution defined by the likeliest value of 1 mL/event with lower and upper bound values of 0.1 mL/event and 10 mL/event, respectively. Scenario 3 looked at the exposure as a result of using a neti pot™. It was assumed that the subject would use the neti pot™ as prescribed and be exposed to the entire volume of a neti pot™ of 240 mL [48]. Nasal instillation rate for this scenario was also calculated using a triangular distribution defined by the likeliest value of 180 mL/use and lower and upper bound values of 120 mL/use and 240 mL/use, respectively. Different neti pots™ hold a different volume of saline solution (200–240 mL) and the entire volume may not be filled, and the filled volume may not be used in its entirely.

2.3. Dose–Response Modeling

The beta-Poisson model has been reported as the best fit dose–response model for P. aeruginosa [49] with the end response of corneal ulceration. The optimized model parameters values were used in this study that corresponded to the model parameters values obtained from pooled data from experiments 297 and 298 [50] for P. aeruginosa in white rabbit [49]. The values of the parameters are shown in Table 3.
For N. fowleri, a dose–response model was found in only one previous study for the route of interest in humans, i.e., nasal instillation [51]. Dose–response models for this study were developed using mice data for two different strains, S-L98.2.1.f17, and D98.2.1.h10 where doses were administered through nasal instillation and the data are shown in Table S1 [52].
An in-house written statistical programming package “R-script” (https://www.r-project.org/) based on the maximum likelihood estimation approach was used for model fitting and estimation of parameters. Exponential and beta-Poisson models were developed separately for the two individual strains as well as for the pooled data from the two strains. The Akaike Information Criterion (AIC) values were calculated for different models to compare the goodness of fit. A combined AIC value based on pooling the data for the two strains was then calculated for selecting the best fit dose-response model for N. fowleri. After identifying the best fit model, bootstrapping was performed using another in-house developed “R-script” to account for uncertainty in dose–response model parameters. Best fit model parameters for this model were calculated from 10,000 bootstrap iterations of the best fit model data set, i.e., the mice pooled data (Table S1), and values obtained are shown in Table 3. The end response for N. fowleri was death. Finally, doses for both N. fowleri and P. aeruginosa was calculated using Equation (6).
P r o b [ R e s p o n s e ] = 1 [ 1 + d o s e ( 2 1 α 1 ) N 50 ] α
where, P r o b   [ R e s p o n s e ] is the estimation of the risk of response (infection, illness, or death), the median infective dose (N50) and the shape parameter (α) are the best fit beta-Poisson model parameters estimated above.
Once the doses were calculated, concentrations were calculated using Equation (7). A Monte Carlo simulation (10,000 trails) using Oracle Crystal Ball v.11.1 software (https://www.oracle.com/applications/crystalball/) was performed to address the uncertainty in concentrations of N. fowleri and P. aeruginosa. Monte Carlo input parameters are presented in Table 3.
C o n c e n t r a t i o n = D o s e / C o n t a c t   R a t e .
In addition, a sensitivity analysis was conducted for all scenarios and models for both P. aeruginosa and N. fowleri to identify variables contributing to variability and uncertainty for concentration.
Two additional risk scenarios were also considered where hot water in plumbing at 55 °C, instead of cold tap water, would be used for cleaning contact lens (for P. aeruginosa contamination) (Scenario 4) and neti pot™ use (for N. fowleri nasal instillation) (Scenario 5). An on-demand water heater was considered in this study and it was assumed that P. aeruginosa and N. fowleri would be exposed to hot water at 55 °C for approximately 30 s. Heat inactivation was estimated to calculate the boundary concentrations of microbes. Inactivation rate constants (k) for both N. fowleri and P. aeruginosa were calculated based on the microbial survival data available in the literature and the “linearized” Arrhenius equation (Equation (8)) was used to calculate concentrations at 55 °C. Pseudomonas aeruginosa (wild type) heat inactivation data from Spinks et al., (2006) [39] was first used for calculating the k value, which was then used for calculating P. aeruginosa concentration at 55 °C in this study. No such direct study was found for N. fowleri in literature. Heat inactivation data for L. pneumophila associated with Acanthamoeba trophozoites was used [53] and N. fowleri concentration at 55 °C was calculated similarly.
ln k = E a R T + ln A
where, k is the reaction rate constant, R is the gas constant (8.314 J mol−1 K−1), T is the temperature (in Kelvin), A is the pre-exponential factor and Ea is the activation energy for the reaction.

3. Results

3.1. Dose–Response Model

The end response of the N. fowleri dose-response model was death. The details of the goodness of fit (i.e., deviance and combined AIC values) for various dose–response models for N. fowleri are shown in Table 4. The combined AIC values for the exponential models with individual strains and pooled data were nearly similar, 13.51 and 13.15, respectively. Similarly, for the beta-Poisson model the combined AIC values for individual strains and pooled data were 10.41 and 9.13, respectively. Comparing between the individual strains and the pooled data, the combined AIC values of the pooled data were slightly better for both the models and therefore were selected for use. Comparing across the models for pooled data, the beta-Poisson model was considered the best fit model, owing to its lower combined AIC value than the corresponding exponential model (i.e., 9.13 < 13.15). Figure 1 represents the plot of the beta-Poisson and exponential model for pooled data.
The best fit model parameters for the beta-Poisson model for the pooled data are presented in Table S2. The maximum likelihood estimates for beta-Poisson model parameters alpha (α) and N50 were found to be 1.59 and 156, respectively, from 10,000 bootstrap iterations. The 95% confidence interval for alpha (α) was (0.93, 72) and the 95% confidence interval for N50 was (92, 254).

3.2. Risk Characterization

Table 5 represents the annual and per event risk of illness for P. aeruginosa and the risk of death for N. fowleri based on DALY and annual risk metrics. In general, per event risk calculations are significantly lower than that based on annual calculations for both DALY and Annual Risk metrics for both the microbes. For P. aeruginosa, the risk of illness per event calculated based on DALY was 2.81 × 10⁻⁹, which was five orders of magnitude lower than the per event risk of illness based on the annual risk metric (2.74 × 10⁻⁷).
For N. fowleri, the risk of death for neti pot™ uses per event calculated based on DALYs was 4.77 × 10⁻¹⁰, which was five orders of magnitude lower than the per event risk of death calculated based on annual risk metric (1.67 × 10⁻⁵). Similarly, for N. fowleri exposure during swimming, DALY and annual risk based per event risks followed the same pattern as neti pot™ exposure, i.e., a five orders of magnitude difference in the risk of death.

3.3. Concentrations

Concentrations of P. aeruginosa and N. fowleri for different exposure scenarios are presented in Table 6. For both microorganisms, in general the DALY metric yielded at least two-fold lower limits of concentrations (i.e., stricter guidance) compared to the annual risk metric. Using the DALY metric, similar critical concentrations of P. aeruginosa were obtained (mean concentration 0.30 to 0.33 CFU/L) for the experimentally measured and drop volume exposure methods. Similarly, the annual risk-based metric also showed nearly similar concentrations for P. aeruginosa (mean concentration ranges from 30 to 33 CFU/L) using the two exposure measurement methods. The highest limit of the critical concentration was found to be 33 CFU/L with a 95% confidence interval of (2.0, 118) for the drop measurement exposure method (Scenario 1a) using the annual risk metric. For a scenario in which the exposed individual used tap water for contact lens cleaning as an occasional lapse, once in a year instead of 365 days per year, the DALY metric yielded mean critical concentrations of P. aeruginosa of 112 and 123 CFU/L for the experimentally measured and drop volume exposure methods, respectively. The annual risk-based metric found mean concentrations for P. aeruginosa of 10,509 and 12,028 CFU/L using the experimentally measured and drop volume exposure methods, respectively. The critical concentrations of P. aeruginosa for the occasional lapse exposure frequency (once per year) were roughly 365 times higher than the daily exposure frequency (365 days per year) for both the DALY metric and annual risk-based metric approaches.
For N. fowleri, higher critical concentrations were found in swimming scenarios (Scenario 3) compared to the neti pot™ use scenarios (Scenario 2) for both risk metrics. The highest critical concentration for N. fowleri was obtained for the swimming scenario using the annual risk metric (mean concertation 1.4 N. fowleri/L with a 95% confidence interval of (0.29, 4.0)).
Similarly, the concentration for the neti pot™ scenario was found to be 0.021 N. fowleri/L with a 95% confidence interval of (0.010, 0.034) for the annual risk approach. Based on the DALY approach, limits of concentrations were 0.000030 N. fowleri/L for swimming and 0.00000060 N. fowleri/L for neti pot™ use scenario. Sensitivity analysis was performed for all the exposure scenarios. For all the scenarios, beta-Poisson model parameters (α and N50) contributed most to the variability and uncertainty of calculating the concentrations of P. aeruginosa and contact rates contributed least to the variability and uncertainty in critical concentrations for all the scenarios (Figure S1). For N. fowleri, N50 and contact rates were contributing most and α least to the variability and uncertainty in the concentrations of N. fowleri for all the scenarios (Figure S2).
The rate of heat inactivation (k) for P. aeruginosa and N. fowleri were 0.019 s−1 and 0.002 s−1 at 55 °C, respectively (Table 7). Considering the hot water scenario, the annual risk approach resulted in 0.022 N. fowleri/L, and the DALY approach resulted in 0.00000064 N. fowleri/L for the neti pot™ scenario (Scenario 5). For P. aeruginosa, the concentration limits for the DALY approach and the annual risk approach were found to be 0.55 CFU/L and 55 CFU/L, respectively for the experimental measured scenario (Scenario 4b). Similarly, the concentration limits for the DALY approach and the annual risk approach were found to be 0.60 CFU/L and 61 CFU/L, respectively for the drop scenario.

4. Discussion

The risks of hospital-acquired and cystic fibrosis infections and even deaths caused by P. aeruginosa are increasing every year in the United States [14]. Infections caused by P. aeruginosa are also becoming very difficult to treat due to the multiple antibiotic resistance of this microorganism [14,15]. Infection scenarios discussed in this study for P. aeruginosa become even more relevant because studies have found that P. aeruginosa survives for up to 4 h in the standard lens cleaning solution [55], indicating that contaminated cleaning solution could conceivably be a source of exposure. Therefore, the concentration values identified in this study could also be applicable to appropriate cleaning solutions. Even though the risk of infection caused by the N. fowleri is very low, the extremely high fatality rate makes it a matter of great concern. Standards for monitoring critical concentrations, that delineate acceptable risks, of P. aeruginosa and N. fowleri in premise plumbing and other recreational waters are rare in the literature. Only a few critical concentration values for P. aeruginosa are available [12,15,56,57], and the reported values lack a documented scientific basis for how they were obtained. For N. fowleri the critical concentration values are not available at all. Therefore, risk-based boundary concentration values corresponding to acceptable risks for these microorganisms are highly sought by regulatory agencies to enforce standards to ensure public safety against infections/deaths caused by these pathogens.
To calculate the boundary concentrations of P. aeruginosa and N. fowleri, several assumptions were made in setting health-based risk values, exposure routes, and contact scenarios. Commonly accepted target values of 10−4 annual risk of illness (see footnote to Table 6) and 10−6 DALYs per person per year were selected as health-based risk metrics [6,36,37]. In general, the DALY based metric will generate lower values of critical concentrations for both microorganisms compared to the annual risk-based metric. The DALY metric and the annual risk metric used in this study were more closely aligned for less severe illnesses such as gastrointestinal (GI) illness [58]. When the annual risk metric will be considered, the DALY/case would yield a value of 10−2 for such illnesses, but for exposure to even low levels of OPPPs such as Naegleria fowleri would produce a much higher DALY/case which makes the DALY approach more restrictive. The risk interpretation and implementation of the critical concentration values calculated in this study are also dependent on other factors such as contact scenarios under consideration and the dose–response models used.
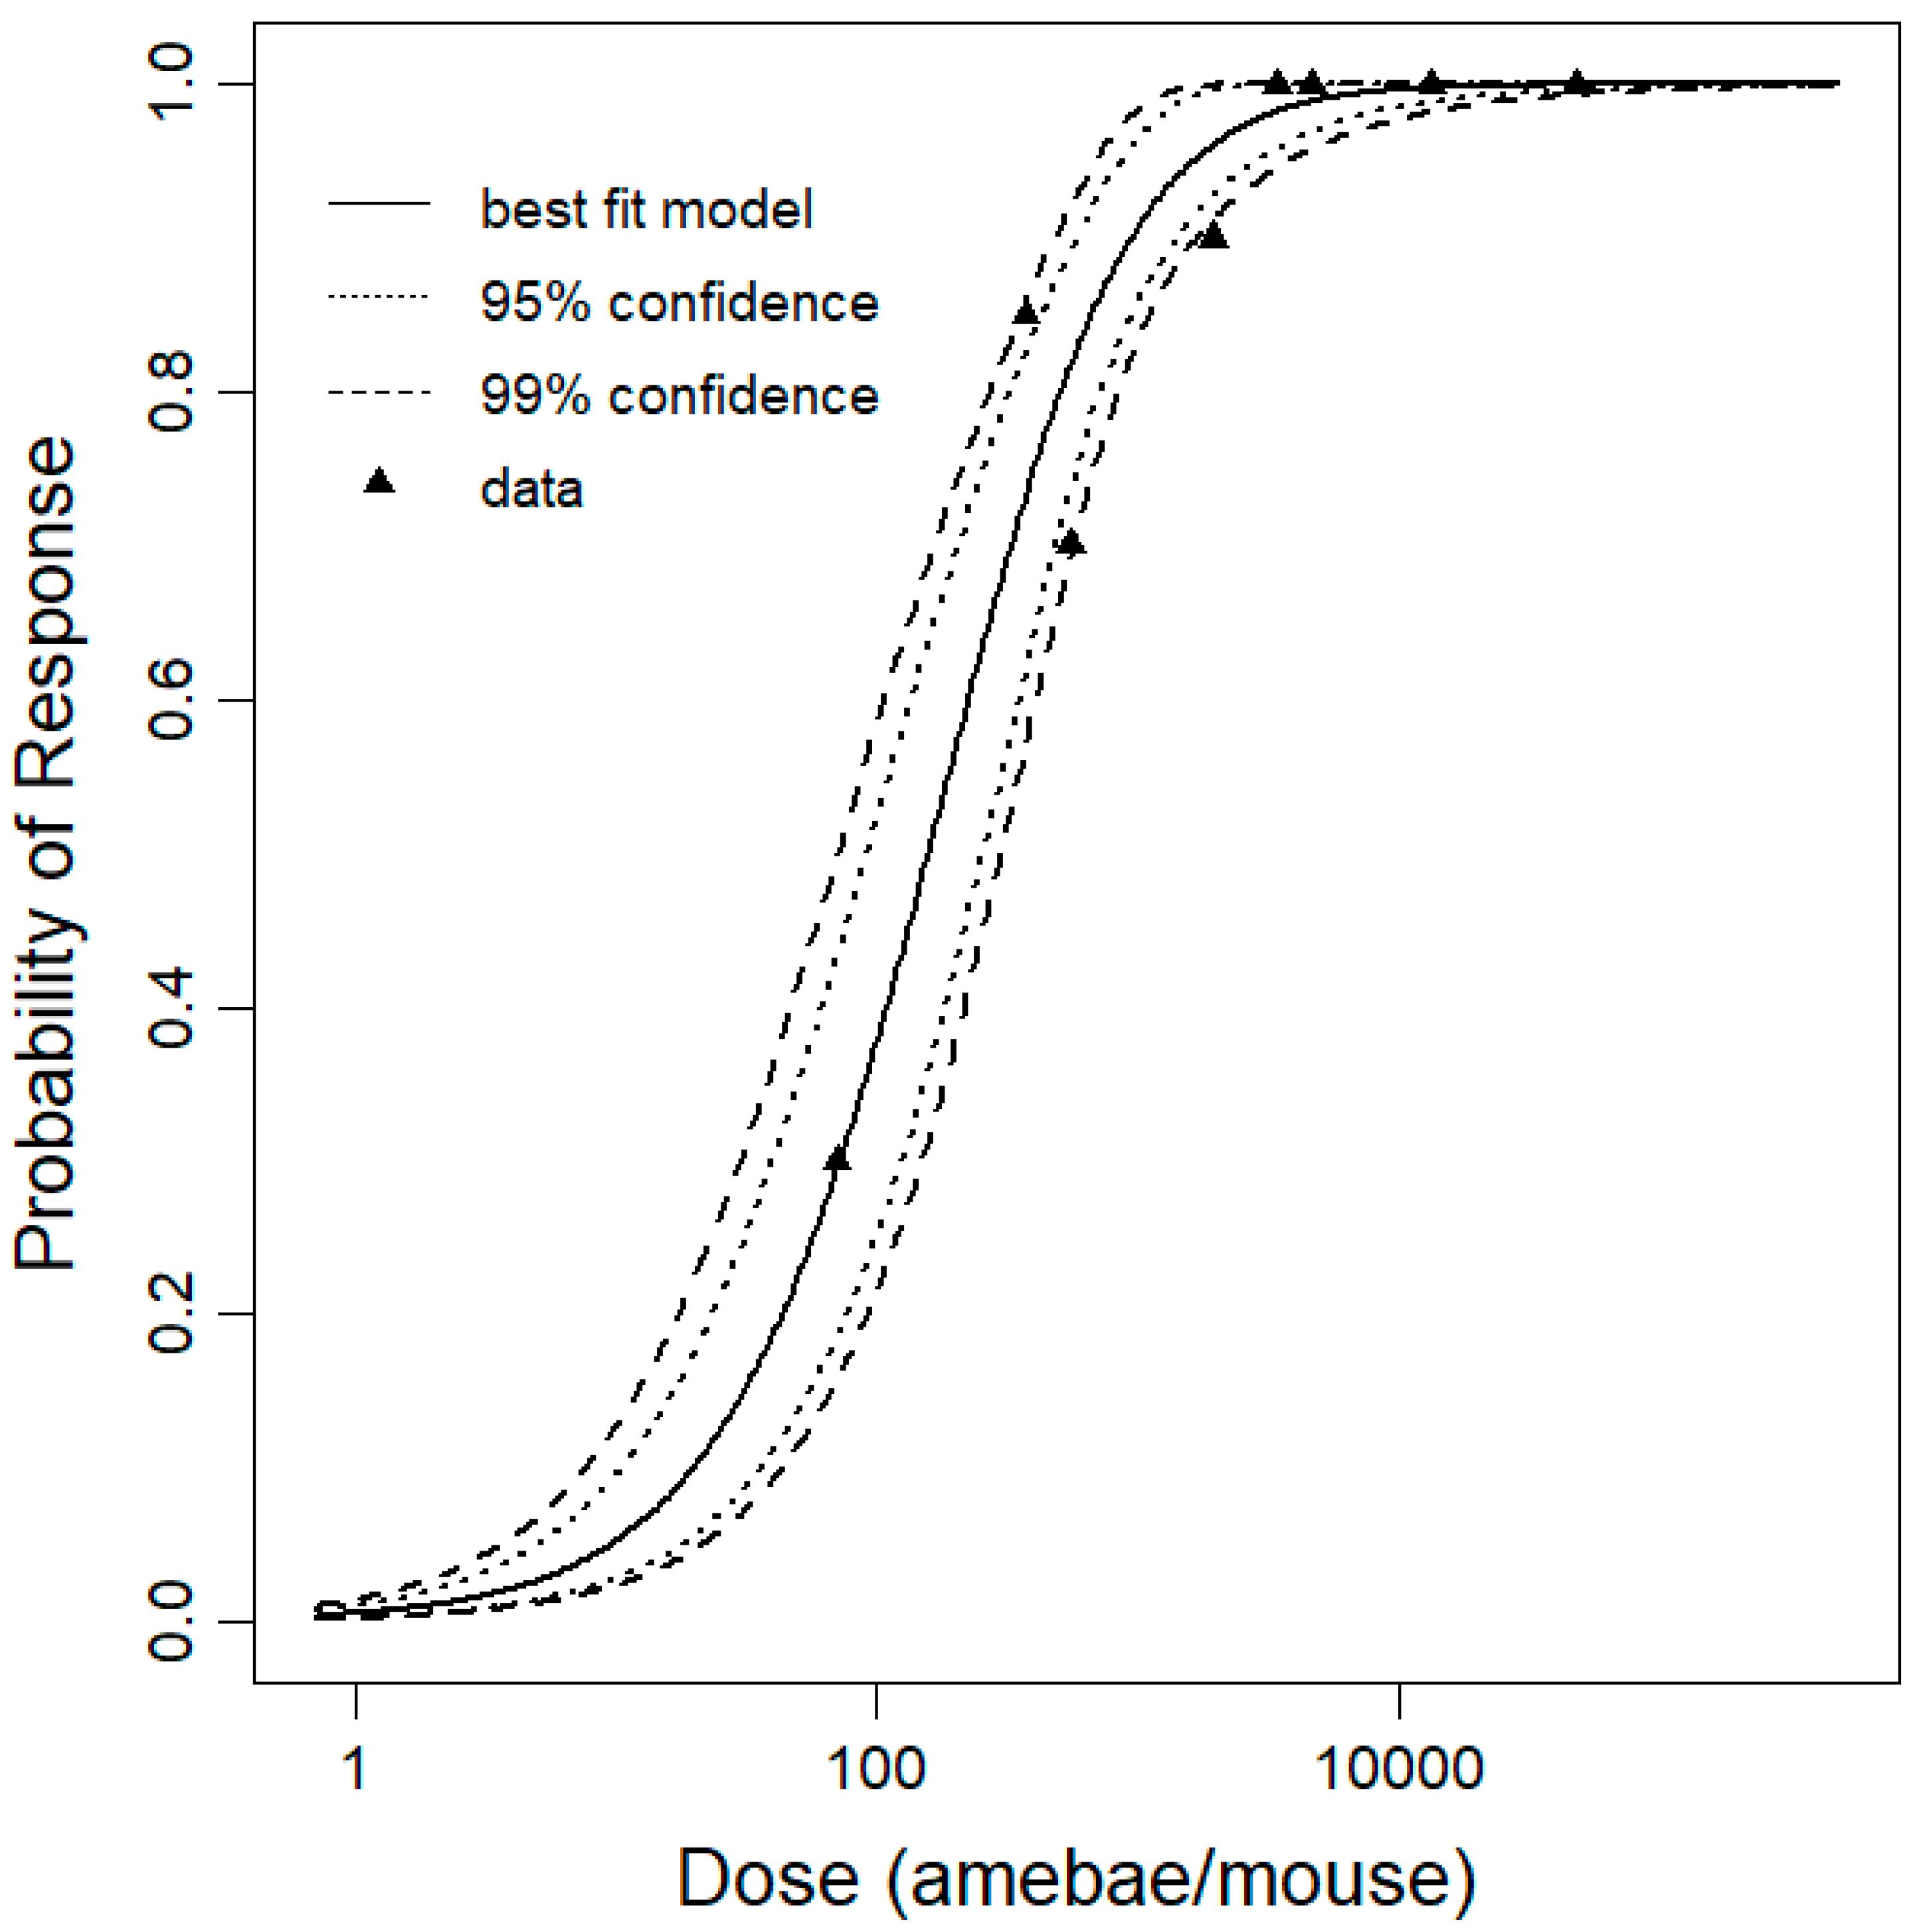
Previously the dose–response model for N. fowleri was developed using intranasal and swimming exposure to CD1 mice [51], but for our study only intranasal exposure to Swiss OF1 female mice were considered. In the Dean et al., (2019) [51] study, the intranasal exposure experiment data was based on 10 mice per dose but for our study 10 to 20 mice per dose were used to develop the dose–response model. The beta-Poisson model was reported as the best fit dose–response model for N. fowleri [51] which was consistent with our results as the pooled data for our dose–response model were also best fit with the beta-Poisson model. The beta-Poisson curve for our best fit data was much steeper than the curves of previous studies (Figure 2) which indicates a higher probability of death at low doses [51].
The choice of target risk values of illness per event caused by P. aeruginosa and N. fowleri for both the risk metrics used in this study fell within the acceptable limit of 10−4 to 10−6 set forth by Environmental Protection Agency (EPA) [59]. The two methods of contact rate measurements in the contact lens scenarios (Scenarios 1a and 1b) predicted similar critical concentrations of P. aeruginosa, for the DALY risk metric (mean concentration 0.30 to 0.33 CFU/L) and annual risk metric (mean concentration range from 30 to 33 CFU/L); the critical concentrations based on experimental measurements may be a more reliable method to choose. There are no specific regulations available to control P. aeruginosa in municipal drinking water at domestic and healthcare facilities in the United States. However, regulations to control P. aeruginosa both in domestic premise plumbing, as well as immune-compromised patients in hospitals are available, though contradictory, in other countries. For example, the Department of Health in the United Kingdom suggests that P. aeruginosa should be undetected in healthcare facilities [56] and the European Union [57] suggest a standard of non-detectable P. aeruginosa in 250 mL volumes of water in bottled water [12]. For health care facilities that are relatively more prone to infections the French Ministry of Social Affairs and Health guidelines recommend 10 CFU/L P. aeruginosa in water as safety standard [15]. These contradictory guidelines may have been the result of the differences in the recommended microbial measurement approaches. The acceptable risk critical concentrations of P. aeruginosa calculated for the contact lens risk scenarios simulated in this study roughly agree with the UK and European Union guidelines when DALY metric was used (mean concentration 0.30 CFU/L) and with French guidelines when the annual risk-based metric was used (mean concentration 29.95 CFU/L). Even though the predicted critical concentrations in this study are more or less in agreement with the available guidelines values, previous studies have reported more than two fold higher mean concentrations (i.e., 70 CFU/L) of P. aeruginosa in tap water samples in Southern Greece [60]. This may have been because of various other factors, including different P. aeruginosa isolates used for the dose–response model in this study, and warrants further investigation. The detection limit of P. aeruginosa was found to be 330 CFU·PCR−1 [61]. Considering 330 cells of P. aeruginosa and 10 L as a volume of water sample to be filtered, the detection limit of P. aeruginosa would be 33 CFU/L. This detection limit of concentration is aligned with our calculated boundary concentration which might be costly and difficult to filter but filtering greater sample volumes would produce more precise measurements. Also, the relationship between boundary concentration and number of exposure events was found to be linear. In cases where exposures are less frequent (i.e., smaller N), the boundary concentration would be higher and hence easier to detect.
Since no specific guideline documents are available for exposure risk from N. fowleri, the critical concentrations values obtained in this study may help develop standards for swimming (Scenario 2) and neti pot™ use (Scenario 3) exposure scenarios. In general, the tolerable critical concentrations of N. fowleri are much lower compared to those for P. aeruginosa except for the swimming scenario with the annual risk metric which is still more than an order of magnitude below the P. aeruginosa values. The critical concentrations for neti pot™ use are lower than the swimming scenarios for both risk metrics which is still more than an order of magnitude below the P. aeruginosa values, which can be attributed to the higher contact rate during neti pot™ use compared to swimming. These results seem in agreement with the general perception that one would expect stringent standard requirement for neti pot™ use where water is forced through the nose and therefore the possibility of entering the brain is high. The tolerable mean critical concentration of N. fowleri for the swimming scenario with the annual risk metric has a mean concentration 1.4 CFU/L, with a range from 0.29 to 4.0 CFU/L. Given that the end response is death with a 100% percent mortality rate, it may be wise to pick a lower range of critical concentration (0.29 CFU/L) for developing standards, and the same can be applied for developing standards for other scenarios related to N. fowleri. Previous studies found the detection limit of N. fowleri to be 1–50 cells per reaction using both the nested and real-time PCR assays [19]. Considering 50 cells of N. fowleri and 200 L as a volume of water sample to be filtered, the detection limit of N. fowleri would be 0.25 N. fowleri/L which is also aligned with our calculated boundary concentration of N. fowleri using the annual risk metric.
Higher tolerable concentration standard can be set for using hot plumbing water for contact lenses exposure scenarios for P. aeruginosa but not for exposure scenarios for N. fowleri. Optimum growth temperature for P. aeruginosa and N. fowleri are quite different. P. aeruginosa can grow at temperatures between 10–42 °C, with an optimum growth temperature at 37 °C [15]. For N. fowleri, the growth temperatures are between 25–42 °C, and they can continue to survive for a long time at lower temperatures [19]. Temperatures between 55–65 °C are generally suggested as effective for the elimination of waterborne pathogens, hot water temperatures above 60 °C are considered to present a risk of scalding [62] and pipe corrosion [63]. Thus, 55 °C is generally considered as microbial inactivation temperature and is used in premise plumbing. The mean critical concentrations for P. aeruginosa were increased by approximately two-fold for both scenarios using heat treatment (Scenario 4a,b). Though this increment indicated that temperature control may be used to eradicate P. aeruginosa from premise plumbing water systems; it may not have an impact on setting standard guidelines since the allowable mean concentrations are still undetectable (0.55 CFU/L, DALY metric) or at the lower end of the detectable range (55 CFU/L, annual rick metric) of most of the culture-based assays. The change in critical concentrations for N. fowleri after heat treatment was not significant. This might be due to the low heat inactivation constant for N. fowleri (Table 7).
There are various limitations of this study. Dose–response data used in this study were subject to uncertainty and variability which eventually influenced the calculated critical concentrations of P. aeruginosa and N. fowleri. More nasal instillation data are required to address this uncertainty and variability for N. fowleri. Uncertainty due to variation of frequencies of activities (i.e., swimming, neti pot™ use) and volume of water entering into the brain should be studied and analyzed to estimate the burden of disease associated with these organisms. The use L. pneumophila associated with Acanthamoeba trophozoites heat activation data for N. fowleri also introduced uncertainty in the heat inactivation estimates for N. fowleri.

5. Conclusions

QMRA framework is a widely used technique to conduct risk assessment for the study of water quality and food. One of the key limitations of the QMRA approach is the lack of microbiological and public health data. Being developed based on the QMRA framework, the reverse QMRA framework can be used to address this issue where target risk, dose–response, and exposure data are used to calculate the critical concentrations. Reverse QMRA can be used for planning and policy making to regulate opportunistic premise plumbing pathogens in water distribution systems. Critical concentrations found in this can help the decision maker to make well-informed decisions. This reverse QMRA framework can also be used for other pathogens to find critical concentrations to regulate and reduce public health risks.
The dose–response model developed in this study was a novel model which was also an important step for the QMRA framework to assess estimated risk. The developed dose–response model filled an important gap in our understanding of the hazards presented by this microorganism. Dose–response data used in this study could be pooled with previous studies [51] to estimate more appropriate model parameters which would reduce the variability and uncertainty.

Supplementary Materials

The following are available online at https://www.mdpi.com/2073-4441/11/9/1850/s1, Table S1: Input data for dose–response model, Table S2: Best fit parameters for the beta-Poisson model for N. fowleri, from 10,000 bootstrap iterations, Figure S1: Sensitivity analysis for P. aeruginosa, Figure S2: Sensitivity analysis for N. fowleri.

Author Contributions

Conceptualization, M.R., C.N.H., K.A.H., R.S., and P.L.G.; methodology, M.R., C.N.H., K.A.H., and P.L.G.; software, M.R. and C.N.H.; validation, M.R., C.N.H., R.S., and P.L.G.; formal analysis, M.R., H.Y., and Z.Y.; investigation, M.R. and R.S.; resources, M.R., D.T., H.Y., Z.Y., and P.L.G.; data curation, M.R., D.T., H.Y., and Z.Y.; writing—original draft preparation, M.R.; writing—review and editing, M.R., C.N.H., K.A.H., R.S., and P.L.G.; visualization, M.R.; supervision, P.L.G.; funding acquisition, P.L.G. and C.N.H.

Funding

This research was developed under Assistance Agreement No. R836880 awarded by the U.S. Environmental Protection Agency. It has not been formally reviewed by EPA. The views expressed in this document are solely those of the authors and do not necessarily reflect those of the Agency. EPA does not endorse any products or commercial services mentioned in this publication.

Acknowledgments

The authors are grateful to Mira S. Olson and Tim Bartrand for their expertise, suggestions and valuable comments to improve this manuscript. The authors also would like to thank Laya Raj, Callan Daley, Jacob Lindsey, and Huai-En Cheng for their help in the literature review and for assisting with preliminary work on risk modeling. The authors also gratefully acknowledge valuable comments from three anonymous reviewers that helped improving the manuscript substantially. The authors are grateful to Jade Mitchell and Kara Dean at Michigan State University for pointing out the errors in our dose–response parameters that prompted us to revise and correct the manuscript with updated results.

Conflicts of Interest

The authors declare no conflict of interest.

References

  1. Rasheduzzaman, M.; Singh, R.; Haas, C.N.; Tolofari, D.; Yassaghi, H.; Hamilton, K.A.; Yang, Z.; Gurian, P.L. Reverse QMRA as a Decision Support Tool: Setting Acceptable Concentration Limits for Pseudomonas aeruginosa and Naegleria fowleri. Drugs Context 2019, 11, 1850. [Google Scholar] [CrossRef]
  2. Falkinham, J.O. Common Features of Opportunistic Premise Plumbing Pathogens. Int. J. Environ. Res. Public Health 2015, 12, 4533–4545. [Google Scholar] [CrossRef]
  3. Falkinham, J.O.; Pruden, A.; Edwards, M. Opportunistic Premise Plumbing Pathogens: Increasingly Important Pathogens in Drinking Water. Pathogens 2015, 4, 373–386. [Google Scholar] [CrossRef] [Green Version]
  4. CDC. Legionnaires’ Disease Surveillance Summary Report, 2014–2015; Centers for Disease Control and Prevention: Atlanta, GA, USA, 2018.
  5. Collier, S.A.; Stockman, L.J.; Hicks, L.A.; Garrison, L.E.; Zhou, F.J.; Beach, M.J. Direct healthcare costs of selected diseases primarily or partially transmitted by water. Epidemiol. Infect. 2012, 140, 2003–2013. [Google Scholar] [CrossRef] [Green Version]
  6. Hamilton, K.A.; Hamilton, M.T.; Johnson, W.; Jjemba, P.; Bukhari, Z.; LeChevallier, M.; Haas, C.N.; Gurian, P.L. Risk-Based Critical Concentrations of Legionella pneumophila for Indoor Residential Water Uses. Environ. Sci. Technol. 2019, 53, 4528–4541. [Google Scholar] [CrossRef]
  7. Richards, M.J.; Edwards, J.R.; Culver, D.H.; Gaynes, R.P. Nosocomial infections in medical intensive care units in the United States. National Nosocomial Infections Surveillance System. Crit. Care Med. 1999, 27, 887–892. [Google Scholar] [CrossRef]
  8. Hatchette, T.F.; Gupta, R.; Marrie, T.J. Pseudomonas aeruginosa community-acquired pneumonia in previously healthy adults: Case report and review of the literature. Clin. Infect. Dis. 2000, 31, 1349–1356. [Google Scholar] [CrossRef]
  9. Rello, J.; Bodi, M.; Mariscal, D.; Navarro, M.; Diaz, E.; Gallego, M.; Valles, J. Microbiological testing and outcome of patients with severe community-acquired pneumonia. Chest 2003, 123, 174–180. [Google Scholar] [CrossRef]
  10. Baghal Asghari, F.; Nikaeen, M.; Mirhendi, H. Rapid monitoring of Pseudomonas aeruginosa in hospital water systems: A key priority in prevention of nosocomial infection. FEMS Microbiol. Lett. 2013, 343, 77–81. [Google Scholar] [CrossRef]
  11. CDC Pseudomonas aeruginosa in Healthcare Settings. Available online: https://www.cdc.gov/hai/organisms/pseudomonas.html (accessed on 19 March 2019).
  12. Mena, K.D.; Gerba, C.P. Risk assessment of Pseudomonas aeruginosa in water. Rev. Environ. Contam. Toxicol. 2009, 201, 71–115. [Google Scholar]
  13. Quick, J.; Cumley, N.; Wearn, C.M.; Niebel, M.; Constantinidou, C.; Thomas, C.M.; Pallen, M.J.; Moiemen, N.S.; Bamford, A.; Oppenheim, B.; et al. Seeking the source of Pseudomonas aeruginosa infections in a recently opened hospital: An observational study using whole-genome sequencing. BMJ Open 2014, 4, e006278. [Google Scholar] [CrossRef]
  14. Falkinham, J.O.; Hilborn, E.D.; Arduino, M.J.; Pruden, A.; Edwards, M.A. Epidemiology and Ecology of Opportunistic Premise Plumbing Pathogens: Legionella pneumophila, Mycobacterium avium, and Pseudomonas aeruginosa. Environ. Health Perspect 2015, 123, 749–758. [Google Scholar] [CrossRef]
  15. Bédard, E.; Prévost, M.; Déziel, E. Pseudomonas aeruginosa in premise plumbing of large buildings. Microbiologyopen 2016, 5, 937–956. [Google Scholar] [CrossRef]
  16. Fleiszig, S.M.; Efron, N.; Pier, G.B. Extended contact lens wear enhances Pseudomonas aeruginosa adherence to human corneal epithelium. Invest. Ophthalmol. Vis. Sci. 1992, 33, 2908–2916. [Google Scholar]
  17. Griffin, J.L. Temperature Tolerance of Pathogenic and Nonpathogenic Free-Living Amoebas. Science 1972, 178, 869–870. [Google Scholar] [CrossRef]
  18. Siddiqui, R.; Khan, N.A. Primary Amoebic Meningoencephalitis Caused by Naegleria fowleri: An Old Enemy Presenting New Challenges. PLoS Negl. Trop. Dis. 2014, 8, e3017. [Google Scholar] [CrossRef]
  19. Bartrand, T.A.; Causey, J.J.; Clancy, J.L. Naegleria fowleri: An emerging drinking water pathogen. J. Am. Water Work. Assoc. 2014, 106, E418–E432. [Google Scholar] [CrossRef]
  20. Yoder, J.S.; Eddy, B.A.; Visvesvara, G.S.; Capewell, L.; Beach, M.J. The epidemiology of primary amoebic meningoencephalitis in the USA, 1962–2008. Epidemiol. Infect. 2010, 138, 968–975. [Google Scholar] [CrossRef]
  21. Baig, A.M. Pathogenesis of amoebic encephalitis: Are the amoebae being credited to an “inside job” done by the host immune response? Acta Trop. 2015, 148, 72–76. [Google Scholar] [CrossRef]
  22. Marciano-Cabral, F.; Cabral, G.A. The immune response to Naegleria fowleri amebae and pathogenesis of infection. FEMS Immunol. Med. Microbiol. 2007, 51, 243–259. [Google Scholar] [CrossRef]
  23. Capewell, L.G.; Harris, A.M.; Yoder, J.S.; Cope, J.R.; Eddy, B.A.; Roy, S.L.; Visvesvara, G.S.; Fox, L.M.; Beach, M.J. Diagnosis, Clinical Course, and Treatment of Primary Amoebic Meningoencephalitis in the United States, 1937–2013. J. Pediatric Infect. Dis. Soc. 2015, 4, e68–e75. [Google Scholar] [CrossRef]
  24. CDC Case Report Data & Graphs|Naegleria fowleri. Available online: https://www.cdc.gov/parasites/naegleria/graphs.html (accessed on 20 March 2019).
  25. Cope, J.R.; Ratard, R.C.; Hill, V.R.; Sokol, T.; Causey, J.J.; Yoder, J.S.; Mirani, G.; Mull, B.; Mukerjee, K.A.; Narayanan, J.; et al. The First Association of a Primary Amebic Meningoencephalitis Death with Culturable Naegleria fowleri in Tap Water from a U.S. Treated Public Drinking Water System. Clin. Infect. Dis. 2015, 60, e36–e42. [Google Scholar] [CrossRef]
  26. Carducci, A.; Donzelli, G.; Cioni, L.; Verani, M. Quantitative Microbial Risk Assessment in Occupational Settings Applied to the Airborne Human Adenovirus Infection. Int. J. Environ. Res. Public Health 2016, 13, 733. [Google Scholar] [CrossRef]
  27. Armstrong, T.W.; Haas, C.N. A Quantitative Microbial Risk Assessment Model for Legionnaires’ Disease: Animal Model Selection and Dose-Response Modeling. Risk Anal. 2007, 27, 1581–1596. [Google Scholar] [CrossRef]
  28. Armstrong, T.W.; Haas, C.N. Legionnaires’ disease: Evaluation of a quantitative microbial risk assessment model. J. Water Health 2008, 6, 149–166. [Google Scholar] [CrossRef]
  29. Armstrong, T.W.; Haas, C.N. Quantitative Microbial Risk Assessment Model for Legionnaires’ Disease: Assessment of Human Exposures for Selected Spa Outbreaks. J. Occup. Environ. Hyg. 2007, 4, 634–646. [Google Scholar] [CrossRef]
  30. Buse, H.Y.; Schoen, M.E.; Ashbolt, N.J. Legionellae in engineered systems and use of quantitative microbial risk assessment to predict exposure. Water Res. 2012, 46, 921–933. [Google Scholar] [CrossRef]
  31. Hamilton, A.J.; Stagnitti, F.; Premier, R.; Boland, A.-M.; Hale, G. Quantitative Microbial Risk Assessment Models for Consumption of Raw Vegetables Irrigated with Reclaimed Water. Appl. Environ. Microbiol. 2006, 72, 3284–3290. [Google Scholar] [CrossRef]
  32. Hamilton, K.A.; Ahmed, W.; Toze, S.; Haas, C.N. Human health risks for Legionella and Mycobacterium avium complex (MAC) from potable and non-potable uses of roof-harvested rainwater. Water Res. 2017, 119, 288–303. [Google Scholar] [CrossRef]
  33. Howard, G.; Pedley, S.; Tibatemwa, S. Quantitative microbial risk assessment to estimate health risks attributable to water supply: Can the technique be applied in developing countries with limited data? J. Water Health 2006, 4, 49–65. [Google Scholar] [CrossRef]
  34. Hamilton, M.A.; Hong, T.; Casman, E.; Gurian, P.L. Risk-Based Decision Making for Reoccupation of Contaminated Areas Following a Wide-Area Anthrax Release. Risk Anal. 2015, 35, 1348–1363. [Google Scholar] [CrossRef]
  35. Mitchell-Blackwood, J.; Gurian, P.L.; O’Donnell, C. Finding Risk-Based Switchover Points for Response Decisions for Environmental Exposure to Bacillus anthracis. Hum. Ecol. Risk Assess. Int. J. 2011, 17, 489–509. [Google Scholar] [CrossRef]
  36. Regli, S.; Rose, J.B.; Haas, C.N.; Gerba, C.P. Modeling the Risk From Giardia and Viruses in Drinking Water. J. Am. Water Work. Assoc. 1991, 83, 76–84. [Google Scholar] [CrossRef]
  37. World Health Organization (Ed.) Guidelines for Drinking-Water Quality, 4th ed.; World Health Organization: Geneva, Switzerland, 2011; ISBN 978-92-4-154815-1. [Google Scholar]
  38. WHO. Boil Water. Available online: http://www.who.int/water_sanitation_health/publications/boiling-water/en/ (accessed on 13 May 2019).
  39. Spinks, A.T.; Dunstan, R.H.; Harrison, T.; Coombes, P.; Kuczera, G. Thermal inactivation of water-borne pathogenic and indicator bacteria at sub-boiling temperatures. Water Res. 2006, 40, 1326–1332. [Google Scholar] [CrossRef]
  40. WHO. WHO Methods and Data Sources for Global Burden of Disease Estimates 2000–2011; WHO: Geneva, Switzerland, 2013. [Google Scholar]
  41. World Health Organization. World Health Statistics 2016: Monitoring health for the SDGs; World Health Organization: Geneva, Switzerland, 2016. [Google Scholar]
  42. Linam, W.M.; Ahmed, M.; Cope, J.R.; Chu, C.; Visvesvara, G.S.; da Silva, A.J.; Qvarnstrom, Y.; Green, J. Successful treatment of an adolescent with Naegleria fowleri primary amebic meningoencephalitis. Pediatrics 2015, 135, e744–e748. [Google Scholar] [CrossRef]
  43. Haas, C.N.; Rose, J.B.; Gerba, C.P. Quantitative Microbial Risk Assessment; John Wiley & Sons: Hoboken, NJ, USA, 1999; ISBN 978-0-471-18397-6. [Google Scholar]
  44. CDC. Information on Healthy Swimming and Recreational Water. Available online: https://www.cdc.gov/healthywater/swimming/fast-facts.html (accessed on 21 April 2019).
  45. Loge, F.J.; Thompson, D.E.; Call, D.R. PCR Detection of Specific Pathogens in Water:  A Risk-Based Analysis. Environ. Sci. Technol. 2002, 36, 2754–2759. [Google Scholar] [CrossRef]
  46. Farrell, J.; Venator, J. Fact Sheet: Paid Sick Days. Available online: https://www.americanprogress.org/issues/economy/news/2012/08/16/12031/fact-sheet-paid-sick-days/ (accessed on 19 December 2018).
  47. Williams, C. How Often Can I Use the Neti Pot? Available online: https://www.livestrong.com/article/16218-can-use-neti-pot/ (accessed on 21 April 2019).
  48. Neilmed. Principles of Nasal Irrigation. Available online: http://www.neilmed.com/neilmedblog/2010/04/principles-of-nasal-irrigation/ (accessed on 18 December 2018).
  49. Tamrakar, S. Pseudomonas aeruginosa (Contact lens): Dose Response Models - QMRAwiki. Available online: http://qmrawiki.canr.msu.edu/index.php/Pseudomonas_aeruginosa_(Contact_lens):_Dose_Response_Models#_ada0a7ba80d80d6c03b247607643bf29 (accessed on 4 February 2019).
  50. Lawin-Brüssel, C.A.; Refojo, M.F.; Leong, F.L.; Hanninen, L.; Kenyon, K.R. Effect of Pseudomonas aeruginosa concentration in experimental contact lens-related microbial keratitis. Cornea 1993, 12, 10–18. [Google Scholar] [CrossRef]
  51. Dean, K.; Weir, M.H.; Mitchell, J. Development of a dose-response model for Naegleria fowleri. J. Water Health 2019, 17, 63–71. [Google Scholar] [CrossRef]
  52. Cabanes, P.-A.; Wallet, F.; Pringuez, E.; Pernin, P. Assessing the Risk of Primary Amoebic Meningoencephalitis from Swimming in the Presence of Environmental Naegleria fowleri. Appl. Environ. Microbiol. 2001, 67, 2927–2931. [Google Scholar] [CrossRef]
  53. Cervero-Aragó, S.; Rodríguez-Martínez, S.; Puertas-Bennasar, A.; Araujo, R.M. Effect of Common Drinking Water Disinfectants, Chlorine and Heat, on Free Legionella and Amoebae-Associated Legionella. PLoS ONE 2015, 10, e0134726. [Google Scholar] [CrossRef]
  54. Cheng, K.H.; Leung, S.L.; Hoekman, H.W.; Beekhuis, W.H.; Mulder, P.G.; Geerards, A.J.; Kijlstra, A. Incidence of contact-lens-associated microbial keratitis and its related morbidity. Lancet 1999, 354, 181–185. [Google Scholar] [CrossRef]
  55. Whitehead, N. The Bacteria Living in Your Contact Lens Solution. Available online: https://www.sciencemag.org/news/2014/04/bacteria-living-your-contact-lens-solution (accessed on 23 August 2019).
  56. Department of Health (DH). Health Technical Memorandum 04-01 Addendum: Pseudomonas aeruginosa—Advice for Augmented Care Units; Department of Health: London, UK, 2013.
  57. EU Proposal for Council Directive Concerning the Quality of Water Intended for Human Consumption; European Parliament: Brussels, Belgium, 2018.
  58. van Lier, A.; McDonald, S.A.; Bouwknegt, M.; Group, E.P.I.; Kretzschmar, M.E.; Havelaar, A.H.; Mangen, M.-J.J.; Wallinga, J.; de Melker, H.E. Disease Burden of 32 Infectious Diseases in the Netherlands, 2007–2011. PLoS ONE 2016, 11, e0153106. [Google Scholar] [CrossRef]
  59. US EPA. Guidelines for Carcinogen Risk Assessment. Available online: https://www.epa.gov/risk/guidelines-carcinogen-risk-assessment (accessed on 18 April 2019).
  60. Papapetropoulou, M.; Iliopoulou, J.; Rodopoulou, G.; Detorakis, J.; Paniara, O. Occurrence and antibiotic-resistance of Pseudomonas species isolated from drinking water in southern Greece. J. Chemother. 1994, 6, 111–116. [Google Scholar] [CrossRef]
  61. Lee, C.S.; Wetzel, K.; Buckley, T.; Wozniak, D.; Lee, J. Rapid and Sensitive Detection of Pseudomonas aeruginosa in Chlorinated Water and Aerosols targeting gyrB gene using Real-time PCR. J. Appl. Microbiol. 2011, 111, 893–903. [Google Scholar] [CrossRef]
  62. Lukefahr, J.L.; Ezekiel, K. Scalding Water Temperatures. Pediatrics 1994, 94, 573–574. [Google Scholar]
  63. McNeill, L.S.; Edwards, M. The Importance of Temperature in Assessing Iron Pipe Corrosion in Water Distribution Systems. Environ. Monit. Assess. 2002, 77, 229–242. [Google Scholar] [CrossRef]
Figure 1. Plot of beta-Poisson and exponential model for pooled data.
Water 11 01850 g001
Figure 2. Plot of the beta-Poisson model for pooled data with upper and lower 95% and 99% confidence.
Water 11 01850 g002
Table 1. DALYs input parameters for Pseudomonas aeruginosa.
Parameter for Eye InfectionValueNoteReference
Disease duration in years0.0137Assuming five days[12]
Disability weight0.195Distance vision blindness[40]
Standard life expectancy at age of death in years27.4Expected to die at 44 considering the life expectancy 71.4[41]
Probability [Death|Illness]0No death occursAssumption
Table 2. Disability-adjusted life years (DALYs) input parameters for Naegleria fowleri.
ParameterValueNoteReferences
Disability weight0.615For meningitis[40]
Standard life expectancy at age of death in years59.4Average death at 12 compared to average life expectancy of 71.4[24,41]
Prob [Death|Illness]0.98Probability of death given infection is 98%. This assumes all infection leads to illness.[19]
Years lived with a disability until death0.03Median time from infection with Naegleria to death[24]
DALYs lost per survivor in years0.15Years lived with infection from Naegleria[42]
Table 3. Monte Carlo input parameters for P. aeruginosa and N. fowleri.
ParameterUnitValueDistributionSource
P. aeruginosa
alpha 2.5% = 0.115; 5% = 0.124; 95% = 0.386Gamma[49]
N50 2.5% = 4730; 5% = 6010; 95% = 70,500Gamma[49]
Contact (Drop*)mL/useLikeliest = 0.05; Min = 0.01; Max = 0.15TriangularAssumption
Contact (E.M.ɸ)mL/useLikeliest = 0.062; Min = 0.052; Max = 0.07TriangularMeasured by this study
N. fowleri
alpha 2.5% = 0.84; 5% = 0.93; 95% = 72GammaFit by this study
N50 2.5% = 82; 5% = 92; 95% = 254Gamma
Contact (Swimming)mL/useLikeliest = 1; Min = 0.1; Max = 10TriangularAssumption
Contact (Neti Pot™)mL/useLikeliest = 180; Min = 120; Max = 240Triangular[48]
Notes: Drop* represent the contact rate based on the drop scenarios; E.M.ɸ represents the contact rate based on the experimental measurements of water volume in contact lenses.
Table 4. Goodness of fit and dose–response model selection for N. fowleri.
StrainModelDeviancekAICCombined AIC
S-L98.2.1.f17Beta-Poisson2.40526.40510.407
D98.2.1.h100.0024.002
S-L98.2.1.f17Exponential9.509111.50913.511
D98.2.1.h100.0022.002
Pooled dataBeta-Poisson5.13829.1389.138
Exponential11.152113.15213.152
Table 5. Risk of illness/death based on DALYs and annual risk approach.
ApproachRisk of Illness/DeathP. aeruginosaN. fowleri
Neti Pot™Swimming
DALYsAnnual1.03 × 10−62.86 × 10−92.45 × 10−9
Per Event2.81 × 10−94.77 × 10−103.50 × 10⁻¹⁰
Annual RiskAnnual1.00 × 10−41.00 × 10−41.00 × 10−4
Per Event2.74 × 10−71.67 × 10−51.43 × 10−5
Table 6. Concentration of P. aeruginosa and N. fowleri before and after heat inactivation 1.
Risk MetricP. aeruginosa Conc. (CFU/L) (95% CI)N. fowleri Conc. (N. fowleri/L) (95% CI)Heat Inactivation Conc.
P. aeruginosa (CFU/L)N. fowleri (N. fowleri/L)
Contact lens (Drop) (Scenario 1a)Contact lens (E.M.) (Scenario 1b)Neti Pot™ (Scenario 2)Swimming (Scenario 3)Drop (Scenario 4a)E.M. (Scenario 4b)Neti Pot™ (Scenario 5)
DALY0.33 (0.02–1.8)0.30 (0.02–0.99)0.00000060 (0.00000030–0.0000010)0.000030 (0.000010–0.00010)0.600.550.00000064
Annual Risk33 (2.0–118)30 (2.3–100)0.021 (0.010–0.034)1.4 (0.29–4.0)61550.022
Notes: 1 EPA has generally applied the 1 in 10,000 risk target to the risk of infection to provide a margin of safety that accounts for secondary transmission. In this study, neither the dose-response model provided infection as an endpoint (endpoint of the N. fowleri model was death and endpoint of the P. aeruginosa model was illness). If one wished to provide the additional margin of safety associated with infection as an endpoint, one would need to estimate the probability of illness|infection based on sources such as Cheng et al. (1999) [54] and multiply the concentrations provided in this study by that probability.
Table 7. Rate of heat inactivation (k) for P. aeruginosa and N. fowleri.
PathogenTemperature (°C)Ln (k)k (s−1) Time to Temp (s)
P. aeruginosa55−3.9190.01930
N. fowleri−6.0120.002

