Article

Effect of Different Copper Levels on Growth and Morpho-Physiological Parameters in Giant Reed (Arundo donax L.) in Semi-Hydroponic Mesocosm Experiment

1
Istituto di Ricerca sugli Ecosistemi Terrestri (IRET)—Consiglio Nazionale delle Ricerche (CNR)-via Salaria km 29.300, 00015 Monterotondo, Rome, Italy
2
Consiglio per la Ricerca in Agricoltura e l’Analisi dell’Economia Agraria (CREA)—Centro di Ricerca Ingegneria e Trasformazioni Agroalimentari (CREA-IT)-Via della Pascolare 16, 00015 Monterotondo, Rome, Italy
*
Author to whom correspondence should be addressed.
Water 2019, 11(9), 1837; https://doi.org/10.3390/w11091837
Submission received: 4 July 2019 / Revised: 8 August 2019 / Accepted: 2 September 2019 / Published: 4 September 2019

Abstract

:
In Mediterranean countries, the use of copper-based fungicides in agriculture is causing a concerning accumulation of copper in the upper layer (0–20 cm) of soils and water bodies. Phytoremediation by energy crops offers the chance to associate the recovering of polluted environments with the production of biomass for bioenergy purposes. The purpose of this work was to evaluate the morpho-physiological response of giant reed (Arundo donax L.), a well-known energy crop, when treated with increasing concentrations of Cu (0, 150, and 300 ppm) in a semi-hydroponic growing system (mesocosm) for one month. The plant morphology (height and base diameter of the stem, number of stems) was not affected by the treatments. The presence of Cu led to the disequilibrium of Fe and Zn foliar concentration and caused an impairment of photosynthetic parameters: at 150 and 300 ppm the chlorophyll content and the ETR were significantly lower than the control. The study demonstrated that, although the presence of Cu may initially affect the plant physiology, the Arundo plants can tolerate up to 300 ppm of Cu without any adverse effect on biomass production, even when grown in semi-hydroponic conditions.

1. Introduction

Soil contamination by heavy metals and organic pollutants is a major threat at both European and national level [1,2,3]. In Italy, more than one million hectares (corresponding to about 3% of the national territory), distributed in 57 different sites (sites of national interest, SIN) belong to the national list of polluted sites. The SINs include all the main Italian industrial areas and, according to recent estimates, their remediation should require 30 million € [4]. A recent European survey [2] reported that copper (Cu), mercury (Hg), and lead (Pb) are the main metals diffused at critical levels in the first 20 cm of the Italian farming soils.
The accumulation of copper in soils has mainly an anthropogenic origin as a result of mining or agro-industrial activities. Inorganic copper is used as a broad-spectrum fungicide and bactericide in horticulture and viticulture because it combines efficacy and low cost [5]. The use of products containing copper salts (e.g., pesticides applied in vineyards and orchards) have caused high levels of accumulations in the upper layer (0–20 cm) of agricultural soils in Mediterranean countries (France, Italy, Portugal, and Spain). Due to the long persistence in soil and the toxicity to aquatic and terrestrial organisms, a regulatory process included the copper compounds among the candidates for substitution [6].
Copper is an essential micronutrient for plant growth and development. It acts as a catalyst in photosynthesis and respiration and plays an important role in the formation of lignin in the cell wall. Nevertheless, at high concentrations copper can become extremely toxic for plants causing symptoms such as chlorosis and necrosis, stunting, leaf discoloration, and inhibition of root growth [7,8]. In the presence of copper excess, plants undergo oxidative stress due to the overproduction of reactive oxygen species [5,9] resulting in the impairment of the main processes associated with photosynthesis [10,11]. Depending on the plant genotype and copper concentration, many plant species have been recognized as a valuable biological tool for the phytoremoval of copper from contaminated soil and water [11,12].
Studies in controlled or semi-controlled conditions are the fundamental preliminary step to assess the potential of plant for phytoremediation. The plant responses to heavy metal exposure are commonly evaluated under hydroponic growth conditions or pot in growth chambers or greenhouse [13] and mesocosms in an on-field environment [14]. Since the nutritional factors are maintained at optimal levels for plant growth, such systems represent suitable tools to assess the physiological impact of contaminants to define the maximum potential phytoremediation. The use of mesocosms offers some advantages related to the absence of the buffering effect of the soil, the high volume available for the growth of the rhizosphere, the complete availability, and readiness of the contaminant.
The giant reed (Arundo donax L.) has been proposed as a promising candidate for phytoremediation due to its favorable characteristics as a biomass crop [15,16,17,18,19]: rapid growth and high production of biomass; simple agronomic management and easy harvesting of biomass; good tolerance and ability to assimilate the metals, preferably in the aboveground biomass [20,21]. The present work aimed to evaluate the physiological response of Arundo in a semi-hydroponic growing system in on-field environmental conditions (mesocosm) contaminated with different concentrations of Cu (0, 150, and 300 ppm). In Italian areas where vineyards and orchards are largely diffused, the Cu concentration very often overcomes 200 mg kg−1 in the topsoil, exceeding the Italian threshold (120 mg kg−1) for residential/recreational use [1,22]. The concentrations tested in the present study are higher than these limits. Hence, the growth of the Arundo in a system where high amounts of Cu are freely available, allowed us to test its tolerance capacity and to understand how to use the species in such contaminated soils.

2. Materials and Methods

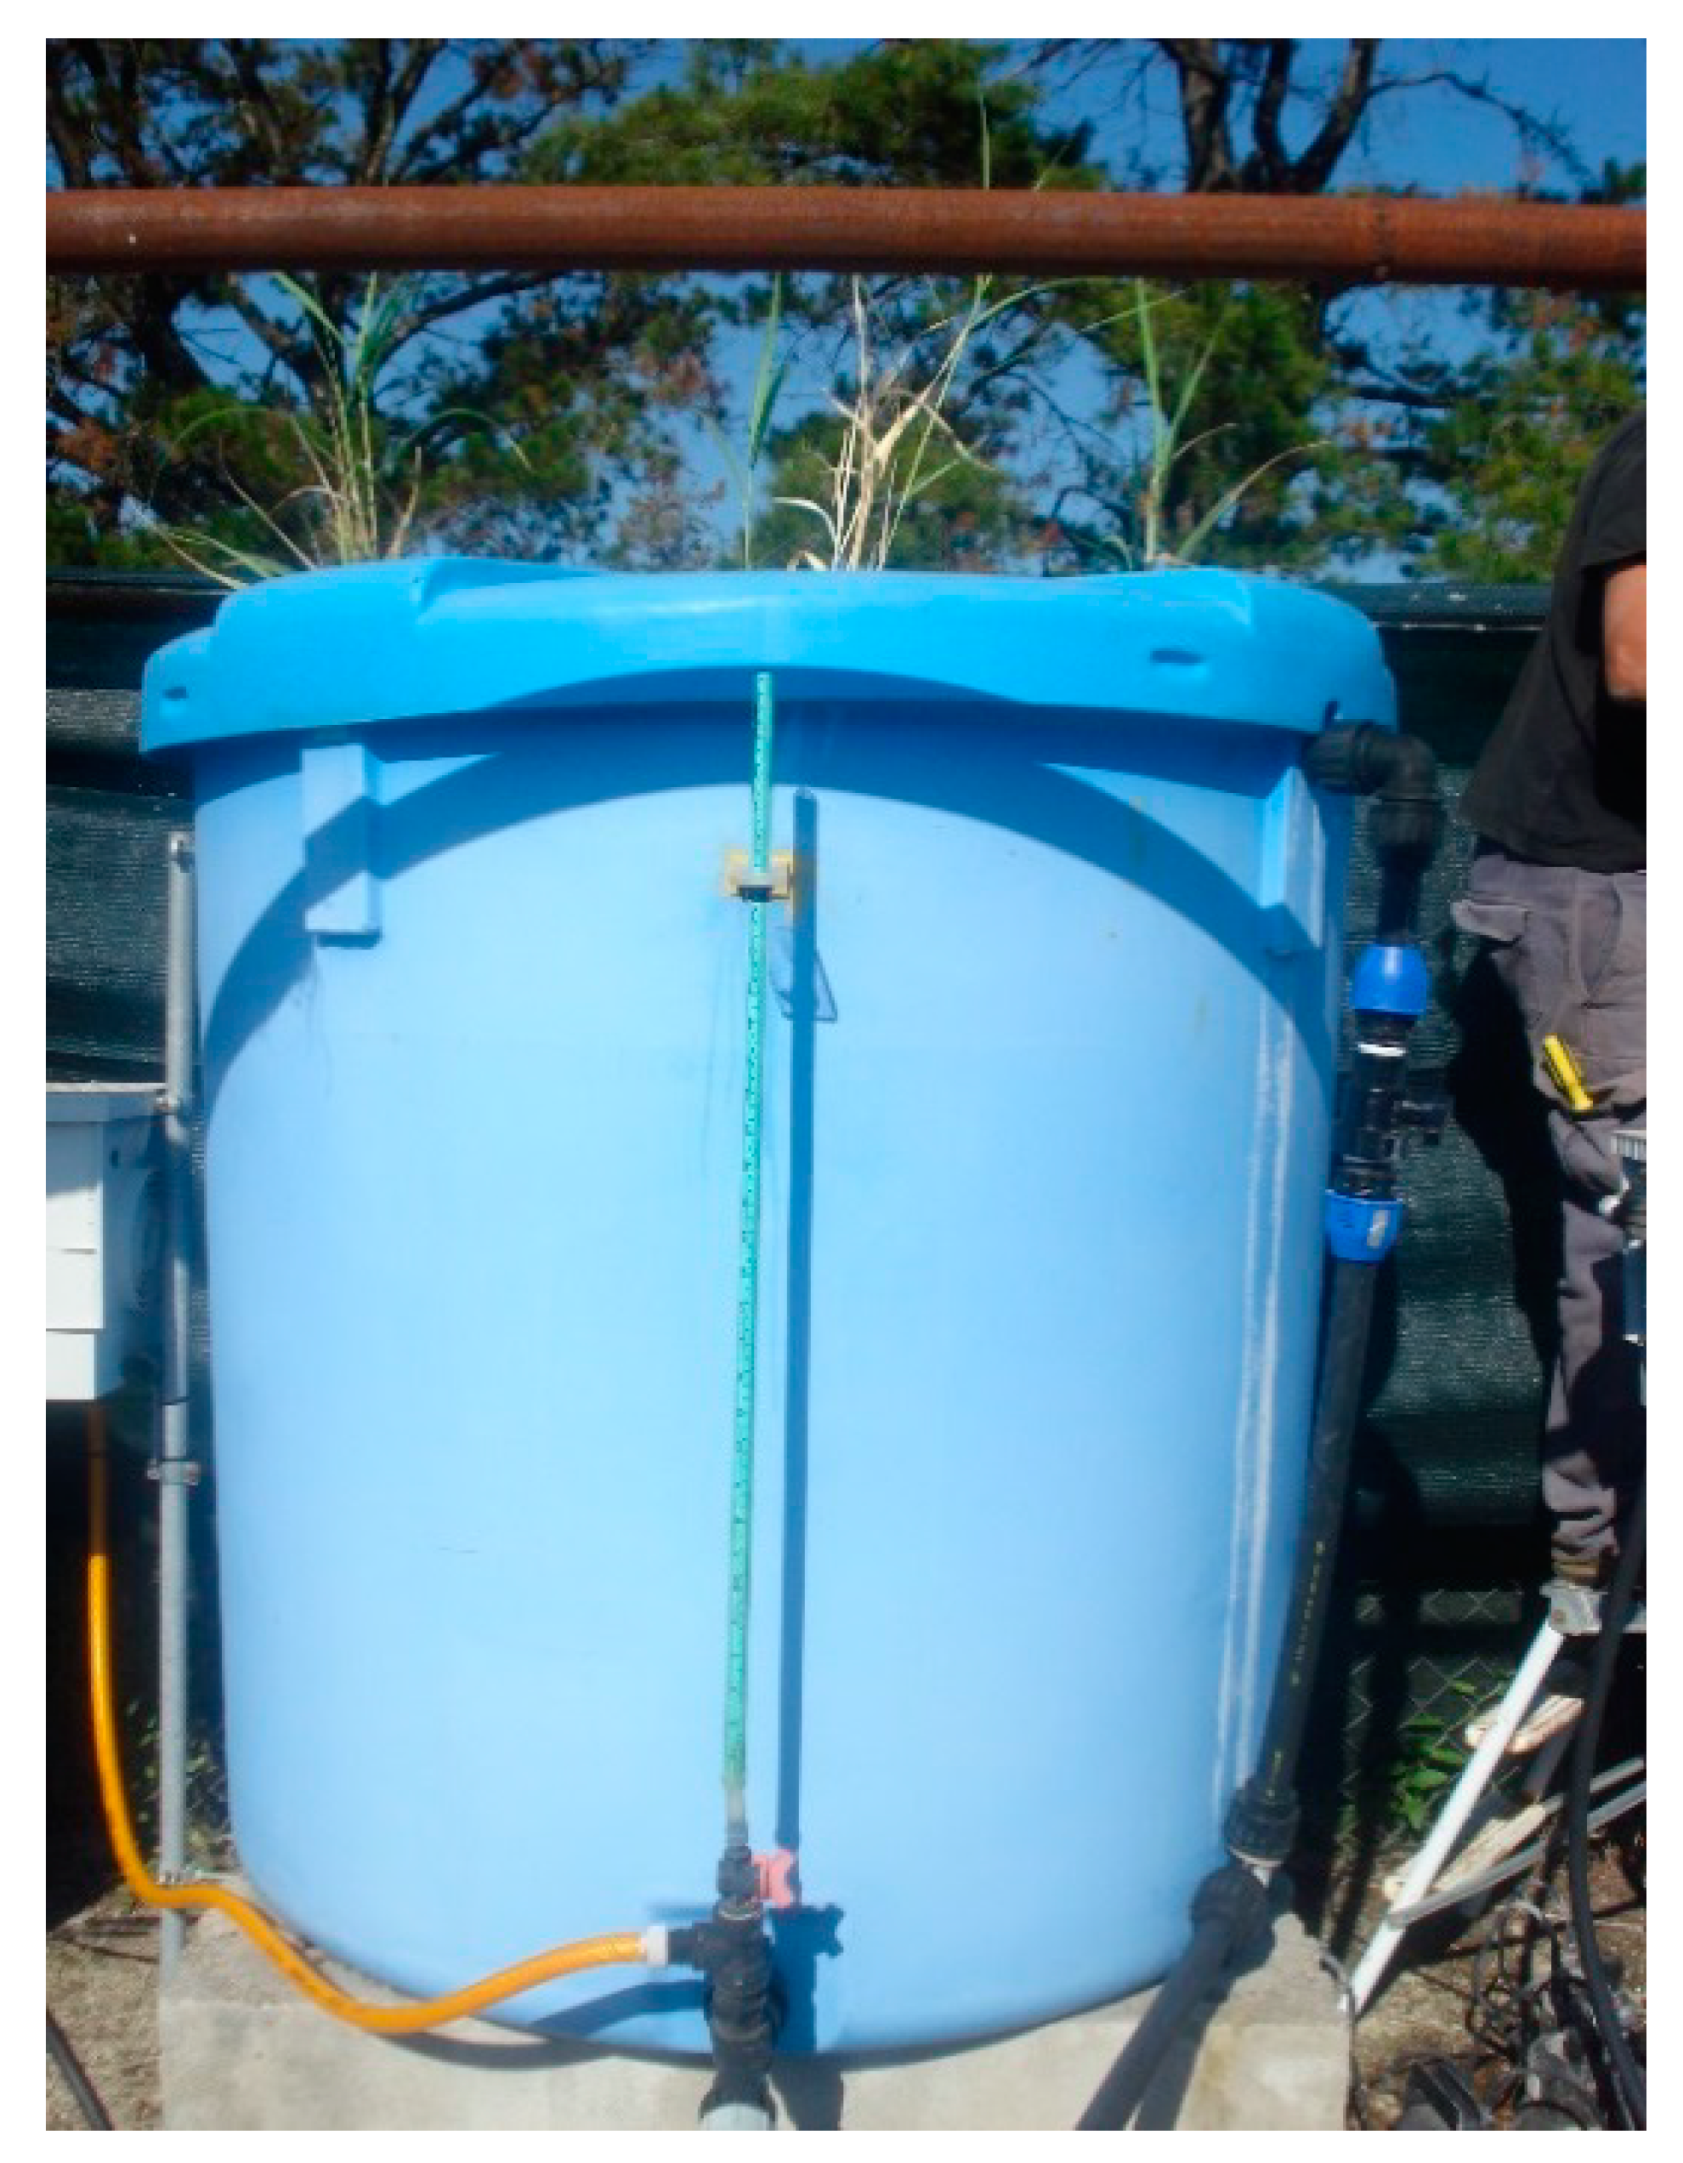
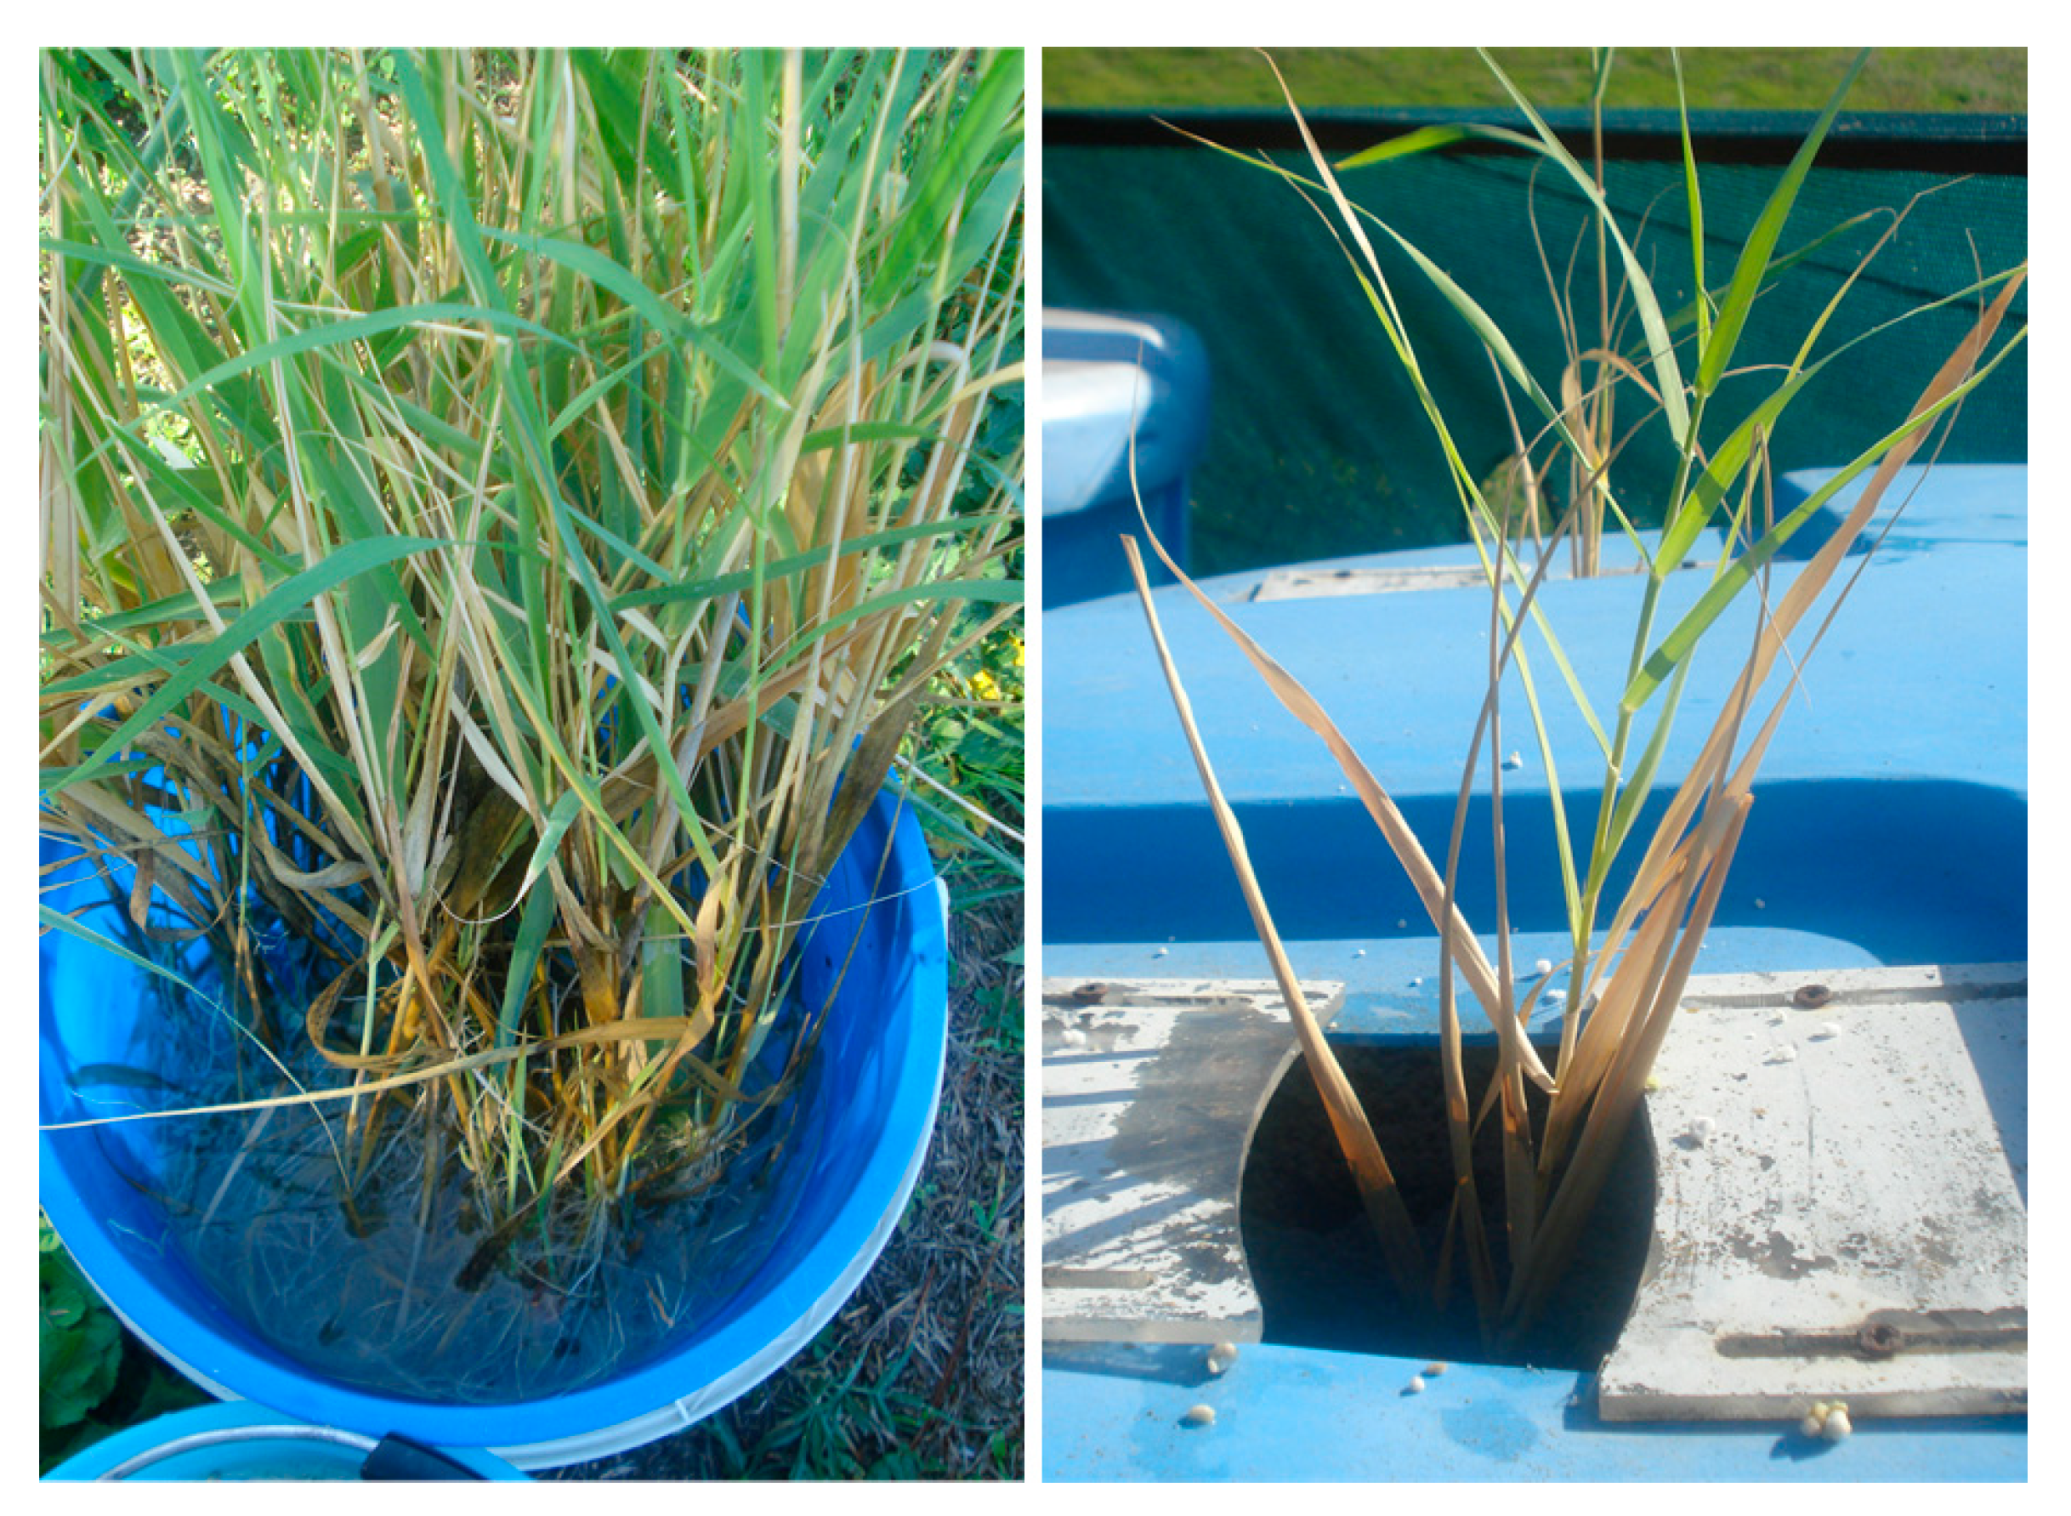
2.1. Plant Growth and Contamination

Arundo plants were grown under on-field environmental conditions in mesocosms (PVC) of 1 m3 (0.785 m2 × 1.3 m), filled with an upper layer (75 cm high) of perlite and a bottom layer (25 cm high) of gravel (15–30 mm of diameter). The mesocosms were positioned on an external research platform on a concrete basement and filled with 400 L of water (Figure 1). A recovery tank (50 L) collected the drainage and transferred it, with a pump, on the surface of the substrate, through a tube in PVC arranged in a ring and equipped with nebulizers. The solution drained again by gravity to the recovery tank in 150 min. A 10 L tank, equipped with a floating and a water flow meter, adjustable in height, allowed to fix and maintain the groundwater level.
Four homogeneous Arundo cuttings (considered as replicates) per mesocosm were transplanted on October 2017 (Figure 2). The leaves of the plants were sprayed monthly from October to December with a foliar fertilizer (P-K 30–20, plus negligible amounts of microelements from 0.1 to 0.05%). The same fertilizer was dissolved also in the tank. In June, the developed plants underwent the treatment with copper sulfate penta-hydrated (Carlo Erba Reagent, CAS 7758-99-8S). We compared three concentrations: 0 (control), 150, and 300 ppm. Two mesocosms were chosen as controls, while the remaining two mesocosms were treated, respectively, with 150 and 300 ppm. The mesocosms were randomly assigned to different treatments. The morphological, nutritional, and physiological characterization of the plants took place at 7, 14, 21, and 28 days after the contamination. In Figure 3 the main meteorological variables of the period are shown.

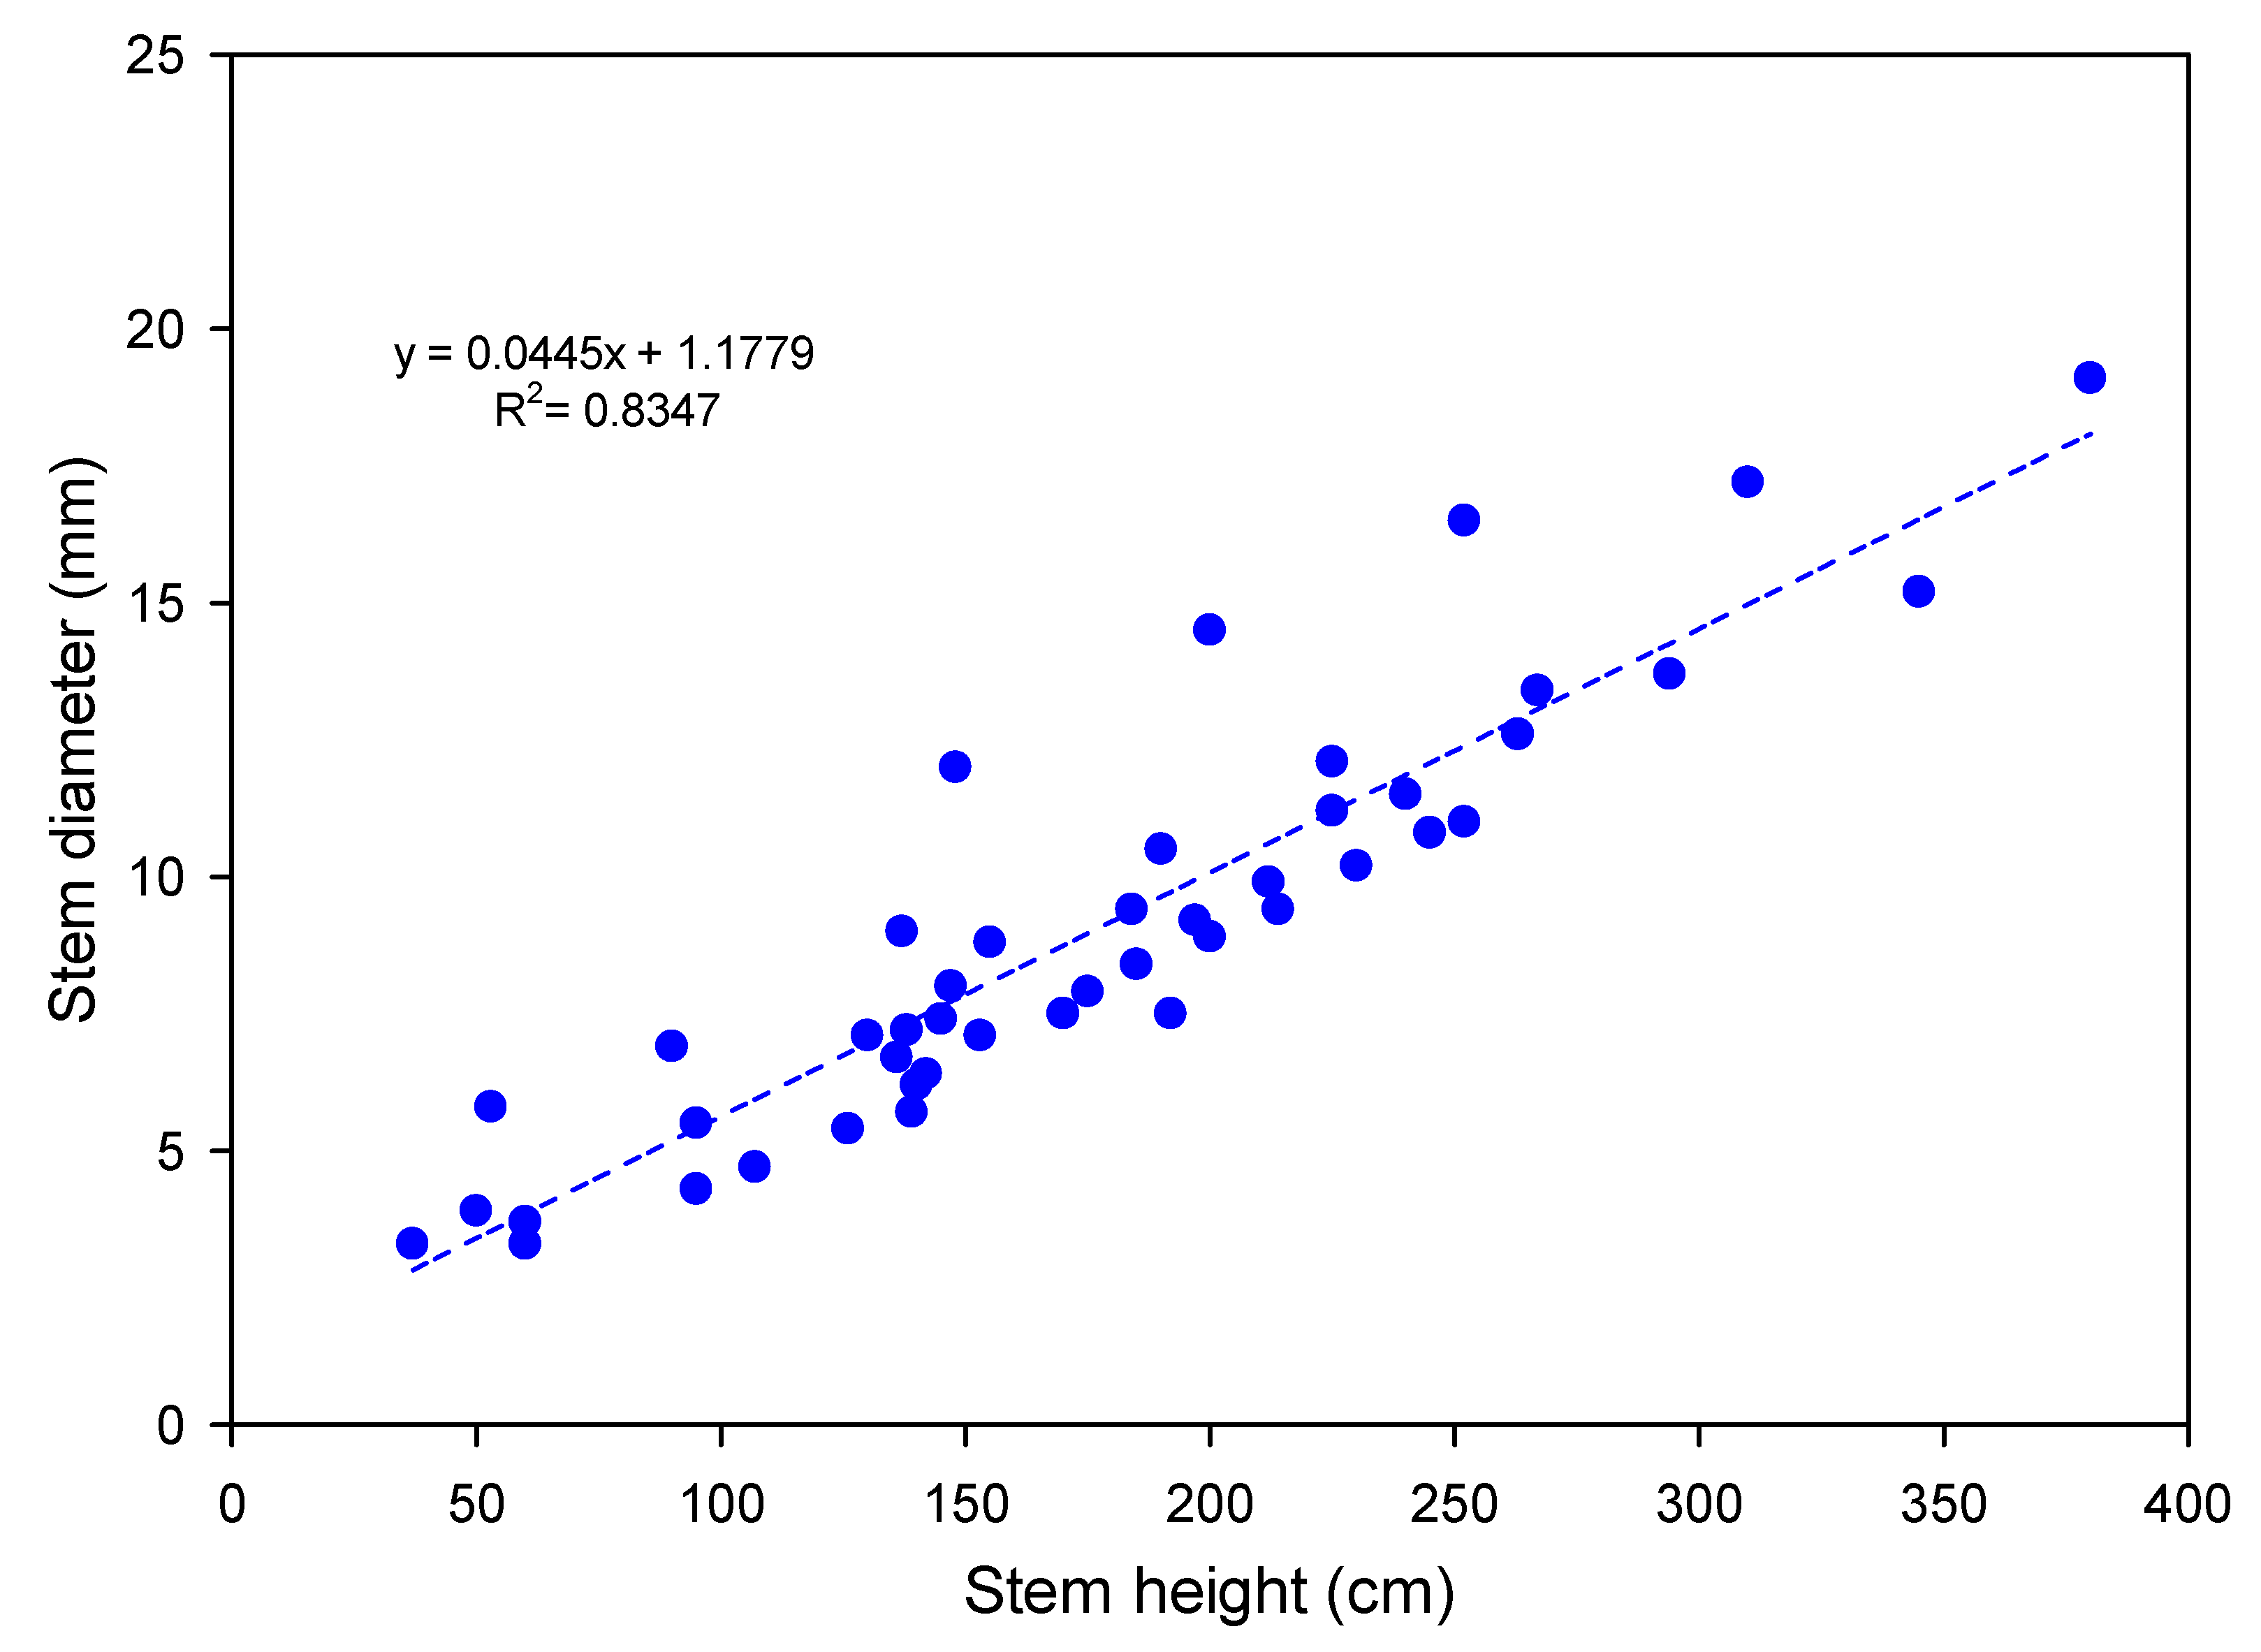
2.2. Morphological Characterization of the Plants

The morphological traits measured at the scheduled time (7, 14, 21, and 28 days after the copper contamination) were the height and the base diameter of the main stem, and the number of the stems of each plant. The four plants of each mesocosm were treated as replicates.

2.3. Nutritional Characterization of the Plants

Leaf samples were collected at each time-interval to examine the content of Cu, Fe, and Zn at the laboratory LAS-ER-B of CREA-IT (Monterotondo). For each treatment, one leaf per plant heavier than one gram was analyzed. The samples were dried at 105 °C for 24 h and homogenized to have a uniform distribution of the elements. At the end, about 0.5 g of each sample was weighed and placed into a microwave Milestone START D with the addition of 6 ± 0.1 mL of HNO3 65% and 3 ± 0.1 mL of H2O2 30%. The digestion was accomplished at 180 °C, 650 W for 42 min. In the end, the samples were filtered and diluted with deionized water. Each sample was analyzed in triplicate and with a blank. The content of microelements (mg kg−1 dry weight) was measured with ICP-MS (Agilent 7700).

2.4. Determination of Physiological Parameters

The leaf chlorophyll content was estimated at 7, 14, 21, and 28 days after the copper contamination by a SPAD-502 Chlorophyll meter (Minolta Inc., Osaka, Japan), as reported by [14]. The measurements were taken from at least two fully developed leaves per plant. Four SPAD readings were taken from the widest portion of the leaf lamina while avoiding major veins. The four SPAD readings were averaged to represent the SPAD value of each leaf. SPAD values were converted to chlorophyll content (µg cm−2) using the equation [23]:
Chlorophyll content = (99 × SPAD value)/(144 − SPAD value)
The chlorophyll fluorescence parameters were measured on the same leaves used for the chlorophyll content. Chlorophyll a fluorescence transient measurement (OJIP transients) was carried out using the PEA fluorimeter (Plant Efficiency Analyzer, Hansatech Instruments Ltd., King’s Lynn, UK). Plant materials were dark-adapted (with leaf clips) for about 1 h before measurements. Chlorophyll fluorescence transient was induced by applying a pulse of saturating red light (peak at 650 nm, 3000 μmol m−2 s−1). Changes in fluorescence were measured for 1 s, starting from 50 μs after the onset of illumination. During the first 2 ms changes were recorded every 10 μs and every 1 ms afterward. The obtained data were used in the JIP test [24] to calculate several (the following) bioenergetic parameters of PSII photochemistry (Table 1).
Moreover, always on the same leaves, the electron transport rate (ETR) was measured using the MINI-PAM fluorimeter (Walz, Effeltrich, Germany) equipped with a leaf clip holder (Model 2030-B, Walz). The electron transport rate (ETR) was determined by adapting the leaves for at least 10 min to a photosynthetic photon flux density (PPFD) of 1000 μmol m−2 s−1. The value of ETR was calculated as follows:
ETR = ΦPSII × PPFD × f × Abs,
where ΦPSII is the quantum efficiency of PSII photochemistry in light-adapted leaves [25], f is a factor that accounts for the partitioning of energy between PSII and PSI and is assumed to be 0.5, indicating that excitation energy is distributed equally between the two photosystems [26] and Abs is the fraction of PPFD absorbed by the leaf. The Abs value depended on the chlorophyll content (µg cm−2) and it was calculated by applying the modified equation of [27] as follows:
Abs = Chl/(Chl + 6.66),
where 6.66 is an empirical constant with the dimension of µg cm−2. The ETR value represents the overall photosynthetic capacity in vivo and is used as a proxy for photosynthesis in field investigations.

2.5. Statistical Analysis

The PAST software (version 3.22, 2018, Øyvind Hammer, University of Oslo, Norway) was used for the analysis of morphological characters. The data were verified for normality with the Shapiro–Wilcoxon test and in case of deviation, they were analyzed with the non-parametric Kruskal–Wallis test. With normally distributed and homoscedastic data we proceeded to Analysis of variance ANOVA (one or two way). The separation of the means was performed using Tukey’s HSD test unless otherwise stated. A principal component analysis (PCA) using the same software was run on both the morphological data and the microelements content.

3. Results and Discussion

3.1. Morphological Characterization

Copper plays a role in plant physiology and at low levels, (3–20 mg kg−1 DW), is required for plant development [28,29]. It is a constituent of proteins and enzymes. These act in cell compartments like endoplasmic reticulum, mitochondria, and chloroplasts [30]. The copper supplied to the substrate favored the plant growth soon after treatment. In the present study, the height of the main stem was always higher in the treated plants than in the control. But, at each time interval, the difference was never significant (Table 2). The number of stems in plants grown on 300 ppm Cu was two-fold higher than in control plants one week after treatment (Table 2). This was the only case where the difference among treatments was significant. After 28 days, the gap between 300 ppm and the other two treatments diminished.
The basal diameter of the main stem showed a similar trend (Table 2). The highest growth was observed at 300 ppm during the first two weeks. Then, the diameter remained around 12 mm while in the plants of the control and 150 ppm increased up to 11 mm. However, it should be stressed that the percentage variation between the value of the variables at day 0 (starting of the contamination) and at the end of the test was always higher in untreated than treated plants (Table 2). Therefore, this aspect suggests that an inhibitory effect of copper on the growth rate of the plants occurred and that such effect could be more evident in the long term. It is also possible that a part of Cu applied was no more bioavailable due to precipitation of CuS or other compounds, but these have not been considered.
Elhawat et al. [31] observed a behavior resembling what observed in the present study. Arundo plantlets of two ecotypes grown in vitro and exposed to increasing Cu levels (from 0 to 26.8 mg L−1) did not show evident symptoms of Cu toxicity. At the highest concentration, the fresh mass of the plant stems increased, but the root length and the number of new buds per plant were higher in one genotype. This implied the activation of tolerance mechanisms slightly different among genotypes [19,31]. In a study of rhizofiltration [29], the Arundo plants revealed a high efficiency in removing the Cu from Cu-rich Bordeaux mixture effluents in pilot-scale constructed wetlands (CW). After one month of exposure, the shoot and root dry weight increased on average by 47% and 23%. The authors hypothesized that the Cu excess prompted some detoxification mechanisms, but the metabolic cost lowered the efficiency of other processes like photosynthesis [29]. Our data are in accord with such a hypothesis.
Regardless of the concentrations, a direct relation linked the stem height and the corresponding basal diameter (Figure 4). The result was in agreement with other observations [32] in the Italian environment.
Copper sulfate is a compound used to restrain several pathogens of vegetables, vineyard, and orchard trees. In this study, the goal was to reproduce a condition of a farming system or an ecosystem close to farming activities. In soil, the sulfate is not a limiting factor, as the plants absorb it from the circulating solution or fertilizers. A direct involvement of the ion cannot be excluded but does not appear so influential. On the other side, unless of lithological origin, the content of Cu must derive just from farming activities. Within the range of the concentrations used in this work, the Cu may have played a role in plant growth. Yet, a more in-depth analysis of the effect on the photosynthetic process has shown a negative influence in the short period.

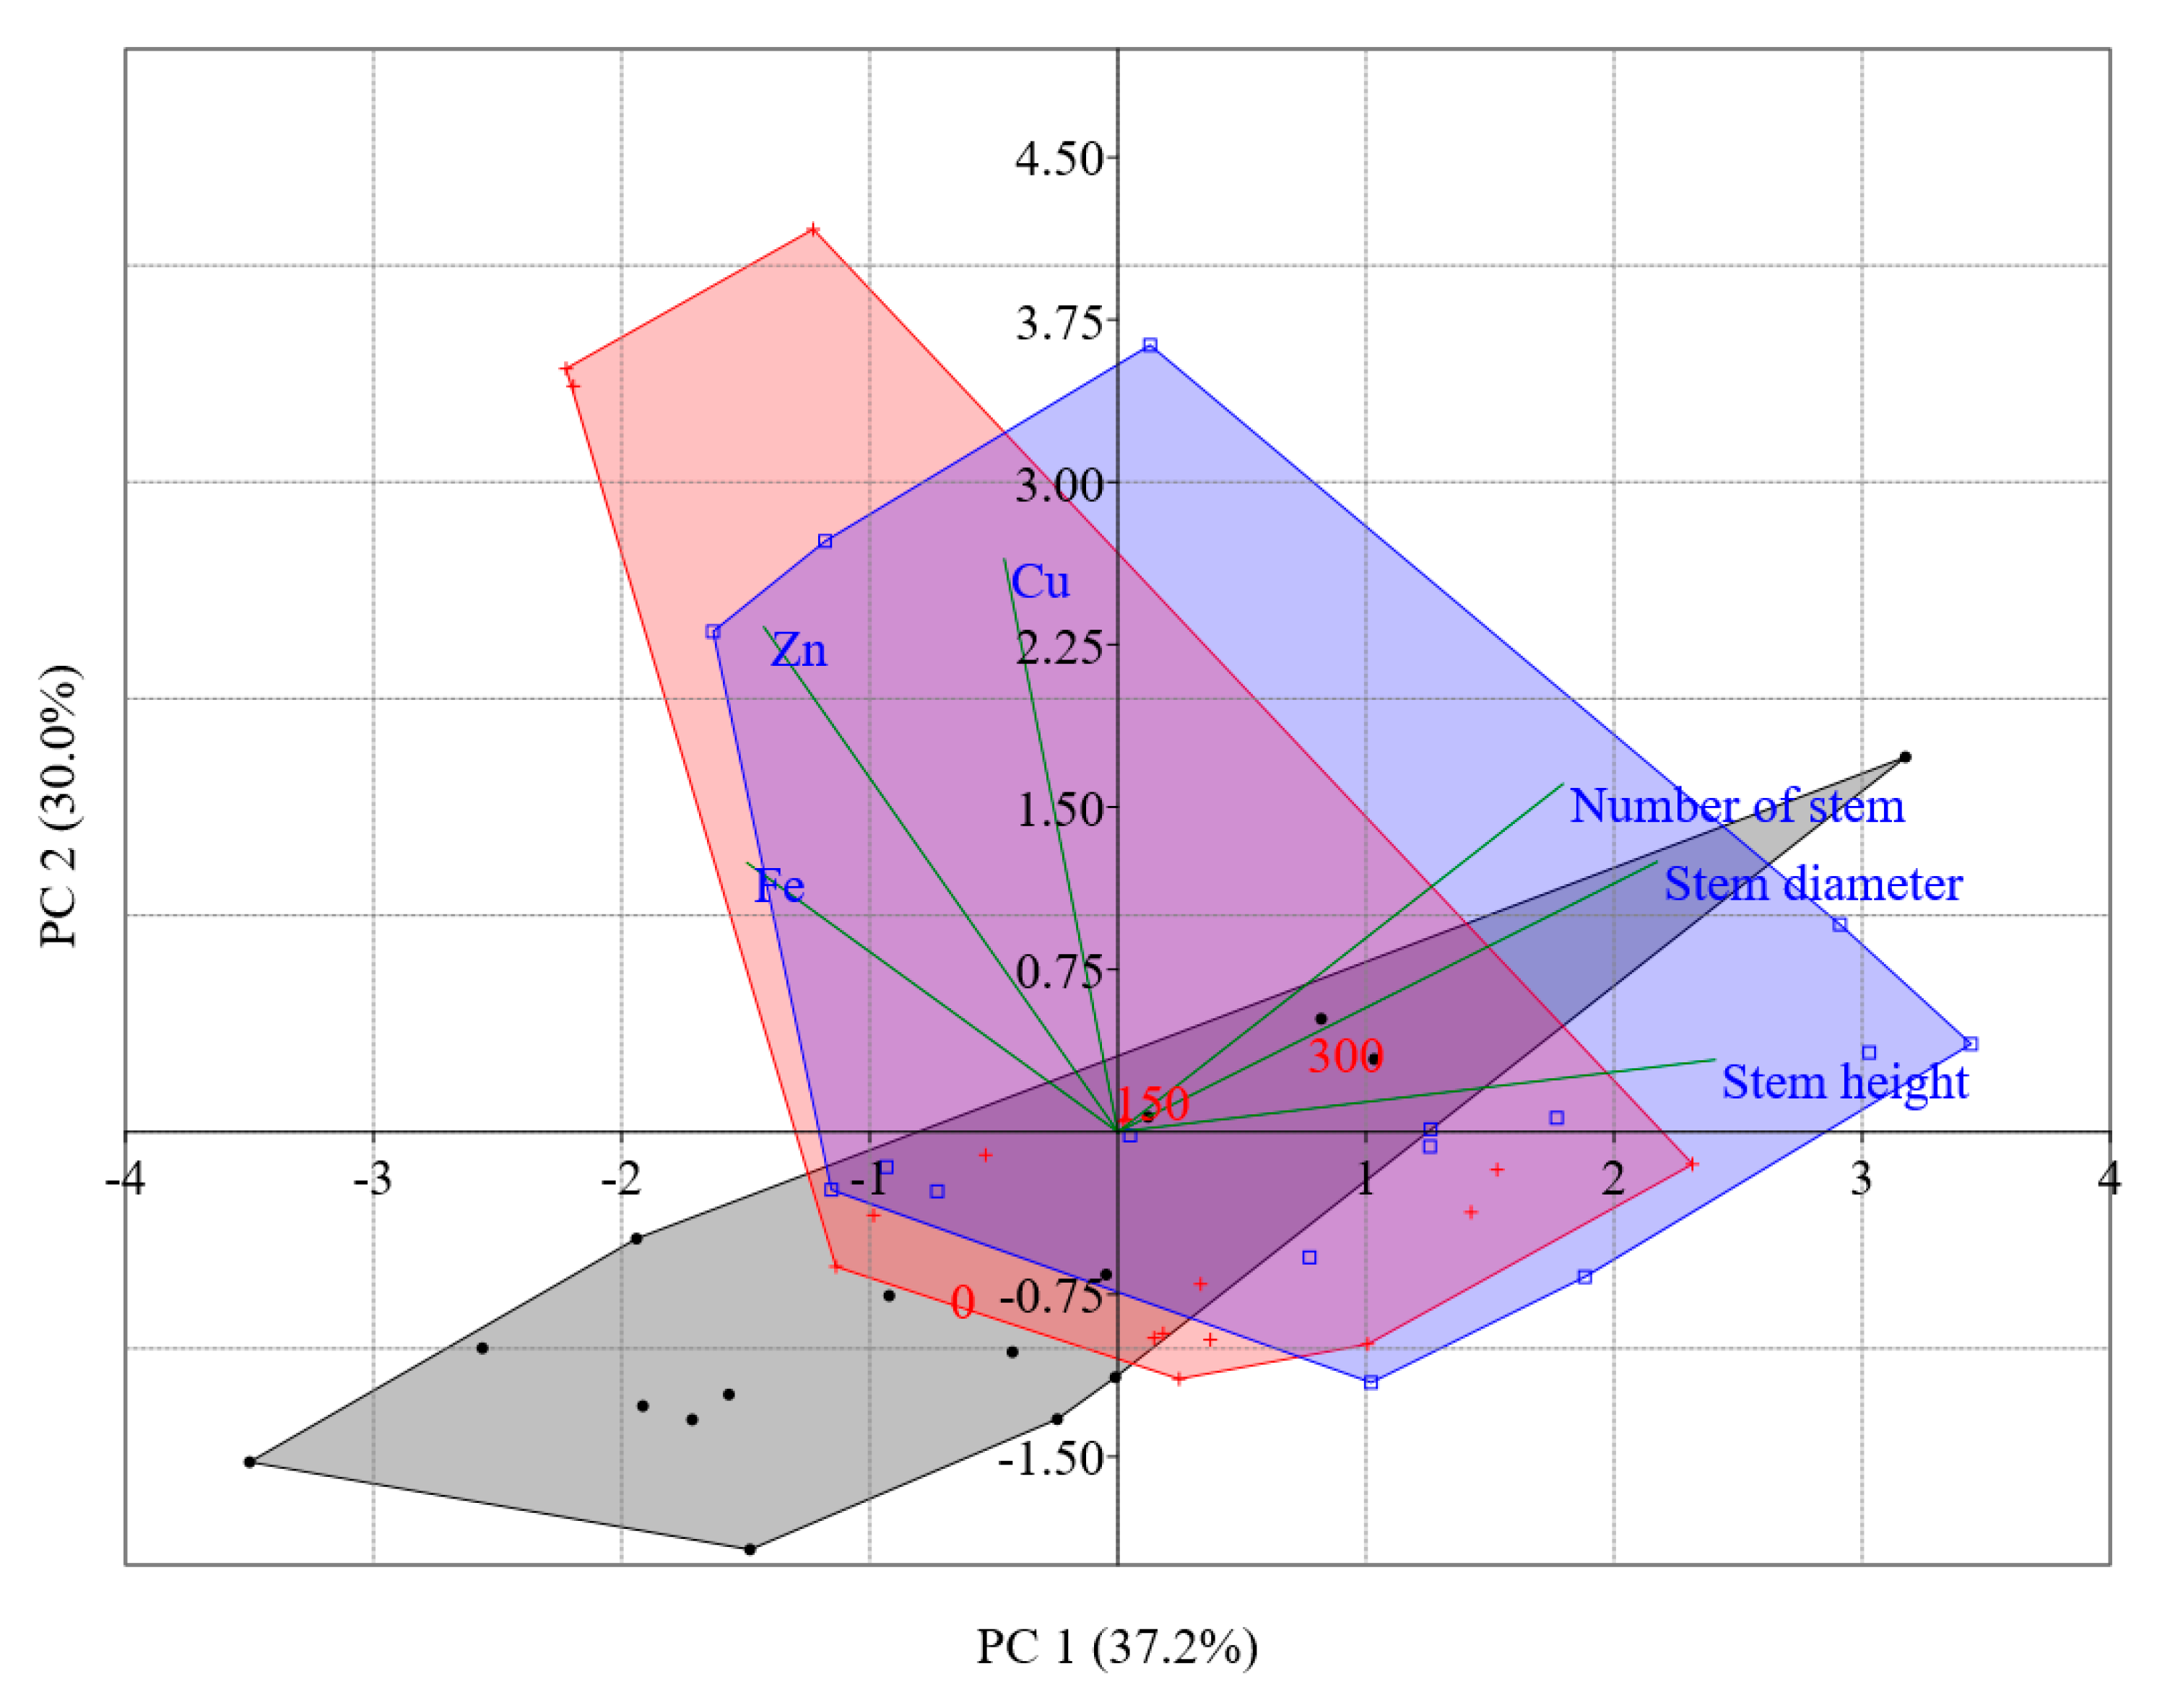
3.2. Nutritional Characterization

As described before, the contaminating solution in the tanks was pushed by a pump on the top layer of perlite and entered again in the system. Within one week, the solution of the tanks re-circulated (several times) in the complex root system-perlite. This explains the low concentration of Cu within the treated tanks (Figure 5). The values reflected quite well the levels of the treatments, and hence the correct application of the element to the substrates. The concentration of copper was significantly higher in the tanks of the treated mesocosms than in the tank of control (Figure 5). Such a difference was present both at the start and the end of the test. One week after the contamination the concentration of copper inside the tanks of 300 ppm treatment was the highest. After 28 days, the difference between the treated and the untreated mesocosms remained. But the copper concentration was comparable in the tanks of 150 and 300 ppm. Thus, it is plausible to assume a greater absorption by the plants exposed to 300 ppm Cu than those treated with 150 ppm Cu.
Net of copper found in the leaves, most of the element was probably accumulated at the root level and hypothetically onto perlite. Many authors observed that the accumulation of metals in Arundo occurs mainly in the roots and rhizomes [15,16,29]. Here, mechanisms to protect the plant from heavy metal toxicity are present [33]. Other elements, like Zn, can move from the belowground to aboveground organs [15,16]. Expanded and unexpanded perlite have some properties favoring the adsorption of metal ions [34,35,36]. The adsorption mechanism is a function of factors as pH, adsorbent dosage, temperature, and contact time [36,37]. For Cu ions, the adsorption percentage on perlite or expanded perlite may reach 80%–90%. This level required an adsorbent dosage greater than 15–20 g L−1, a pH higher than 4, and a temperature between 20 and 30 °C [35,36,37]. Some works on constructed wetlands (CW) supported the involvement of the substrate in the element removal. The unplanted CW showed higher efficiency in removing the heavy metals compared to the CW units planted with macrophyte [29,38,39,40].
The copper concentrations in the tank were greatly lower than those at the leaf level (Figure 6). This suggests that the plants adsorbed the element from the complex root system-perlite and transferred it to the leaf (Figure 6). After 7, 21, and 28 days from the treatment, the amount of copper in the treated plants was significantly higher than the control. Yet, the concentration of the element was not dependent on the Cu dosages. After one and four weeks from the contamination, the Cu level at 150 ppm Cu was higher than at 300 ppm Cu. During the study, the concentration of Cu in the leaves of the control plants remained within the normal range (3–20 mg kg−1 DW) [28,29]. On the other side, in the treated plants the Cu concentration overcome the upper threshold after one and three weeks and dropped close to the control value at 28 days. Plants exposed to Cu activate a mechanism of detoxification to counteract the adverse effect of the oxidative stress [28,41]. The reduction of the oxidative damage allows recovering a steady growth as observed at the end of the study.
High Cu concentrations cause a competition at the rhizosphere level between Cu and other elements, in particular, Fe and Zn [42]. Accordingly, a physiological imbalance induced by copper was observed (Figure 7). One week after the treatment, the Fe content in the leaves at 300 ppm Cu was the highest. In the following period, the Fe values in the control plants were always higher than the treated plants. Similar behavior occurred for zinc (Figure 8). One week after the contamination, the content of Zn in the leaves was significantly higher in the treated plants. At 150 ppm of Cu, the Zn content in the leaves was twofold higher than the treatment with 300 ppm and about 3–4 times greater than the control. In the following three weeks, the content of Zn in the leaves was always significantly higher in the control plants.
Excessive Cu uptake modifies the mineral homeostasis. The effects may vary in response to factors as plant species, exposure time, and growth conditions [28]. According to Lequeux et al. [43], it can be difficult to individuate a clear trend for some elements like Mg, S, Fe, and Zn. As observed by Ambrosini et al. and Azez et al. [10,44], the presence of an increasing amount of Cu in the soil may reduce the Fe and Zn availability. An excessive Cu uptake caused a decrease of Fe and Zn content in plant tissues of Arundo [29], rapeseed and Indian mustard [45] in a short–medium period. In poplar [46] the supply of Cu decreased the Zn content and increased the Fe concentration. In this context, one of the most common responses in plants exposed to Cu excess is the hindrance of Fe and Zn uptake. Iron is known as an antagonist of Cu during the uptake [45]. Instead, Zn has a similar ion strength of Cu and it competes for the metal transporter molecules [44,45]. The outcome of the present work confirmed such behavior from 14th to 28th day, while in the first week Fe and Zn accumulated in the leaves. A contradictory behavior was observed also by Lequeux et al. [43] which reported an increase in Fe and Zn concentrations in roots of Cu2+-treated plants of Arabidopsis grown hydroponically. In this case, the author hypothesized the effect of Fe–EDTA in the nutrient solution. The displacement of Fe by Cu ions from Fe–EDTA complexes could allow a higher availability of Fe ions [43]. Thus, in our case, the substrate (which, as discussed previously, could not be completely inert) might have played a role in the first phases after the contamination. An alteration of the adsorption of metal ions may have led to the increase of Fe and Zn similarly to what observed by Lequeux et al. [43].
To better highlight the response at growth and nutritional level, a multivariate analysis was conducted (Figure 9). The PCA showed a clear differentiation between the Cu-treated and the control plants. The areas of the Cu treatments partially overlapped in the upper quadrants. Instead, the area of the control plants was in the opposite quadrants. The first component accounted for a large part of the morphological traits. These, in turn, were influenced by the highest Cu concentration (300 ppm). The second component was associated with microelement content. The Cu contamination caused differentiation of Cu, Fe, and Zn content in the treated plants, with a specific effect on the plants grown at 150 ppm Cu.

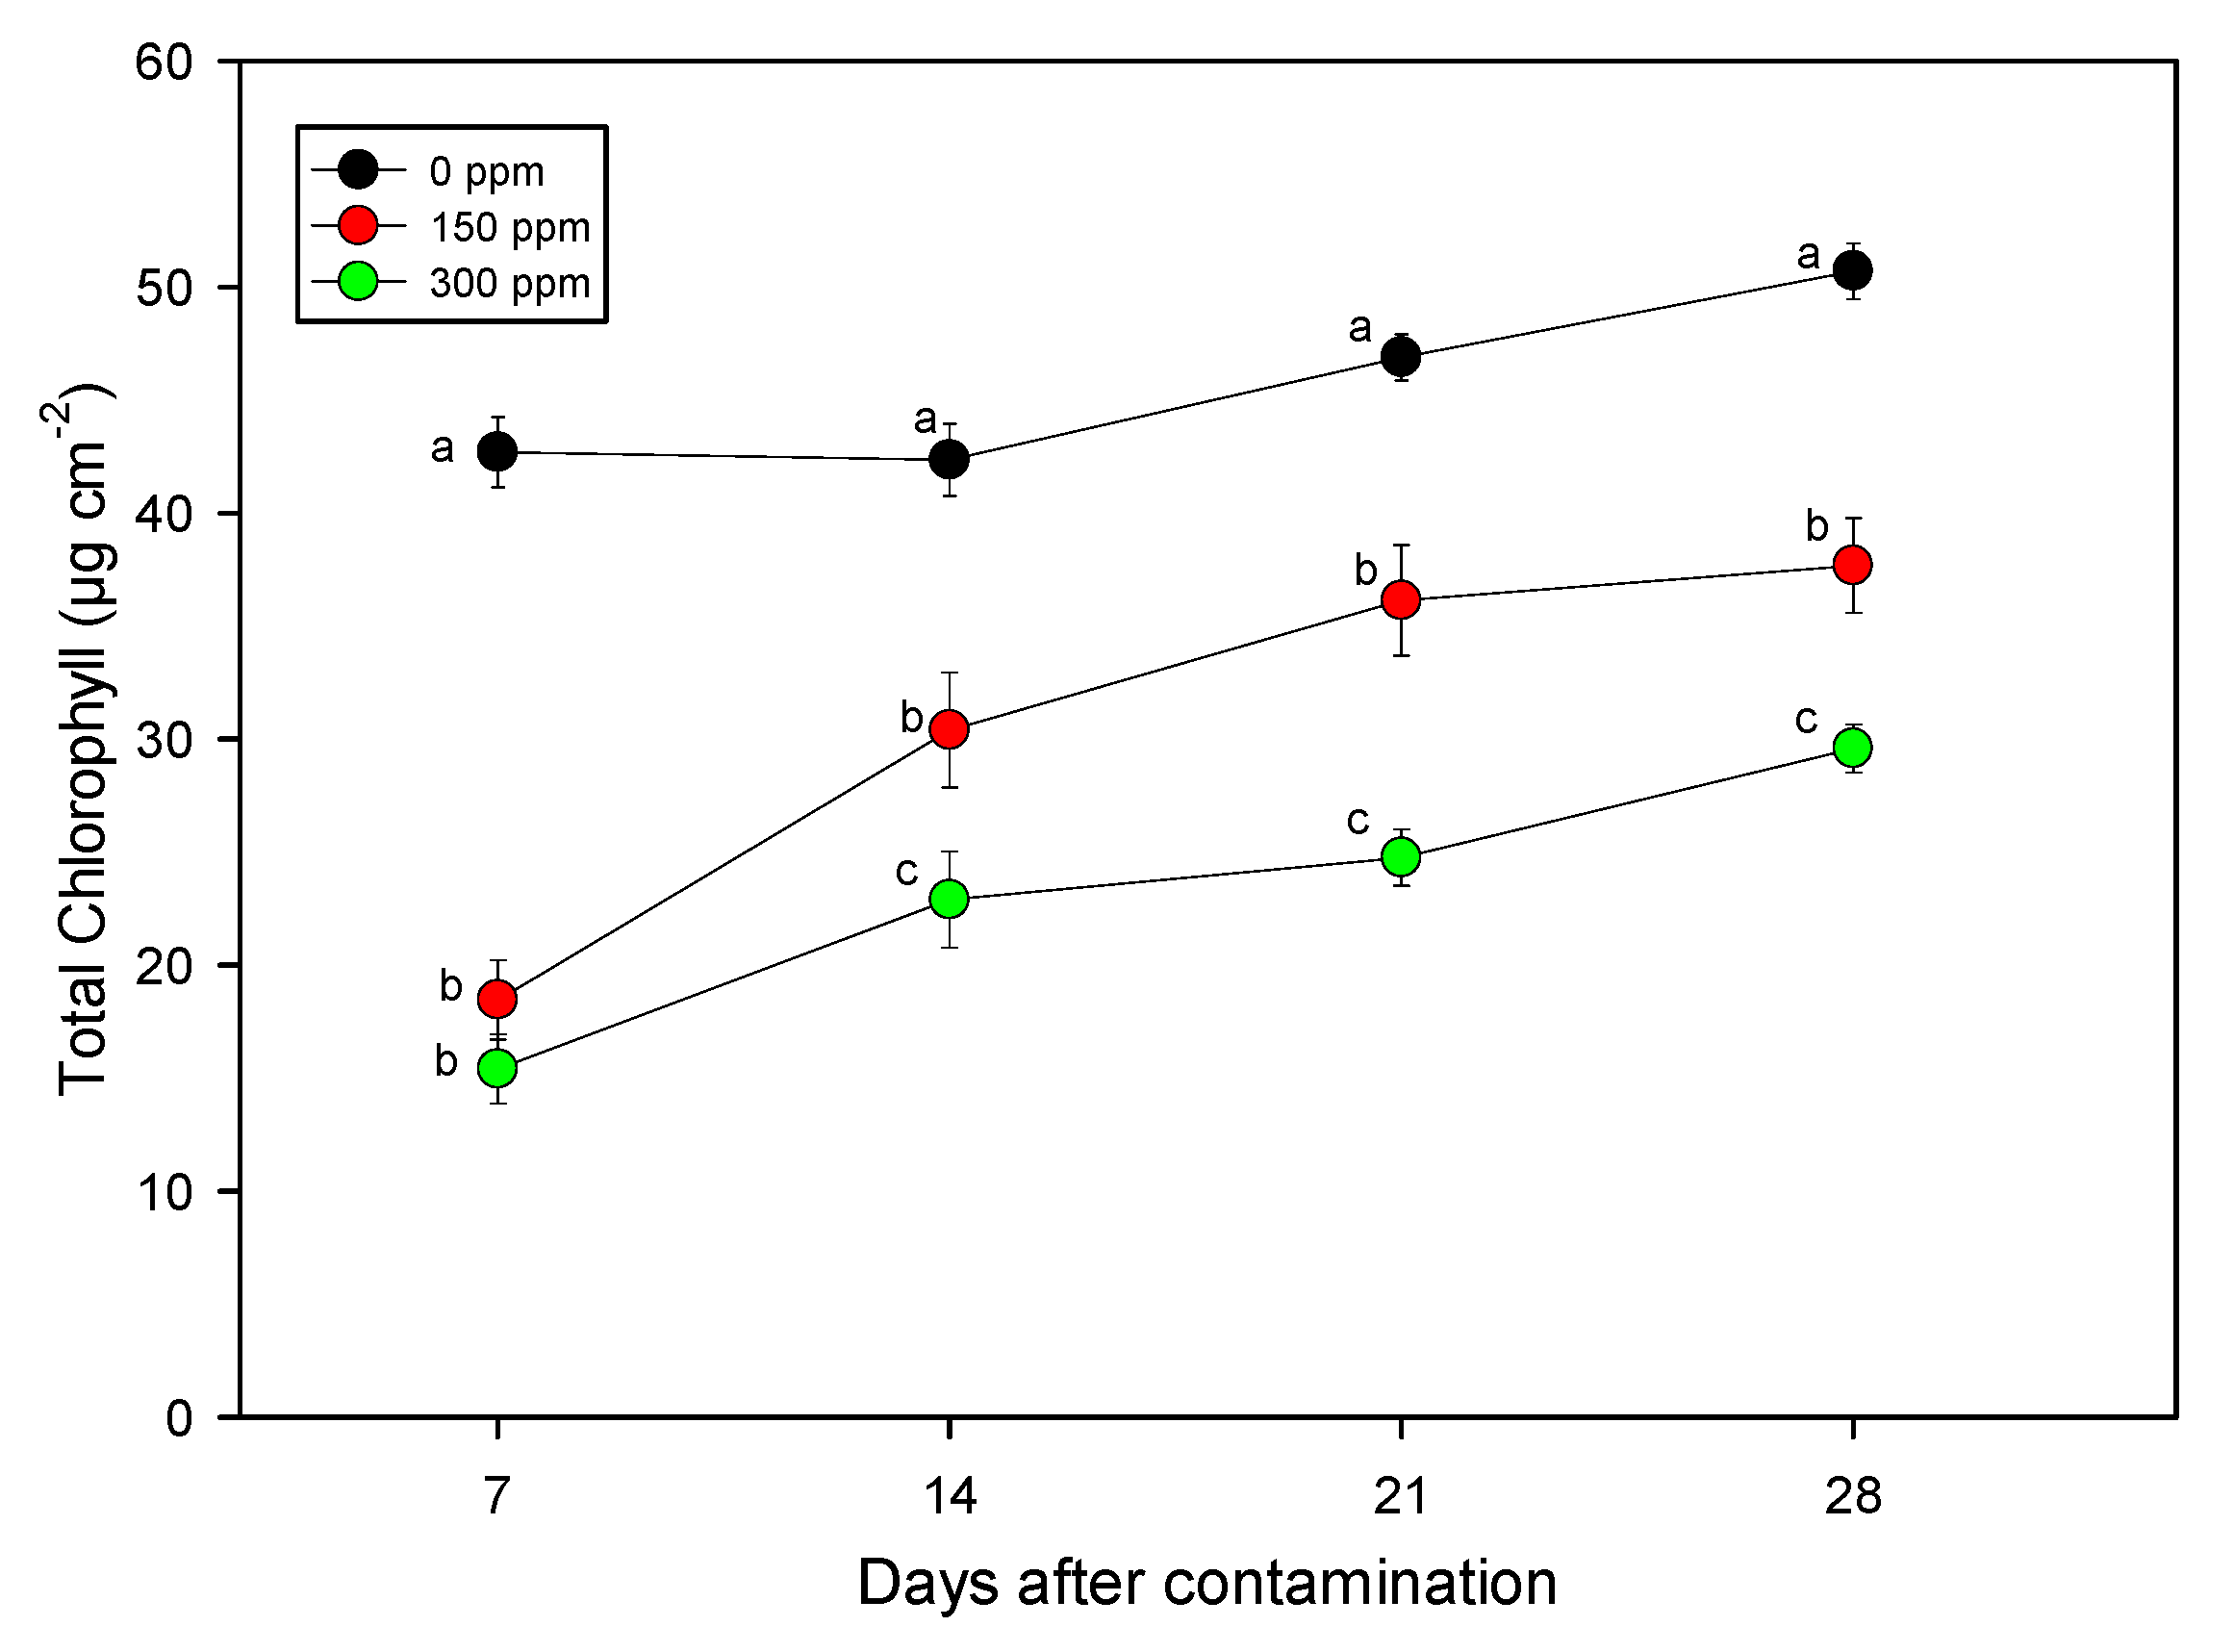
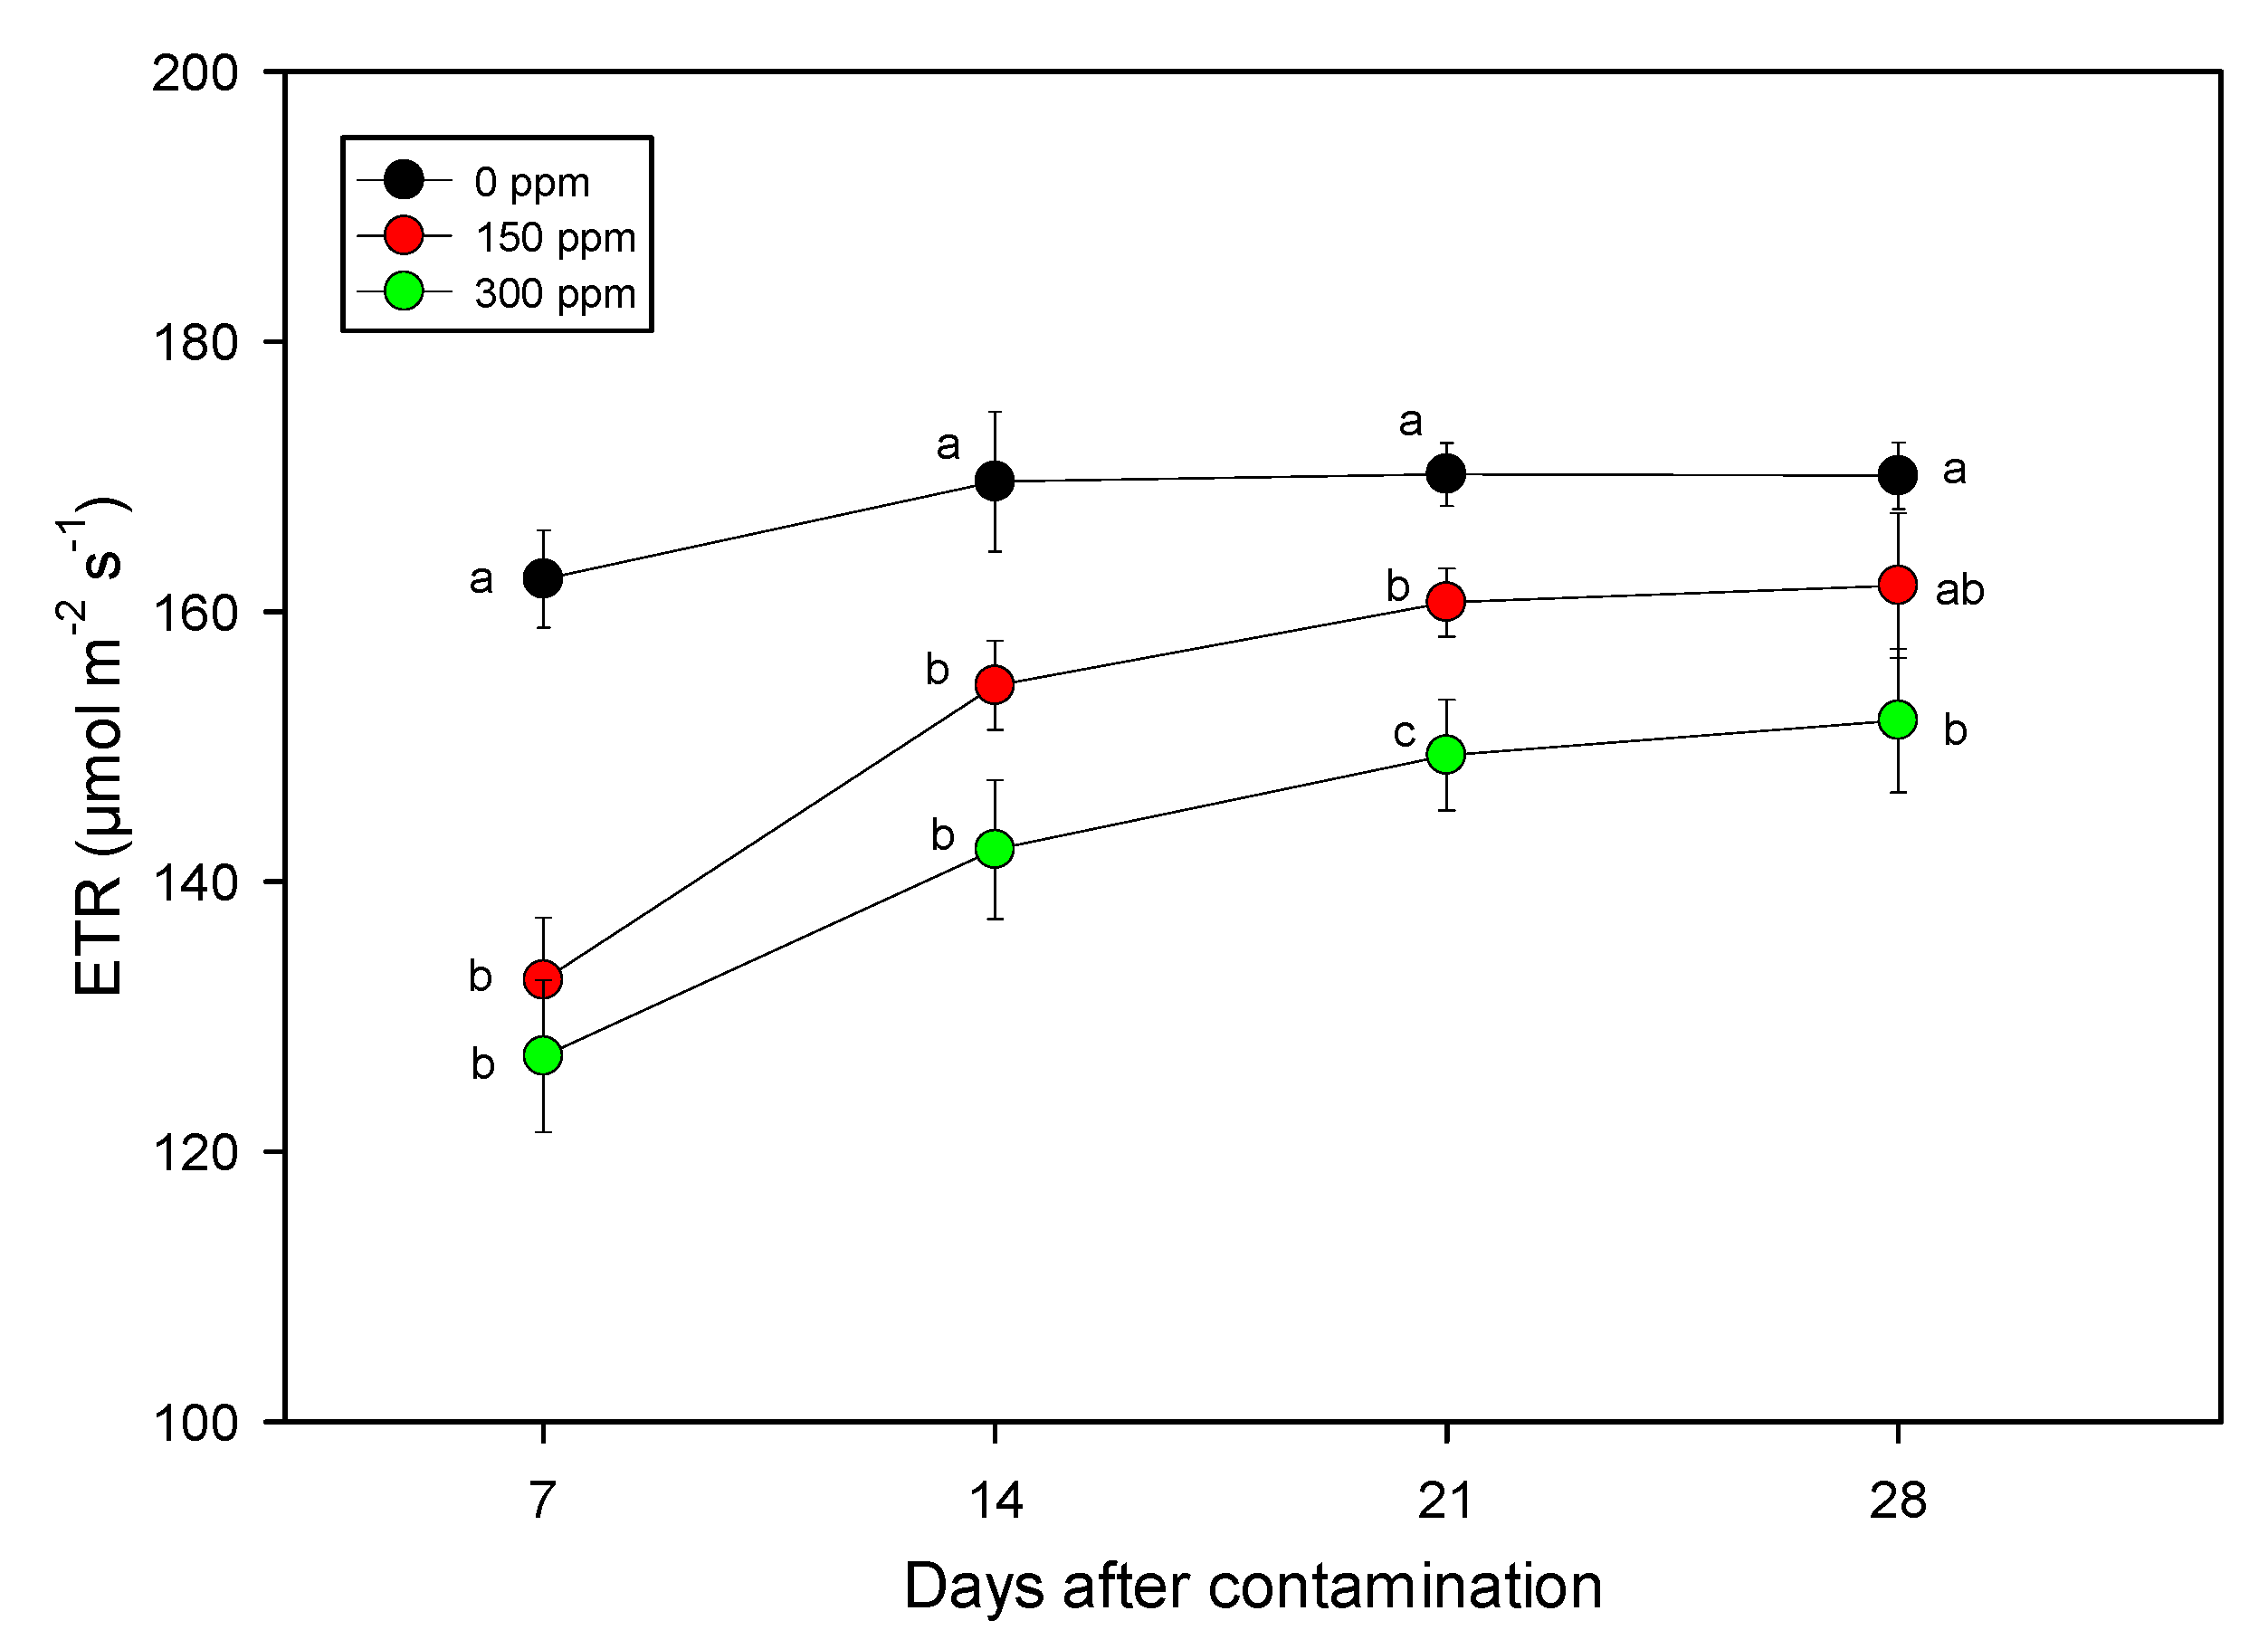
3.3. Determination of Physiological Parameters

The leaf chlorophyll content is one of the most important factors determining the photosynthetic potential and primary production [47]. It can be also used as an indicator of phytotoxicity, allowing to analyze the effect of pollutants on photosynthetic and respiratory rates [48,49]. Figure 10 shows the chlorophyll content along the experimental time-course. Increasing the concentration of copper caused a reduction of the chlorophyll content. The greatest decrease was registered after the first week (around 57%–65%), while in the following weeks the treated plants recovered at least in part. At 28 days, the difference with the control was around 30% (150 ppm) and 40% (300 ppm).
The negative effect on chlorophyll content of Cu excess has been reported for different species, growth system, and Cu concentrations [10,29,41,50,51]. As observed by Oustriere et al. [29], the metabolic cost for detoxifying and limiting the adverse effects of Cu can reduce the resources for other physiological processes. Copper interferes with chlorophyll organization and functionality. Structural damages of the photosynthetic apparatus involved the thylakoid component [28]. Our data confirmed the influence that an unbalanced Cu uptake has on chlorophyll content. Plants exposed to copper show leaf chlorosis and, with increased exposure, necrosis can appear in the leaf tips and margins [31,46,51]. Even so, no necrotic spots appeared during the experiment on leaves of Cu-treated plants. Thus, from one side the growth was not affected or slightly affected by the presence of Cu at 150 and 300 ppm (Table 2). On the other side, the Cu treatments reduced the efficiency of the photosynthetic process (Figure 10 and following). The existence of a threshold of toxic concentration (variable for species and growth system) appears plausible. Below a certain value of Cu, the synthesis of low molecular weight stress proteins reinforced the action of the antioxidant enzymes [51]. The homeostatic control of copper excess limited the damages and maintained a normal growth rate.
In Figure 11, the trend values of the electron transport rate (ETR) along the experimental time-course are reported. ETR is an important parameter that refers to the apparent photosynthetic electron transport rate. It reflects the efficiency of electron capture by the PSII reaction center giving a clue of overall photosynthesis [26]. Deficiency or excess of copper alters the photosynthetic ETR [30,52]. Our data showed that, as in the chlorophyll content, ETR was transiently modified by copper treatments (Figure 11). Even in this case, the highest ETR decrease occurred after the first week (around 18%–21%). In the following weeks, the plants treated with Cu improved their ETR, showing at the 28th-day values around 5% (150 ppm) and 11% (300 ppm) lower than the control.
Finally, we analyze the bioenergetic parameters obtained from the JIP-test. This provides information about the effect of the treatment on the processes involved in the light absorption and its conversion to biochemical energy. The measurements of structural and functional parameters were normalized against the values of the control plants and reported in a radar plot (Figure 12). Chlorophyll a fluorescence-transient analysis is an efficient tool for studying physiological aspects of structure and activity, mainly in the PSII [24]. It has been widely used to assess the damages to the photosynthetic system by various types of stress [26].
The exposure of plants to copper concentrations of 150 and 300 ppm caused an alteration of most of the parameters analyzed except for F0 (Figure 12A–D). The absence of F0 variation indicates a good ability of the treated plants to maintain the efficiency of energy transfer between the pigments of the antenna and the PSII reaction center without structural damages at the photosystems level. In fact, an increase in F0 can be interpreted as indicating irreversible damage to PSII caused by uncontrolled dissipation of heat that produces an excess of excitation energy [53,54]. On the contrary, a decrease of F0 is a symptom of a high-energy dissipation in the minor antenna [55]. The values of the chlorophyll fluorescence followed those of the chlorophyll content and the ETR. After the first week, the treated plants showed significant differences with the control plants. Thereafter, there was an improvement, but in some cases, the difference remained significant until the end.
After a week, the treatment at 150 and 300 ppm determined an increase of the specific energy fluxes, absorbed (ABS/RC), captured (TR0/RC), and dissipated (DI0/RC) from the active reaction centers of PSII, and a reduction in the electron transport (ET0/RC) (Figure 12A). The increase in ABS/RC could be attributed to the inactivation of reaction centers and a decrease in active QA reducing centers [56], while the enhancement in TR0/RC resulted in higher inhibition of reoxidation of QA– to QA [57]. Consequently, the increased value of TR0/RC would result in lower electron transport per reaction center (ET0/RC). Moreover, a reduction of the maximum quantum yield of primary photochemical reactions (TR0/ABS) and the maximum quantum yield for electron transport (ET0/ABS) observed in treated plants was associated with an increase of the maximum quantum yield for energy dissipation at antenna level (F0/Fm) (Figure 12A). Similarly, the corresponding reduction of ET0/ABS and ET0/TR0 in treated plants could probably be due to an inhibition of electronic transport beyond QA. Therefore, the decrease in FV/F0 found after 7 days at 150 and 300 ppm of Cu, which indicates the efficiency of water splitting (and consequently oxygen production) by the PSII, agrees with the data showing a reduced photosynthetic activity. Finally, the sharp decrease in the PIABS viability index, confirms the inhibitory effect on photochemical processes in Cu-treated plants [58] (Figure 12A). Our results are in line with the literature reporting the effects of copper on different plant species [59,60,61]. Nevertheless, it should be emphasized that the copper concentrations used in this study are notably higher than those usually utilized in similar experiments.
During the following weeks (Figure 12B–D) the differences between Cu treated and control plants were partially reduced, highlighting the ability to recover the efficiency of photosynthetic energy conversion, especially in Arundo plants exposed to lower copper concentration (150 ppm). In general, the exposure of Arundo plants at two concentrations of copper (150 and 300 ppm) led to a reduction of the chlorophyll content as well as the parameters related to the photosynthetic activity, mainly after the first week of treatment. However, starting from the following week (14 days) and up to the end of the experiment (28 days), these parameters showed an increase in their values resulting in a partial recovery of the functionality of the photosynthetic apparatus and chlorophyll content, especially in the plants treated with 150 ppm of copper.
Based on the results, it can be hypothesized that in plants of Arundo the high concentrations of copper induced alterations in photochemical processes at the chloroplast level [62]. The initial reduction of the chlorophyll content, observed in the treated plants, could be linked to reduced absorption of iron with which the copper interferes [50]. At the same time, when the quantity of light energy absorbed by the pigments exceeds that used for photosynthesis, the absorbed energy accelerates the photoinhibition process (i.e., the inhibition of photosynthesis caused by excess light) [63]. To cope with excess light energy, plants have developed a protection mechanism that dissipates the energy absorbed in the form of heat, counteracting its negative effects [64]. Therefore, reversible photoinhibition is indicative of a protective mechanism aimed at dissipating excess light energy, while irreversible photoinhibition indicates damage to the photosynthetic systems [65]. Our data highlighted that the parameters directly related to the energy dissipation rate from the PSII (DI0/RC and F0/Fm), showed an increase of the values, supporting the hypothesis that the treatment with copper induced photoinhibition of photosynthesis, more pronounced during the first week of treatment. However, during the following weeks, the reduction of the differences in the parameters analyzed between Cu treated and control plants showed that the defense mechanisms used to dissipate the excess energy allowed the plants to recover, at least partially, their photosynthetic performances.

4. Conclusions

The work provided some evidence about the ability of Arundo plants to grow in the presence of increasing concentrations of assimilable Cu supplied in semi-hydroponic conditions (mesocosm).
The physiological indexes associated with the photosynthetic machinery resulted altered within the first week from the contamination. The supply of Cu at 150 and 300 ppm caused a sensible decrease (around 57%–65%) of chlorophyll content and ETR (18%–21%). The assimilation of Cu altered the uptake of Fe and Zn which increased their content, at least within the first week. One of the key outcomes was the absence of phenotypic alteration. The plants did not show evident symptoms of stress, and the values of height and basal diameter of the stem or the number of stems were comparable among the control and the plants treated with 150 and 300 ppm. Thus, a sort of counteracting mechanism seems to act at the studied conditions. Altered absorption of Cu affects photosynthesis in a short time, but, below a Cu threshold, the antioxidative defense system may limit the damaging effects and avoid the irreversible inactivation of the photosynthetic system. In this way, even in the presence of lower photosynthetic efficiency, the biomass production and the plant growth were poorly affected by the contamination.
The role played by the growth system used in this trial cannot be overlooked. The advantage of mesocosms should rely on removing the buffering effect of the soil and in reproducing an environment resembling channels, rivers, lakes, ponds, and marshes where the plant can find optimal growth conditions. However, the role of the inert substrate should be carefully evaluated, because possible interaction with the elements dissolved in the solution may alter their dynamics.
Based on such analysis, the data confirmed previous indications about the suitability of using the Arundo species for phytoremediation. From a practical point of view, it must be considered that the Italian law (DL 152/06) sets for Cu the limit of contamination for the soils of residential areas at the concentration of 120 mg kg−1. Such a threshold appears compatible with the growth of Arundo plants both in soil or in aquatic environments. However, the behavior of the plant in the long term should be verified in further studies.

Author Contributions

Conceptualization, E.S. and C.B.; methodology, E.S., C.B., M.Z. and F.P.; formal analysis, E.S. and F.P.; investigation, E.S., C.B., F.P., M.C. and F.G.; data curation, E.S., C.B., M.Z. and F.P.; writing—original draft preparation, E.S. and F.P.; writing—review and editing, E.S., C.B., M.Z. and F.P.; supervision, E.S.

Funding

This research was funded by the Ministry of Agriculture, Food, Forestry and Tourism (MiPAAFT) as under the AGROENER project (D.D. N 26329 of 01/04/2016).

Conflicts of Interest

The authors declare no conflict of interest.

References

  1. Cicchella, D.; Giaccio, L.; Dinelli, E.; Albanese, S.; Lima, A.; Zuzolo, D.; Valera, P.; De Vivo, B. GEMAS: Spatial distribution of chemical elements in agricultural and grazing land soil of Italy. J. Geochem. Explor. 2015, 154, 129–142. [Google Scholar] [CrossRef]
  2. Toth, G.; Hermann, T.; Da Silva, M.; Montanarella, L. Heavy metals in agricultural soils of the European Union with implications for food safety. Environ. Int. 2016, 88, 299–309. [Google Scholar] [CrossRef] [PubMed]
  3. Toth, G.; Hermann, T.; Szatmari, G.; Pasztor, L. Maps of heavy metals in the soils of the European Union and proposed priority areas for detailed assessment. Sci. Total Environ. 2016, 565, 1054–1062. [Google Scholar] [CrossRef] [PubMed]
  4. Marchiol, L.; Fellet, G. Agronomy towards the Green Economy. Optimization of metal phytoextraction. Ital. J. Agron. 2011, 6, 189–197. [Google Scholar] [CrossRef]
  5. Miotto, A.; Ceretta, C.A.; Brunetto, G.; Nicoloso, F.T.; Girotto, E.; Farias, J.G.; Tiecher, T.L.; De Conti, L.; Trentin, G. Copper uptake, accumulation and physiological changes in adult grapevines in response to excess copper in soil. Plant Soil 2014, 374, 593–610. [Google Scholar] [CrossRef]
  6. Armentano, G. Rame, si va verso una riduzione delle dosi annue. Inf. Agrar. 2017, 25, 8. [Google Scholar]
  7. Borghi, M.; Tognetti, R.; Monteforti, G.; Sebastiani, L. Responses of two poplar species (Populus alba and Populus x canadensis) to high copper concentrations. Environ. Exp. Bot. 2008, 62, 290–299. [Google Scholar] [CrossRef]
  8. Cuypers, A.; Vangronsveld, J.; Clijsters, H. Biphasic effect of copper on the ascorbate-glutathione pathway in primary leaves of Phaseolus vulgaris seedlings during the early stages of metal assimilation. Physiol. Plant. 2000, 110, 512–517. [Google Scholar] [CrossRef]
  9. La Torre, A.; Iovino, V.; Caradonia, F. Copper in plant protection: Current situation and prospects. Phytopathol. Mediterr. 2018, 57, 201–236. [Google Scholar]
  10. Ambrosini, V.G.; Rosa, D.J.; Bastos de Melo, G.W.; Zalamena, J.; Cella, C.; Simão, D.G.; Souza da Silva, L.; Pessoa dos Santos, H.; Toselli, M.; Tiecher, T.L.; et al. High copper content in vineyard soils promotes modifications in photosynthetic parameters and morphological changes in the root system of ‘Red Niagara’ plantlets. Plant Physiol. Biochem. 2018, 128, 89–98. [Google Scholar] [CrossRef]
  11. Pietrini, F.; Di Baccio, D.; Iori, V.; Veliksar, S.; Lemanova, N.; Juškaitė, L.; Maruška, A.; Zacchini, M. Investigation on metal tolerance and phytoremoval activity in the poplar hybrid clone “Monviso” under Cu-spiked water: Potential use for wastewater treatment. Sci. Total Environ. 2017, 592, 412–418. [Google Scholar] [CrossRef] [PubMed]
  12. Poschenrieder, C.; Bech, J.; Llugany, M.; Pace, A.; Fenés, E.; Barcelò, J. Copper in plant species in a copper gradient in Catalonia (North East Spain) and their potential for phytoremediation. Plant Soil 2001, 230, 247–256. [Google Scholar] [CrossRef]
  13. Zacchini, M.; Pietrini, F.; Mugnozza, G.S.; Iori, V.; Pietrosanti, L.; Massacci, A. Metal Tolerance, Accumulation and Translocation in Poplar and Willow Clones Treated with Cadmium in Hydroponics. Water Air Soil Pollut. 2009, 197, 23–34. [Google Scholar] [CrossRef]
  14. Pietrini, F.; Iori, V.; Pietropaoli, S.; Mughini, G.; Beni, C.; Massacci, A.; Zacchini, M. Phytoremediation of cadmium polluted waters by a eucalypt hybrid clone: A mesocosm study. In Proceedings of the Sixth European Bioremediation Conference, Chania, Creta, Greece, 29 June–2 July 2015; pp. 238–241. [Google Scholar]
  15. Barbosa, B.; Boléo, S.; Sidella, S.; Costa, J.; Duarte, M.P.; Mendes, B.; Cosentino, S.L.; Fernando, A.L. Phytoremediation of heavy metal-contaminated soils using the perennial energy crops Miscanthus spp. and Arundo donax L. Bioenergy Res. 2015, 8, 1500–1511. [Google Scholar] [CrossRef]
  16. Fiorentino, N.; Ventorino, V.; Rocco, C.; Cenvinzo, V.; Agrelli, D.; Gioia, L.; Di Mola, I.; Adamo, P.; Pepe, O.; Fagnano, M. Giant reed growth and effects on soil biological fertility in assisted phytoremediation of an industrial polluted soil. Sci. Total Environ. 2017, 575, 1375–1383. [Google Scholar] [CrossRef] [PubMed]
  17. Nsanganwimana, F.; Marchand, L.; Douay, F.; Mench, M. Arundo donax L., a Candidate for Phytomanaging Water and Soils Contaminated by Trace Elements and Producing Plant-Based Feedstock. A Review. Int. J. Phytoremediat. 2014, 16, 982–1017. [Google Scholar] [CrossRef] [PubMed]
  18. Oustriere, N.; Marchand, L.; Lottier, N.; Motelica, M.; Mench, M. Long-term Cu stabilization and biomass yields of Giant reed and poplar after adding a biochar, alone or with iron grit, into a contaminated soil from a wood preservation site. Sci. Total Environ. 2017, 579, 620–627. [Google Scholar] [CrossRef]
  19. Elhawat, N.; Alshaal, T.; Domokos-Szabolcsy, E.; El-Ramady, H.; Antal, G.; Márton, L.; Czakó, M.; Balogh, P.; Fári, M. Copper uptake efficiency and its distribution within bioenergy grass giant reed. Bull. Environ. Contam. Toxicol. 2015, 95, 452–458. [Google Scholar] [CrossRef]
  20. Marchiol, L. Prospettive e limitazioni del fitorisanamento. Not. ERSA 2008, 4, 65–72. [Google Scholar]
  21. Ceotto, E.; Di Candilo, M. Shoot cuttings propagation of giant reed (Arundo donax L.) in water and moist soil: The path forward? Biomass Bioenergy 2010, 34, 1614–1623. [Google Scholar] [CrossRef]
  22. Ruyters, S.; Salaets, P.; Oorts, K.; Smolders, E. Copper toxicity in soils under established vineyards in Europe: A survey. Sci. Total Environ. 2013, 443, 470–477. [Google Scholar] [CrossRef] [PubMed]
  23. Cerovic, Z.G.; Masdoumier, G.; Ghozlen, N.B.; Latouche, G. A new optical leaf-clip meter for simultaneous non-destructive assessment of leaf chlorophyll and epidermal flavonoids. Physiol. Plant. 2012, 146, 251–260. [Google Scholar] [CrossRef] [PubMed]
  24. Strasser, R.J.; Tsimilli-Michael, M.; Srivastava, A. Analysis of the Chlorophyll a Fluorescence Transient. In Chlorophyll Fluorescence: A Signature of Photosynthesis. Advances in Photosynthesis and Respiration; Papageorgiou, G., Govindjee, Eds.; Kluwer Academic Publishers: Dordrecht, The Netherlands, 2004; pp. 321–362. [Google Scholar]
  25. Genty, B.; Briantais, J.-M.; Baker, N.R. The relationship between the quantum yield of photosynthetic electron transport and quenching of chlorophyll fluorescence. Biochim. Biophys. Acta Gen. Subj. 1989, 990, 87–92. [Google Scholar] [CrossRef]
  26. Maxwell, K.; Johnson, G.N. Chlorophyll fluorescence—A practical guide. J. Exp. Bot. 2000, 51, 659–668. [Google Scholar] [CrossRef] [PubMed]
  27. Evans, J.R. Photosynthetic acclimation and nitrogen partitioning within a lucerne canopy. 2. Stability through time and comparison with a theoretical optimum. Aust. J. Plant Physiol. 1993, 20, 69–82. [Google Scholar] [CrossRef]
  28. Adrees, M.; Ali, S.; Rizwan, M.; Ibrahim, M.; Abbas, F.; Farid, M.; Zia-ur-Rehman, M.; Irshad, M.K.; Bharwana, S.A. The effect of excess copper on growth and physiology of important food crops: A review. Environ. Sci. Pollut. Res. 2015, 22, 8148–8162. [Google Scholar] [CrossRef]
  29. Oustriere, N.; Marchand, L.; Roulet, E.; Mench, M. Rhizofiltration of a Bordeaux mixture effluent in pilot-scale constructed wetland using Arundo donax L. coupled with potential Cu-ecocatalyst production. Ecol. Eng. 2017, 105, 296–305. [Google Scholar] [CrossRef]
  30. Yruela, I. Copper in plants: Acquisition, transport and interactions. Funct. Plant Biol. 2009, 36, 409–430. [Google Scholar] [CrossRef]
  31. Elhawat, N.; Alshaal, T.; Domokos-Szabolcsy, É.; El-Ramady, H.; Márton, L.; Czakó, M.; Kátai, J.; Balogh, P.; Sztrik, A.; Molnár, M.; et al. Phytoaccumulation potentials of two biotechnologically propagated ecotypes of Arundo donax in copper-contaminated synthetic wastewater. Environ. Sci. Pollut. Res. 2014, 21, 7773–7780. [Google Scholar] [CrossRef]
  32. Angelini, L.G.; Ceccarini, L.; Nassi o Di Nasso, N.; Bonari, E. Comparison of Arundo donax L. and Miscanthus x giganteus in a long-term field experiment in Central Italy: Analysis of productive characteristics and energy balance. Biomass Bioenergy 2009, 33, 635–643. [Google Scholar] [CrossRef]
  33. Li, C.; Xiao, B.; Wang, Q.H.; Yao, S.H.; Wu, J.Y. Phytoremediation of Zn- and Cr-contaminated soil using two promising energy grasses. Water Air Soil Pollut. 2014, 225, 2027. [Google Scholar] [CrossRef]
  34. Mathialagan, T.; Viraraghavan, T. Adsorption of cadmium from aqueous solutions by perlite. J. Hazard. Mater. 2002, 94, 291–303. [Google Scholar] [CrossRef]
  35. Vijayaraghavan, K.; Raja, F.D. Experimental characterisation and evaluation of perlite as a sorbent for heavy metal ions in single and quaternary solutions. J. Water Process. Eng. 2014, 4, 179–184. [Google Scholar] [CrossRef]
  36. Ghassabzadeh, H.; Mohadespour, A.; Torab-Mostaedi, M.; Zaheri, P.; Maragheh, M.G.; Taheri, H. Adsorption of Ag, Cu and Hg from aqueous solutions using expanded perlite. J. Hazard. Mater. 2010, 177, 950–955. [Google Scholar] [CrossRef] [PubMed]
  37. Sari, A.; Tuzen, M.; Citak, D.; Soylak, M. Adsorption characteristics of Cu(II) and Pb(II) onto expanded perlite from aqueous solution. J. Hazard. Mater. 2007, 148, 387–394. [Google Scholar] [CrossRef] [PubMed]
  38. Pedescoll, A.; Sidrach-Cardona, R.; Hijosa-Valsero, M.; Bécares, E. Design parameters affecting metals removal in horizontal constructed wetlands for domestic wastewater treatment. Ecol. Eng. 2015, 80, 92–99. [Google Scholar] [CrossRef]
  39. Marchand, L.; Nsanganwimana, F.; Oustrière, N.; Grebenshchykova, Z.; Lizama-Allende, K.; Mench, M. Copper removal from water using a bio-rack system either unplanted or planted with Phragmites australis, Juncus articulatus and Phalaris arundinacea. Ecol. Eng. 2014, 64, 291–300. [Google Scholar] [CrossRef]
  40. Galletti, A.; Verlicchi, P.; Ranieri, E. Removal and accumulation of Cu, Ni and Zn in horizontal subsurface flow constructed wetlands: Contribution of vegetation and filling medium. Sci. Total Environ. 2010, 408, 5097–5105. [Google Scholar] [CrossRef]
  41. Rehman, M.; Maqbool, Z.; Peng, D.; Liu, L. Morpho-physiological traits, antioxidant capacity and phytoextraction of copper by ramie (Boehmeria nivea L.) grown as fodder in copper-contaminated soil. Environ. Sci. Pollut. Res. 2019, 26, 5851–5861. [Google Scholar] [CrossRef]
  42. Brunetto, G.; Bastos de Melo, G.W.; Terzano, R.; Del Buono, D.; Astolfi, S.; Tomasi, N.; Pii, Y.; Mimmo, T.; Cesco, S. Copper accumulation in vineyard soils: Rhizosphere processes and agronomic practices to limit its toxicity. Chemosphere 2016, 162, 293–307. [Google Scholar] [CrossRef] [Green Version]
  43. Lequeux, H.; Hermans, C.; Lutts, S.; Verbruggen, N. Response to copper excess in Arabidopsis thaliana: Impact on the root system architecture, hormone distribution, lignin accumulation and mineral profile. Plant Physiol. Biochem. 2010, 48, 673–682. [Google Scholar] [CrossRef] [PubMed]
  44. Azeez, M.O.; Adesanwo, O.O.; Adepetu, J. Effect of Copper (Cu) application on soil available nutrients and uptake. Afr. J. Agric. Res. 2015, 10, 359–364. [Google Scholar] [Green Version]
  45. Feigl, G.; Kumar, D.; Lehotai, N.; Tugyi, N.; Molnár, Á.; Ördög, A.; Szepesi, Á.; Gémes, K.; Laskay, G.; Erdei, L.; et al. Physiological and morphological responses of the root system of Indian mustard (Brassica juncea L. Czern.) and rapeseed (Brassica napus L.) to copper stress. Ecotoxicol. Environ. Saf. 2013, 94, 179–189. [Google Scholar] [CrossRef] [PubMed]
  46. Marzilli, M.; Di Santo, P.; Palumbo, G.; Maiuro, L.; Paura, B.; Tognetti, R.; Cocozza, C. Cd and Cu accumulation, translocation and tolerance in Populus alba clone (Villafranca) in autotrophic in vitro screening. Environ. Sci. Pollut. Res. 2018, 25, 10058–10068. [Google Scholar] [CrossRef] [PubMed]
  47. Dai, Y.; Shen, Z.; Liu, Y.; Wang, L.; Hannaway, D.; Lu, H. Effects of shade treatments on the photosynthetic capacity, chlorophyll fluorescence, and chlorophyll content of Tetrastigma hemsleyanum Diels et Gilg. Environ. Exp. Bot. 2009, 65, 177–182. [Google Scholar] [CrossRef]
  48. Cedergreen, N.; Streibig, J.C. Can the choice of endpoint lead to contradictory results of mixture-toxicity experiments? Environ. Toxicol. Chem. 2005, 24, 1676–1683. [Google Scholar] [CrossRef] [PubMed]
  49. Xu, D.; Li, C.; Chen, H.; Shao, B. Ecotoxicology and Environmental Safety Cellular response of freshwater green algae to perfluorooctanoic acid toxicity. Ecotoxicol. Environ. Saf. 2013, 88, 103–107. [Google Scholar] [CrossRef]
  50. Pätsikkä, E.; Kairavuo, M.; Frantisek, S.; Aro, E.; Tyystja, E. Excess Copper Predisposes Photosystem II to Photoinhibition in Vivo by Outcompeting Iron and Causing Decrease in Leaf Chlorophyll. Plant Physiol. 2002, 129, 1359–1367. [Google Scholar] [Green Version]
  51. Srivastava, S.; Mishra, S.; Tripathi, R.D.; Dwivedi, S.; Gupta, D.K. Copper-induced oxidative stress and responses of antioxidants and phytochelatins in Hydrilla verticillata (L.f.) Royle. Aquat. Toxicol. 2006, 80, 405–415. [Google Scholar] [CrossRef]
  52. Yruela, I. Copper in plants. Braz. J. Plant Physiol. 2005, 17, 145–156. [Google Scholar] [CrossRef] [Green Version]
  53. Baker, N.R. Chlorophyll Fluorescence: A Probe of Photosynthesis In Vivo. Annu. Rev. Plant Biol. 2008, 59, 89–113. [Google Scholar] [CrossRef] [PubMed] [Green Version]
  54. Bussotti, F.; Desotgiu, R.; Cascio, C.; Pollastrini, M.; Gravano, E.; Gerosa, G.; Marzuoli, R.; Nali, C.; Lorenzini, G.; Salvatori, E.; et al. Ozone stress in woody plants assessed with chlorophyll a fluorescence. A critical reassessment of existing data. Environ. Exp. Bot. 2011, 73, 19–30. [Google Scholar] [CrossRef]
  55. Gilmore, A.M.; Hazlett, T.L.; Debrunner, P.G. Comparative time-resolved photosystem II chlorophyll a fluorescence analyses reveal distinctive differences between photoinhibitory reaction center damage and xanthophyll cycledependent energy dissipation. Photochem. Photobiol. 1996, 64, 552–563. [Google Scholar] [CrossRef] [PubMed]
  56. Strasser, R.J.; Stirbet, A.D. Heterogeneity of photosystem II probed by the numerically simulated chlorophyll a fluorescence rise (O–J–I–P). Math. Comput. Simul. 1998, 1, 3–9. [Google Scholar] [CrossRef]
  57. Strasser, R.J.; Srivastava, A.; Tsimilli-Michael, M. The Fluorescence Transient as a Tool to Characterize and Screen Photosynthetic Samples. In Probing Photosynthesis: Mechanisms, Regulation and Adaptation; Mohammad, Y., Pathre, U., Mohanty, P., Eds.; CRC Press: Boca Raton, FL, USA, 2000; pp. 445–483. [Google Scholar]
  58. Sbihi, K.; Cherifi, O.; El Gharmali, A.; Oudra, B.; Aziz, F. Accumulation and toxicological effects of cadmium, copper and zinc on the growth and photosynthesis of the freshwater diatom Planothidium lanceolatum (Brébisson) Lange-Bertalot: A laboratory study. J. Mater. Environ. Sci. 2012, 3, 497–506. [Google Scholar]
  59. Cuchiara, C.C.; Silva, I.M.C.; Martinazzo, E.G.; Braga, E.J.B.; Bacarin, M.A.; Peters, J.A. Chlorophyll Fluorescence Transient Analysis in Alternanthera tenella Colla Plants Grown in Nutrient Solution with Different Concentrations of Copper. J. Agric. Sci. 2013, 5, 8–16. [Google Scholar] [CrossRef]
  60. Cuchiara, C.C.; Silva, I.M.C.; Dalberto, D.S.; Bacarin, M.A.; Peters, J.A. Chlorophyll a fluorescence in sweet potatoes under different copper concentrations. J. Soil Sci. Plant Nutr. 2015, 15, 179–189. [Google Scholar] [CrossRef]
  61. Perreault, F.; Samadani, M.; Dewez, D. Effect of soluble copper released from copper oxide nanoparticles solubilisation on growth and photosynthetic processes of Lemna gibba L. Nanotoxicology 2016, 8, 374–382. [Google Scholar] [CrossRef]
  62. Vassilev, A.; Lidon, F.C.; Scotti Campos, P.; Ramalho, J.C.; Barreiro, M.G.; Yordanov, I. Cu-induced changes in chloroplast lipids and photosystem 2 activity in barley plants. Bulg. J. Plant Physiol. 2003, 29, 33–43. [Google Scholar]
  63. Takahashi, S.; Murata, N. How do environmental stresses accelerate photoinhibition? Trends Plant Sci. 2008, 13, 178–182. [Google Scholar] [CrossRef]
  64. Wilhelm, C.; Selmar, D. Energy dissipation is an essential mechanism to sustain the viability of plants: The physiological limits of improved photosynthesis. J. Plant Physiol. 2011, 168, 79–87. [Google Scholar] [CrossRef] [PubMed]
  65. Goh, C.; Ko, S.; Koh, S.; Kim, Y.-Y.; Bae, H.-J. Photosynthesis and Environments: Photoinhibition and Repair Mechanisms in Plants. J. Plant Biol. 2012, 55, 93–101. [Google Scholar] [CrossRef]
Figure 1. Mesocosm used for growing the Arundo plants.
Water 11 01837 g001
Figure 2. Transplant of the rooted cuttings inside the mesocosm.
Water 11 01837 g002
Figure 3. Rainfall, and the minimum and maximum temperature during the grown of Arundo plants.
Water 11 01837 g003
Figure 4. Correlation between height and basal diameter of the main stem measured on semi-hydroponic grown Arundo donax plants.
Water 11 01837 g004
Figure 5. Concentration (average ± S.E.) of copper (mg kg−1) in the collection tank. Different letters indicate a statistically significant difference for p < 0.01 after Tukey test.
Water 11 01837 g005
Figure 6. Time course of the copper concentration in the leaves of Arundo plants treated with different copper concentrations (0, 150, and 300 ppm) for 28 days. Data points and vertical bars represent means (n = 3) ± S.E., respectively (when not reported S.E. is smaller than symbol size). One-way ANOVA was applied and for a given duration different letters indicate significant difference according to Tukey test (p ≤ 0.01).
Water 11 01837 g006
Figure 7. Time course of the iron concentration in the leaves of Arundo plants treated with different copper concentrations (0, 150, and 300 ppm) for 28 days. Data points and vertical bars represent means (n = 3) ± S.E., respectively (when not reported S.E. is smaller than symbol size). One-way ANOVA was applied and for a given duration different letters indicate significant difference according to Tukey test (p ≤ 0.01).
Water 11 01837 g007
Figure 8. Time course of the zinc concentration in the leaves of Arundo plants treated with different copper concentrations (0, 150, and 300 ppm) for 28 days. Data points and vertical bars represent means (n = 3) ± S.E., respectively (when not reported S.E. is smaller than symbol size). One-way ANOVA was applied and for a given duration different letters indicate significant difference according to Tukey test (p ≤ 0.01).
Water 11 01837 g008
Figure 9. Scores and loadings of principal component analysis (PCA) carried out on the set of plant morphological data and microelements present in the leaves (Cu, Fe, and Zn) collected over a period of 28 days from Cu contamination.
Water 11 01837 g009
Figure 10. Time course of the chlorophyll content in Arundo plants treated with different copper concentrations (0, 150, and 300 ppm) for 28 days. Data points and vertical bars represent means (n = 8) ± S.E., respectively. One-way ANOVA was applied and for a given duration different letters indicate significant difference according to LSD test (p ≤ 0.05).
Water 11 01837 g010
Figure 11. Time course of the electron transport rate (ETR) in Arundo plants treated with different copper concentrations (0, 150, and 300 ppm) for 28 days. Data of electron transport rate (ETR) measured at steady-state with a photosynthetic photon flux density (PPFD) of 1000 μmol m−2 s−1 is shown after 7, 14, 21, and 28 days after contamination. Data points and vertical bars represent means (n = 8) ± S.E., respectively. One-way ANOVA was applied and for a given duration different letters indicate significant difference according to LSD test (p ≤ 0.05).
Water 11 01837 g011
Figure 12. Changes in the shape of the radar plot JIP-test parameters induced by different copper concentrations applied to Arundo plants and measured after 7 (A), 14 (B), 21, (C) and 28 (D) days of treatment. The data are the average of eight replicates and report the values with respect to plants grown in the absence of contamination (control = 1). Red and green asterisks indicate significant differences (LSD test, p ≤ 0.05) between control plants (0 ppm) and those exposed to 150 or 300 ppm copper, respectively.
Water 11 01837 g012
Table 1. Selected JIP-test parameters calculated on the basis of fast fluorescence kinetics.
Fluorescence ParametersDescription
F0fluorescence intensity at 50 μs (O step)
F300fluorescence intensity at 300 μs
FJfluorescence intensity at 2 ms (J step)
FIfluorescence intensity at 30 ms (I step)
Fmmaximal fluorescence intensity (P step)
Fv = Fm − F0maximal variable fluorescence
VJ = (FJ − F0)/(Fm − F0)variable fluorescence at J step;
M0 = 4 (F300 − F0)/(Fm − F0)approximated initial slope of the fluorescence transient, expressing the rate of RCs’ closure
ABS/RC = M0 × (1/VJ) × [1/(Fv/Fm)]absorption per active reaction center
TR0/RC = M0 × (1/VJ)trapping per active reaction center
ET0/RC = M0 × (1/VJ) × (1 − VJ)electron transport per active reaction center
DI0/RC = (ABS/RC) − (TR0/RC)dissipation per active reaction center
TR0/ABS = Fv/Fm = φP0 = (Fm − F0)/Fmmaximum quantum yield of PSII photochemistry
ET0/TR0 = ψ0 = (Fm − FJ)/(Fm − F0)probability that a trapped exciton moves an electron into the electron transport chain beyond QA
ET0/ABS = φE0 = φP0 × ψE0quantum yield of electron transport
Fv/F0 = TR0/DI0 = (Fm − F0)/F0maximum ratio of quantum yields of photochemical and concurrent non-photochemical processes in PSII
F0/Fm = DI0/ABS = φD0maximum quantum yield for energy dissipation at the antenna level
PIABS = [φP0 (VJ/M0)] × [φP0/(1 − φP0)] × [ψE0/(1 − ψE0)]performance index (potential) for energy conservation from photons absorbed by PSII to the reduction of intersystem electron acceptors
Table 2. Time course of the plant height (main stem length), the number of stems and the basal diameter of the main stem in Arundo plants treated with different copper concentrations (0, 150, and 300 ppm) for 28 days. The values represent means (n = 4) ± S.E., respectively. One-way ANOVA was applied, and different letters indicate significant difference according to Tukey test (p ≤ 0.05).
VariableCu Level Day 0Days after Contaminationday28–day0 (%)
(ppm)(Contamination Start)7142128
Stem height (cm)044.8 ± 9.556.2 ± 7.267.1 ± 8.378.4 ± 12.4110.7 ± 12.9147.0
15067.5 ± 3.575.0 ± 2.795.0 ± 7.399.2 ± 9.0123.2 ± 9.682.5
30071.5 ± 14.182.0 ± 11.5100.7 ± 19.0122.0 ± 18.4143.5 ± 15.9100.7
Basal diameter (mm)05.9 ± 2.48.9 ± 1.58.7 ± 0.611.4 ± 1.311.5 ± 1.694.9
1509.5 ± 1.010.7 ± 1.111.0 ± 1.310.0 ± 0.711.0 ± 1.715.8
3007.7 ± 1.910.7 ±0.913.7 ± 1.713.0 ± 1.112.2 ± 1.058.4
Number of stems02.9 ± 1.13.1 ± 0.6 b4.3 ± 0.94.6 ± 1.35.5 ± 1.489.7
1503.5 ± 0.64.2 ± 0.2 b4.0 ± 0.44.5 ± 0.34.5 ± 0.328.6
3004.2 ± 2.46.0 ± 1.1 a5.5 ± 0.64.8 ± 0.75.3 ± 0.926.2

