Confluence Dynamics in a Modelled Large Sand-Bed Braided River


College of Water Conservancy and Civil Engineering, South China Agricultural University, Guangzhou 510642, China
*
Author to whom correspondence should be addressed.
Water 2019, 11(9), 1829; https://doi.org/10.3390/w11091829
Submission received: 1 August 2019
/
Accepted: 28 August 2019
/
Published: 3 September 2019
(This article belongs to the Section Hydraulics and Hydrodynamics)
Abstract
:Confluences are key morphological nodes in braided rivers where flow converges, creating complex flow patterns and rapid bed deformation. Field surveys and laboratory experiments have been carried out to investigate the morphodynamic features in individual confluences, but few have investigated the evolution processes of confluences in large braided rivers. In the current study, a physics-based numerical model was applied to simulate a large lowland braided river dominated by suspended sediment transport, and analyze the morphologic changes at confluences and their controlling factors. It was found that the confluences in large braided rivers exhibit some dynamic processes and geometric characteristics that are similar to those observed in individual confluences arising from two tributaries. However, they also show some unique characteristics that may result from the influence of the overall braided pattern and especially of their neighboring upstream channels.
1. Introduction
Braided rivers are highly dynamic systems characterized by multiple frequently joining and bifurcating channels that form confluences and bifurcations. In these rivers, channel confluences and bifurcations are key morphological features whose dynamics and mutual interactions control many aspects of channel morphology and processes in braided networks. Exploring the mechanisms underlying confluence evolution is fundamental for profoundly understanding morphodynamic processes in braided rivers [1]. Confluences at the junctions of two river branches have been widely studied both in the field [2,3] and in laboratory [4,5], with a few focusing on large-scale confluences [6,7]. However, confluences in large braided rivers have rarely been investigated, mainly due to the lack of adequate methodologies to investigate large rivers with frequent channel migrations. The evolution and morphology of confluences in large braided rivers share some common features with junctions of two branches in a non-braided river. However, they might also be affected by the evolution of the overall braided pattern, especially by morphologic changes in their immediate upstream neighborhood, thereby exhibiting unique morphodynamic processes and characteristics.
Channel confluences are important sites where adjustments in flow structure, sediment transport and channel morphology occur to accommodate the convergence of water and sediment from different branches [8,9]. Common morphologic features often include a scour hole typically oriented along the direction of maximum velocity, avalanche faces at the mouth of each branch, sediment deposition within the stagnation zone at the upstream junction corner, and bars formed within the flow separation zone [2,10,11]. The main factors that control flow structure and channel morphology at confluences include flow and sediment discharge ratios between the two confluent channels, confluence angle and its planform asymmetry, and the degree of bed concordance between the confluent channels [6]. Recent findings indicate that bifurcation asymmetry is not solely controlled by flow discharge but is rather the result of multiple factors, including varying flow discharge, changes in bed morphology, and cross-stream water surface slopes [7]. Guillén-Ludeña et al found that the abundant sediment load of the dominant branch plays a major role in controlling the dynamics of mountain river confluences [5].
The center of a confluence often locates a scour hole with considerable erosion depth. The scour zone may change from trough-shaped to more basin-like as the confluence angle increases [12,13]. The scour depth of a confluence has been related to confluence angle and the relative discharge of confluent channels [14], which typically ranges from two to four times the incoming branch channel depths, suggesting some scale invariance in junction morphology [15]. The slopes of beds dipping into scour holes in large braided rivers are often gentle, e.g., less than 5% in the Brahamaputra River [16].
Numerical models are useful tools to assist field research because they can provide large datasets with sufficient spatial and temporal resolutions to investigate river morphodynamics. In recent years, numerical models based on the basic flow and sediment transport theories, such as depth-integrated Delft 3D [17,18], Hydrodynamics and Sediment Transport in Alluvial Rivers (HSTAR) [19] and other physics-based models [20,21] have been developed and applied to simulate braided rivers. These models provided new insights into the complex dynamic processes of braided rivers and enriched theories for these systems. Yang et al developed a 2D physics-based model that divides sediment into multiple fractions and riverbed into several vertical layers, and simulated out rivers with morphodynamics compared well with natural braided rivers [22]. They analyzed the dynamic processes and statistical features in these rivers and investigated the key factors controlling channel generation and disappearance.
The present paper applies the model [22,23] to simulate large lowland sand-bed braided reaches. Based on the quantitative data provided by the numerical simulation, the main objectives of the current study are to analyze changes in flow field, sediment concentration, and bed elevation at typical confluences, compare them with those observed in natural rivers, and investigate evolution processes at confluences and the controlling factors. Results of this study will expand the current knowledge on confluence dynamics in large sand-bed braided rivers and provide the opportunity to analyze similarities and differences between braided rivers and other river types.
2. Materials and Methods
2.1. Numerical Model and Solutions
A two-dimensional depth-integrated numerical model was applied to simulate the confluence dynamics in the lower reaches of large sand-bed braided rivers. The hydrodynamic model consists of a mass and two momentum conservation equations, which are derived from the three-dimensional Reynolds equations for incompressible and unsteady turbulent flows. The hydrodynamic equations are solved using the alternating direction implicit method, which has been widely used in the solution of shallow water equations [24].
The sediment transport is described by a two-dimensional solute transport equation and a bed deformation equation, with a fractional method adopted to simulate the sorting process of graded sediments. By dividing the graded sediments into N fractions, the transport of the kth size fraction is calculated by
The riverbed deformation is given as
where sk is the sediment concentration for size fraction k; αk is the adjustment coefficient for size fraction k, determined based on an equation of Zhou et al [25]; ωk is the fall velocity for size fraction k, calculated by the equation of van Rijn [26]; Dxx, Dxy, Dyx, and Dyy are depth-averaged dispersion–diffusion coefficients in the x and y directions, respectively, with Preston’s equations adopted [27]; p0 is the porosity of bed layer sediments; zb is the riverbed elevation; and γs is the specific weight of sediment.
The calculation of suspended sediment transport is based on an energy theory that, the total energy of flow is divided into two parts, one part that is spent on sediment particles already in suspension and another part that is ready for eroding more sediment particles from the bed. When the sediment concentration is larger than the transport capacity, there is no energy left for taking more particles in suspension, and sediment deposition might occur. Accordingly, the transport capacity for the size fraction k of sediment particles, , is calculated by [28]
where σ = min(, 1); ; ; and is the effective percentage of the kth size fraction sediment in bed layer to be suspended.
The total transport capacity for the existing suspended sediment, , is given as
where K1 is a coefficient; is the specific weight of water mixed with sediment; is the depth-averaged flow velocity; and , denotes the average fall velocity of suspended load, with equaling to the percentage of the kth size fraction of suspended load.
In order to account for the influence of bed composition, a multiple layer method is used to simulate the spatial and temporal variations of sediment gradations in the loose bed layers. The sediment transport equations were solved with the Ultimate QUICKEST Scheme, which was developed to simulate 2D solute and mass transport with high concentration gradients [29]. More details on the model and solution method can be found in [22,23,25,28].
2.2. Model Settings and Boundary Conditions
An idealized river with overloaded suspended load was set up to simulate the morphodynamic processes in large braided rivers. The model was set up based on the data collected from the lower reaches of Jiahetan and Huayuankou in the Yellow River in China [30,31], including flow discharge, bed slope, sediment size distribution, and channel dimension. Previous studies showed the model could simulate the flow and channel pattern in the lower braided reaches of the Yellow River [32]. Its ability to represent flow, sediment transport, and statistical characteristics in large natural braided rivers has also been validated [22].
The simulated river was approximately 50 km long and 5 km wide, initially straight and plane, with a uniform bed slope of 0.000233. Two spur dikes were set up at the right and left bank near the upstream boundary, aiming to accelerate the initial channel evolution process. The input flow discharge was given as 6250 m3/s, and the sediment concentration was set to 44.5 kg/m3, referring to the field data of the Yellow River.
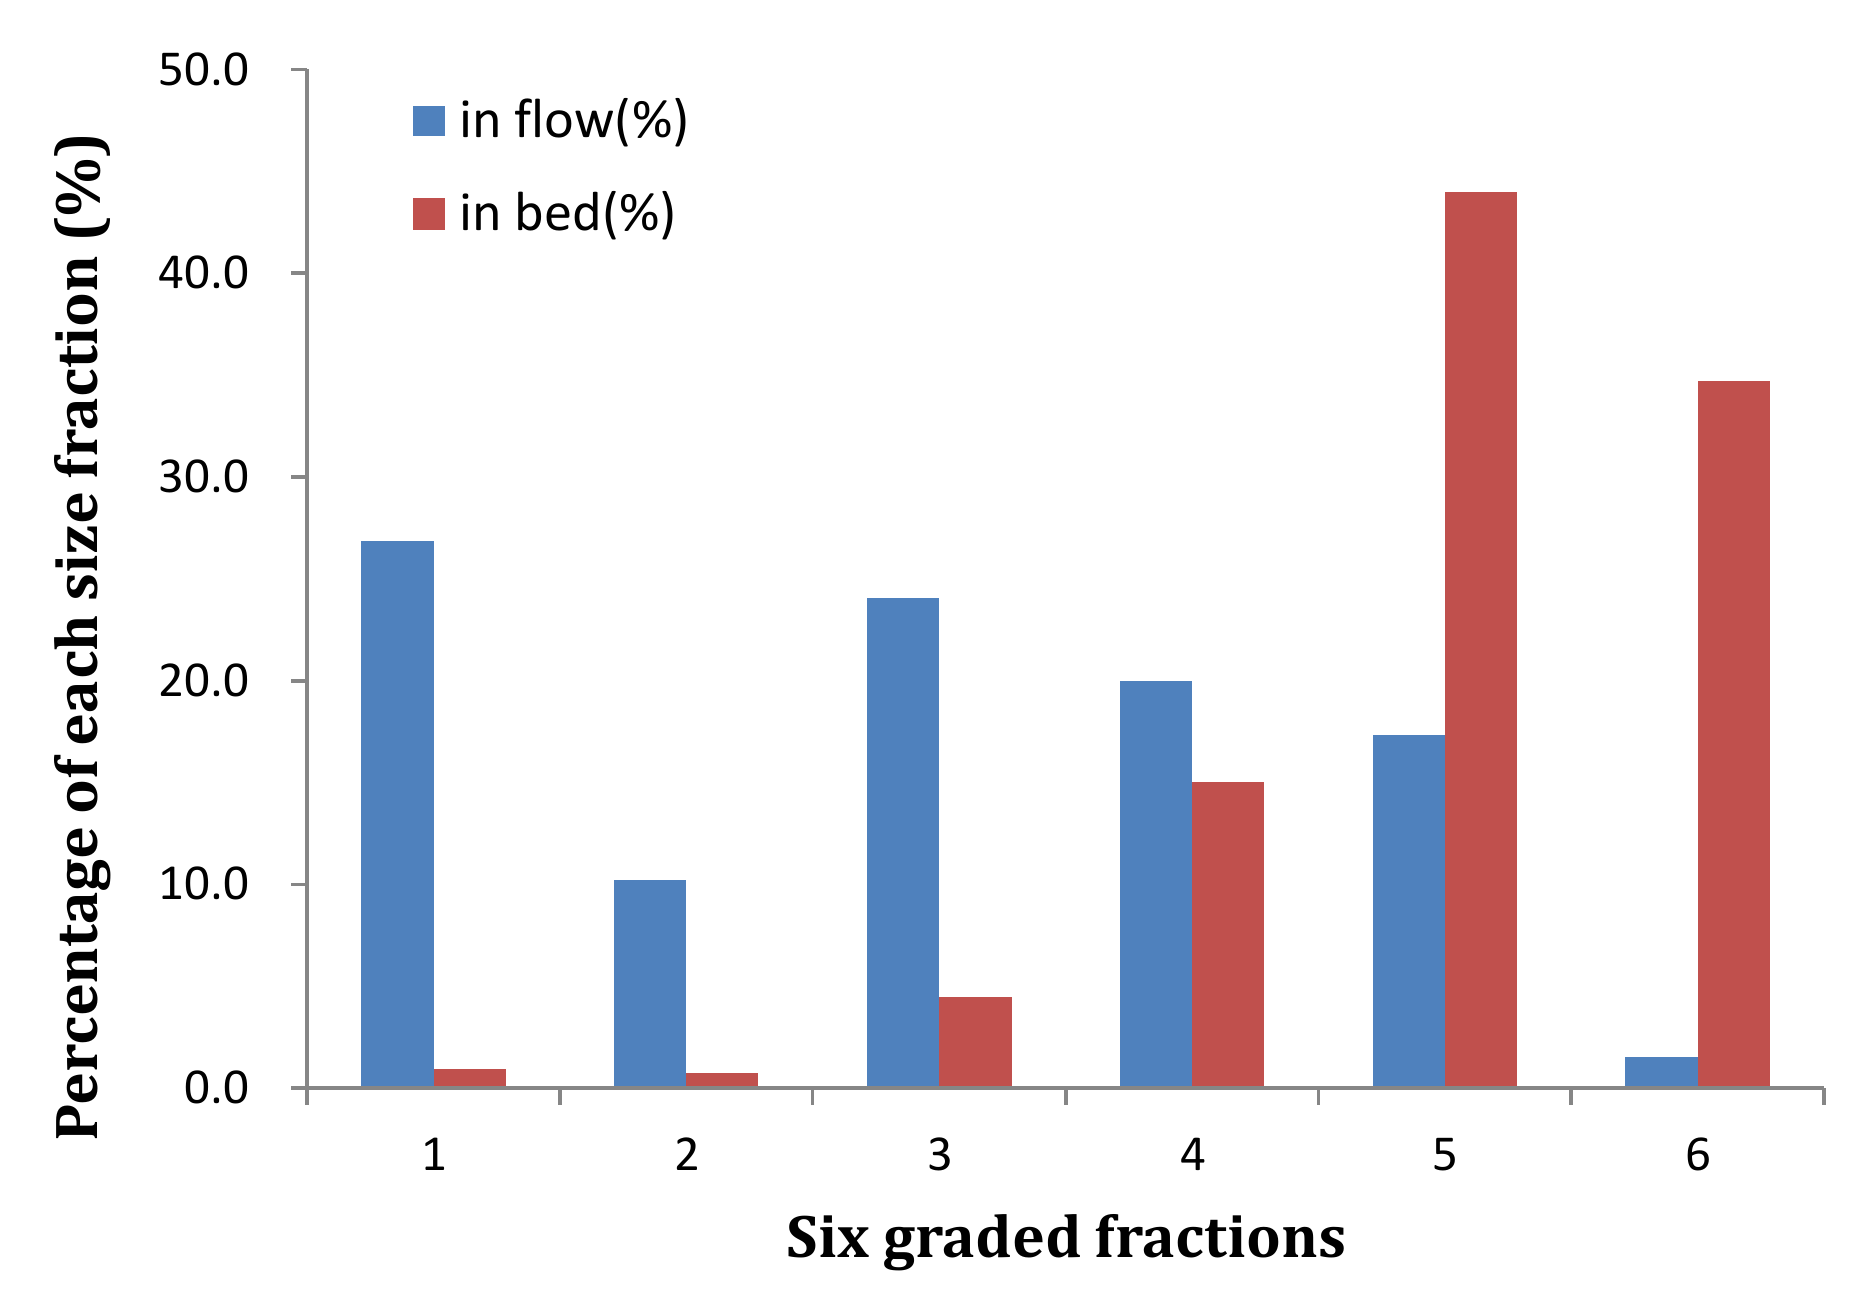
The model divided the sediments into six fractions, with particle sizes ranging from 0.0025 to 0.25 mm. Figure 1 illustrates the percentage of each size fraction in flow and riverbed, respectively. The bed was divided into three layers, with the thickness of the upper layer being 0.4 m, the middle layer 1.0 m, and the lower layer 10.0 m, respectively. When deposition or erosion occurs on bed, the sediments of the variation mass and the upper layer was mixed and the bed mixture composition was renewed. A minimum water depth of 10 mm was used to resolve the drying and flooding of floodplain. The roughness height of the channel bed was set to 10 mm. The time steps were set to 10 s for hydrodynamic and 20 s for sediment computations, respectively. The simulation work last over 60 days, with principal hydrodynamic and morphologic data output once a day or shorter time intervals.
3. Results and Discussion
3.1. Channel Confluences
3.1.1. General Processes
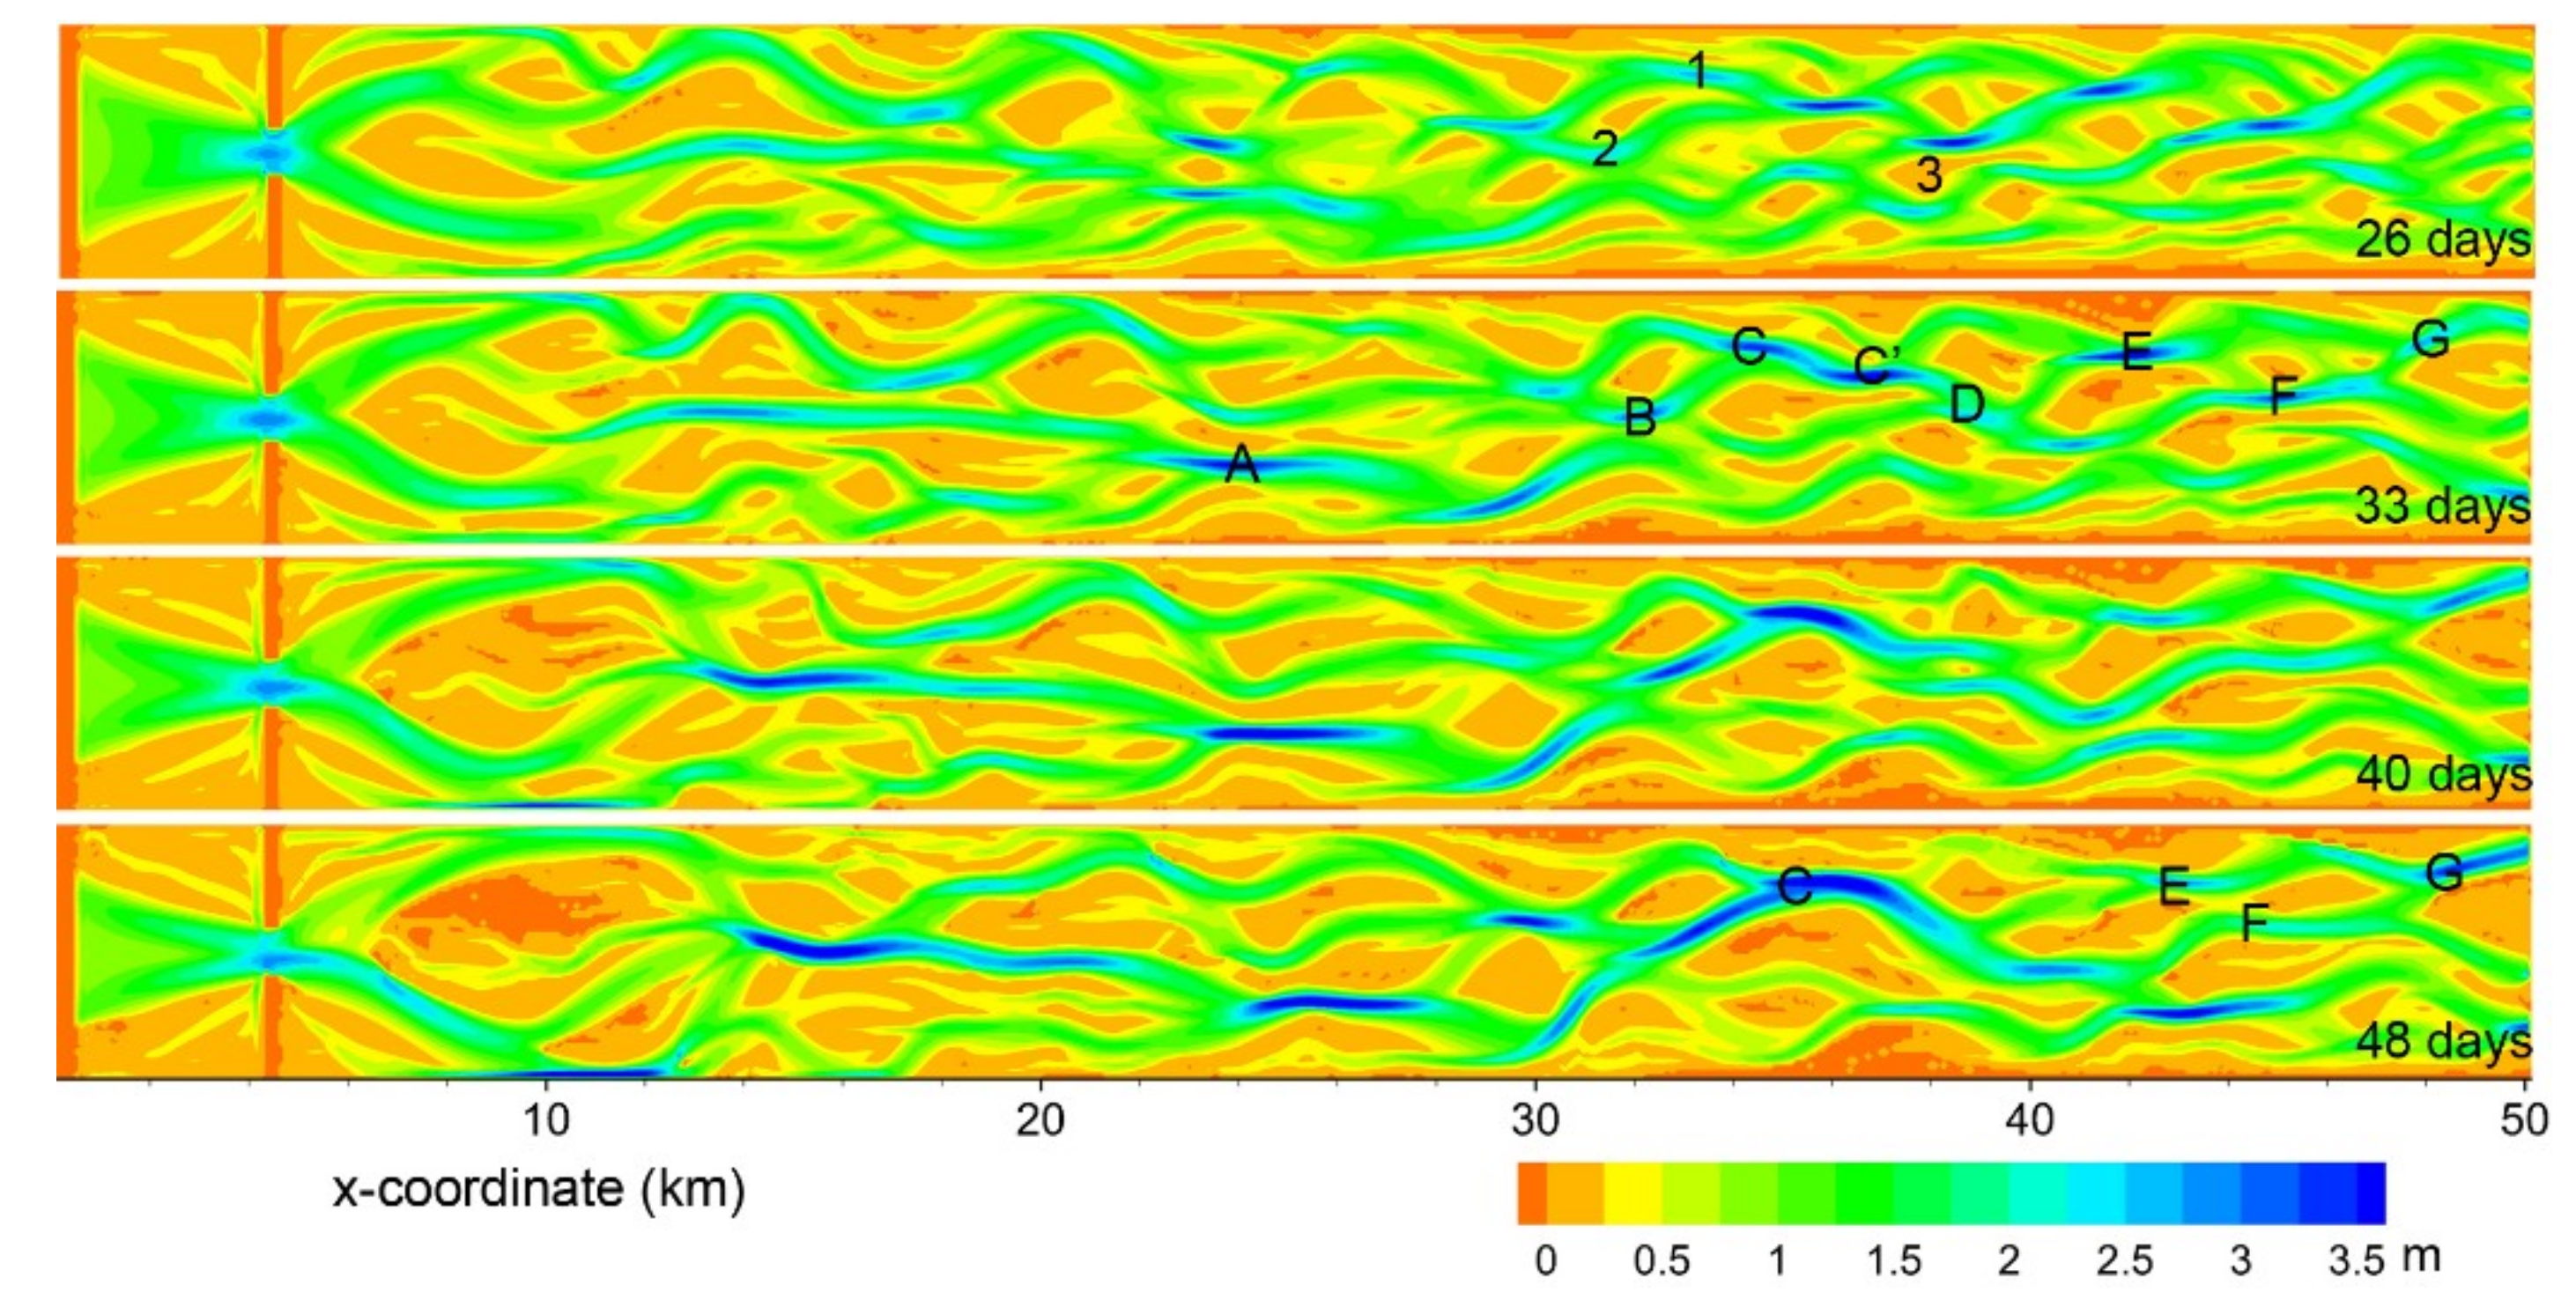
Instabilities in the simulated braided river were initiated in the alternate shallow and deep areas near the upstream spurs. A braided pattern was then formed through the development of multiple row bars, which is one of the two most common mechanisms of braided pattern evolution in natural rivers [33]. Channels divided and rejoined around bars, forming nodes typical in braided rivers—confluences and bifurcations, usually with deep scour holes in their center (Figure 2).
The confluence of one pool-bar unit is simultaneously the bifurcation of another pool-bar unit and also acts as the branch bend scouring pool of a third confluence. For example, confluence D is the scouring pool of the right branch of confluence E. Nodes might change their roles during channel evolution process. The scouring pool, pool 1 at the outer bank of one branch of confluence C, evolved to extend downstream and renovate confluence C on day 33. Confluences can also migrate downstream. Fast flow causes fine sediment erosion at a bifurcation and at the two front sides of its downstream bar head, with subsequent transport of the eroded sediments downstream and deposition at the bar-tail confluence, thereby causing infilling of the confluence head and scouring of the confluence tail. One example of this mechanism is shown by confluence E.
3.1.2. Geometry and Controlling Factors
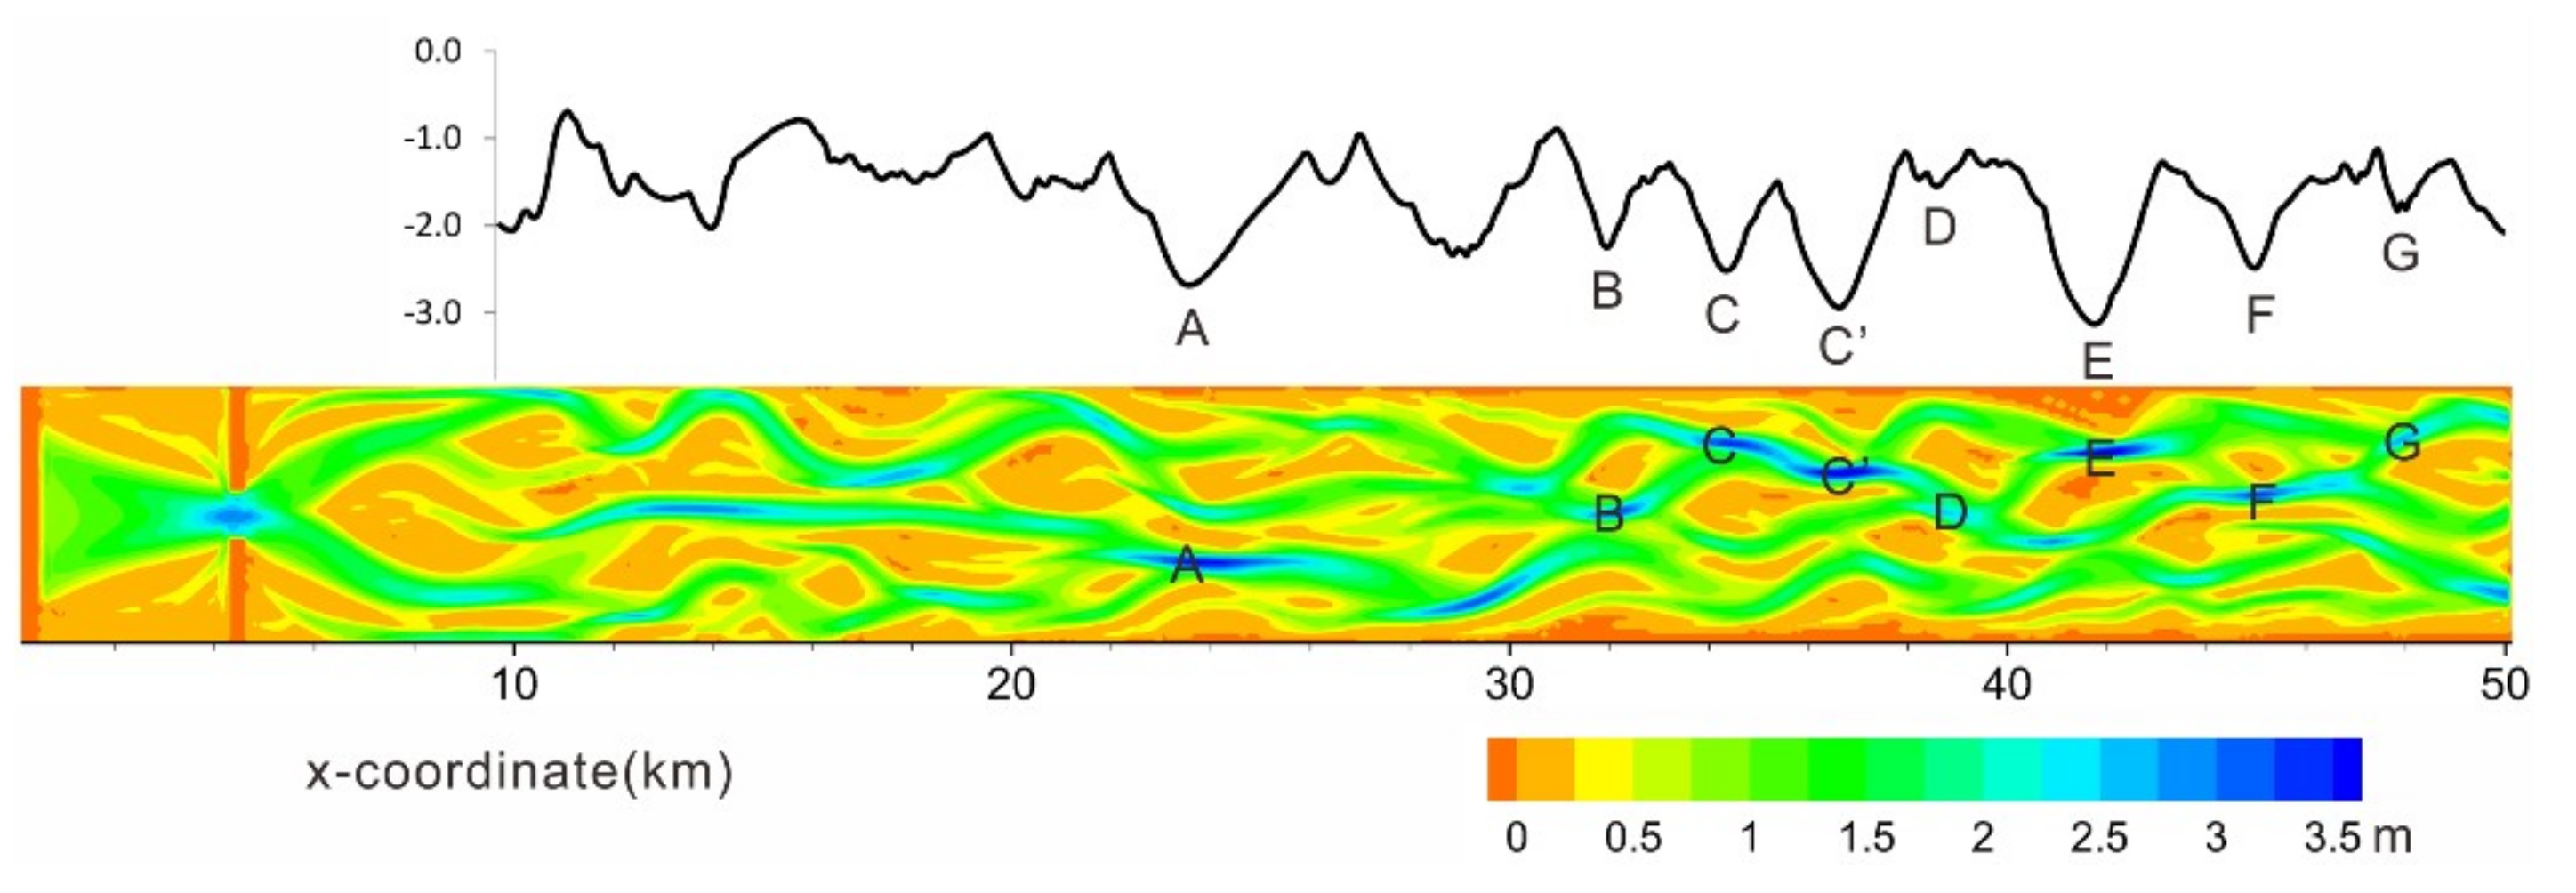
Confluences where two or more branches meet and intense erosion occurs, are normally located in areas with deepest water. Figure 3 shows the cross-sectional maximum erosion depths compared to river geometry in a fully evolved braided river, with A–G indicating the location of typical confluences. The maximum erosion depth curve exhibits a periodic wave pattern with peaks and valleys, representing local minimum and maximum erosion depths, respectively. Generally, most of the cross-sectional topographic valleys are located at confluences, with the rest being scouring pools at channel bends. Confluence erosion tends to be more intense when the total confluence channel width is narrower.
Table 1 lists the gross hydraulic and geometric features of confluences A–G. The deepest scour hole mostly occurred at the confluences with two branches most similar to each other. For example, despite not having the fastest flow or largest discharge, confluence E (discharge ratio being 1.16, closest to 1) still developed the deepest scour hole (4.01 m). Nevertheless, the confluence with branches least similar to each other (for example, discharge ratio being 3.27 for confluence A) also formed a remarkably deep scour hole (3.99 m), when the dominant branch played a key role in this process.
The confluence scour axis tends to be parallel to the dominant branch, forming a smaller angle with it, except for confluences C and G. On one hand, faster flow existing in the dominant branch eroded more sediments from the riverbed and formed the scour hole head. On the other hand, the flow direction of a confluence was oriented towards the dominant branch, determining the scour hole axis direction. However, at confluences C and G, the confluence scour axis was directed towards the secondary branch. For confluence C, the scour hole intruded into the secondary (left) branch (Figure 4a), so that the hole direction was mainly determined by the secondary branch flow. For confluence G, flow was influenced by upstream channel evolution and was mostly parallel to the secondary (right) branch, resulting in the scour hole axis direction oriented to the secondary branch as well.
3.1.3. Morphology and Evolution Process
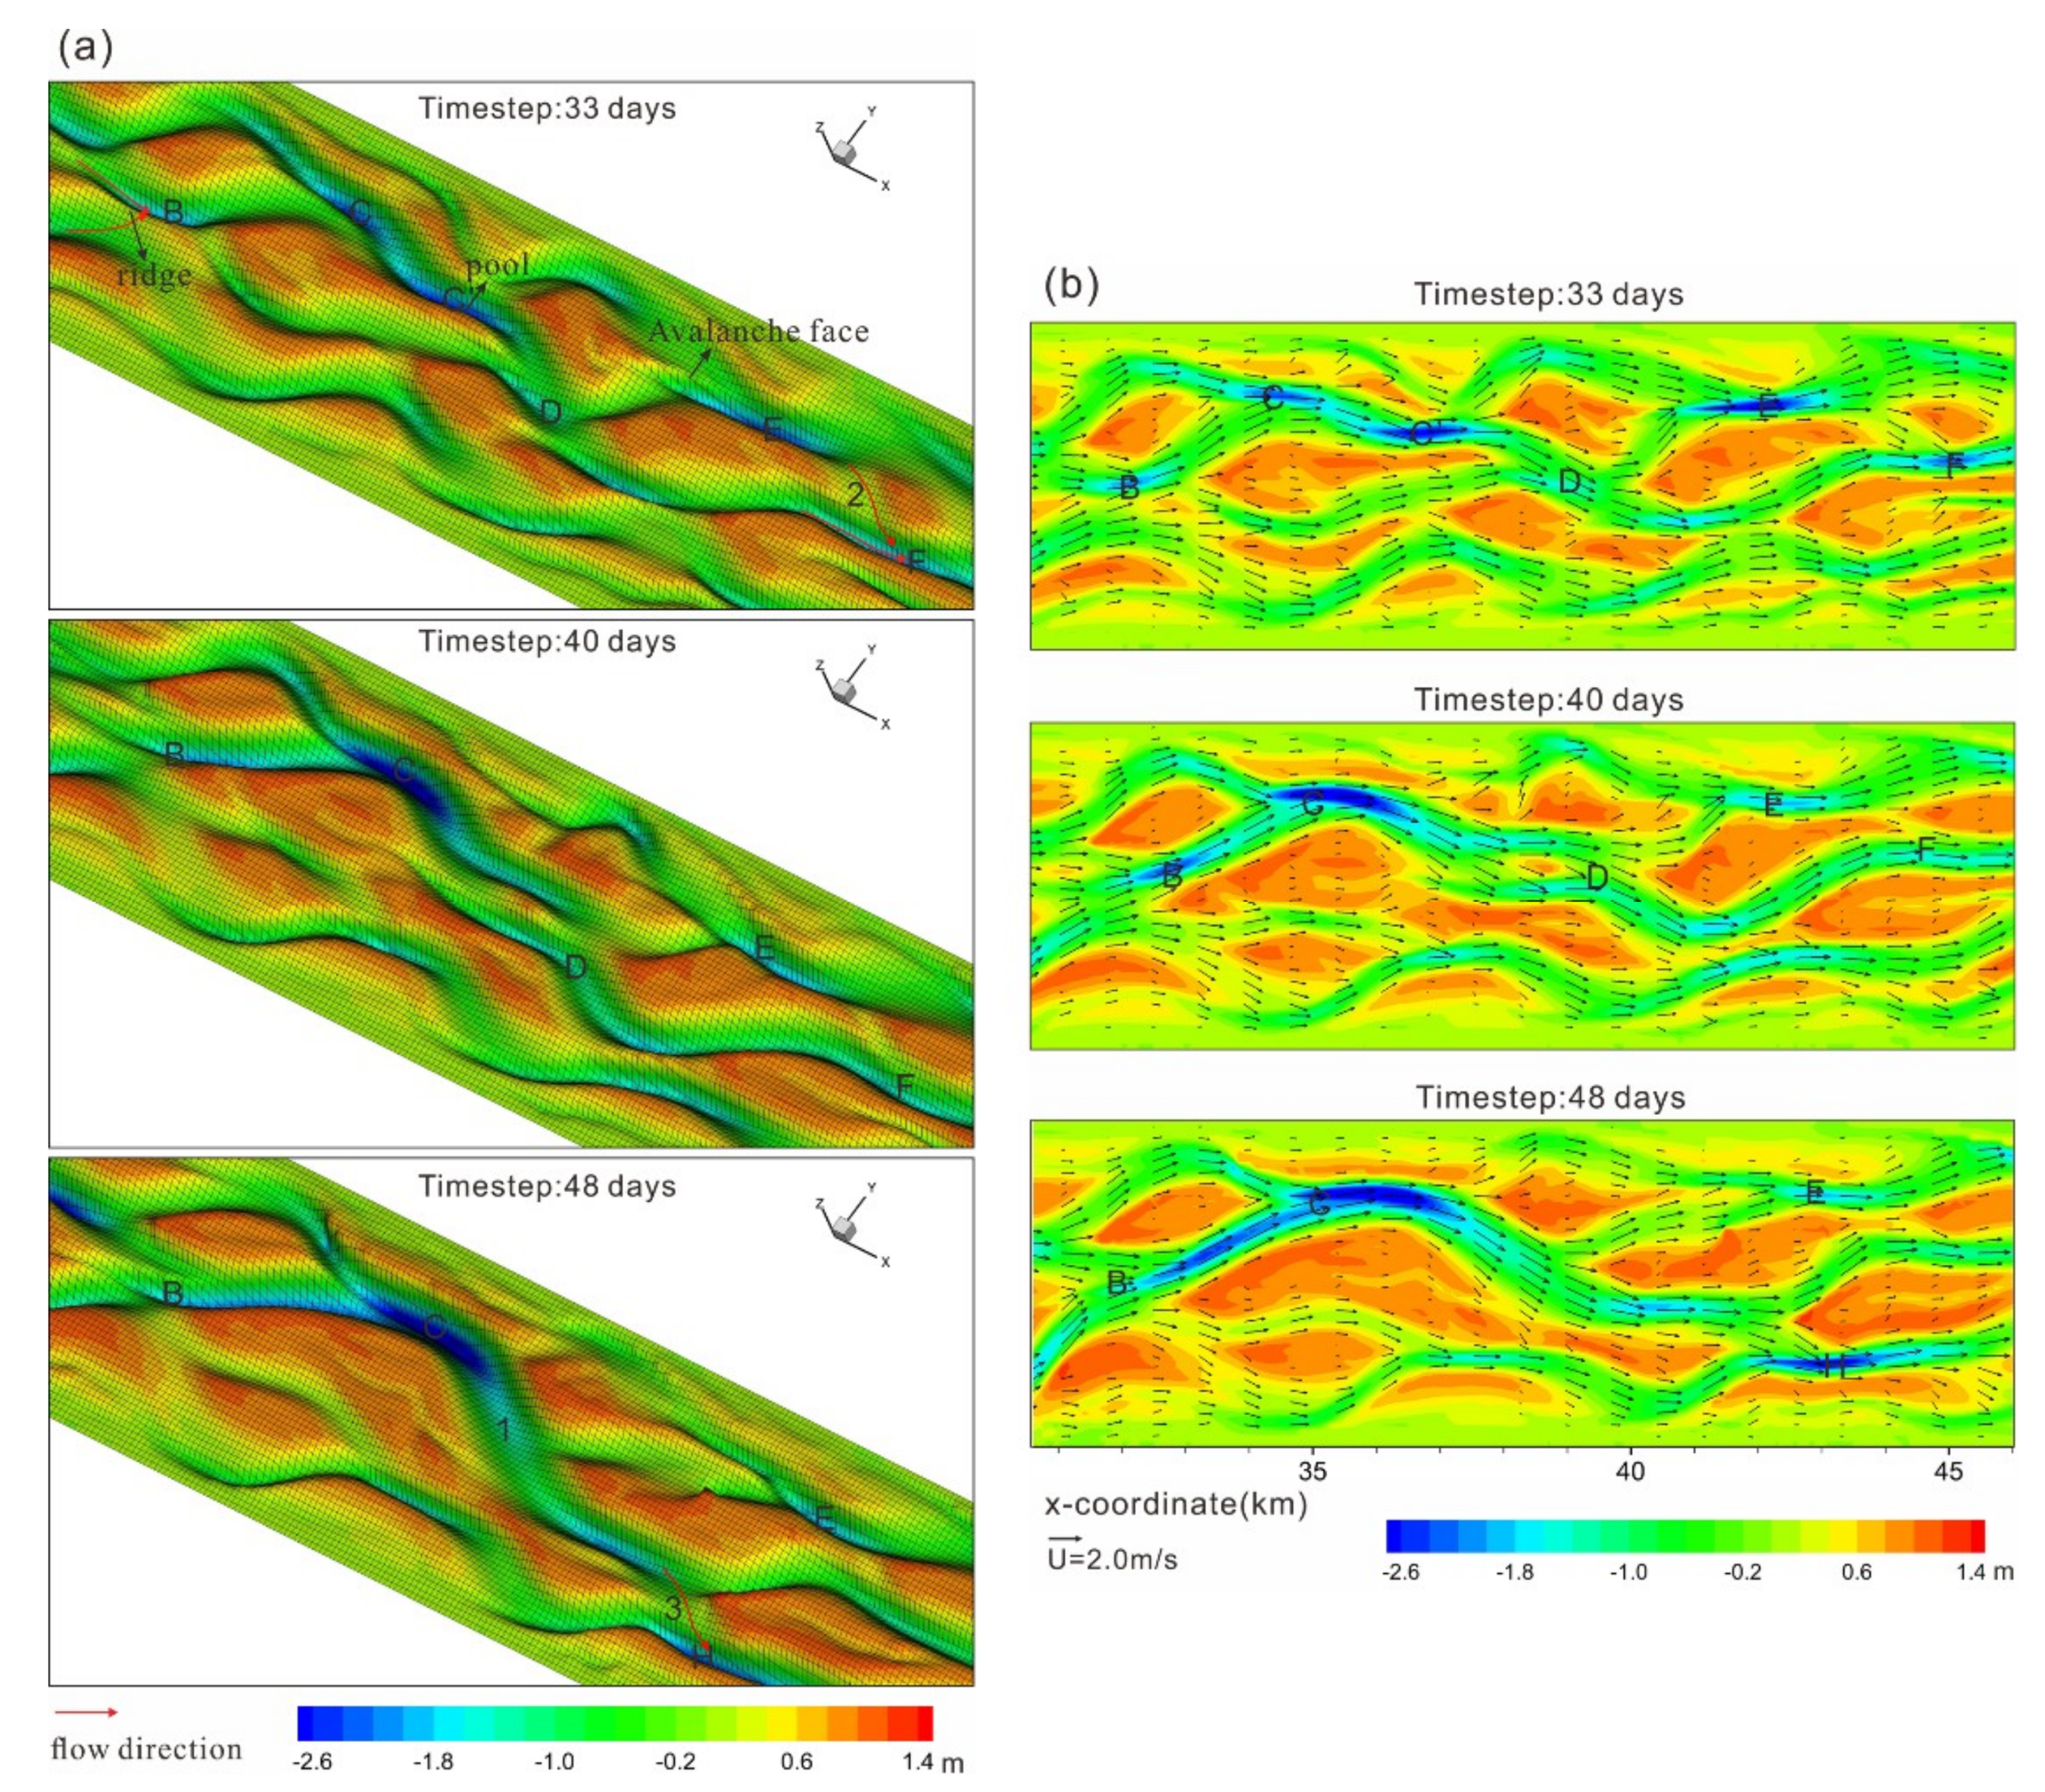
The evolution trend of the whole channel pattern dominated the evolution of confluences B to F (Figure 4). In particular, the significant growth of channel 1, closely related to the enlargement of confluence C, controlled the consequent generation and disappearance of its downstream confluences including D, E, F, and H. In 15 days, the ridge between the two branches of confluence B was eroded away, encouraging the growth of it right branch and confluence C (Figure 4b). Accordingly, confluence C moved downstream to merge with its neighborhood pool (pool C’) and became the deepest one. Channel 1 became the largest one in the reach. Due to the large amount of flow diverted into channel 1, confluences D and F gradually disappeared under the rapid blockage of one branch, and confluence E with its branches experienced a decrease in flow, resulting in sediment deposition and overall confluence weakening. Meanwhile, as channel 1 grew, water overflowed out of its downstream channel bend, leading to the formation of a new channel (channel 3) and consequently a new confluence, confluence H.
A remarkably steeper bed developed at the mouth of confluence branches, similar to avalanche faces in small-scale confluences (Figure 4a, day 33). A ridge sometimes developed in a newly formed branch, which can be viewed as a type of avalanche face. When one branch is obviously dominant, there is no visible avalanche face at its mouth, as shown by confluences B and F (Figure 4a), whose discharge ratios are 2.97 and 2.68, respectively (Table 1). Conversely, avalanche faces often exist in their secondary branch. However, when one branch does not fully dominate over the other one, avalanche faces generally occur at both of the branch mouths. For example, at confluence E that exhibits two relatively equivalent branches in terms of discharge, there are two visible avalanche faces in front of the scour hole, with digging slopes being 70- and 50-fold of the original bed slope, respectively.
3.2. Morphodynamic Processes at a Typical Confluence
Confluence E was chosen to perform a profound analysis of morphodynamic changes occurring at a typical confluence.
3.2.1. Evolution and Geometry
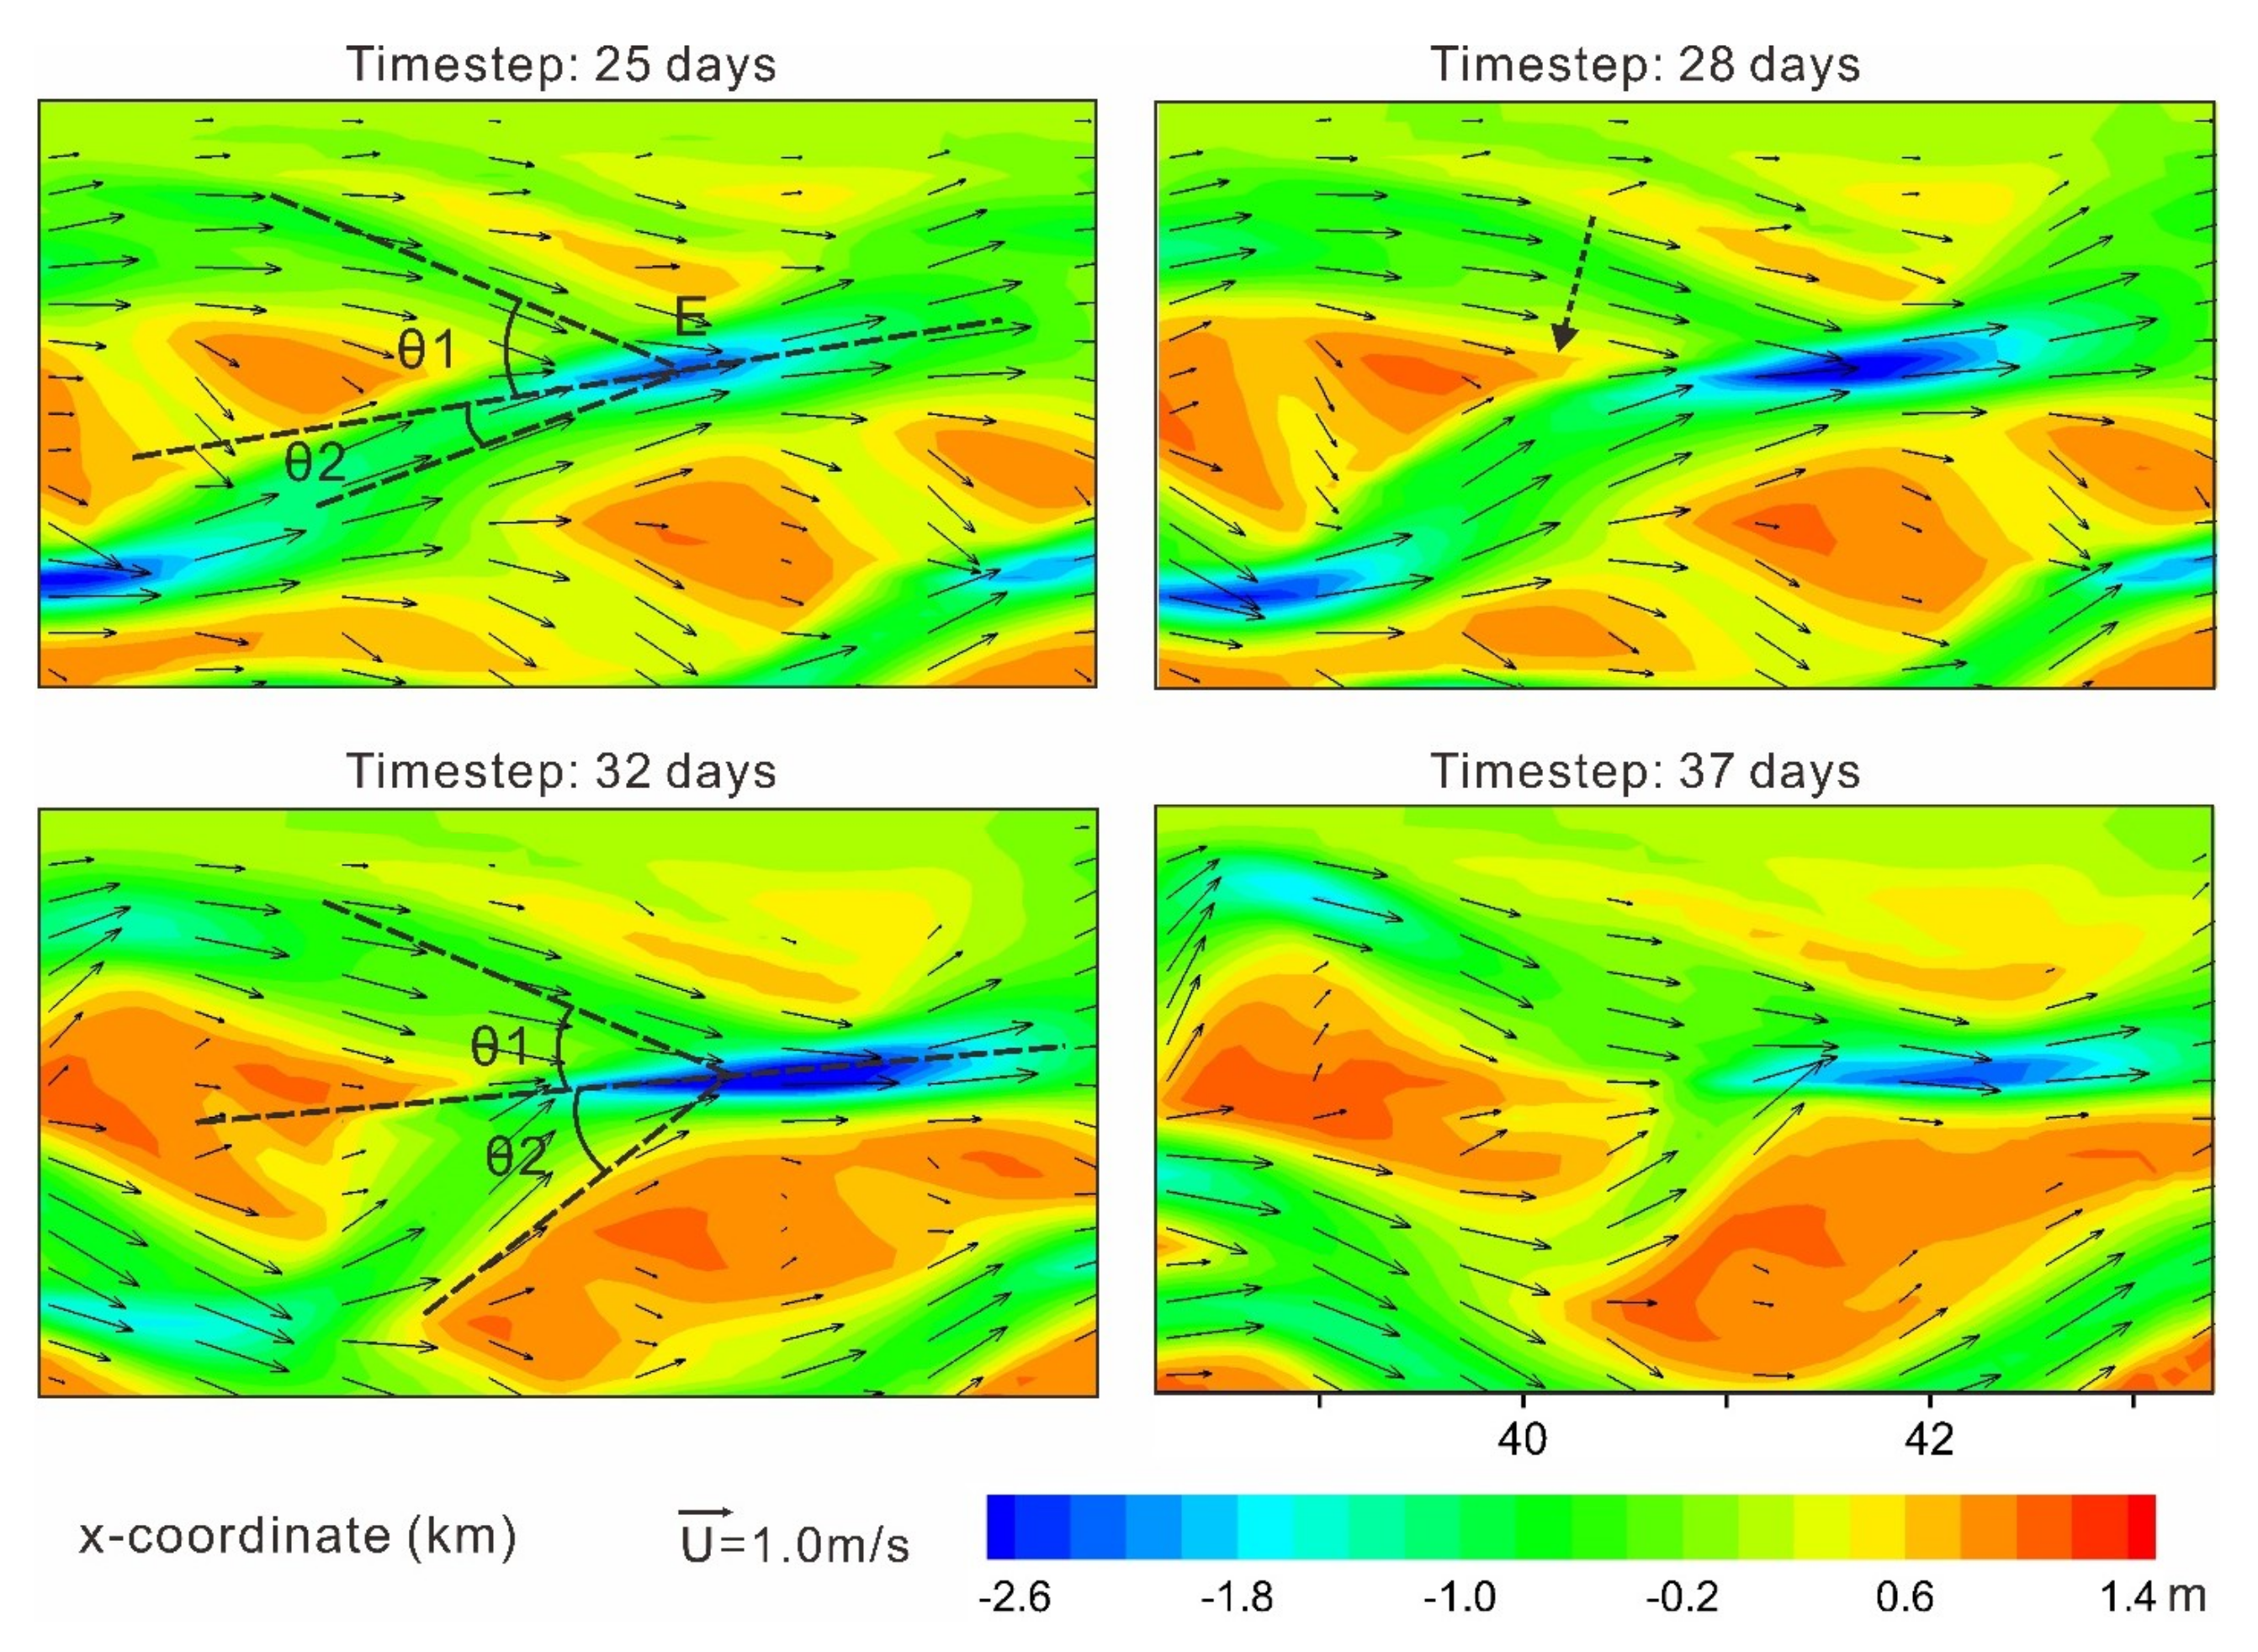
Confluence E experienced a period of expansion and then contraction, when the dominant channel switched from the left branch to the right one (Figure 5). As mentioned before, confluence E was largely filled in due to flow recession as flow being diverted away from its upstream channel. The right branch began to lose its dominant role around day 32, as the left branch progressively increased in terms of size and discharge. The location of maximum erosion depth gradually moved from the left bank to the midchannel during day 25 to 32 when the discharge ratio between the two branches approached 1, and then migrated progressively closer to the right bank when the discharge ratio increased above 1 (Table 1).
Sequential changes of flow discharge for the two branches of confluence E are illustrated in Figure 6. The left branch flow experienced a slight decrease and then steadily increased up to a maximum of 1092 m3/s on day 33. This increase appeared to result partly from the closure of a middle channel between two adjacent bars enclosed by the left and right branches and partly from channel widening (Figure 5). Then the discharge gradually decreased down until day 40. Meanwhile, discharge of the right branch increased up to 1687 m3/s due to channel constraint and the disappearance of a small bifurcation. After that, a newly formed channel branched a large portion of flow and consequently led to a discharge decrease of the right branch down to a minimum of 576 m3/s. During day 32 to 33 the two branches showed very similar discharge values. Before that, the right branch was dominant, while after that the left branch became dominant.
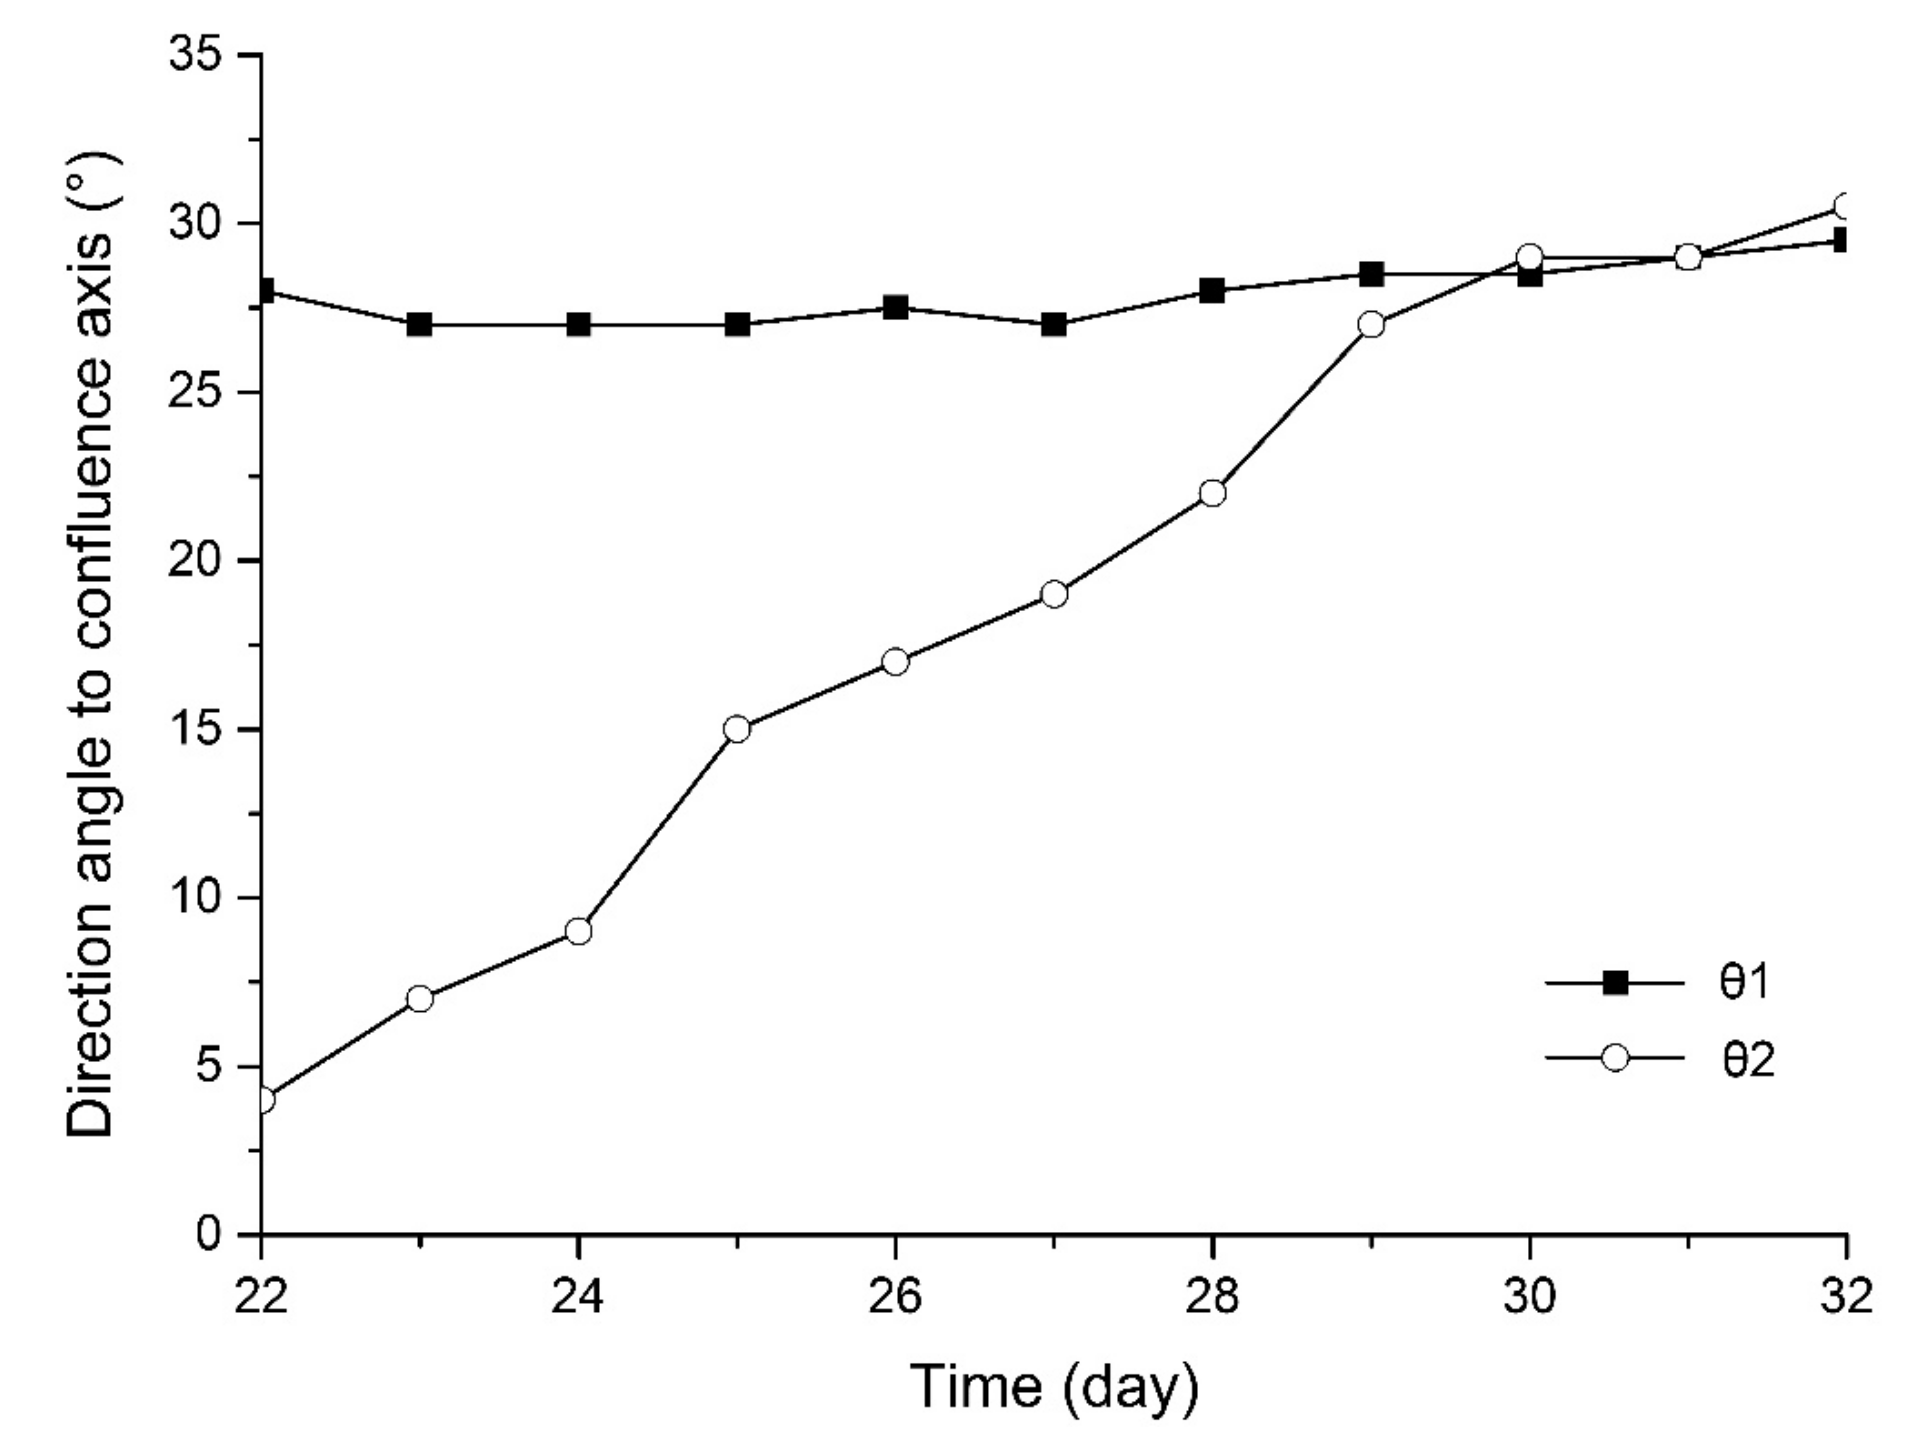
Figure 7 illustrates the variation of the orientation angles between confluence C and its two branches (θ1 and θ2 in Figure 5). The orientation of the confluence angle was mainly controlled by the discharge of its two branches. Initially, the discharge of the right branch was substantially larger than that of the left branch (Figure 6) and the confluence axis aligned closely with the direction of the right branch (Figure 7). As discharge decreased in the right branch and increased in the left branch, the orientation angle of the right branch increased while the angle of the left branch decreased. By day 32, the two branches had comparable discharges and the scour axis approximately bisected the scour angle, when the scour hole at confluence E enlarged and deepened considerably (Figure 5, day 32).
3.2.2. Flow Field and Morphology
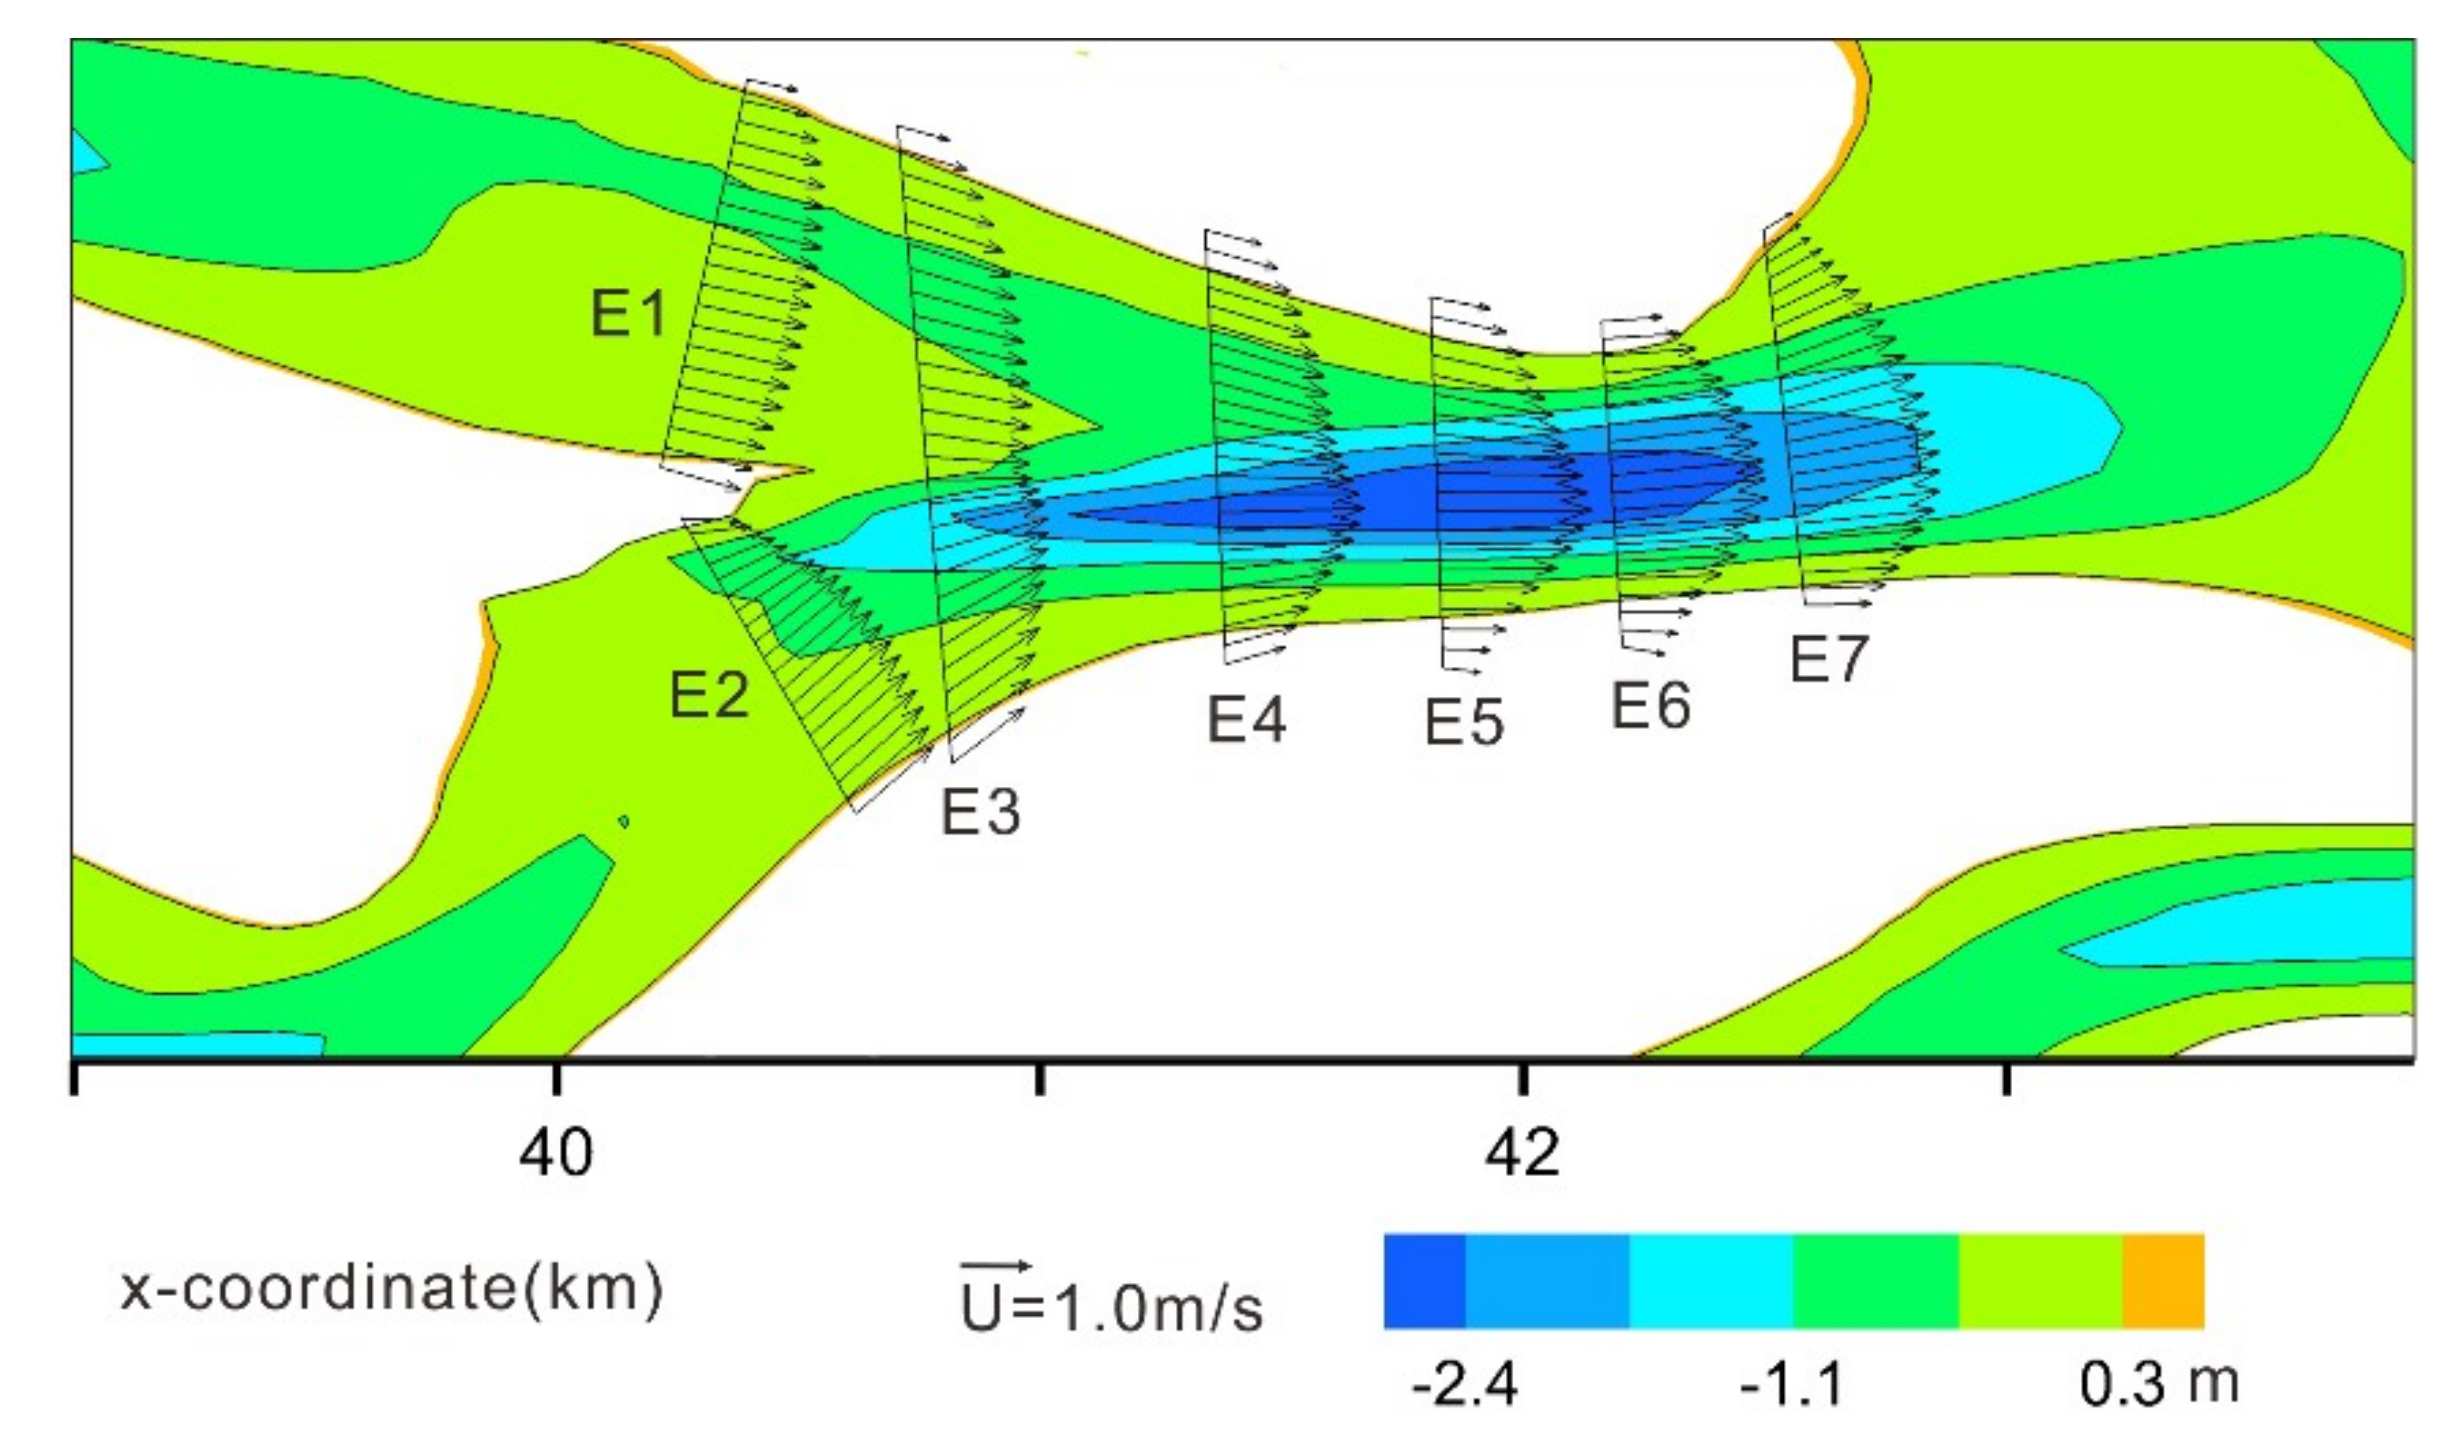
Flow velocities at seven channel cross-sections on day 32, E1 to E7, are shown in Figure 8, with five located on confluence E and two located on its two branches. At the head of confluence E, section E3 exhibited two velocity cores, with a zone of lower velocity occurring in the central area where the two flows combined. When it comes to downstream sections E4 and E5, flow concentrated and accelerated to form one major core in the hole center. Flow velocity at sections E4 and E5 peaked close to the right bank, promoting more sediment eroded away from the right bank and thus developing a steeper bank slope.
Water was deepest at section E5, which was located approximately in the center of the confluence, but the fastest flow occurred at section E6, which was located toward the end of the confluence. A similar pattern was also often observed at the other six confluences shown in Figure 4. This might explain the commonly observed downstream migration of confluence scour holes, with deposition occurring at the hole heads and erosion occurring at the hole tails. The bed morphology of the confluence is related to a characteristic trough-shaped scour hole in the center with a steeper front face than the tail.Flow in the two branches seemed to mingle faster than natural rivers [6]. This might result from the rapid changing mixed bed layers in the model.
3.2.3. Relationships Between Flow Velocity, Shear Stress and Bed Elevation
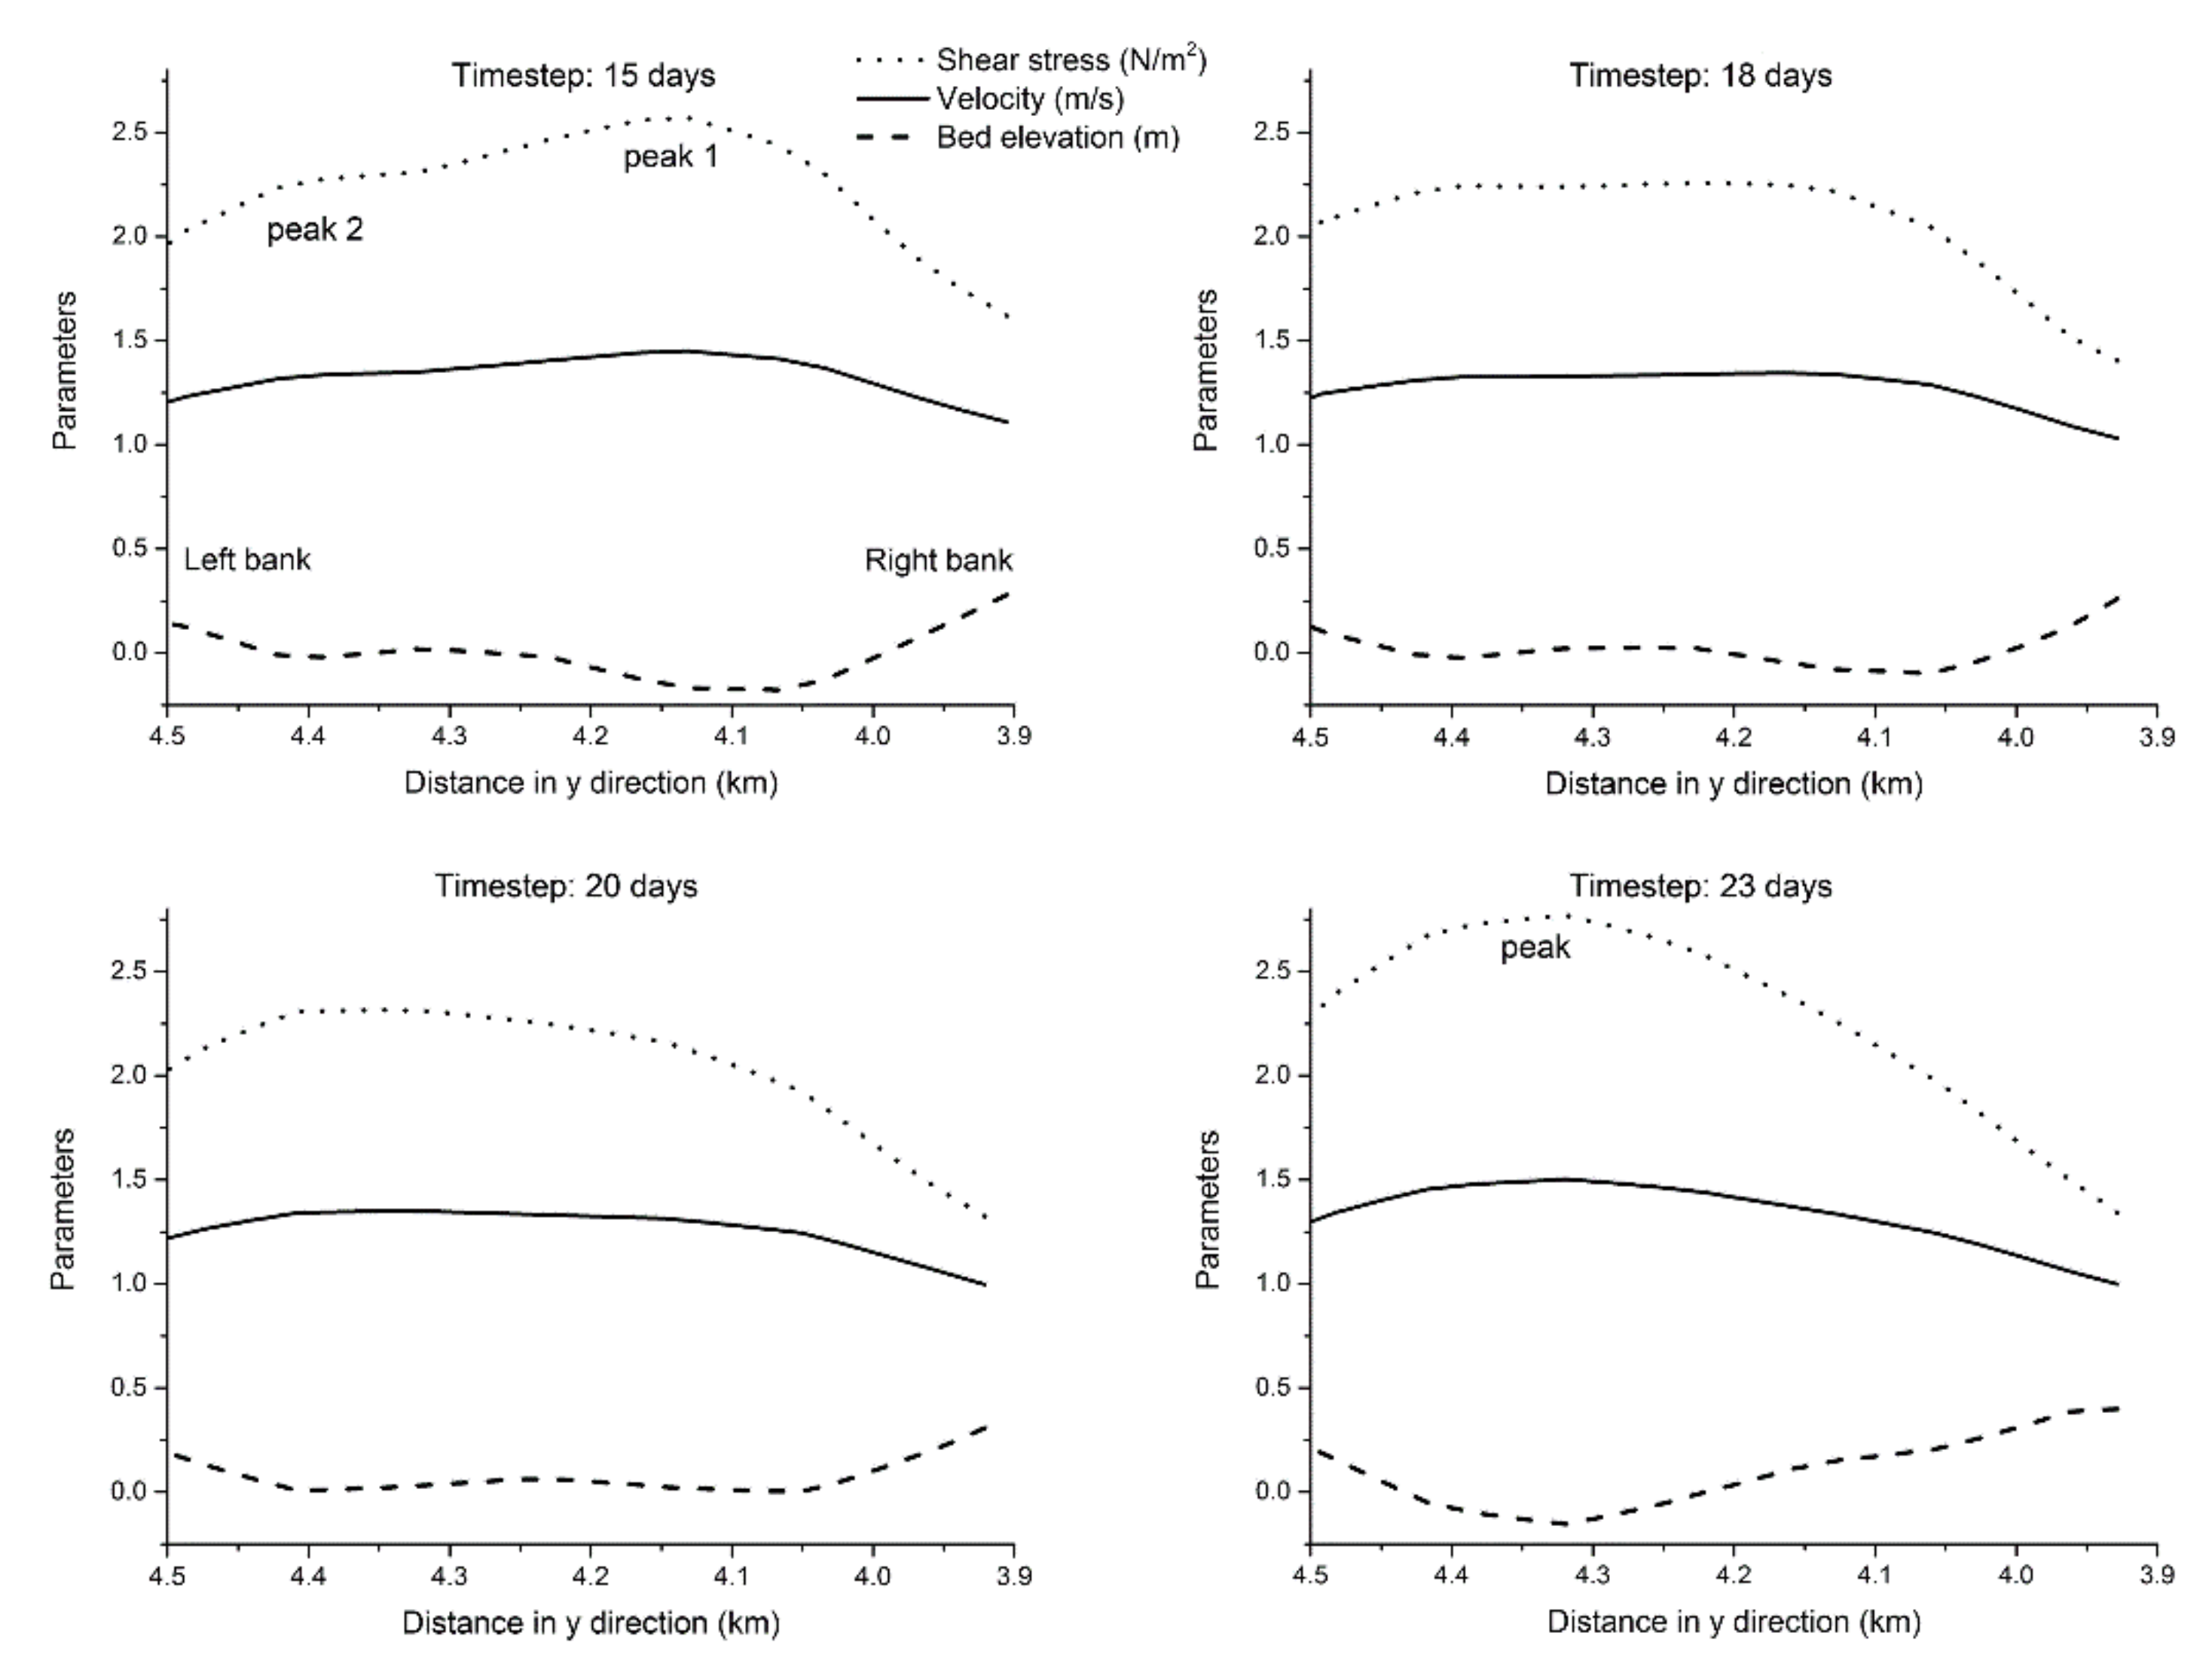
Simulation results for a cross-section on the left branch of confluence E (Figure 5, day 28) were extracted to analyze factors influencing morphodynamic changes in flow channel, with Figure 9 showing changes in flow velocity, shear stress and bed elevation across the section over eight days.
Although the major peaks in flow velocity, shear stress, and flow depth were initially located between the channel center and the right bank (peak 1 on day 15 in Figure 9), their exact locations differed, with the peak of flow depth being closer to the right bank. Over the next few days, shear stress and flow velocity of peak 1 continued to decrease, thereby promoting sediment deposition and riverbed becoming shallower. In contrast, the secondary peak, peak 2 of shear stress, continued to increase until it reached a value higher than peak 1, while bed topography remained nearly unchanged. As shear stress reached its maximum value across the channel and more sediments were carried way from the bed, a new thalweg developed in the channel, with peaks in flow velocity and shear stress occurring coincident to the thalweg (Figure 9, day 23). This process indicates that increasing shear stress and flow velocity caused local erosion, resulting in riverbed deepening. Importantly, there was a time lag before thalweg matched the peaks.
3.3. Discussion
Many previous studies focused on the confluence dynamics but mostly, only one single confluence is chosen for analysis. However, confluences in braided rivers might present a different situation because of the complicated diverging and converging network. Therefore, this study put confluences under a reach background to investigate their dynamics and mutual influences between each other.
The analysis of confluences in the simulated river indicates that, the dynamics and morphology of confluences in a braided network show many similarities to those of previous findings from single confluence. Confluences often migrate downstream due to deposition at scour hole heads and erosion at tails, which is also common in natural rivers and has been suggested to be controlled by aggradation in the confluence area and local avulsions of the primary channel [34]. The confluence scour hole is normally located close to the downstream bank of the secondary branch and has a steeper bank slope, which is the common for natural river confluences [2]. The bed morphology of the confluence is characterized by a trough-shaped scour hole in the center with a steeper front face than the tail, which was observed in laboratory flumes by Ribeiro et al. [4]. As found in the experiment of Mosley [35], when two branches have comparable discharges, the scour hole considerably enlarges and deepens. Avalanche faces exist at the mouth of confluence branches, with relatively gentler scour slopes than those of small-scale confluences. This observation agrees with the findings of Szupiany et al. [6] and Best and Ashworth [16] in large sand-bed rivers.
Confluences in braided rivers also show some differences with those of single confluences in natural rivers. The development of some key element (like channel 1) controls the evolution trend of its downstream confluences. The discharge ratio of two branches is more like a direct indicator of confluence changes rather than governing it. One example is that the axis of some confluences tends to be parallel to the secondary branch, which is opposite to previous findings [12,14], gives an illustration for this viewpoint. However, there are rarely any research analyzing the influence of upstream pattern on confluence morphology, so that our research might give an enlightenment to study confluence dynamics from the whole reach, especially for braided rivers. Besides, the location of deepest scour hole moved with the discharge ratio between the two branches, being close to the downstream bank of the secondary branch. Rhoads and Kenworthy [2,10] observed similar processes in field research, but they suggested that the velocity has the most significant influence other than the discharge ratio. The flow in two branches of the confluence in the predicted reach seems to mingle faster than natural rivers [6], which might result from bed layer settings in the model.
As for numerical model, it is still not clear what processes are essential for a model to produce a braided pattern. The key elements in our model include basic hydrodynamic and sediment transport principles, a multiple fractional method for graded sediments, a multiple layer arrangement for vertical sorting process, and deposition dominated processes. Nicholas [19] proposed that the parameterizations of secondary circulation and local bed slope effects on sediment transport are key controls of bar and bifurcation evolution, but in the present model these effects are not included, though both models concentrate on large braided rivers with a sand-bed and include the bank erosion scheme and a momentum-conserving hydrodynamic model. Nonetheless, it is acknowledged that graded sediments division into multiple fractions are essential for models to represent the non-uniform sediment transport in real rivers, because sediment entrainment and transport are non-linearly related to bed shear stress [36,37]. This is seen in the present model which produced a more realistic braided river with confluence showing similar dynamics and geomorphology to natural rivers, and a recent study also includes this effect in delft 3D, illustrating its important role in predicting bed sediment and erosion deposition in braided rivers [38].
The present work studies confluence dynamics in braided rivers with model simulation, and illustrates the potential to investigate morphodynamic processes with models by analyzing interactions between hydraulic condition, sediment transport, and bed morphologic changes. Existing braided river models usually include the spatially explicit predictions of water depth, flow velocity, sediment transport rate and bed topography with varying water surface elevation. However, most works focus on analyzing morphologic changes and statistical characteristics of the braided pattern or local units [18], or on predicting the multiple flow routines in real rivers [38,39], mainly because the model ability is still considered to be limited in representing the complicated processes in natural rivers. Nevertheless, river simulation works have benefited from discussing morphodynamics based on hydraulic interactions between the flow and floodplain. For example, Harrison et al. [40] quantified the flow exchanges between the river channel and its floodplain in the process of a chute formation with a morphodynamic model, and Wu [31] well predicted the flow field in the lower braided reaches of the Yellow River. As the representation of models is improved in physical processes that are critical to channel morphodynamics, it might be possible for future research work to seek to investigate detailed processes in braided rivers by numerical simulation.
4. Conclusions
In the present study, an existing numerical model was employed to simulate natural large lowland braided rivers. The morphodynamic processes and their controlling factors at confluences were investigated and the following conclusions can be drawn.
- In a braided river, a major change in the braiding pattern can control the overall evolution process of the confluences downstream, e.g., confluence generation and enlargement, or decline and disappearance. Locally, flow from neighboring upstream channels often plays a key role in influencing the dynamics and geometry of a confluence.
- A steep bed slope similar to avalanche face in small-scale confluence can develop at the mouth of the confluent branches. When one branch has a fully dominating discharge, avalanche face only occurs at the mouth of the secondary branch; when the two branches have similar discharges, avalanche faces occur at the mouths of both branches.
- The confluence scour hole is normally located close to the downstream bank of the secondary branch, which often has a steeper bank slope. Downstream migration of a scour hole is common due to sediment deposition at its head and erosion at its tail, with maximum flow velocity occurring behind the hole center with deepest flow.
- Generally, the discharge ratio between the two branches of a confluence indicates its flow direction, shape, depth and orientation. As the discharge ratio decreases, the scour angle between the two branches is enlarged and the scour hole deepens. The confluence flow direction and scour axis usually tends to be parallel to the dominant branch. However, an opposite situation occurs for some confluences due to the influence from upstream flow conditions.
- Increased shear stress and flow velocity may cause local erosion and scour deepening when there is a time lag before thalweg location coincides with flow peaks.
Author Contributions
H.Y. conceived the present study of confluence dynamics, analyzed the results, and wrote the paper. P.C. provided analysis suggestions and editorial improvements to the paper.
Funding
This research was funded by the Department of Science and Technology of Guangdong Province, grant No. 2018A030310152, and the Guangzhou Science, Technology and Innovation Commission, grant No. 201803020036. The funders had no role in the design of the study; in the collection, analyses, or interpretation of data; in the writing of the manuscript, or in the decision to publish the results.
Acknowledgments
We thank Binliang Lin and Jianjun Zhou for their comments and suggestions on the present research.
Conflicts of Interest
The authors declare no conflict of interest.
References
- Da Silva, A.M.F.; Yalin, M.S. Fluvial Processes; CRC Press: London, UK, 2017; pp. 133–162. [Google Scholar]
- Rhoads, B.L.; Kenworthy, S.T. Flow structure at an asymmetrical stream confluence. Geomorphology 1995, 11, 273–293. [Google Scholar] [CrossRef]
- Riley, J.D.; Rhoads, B.L.; Parsons, D.R.; Johnson, K.K. Influence of junction angle on three-dimensional flow structure and bed morphology at confluent meander bends during different hydrological conditions. Earth Surf. Proc. Land. 2015, 40, 252–271. [Google Scholar] [CrossRef]
- Ribeiro, M.L.; Blanckaert, K.; Roy, A.G.; Schleiss, A.J. Flow and sediment dynamics in channel confluences. J. Geophys. Res. Earth 2012, 117. [Google Scholar] [CrossRef] [Green Version]
- Guillen-Ludena, S.; Franca, M.J.; Cardoso, A.H.; Schleiss, A.J. Evolution of the hydromorphodynamics of mountain river confluences for varying discharge ratios and junction angles. Geomorphology 2016, 255, 1–15. [Google Scholar] [CrossRef]
- Szupiany, R.N.; Amsler, M.L.; Parsons, D.R.; Best, J.L. Morphology, flow structure, and suspended bed sediment transport at two large braid-bar confluences. Water Resour. Res. 2009, 45, W05415. [Google Scholar] [CrossRef]
- Gualtieri, C.; Filizola, N.; de Oliveira, M.; Santos, A.M.; Ianniruberto, M. A field study of the confluence between Negro and Solimoes Rivers. Part 1: Hydrodynamics and sediment transport. Comptes Rendus Geosci. 2018, 350, 31–42. [Google Scholar] [CrossRef]
- Ferguson, R.I.; Ashmore, P.E.; Ashworth, P.J.; Paola, C.; Prestegaard, K.L. Measurements in a Braided River chute and lobe: 1. Flow pattern, sediment transport and channel change. Water Resour. Res. 1992, 28, 1877–1886. [Google Scholar] [CrossRef]
- Rhoads, B.L.; Riley, J.D.; Mayer, D.R. Response of bed morphology and bed material texture to hydrological conditions at an asymmetrical stream confluence. Geomorphology 2009, 109, 161–173. [Google Scholar] [CrossRef]
- Rhoads, B.L.; Kenworthy, S.T. Time-averaged flow structure in the central region of a stream confluence. Earth Surf. Proc. Land. 1998, 23, 171–191. [Google Scholar] [CrossRef]
- Best, J.L.; Rhoads, B.L. Sediment transport, bed morphology and the sedimentology of river channel confluences. In River Confluences, Branches and the Fluvial Network; Rice, S.P., Roy, A., Rhoads, B.L., Eds.; Wiley-Interscience: Hoboken, NJ, USA, 2008; pp. 45–72. [Google Scholar]
- Ashmore, P.; Parker, G. Confluence scour in coarse braided streams. Water Resour. Res. 1983, 19, 392–402. [Google Scholar] [CrossRef] [Green Version]
- Best, J.L. The morphology of river channel confluences. Prog. Phys. Geog. 1986, 10, 157–174. [Google Scholar] [CrossRef]
- Best, J.L. Sediment transport and bed morphology at river channel confluences. Sedimentology 1988, 35, 481–498. [Google Scholar] [CrossRef]
- Parsons, D.R.; Best, J.L.; Lane, S.N.; Kostaschuk, R.A.; Hardy, R.J.; Orfeo, O.; Amsler, M.L.; Szupiany, R.N. Large river channel confluences. In River Confluences, Tributaries and the Fluvial Network; Rice, S.P., Roy, A.G., Rhoads, B.L., Eds.; John Wiley & Sons, Ltd.: Chichester, UK, 2008; pp. 73–91. [Google Scholar]
- Best, J.L.; Ashworth, P.J. Scour in large braided rivers and the recognition of sequence stratigraphic boundaries. Nature 1997, 387, 275–277. [Google Scholar] [CrossRef]
- Schuurman, F.; Marra, W.A.; Kleinhans, M.G. Physics-based modeling of large braided sand-bed rivers: Bar pattern formation, dynamics, and sensitivity. J. Geophys. Res. Earth 2013, 118, 2509–2527. [Google Scholar] [CrossRef]
- Schuurman, F.; Kleinhans, M.G. Bar dynamics and bifurcation evolution in a modelled braided sand-bed river. Earth Surf. Proc. Land. 2015, 40, 1318–1333. [Google Scholar] [CrossRef]
- Nicholas, A.P. Modelling the continuum of river channel patterns. Earth Surf. Proc. Land. 2013, 38, 1187–1196. [Google Scholar] [CrossRef]
- Jang, C.L.; Shimizu, Y. Numerical simulations of the behavior of alternate bars with different bank strengths. J. Hydrol. Res. 2005, 43, 596–612. [Google Scholar] [CrossRef]
- Jang, C.L.; Shimizu, Y. Numerical simulation of relatively wide, shallow channels with erodible banks. J. Hydrol. Eng. 2005, 131, 565–575. [Google Scholar] [CrossRef]
- Yang, H.; Lin, B.; Zhou, J. Physics-based numerical modelling of large braided rivers dominated by suspended sediment. Hydrol. Process. 2015, 29, 1925–1941. [Google Scholar] [CrossRef]
- Yang, H. Development of a Physics-based Morphodynamic Model and its Application to Braided Rivers. Ph.D. Thesis, Cardiff University, Cardiff, Wales, 2013. [Google Scholar]
- Lin, B.L.; Falconer, R.A. Hydrological and Environmental Modeling of Transport Processes in Rivers and Estuaries. Encycl. Hydrol. Sci. 2006, 1, 271–284. [Google Scholar]
- van Rijn, L.C. Sediment transport, part II: Suspended load transport. J. Hydrol. Eng. 1984, 110, 1613–1641. [Google Scholar] [CrossRef]
- Preston, R.W. The Representation of Dispersion in Two-Dimensional Shallow Water Flow; Report No. TPRD/U278333/N84; Central Electricity Research Laboratories: Richmond, UK, 1985; 13p. [Google Scholar]
- Lin, B.L.; Falconer, R.A. Tidal flow and transport modeling using ULTIMATE QUICKEST scheme. J. Hydrol. Eng. 1997, 123, 303–314. [Google Scholar] [CrossRef]
- Zhou, J.; Lin, B. Flow and Sediment Modelling; China Hydropower Press: Beijing, China, 2006. [Google Scholar]
- Zhou, J.; Lin, B.; Lin, B. Rational Basis for Suspended Sediment Modeling. Int. J. Sediment Res. 2003, 18, 177–195. [Google Scholar]
- Zhao, Y.; Zhou, W.; Fei, X.; Hu, C.; Shen, G.; Chen, J. Principles of Channel Evolution in the Lower Yellow River; Yellow River Water Conservancy Press: Zhengzhou, China, 1998. [Google Scholar]
- Wu, W. Computational River Dynamics; Taylor & Francis Group: London, UK, 2007; pp. 241–287. [Google Scholar]
- Zhou, J. Numerical simulation of flow and sediment transport. In Advances in Sediment Research; Wang, G., Hu, C., Eds.; China Water Power Press: Beijing, China, 2007; Volume 5, pp. 173–278. [Google Scholar]
- Ashmore, P. Intensity and characteristic length of braided channel patterns. Can. J. Civil Eng. 2009, 36, 1656–1666. [Google Scholar] [CrossRef]
- Roy, N.; Sinha, R. Understanding confluence dynamics in the alluvial Ganga–Ramganga valley, India: An integrated approach using geomorphology and hydrology. Geomorphology 2007, 92, 182–197. [Google Scholar] [CrossRef]
- Mosley, M.P. An experimental study of channel confluences. J. Geol. 1976, 84, 535–562. [Google Scholar] [CrossRef]
- Mosselman, E. Modelling sediment transport and morphodynamics of gravel-bed rivers. In Gravel-Bed Rivers: Processes, Tools, Environments; Church, M., Biron, P.M., Roy, A.G., Eds.; Wiley: Chichester, UK, 2012; pp. 101–115. [Google Scholar]
- Iwasaki, T.; Shimizu, Y.; Kimura, I. Numerical simulation of bar and bank erosion in a vegetated floodplain: A case study in the Otofuke River. Adv. Water Resour. 2016, 93, 118–134. [Google Scholar] [CrossRef]
- Williams, R.; Measures, R.; Hicks, D.; Brasington, J. Assessment of a numerical model to reproduce event-scale erosion and deposition distributions in a braided river. Water Resour. Res. 2016, 52, 6621–6642. [Google Scholar] [CrossRef]
- Schuurman, F.; Ta, W.; Post, S.; Sokolewicz, M.; Busnelli, M.; Kleinhans, M. Response of braiding channel morphodynamics to peak discharge changes in the Upper Yellow River. Earth Surf. Proc. Land. 2018, 43, 1648–1662. [Google Scholar] [CrossRef]
- Harrison, L.R.; Dunne, T.; Fisher, G.B. Hydraulic and geomorphic processes in an overbank flood along a meandering, gravel-bed river: implications for chute formation. Earth Surf. Proc. Land. 2015, 40, 1239–1253. [Google Scholar] [CrossRef] [Green Version]
Figure 1.
Initial sediment settings of the six size fractions in flow and bed layers.

Figure 2.
Sequential evolution of confluences in the modelled river (water depth/m).

Figure 3.
Cross-sectional maximum erosion depths compared to river geometry in a fully evolved river (day 33).
Figure 3.
Cross-sectional maximum erosion depths compared to river geometry in a fully evolved river (day 33).

Figure 4.
Evolution process of confluences B–F (erosion depth/m): (a) 3D channel morphology; (b) 2D plane map with depth-averaged velocity (m/s).
Figure 4.
Evolution process of confluences B–F (erosion depth/m): (a) 3D channel morphology; (b) 2D plane map with depth-averaged velocity (m/s).

Figure 5.
Evolution process of confluence E (erosion depth/m).

Figure 6.
Sequential changes of flow discharge for the two branches of confluence E.

Figure 7.
Changes in the orientation angle of the two branches of confluence E with respect to the confluence axis.
Figure 7.
Changes in the orientation angle of the two branches of confluence E with respect to the confluence axis.

Figure 8.
Distribution of depth-averaged flow velocities through confluence E on day 32 (erosion depth/m).
Figure 8.
Distribution of depth-averaged flow velocities through confluence E on day 32 (erosion depth/m).

Figure 9.
Spatial distribution of flow velocity, water depth and shear stress across the left branch of confluence E.
Figure 9.
Spatial distribution of flow velocity, water depth and shear stress across the left branch of confluence E.


Table 1.
Parameters of seven typical confluences in a fully evolved river (day 33).
| No. | Maximum Scour Depth (m) | Water Depth (m) | Maximum Flow Velocity (m/s) | Discharge of Left Branch (m3/s) | Discharge of Right Branch (m3/s) | Discharge Ratio | Angle of Two Branches (°) | Angle to Left Branch (°) |
|---|---|---|---|---|---|---|---|---|
| A | −2.67 | 3.78 | 2.40 | 2133.1 | 652.4 | 3.27 | 34.22 | 8.10 |
| B | −2.24 | 3.37 | 1.96 | 1599.3 | 539.3 | 2.97 | 34.68 | 15.55 |
| C | −2.49 | 3.56 | 2.08 | 1385.0 | 1738.7 | 1.26 | 42.86 | 9.55 |
| D | −1.51 | 2.58 | 1.73 | 1916.1 | 826.7 | 2.32 | 36.17 | 13.59 |
| E | −3.10 | 3.99 | 2.12 | 1096.0 | 948.2 | 1.16 | 49.40 | 14.93 |
| F | −2.46 | 3.42 | 2.10 | 498.3 | 1333.9 | 2.68 | 50.24 | 29.89 |
| G | −2.31 | 3.27 | 2.08 | 1089.3 | 724.2 | 1.50 | 50.87 | 29.71 |
Note: Discharge ratio = discharge of dominant branch/discharge of secondary branch.
© 2019 by the authors. Licensee MDPI, Basel, Switzerland. This article is an open access article distributed under the terms and conditions of the Creative Commons Attribution (CC BY) license (http://creativecommons.org/licenses/by/4.0/).
Share and Cite
MDPI and ACS Style
Yang, H.; Cong, P. Confluence Dynamics in a Modelled Large Sand-Bed Braided River. Water 2019, 11, 1829. https://doi.org/10.3390/w11091829
AMA Style
Yang H, Cong P. Confluence Dynamics in a Modelled Large Sand-Bed Braided River. Water. 2019; 11(9):1829. https://doi.org/10.3390/w11091829
Chicago/Turabian StyleYang, Haiyan, and Peitong Cong. 2019. "Confluence Dynamics in a Modelled Large Sand-Bed Braided River" Water 11, no. 9: 1829. https://doi.org/10.3390/w11091829
Note that from the first issue of 2016, this journal uses article numbers instead of page numbers. See further details here.