The Influence of Urban Flooding on Residents’ Daily Travel: A Case Study of Macau with Proposed Ameliorative Strategies

Faculty of Innovation and Design, City University of Macau, Macau 999078, China
*
Author to whom correspondence should be addressed.
Water 2019, 11(9), 1825; https://doi.org/10.3390/w11091825
Submission received: 18 July 2019
/
Revised: 28 August 2019
/
Accepted: 29 August 2019
/
Published: 31 August 2019
(This article belongs to the Section Urban Water Management)
Abstract
:Climate change has resulted in more extreme weather events in coastal cities, and understanding how daily life is impacted is crucial to make effective adaptation measures. Using Macau as a testbed, this research describes examines the impacts of flooding caused by storm surges on residents’ daily travel and proposes measures to ameliorate disaster risks. Spatial extents of urban floods were modelled through inundation simulations using geographical information data. An analysis of the travel distance increases from residents’ homes to common types of destinations was performed both under normal conditions and during flood events in GIS (Geographic Information System) to assess the influence of urban flooding on residents’ daily travel. The results show that one third of the land is threatened by floods in Macau. People’s average travel distance increases as the warning levels escalate, and travel distance is predicted to rise by up to 64.5%. Based on the findings, the study proposes mitigation strategies to minimize urban flooding’s impacts. It suggests that the area more densely populated is not necessarily the one requiring the deployment of preventative measures with the highest priority, as a traffic analysis is identified as the key area which demands disaster prevention measures.
1. Introduction
Changes in global climate and atmospheric circulation frequently cause extreme weather events, such as typhoons, rainstorms, and drought [1], with the resulting harmful effects often exacerbated in cities with high urbanization rates [2]. Coastal cities are particularly subject to storm surges and floods. Research data from the Centre for Research on the Epidemiology of Disasters indicate that natural disasters related to climate change in 2016 caused global economic losses of about USD 66.5 billion, and China ranked second with total losses of about USD 13.6 billion [3]. At present, about 40 million people (0.6% of the global population or one-tenth of the total population of port cities) are currently exposed to a 1 in 100 year coastal flood event [4].
During the past decade, floods were the natural disaster that most affected people, and their intensity and frequency have been increasing [3]. Currently, flood disasters mostly occur in estuary and delta regions, and the Pearl River Delta (PRD) region has the highest risk of urban floods in China [5,6]. In the south of the PRD region, the Macau Special Administrative Region (SAR) has capitalized on its convenient geographical advantages and resources to achieve continuous population and economic growth [7]. Macau is one of the centers in the PRD area with a 100% urbanization rate and a population density (21,055/km2) ranked 1st in the world [8]. However, Macau’s current disaster prevention and mitigation systems are insufficient, and its early warning and prevention mechanisms need improvements [9,10]. On average, Macau suffers five-to-six urban flood disasters caused by typhoon and storm surge every year [11]. In 2017, urban floods triggered by Typhoon Hato, the most devastating to hit the PRD in the past 50 years, resulted in the death of ten people, a 1.5 billion dollar loss, and traffic paralysis for three days [8]. Public transport was suspended, and some center streets were completely impassible [12]. Consequently, the Macau government has aimed to improve the city’s capacity to prevent and defend against disasters to protect residents’ life and activities [11]. To this end, Macau urgently needs to develop a sustainable and scientific system to manage urban flooding, especially during the event of typhoon and storm surges. To support these efforts, this study aims to employ a quantitative data analysis on the impacts of urban flooding on Macau residents’ urban travel and to identify the areas that might cause the most severe traffic network problems in disasters. These areas are then prioritized for the installation of preventative and recovery measures to overcome the effects of disasters in order to minimize negative impacts. Risk prevention and adaptation measures are proposed and demonstrated at the end of this research.
Factors triggering floods in cities include natural factors, such as rainfall, storm surge and seawater intrusion, and human factors, such as deforestation, drainage system blockage and improper land use. Additionally, population increases accelerate the urbanization process that converts natural lands to built-up hard surfaces with more impervious pavement, lesser infiltration rates, and higher flood peaks and runoff volumes. Floods can have a severe impact on residents’ travel. Severe floods make streets impassable, cause lane closures and reduce transportation system capacity, all of which decrease traffic connectivity and paralyze transport [13]. People have to detour to their destination, which increases their travel distance and results in more traffic congestion [14]. Measures to prevent and mitigate floods include structural measures such as the construction of dams, river dikes, and drainage networks, as well as non-structural measures such as flood forecasting and warning systems [15]. Recent studies on preventing, controlling and evaluating flooding disaster risks have mostly focused on digitalization, technicalization, and informatization [16,17,18,19]. Mark (2004) showed how urban flooding could be simulated by one-dimensional hydrodynamic modelling incorporating the interaction between the buried pipe system, the streets (with open channel flow) and the areas flooded with stagnant water. In order to visualize flood extent and impact, the modelling results were presented in the form of flood inundation maps produced in GIS (Geographic Information System) [20]. Mathews (2015) performed a GIS-based spatial analysis of U.S. population census data and siren locations to assess the disaster warning system’s protection coverage in Stillwater, Oklahoma [21]. The findings were used to improve the community’s disaster prevention and early warning capability to reduce disasters’ effects on residents’ lives and properties. Hasnat (2017) used a GIS network analysis to locate the vulnerable areas of Dhaka, the capital of Bangladesh, and vulnerability was assessed by evaluating the by disaster prevention facilities’ emergency response time and the distances to evacuation points [22].
In previous studies, most scholars used urban flooding models to find engineering solutions based on survey sample data without a comprehensive analysis of the overall population. These studies were not effectively supported by social data and could not realistically reflect urban residents’ needs in disaster situations [16]. Understanding how daily life is impacted by natural disasters is crucial to make effective adaptation measures [23]. From a planning point of view, the transport system is the backbone of cities [24], and floods’ impacts on transportation result in more travel distance that disrupts social production, logistics, and business; puts the urban environment under stress; and increases emissions [25]. Low impact development (LID) means systems and practices to manage storm water as part of green infrastructures through infiltrating, filtering, storing, and detaining runoff close to its source [26]. LID has been deemed an innovative approach to prevent flooding in previous studies [27,28]. However, the effectiveness of LID in practice varies depending on a variety of urban design characteristics and patterns [29]. Therefore, this study took a locational and directional approach using hydrological modelling, a GIS-based network analysis, and the social profile of Macau residents to analyze: (i) What are the impacts of urban flooding on Macau’s traffic network; (ii) how is people’s travel distance affected by the flood event; and (iii) where and how the prevention and adaptation measures should be taken, in terms of priority and effectiveness. Section 2 describes the methods and models applied to explore the spatial extent affected by different flood levels and identifies the areas which should be prioritized for the deployment of prevention and adaptation measures. Section 3 explains and discusses the results, and it proposes a prevention and adaptation design plan. Section 4 summarizes the research and points out the research limitations.
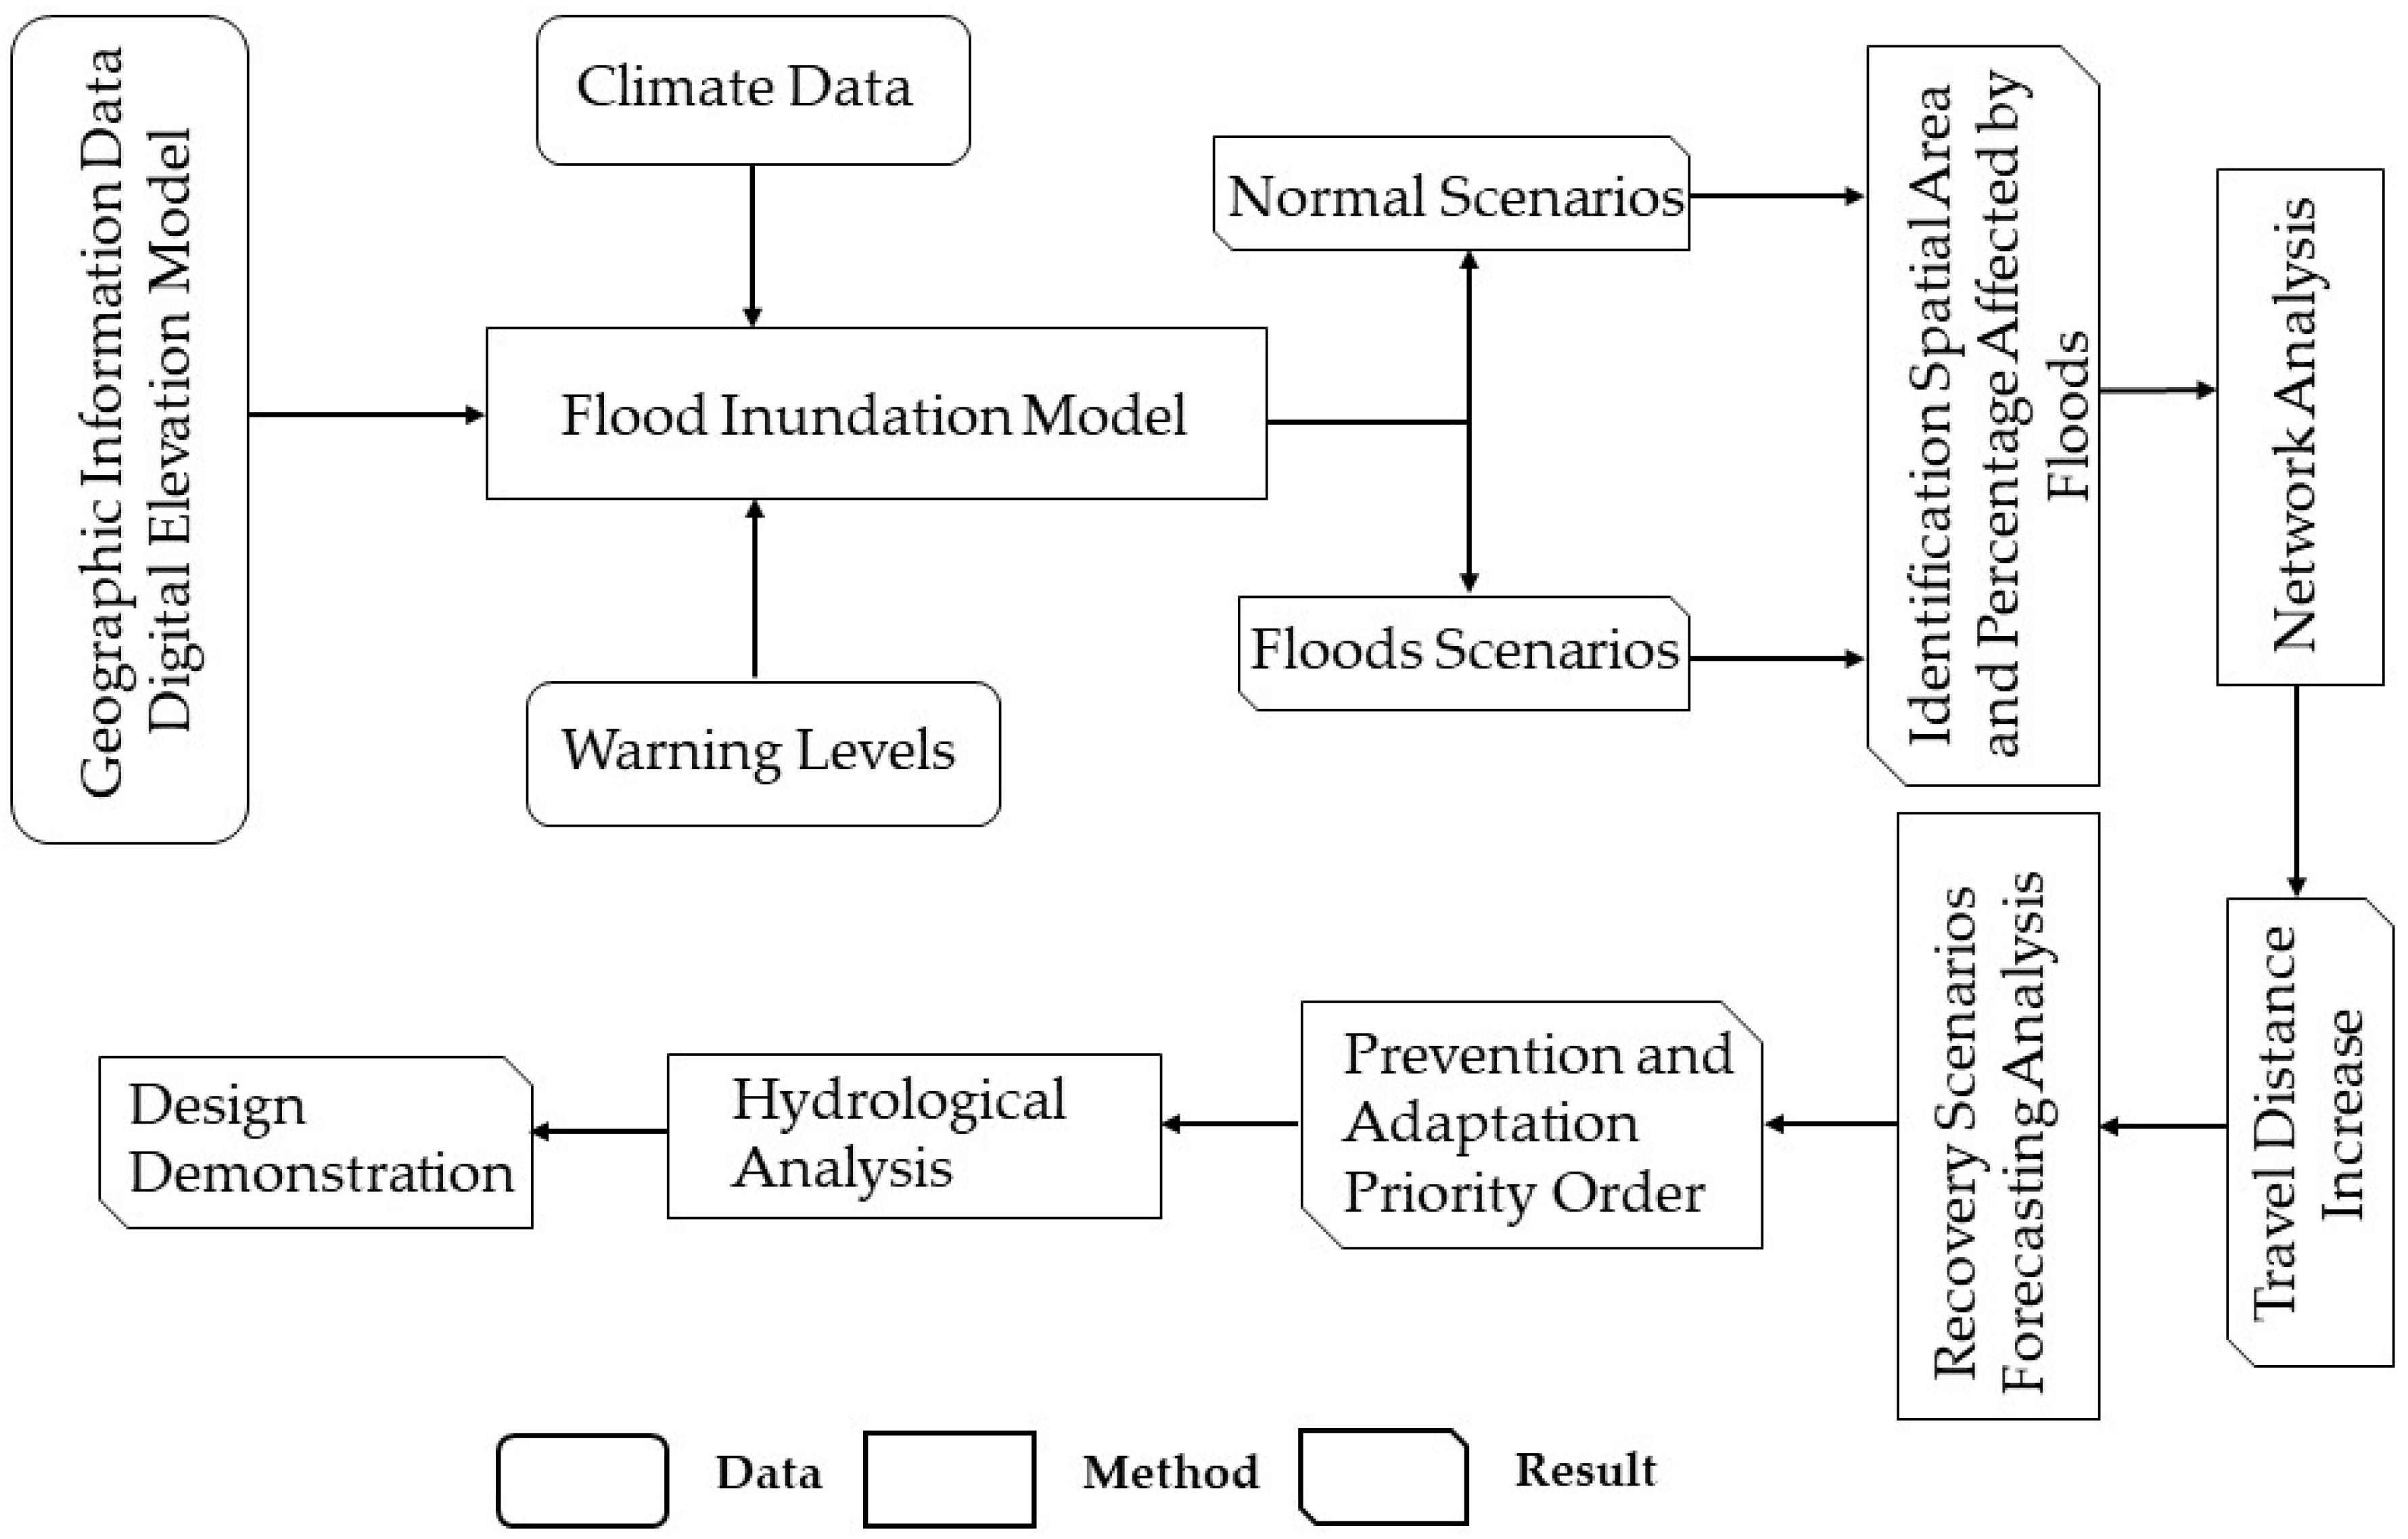
2. Materials and Methods
The spatial area and percentage affected by urban floods on different warning levels were calculated with the coastal flood hazard model [30], Macau geographic information data, and the digital elevation model. The changes to the residents’ travel distance due to traffic paralysis caused by urban floods were calculated applying a GIS origin–destination (OD) network analysis [31]. A scenario analysis and forecasting were conducted to identify the area that should be prioritized for the deployment of preventative measures. Finally, the study developed a risk prevention and adaptation design plan as demonstration based on a hydrological analysis in GIS [32]. The research framework is shown in Figure 1. A flood inundation model was first applied to map the areas inundated by floods and calculate the percentage of buildings and roads affected by different warning levels. Then, network analysis was performed to compute the residents’ shortest travel distances from home to their common destinations under normal conditions and during flood events. The parish with the highest priority for the deployment of preventative and adaptation measures was identified by a scenario analysis and forecasting based on the extent to which flood avoidance in each parish scenario would alleviate floods’ influence on the city’s overall road network. Finally, prevention and adaptation measures were proposed in the parish with the highest priority based on the hydrological analysis.
2.1. Study Area
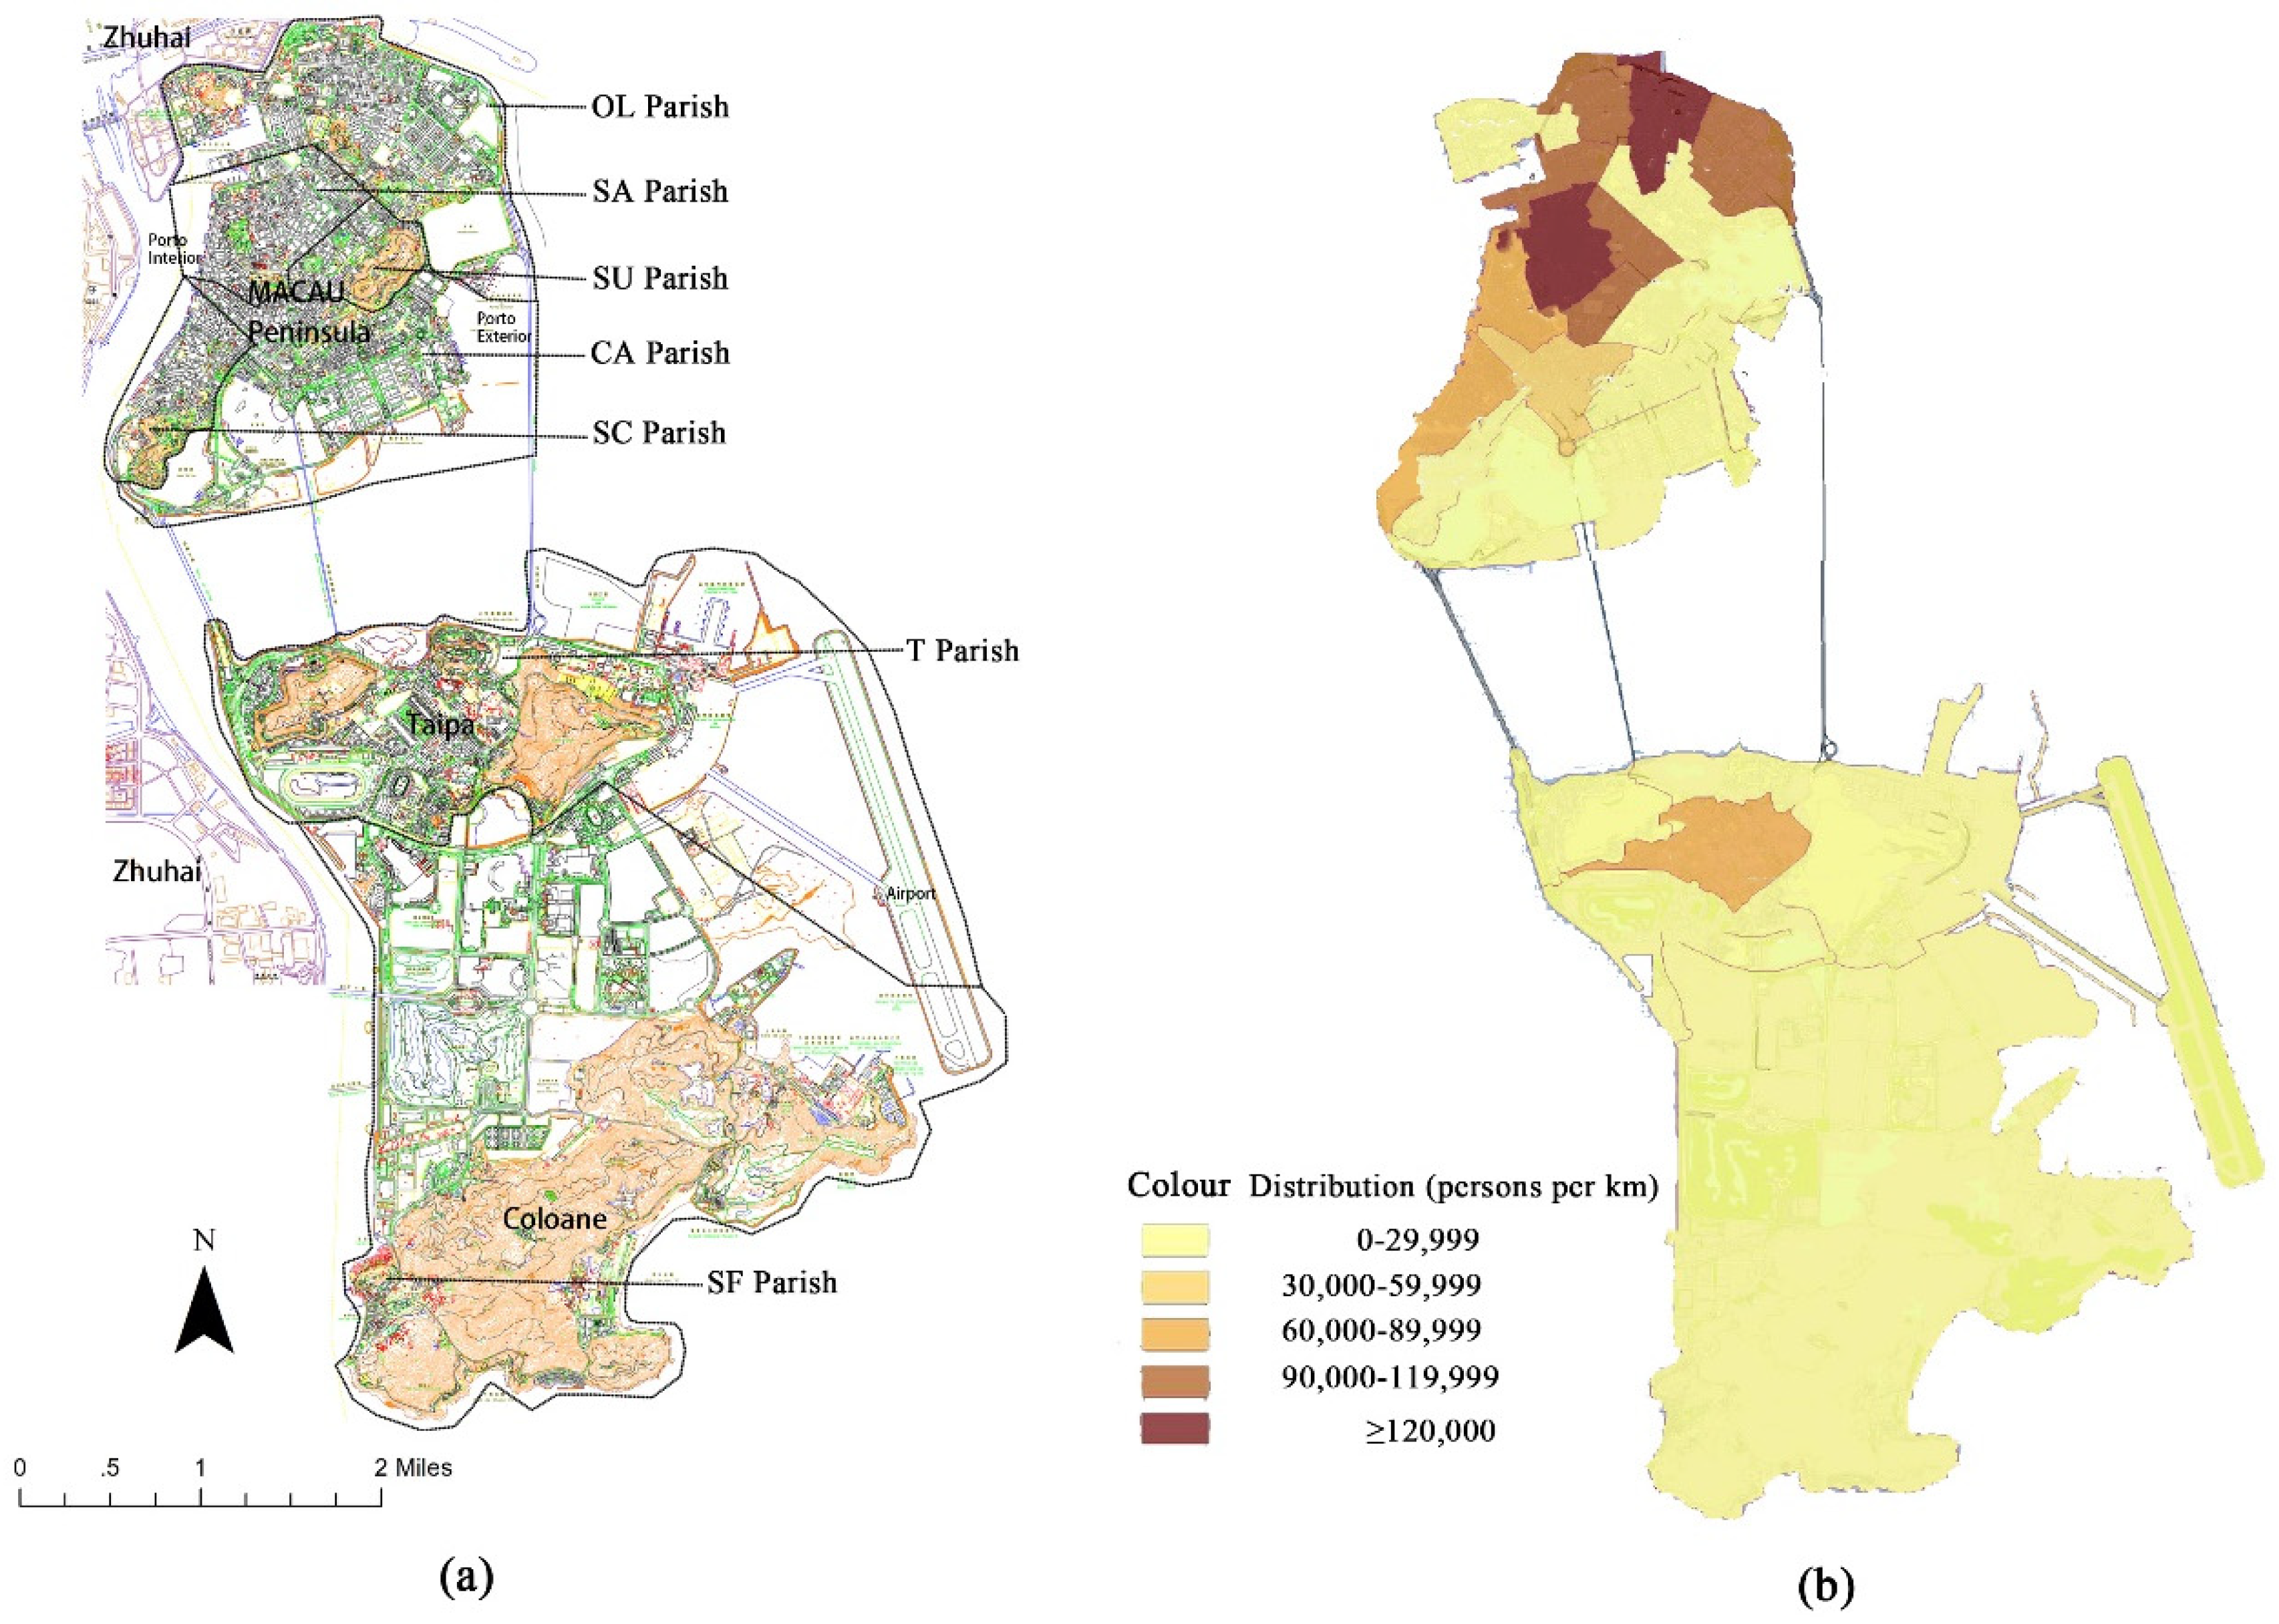
Macau is on the west bank of the PRD region. Its northern border is Zhuhai, Mainland China, and its three other sides are surrounded by the South China Sea (Figure 2). Macau is close to the shallow side of the river, and severe flooding with storm surges tends to occur when local tropical typhoons occur [33].
For several centuries, Macau has been a historical city in which Chinese and Portuguese culture co-exist. Macau comprises the Macau Peninsula on the north, and Taipa and Coloane Island on the south. The Macau Peninsula is Macau’s political, economic, and cultural center where the resident population and government are concentrated [34]. The Macau Peninsula occupies 8.5 km2 of Macau’s total 32.8 km2 land [35]. There are 7 main parishes in Macau. Our Lady Fatima (OL) Parish, St. Anthony (SA) Parish, St. Lazarus (SU) Parish, Cathedral (CA) Parish and St. Lawrence (SC) Parish are located in the Macau Peninsula. Taipa (T) Parish and St. Francisco (SF) Parish are located in Taipa and Coloane, respectively (see Figure 2). OL Parish, SA Parish and SC Parish have higher population densities, and the west parts along the coast in SC Parish and SA Parish have stronger propensities for flooding due to their lower land elevation and closeness to the sea. Eyewitnesses have stated that floods rose from ankle level to chest-high in less than 20 min during Typhoon Hato in 2017 [36].
2.2. Simulations of the Spatial Scope of Urban Flooding
Simulations were performed using GIS with a high-precision digital elevation model (DEM) of Macau (with 3 × 3 m cell resolution) and geographical information data including buildings and the roads network obtained from the Macau Cartographic and Topographical Bureau [35]. The simulations were used to estimate the spatial range of floods and the percentage of buildings and the roads affected by five storm surge warning levels (SSW) (Table 1) based on the flood inundation model [37]. According to the geographic features, the historical record of water level and the meteorological characteristics of Macau, storm surge warnings were divided into blue, yellow, orange, red and black by the Macau Weather Service Bureau [33]. Based on the data we obtained, buildings were categorized by type: Residential (RE), commercial (C), office (O), school (S), and hospital (H). The simulation model was operated in GIS and generated a raster map showing land area that could be inundated for the given water level. The neighborhood analysis was also operated in GIS to simulate the floods spreading from the coast onto the connecting land. The flood water levels predicted under different SSW in Table 1 were the model input parameters. The neighborhood operation identified the land area along the flood flow path with DEM values lower than the input water levels. This process was repeated continually within a 3 × 3 raster cells until the full potential inundation land was identified. Therefore, instead of simply supposing all the cells lower than the input parameter were inundated, the model generated the flood inundated area map with a logical connecting flow path [37].
2.3. Comparison of the Impacts of Urban Flooding by Parish
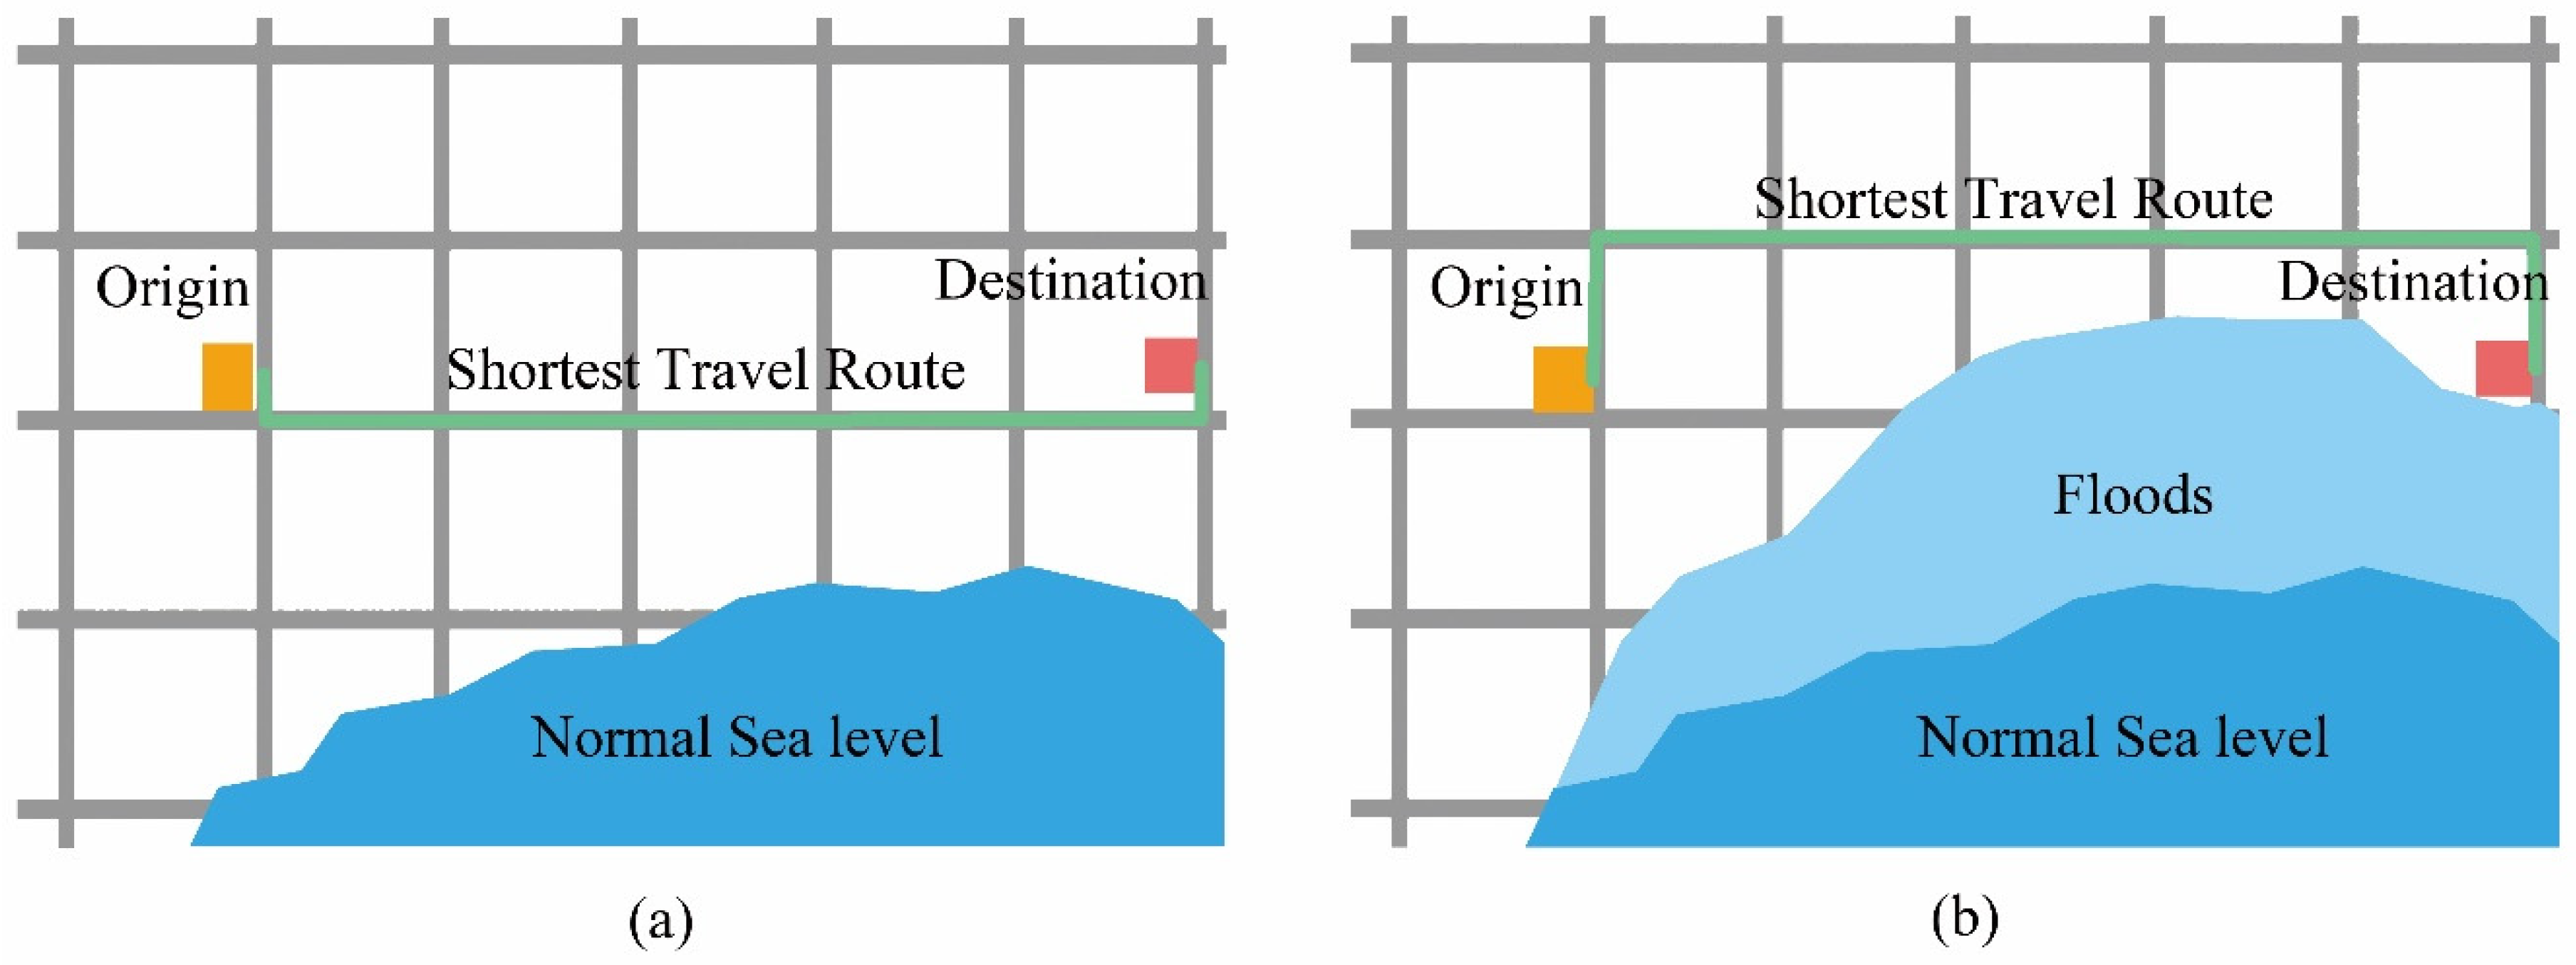
With network analysis in GIS, we could build an origin–destination (OD) cost matrix from multiple origins to multiple destinations [31]. Using Macau’s road network as the base, the network analysis origin–destination matrix was built to compute the residents’ shortest travel distances from home (origins) to their common destinations (destinations) under normal conditions and during flood events using Equations (1) and (2), respectively. The flood inundation land simulated above was input as the restriction polygon barrier in the GIS network analysis that prohibits travel anywhere the polygon interacts the road network—therefore, people have to travel a longer distance to destinations (Figure 3).
We obtained residential, commercial, office, school and hospital buildings’ patterns and characteristics information from the Macau SAR Cartography and Cadastre Bureau [35]. In Equations (1) and (2), building type is represented by F and the travel distance from a residential origin to a non-residential destination is represented by D. There were seven parishes under observation in this study: CA, OL, SA, SC, SU, T, and SF. Travel under the normal conditions and during flood events are labeled B and A, respectively. The five SSW warning levels re represented by s, and the warning level (blue, yellow, orange, red, and black) re BL, Y, OR, R, and D, respectively. The numbers of residential origins and travel destinations (C, O, S, and H) use m and n, respectively. Based on these symbols, , and .
A comparative analysis and increase percentage (LITDI) were performed evaluating the travel distances under normal conditions () and during flood events () at the five levels of intensity using Equation (3). Equation (4) was used to estimate the individual contributions of floods in each of the seven parishes to the overall network travel distances increase and the scenarios of flood avoidance in each of the seven parishes to alleviate the overall network paralysis during the flooding events. Equation (5) was used to single out the parish to apply prevention with first priority that would most alleviate the overall network paralysis.
Based on the scenarios analysis and forecasting, the parish with the highest priority for the deployment of preventative and adaptation measures was used to build a demonstration proposal based on the hydrological analysis in GIS.
3. Results and Discussion
3.1. Spatial Extent and Percentage Affected by Urban Floods under Different Warning Categories
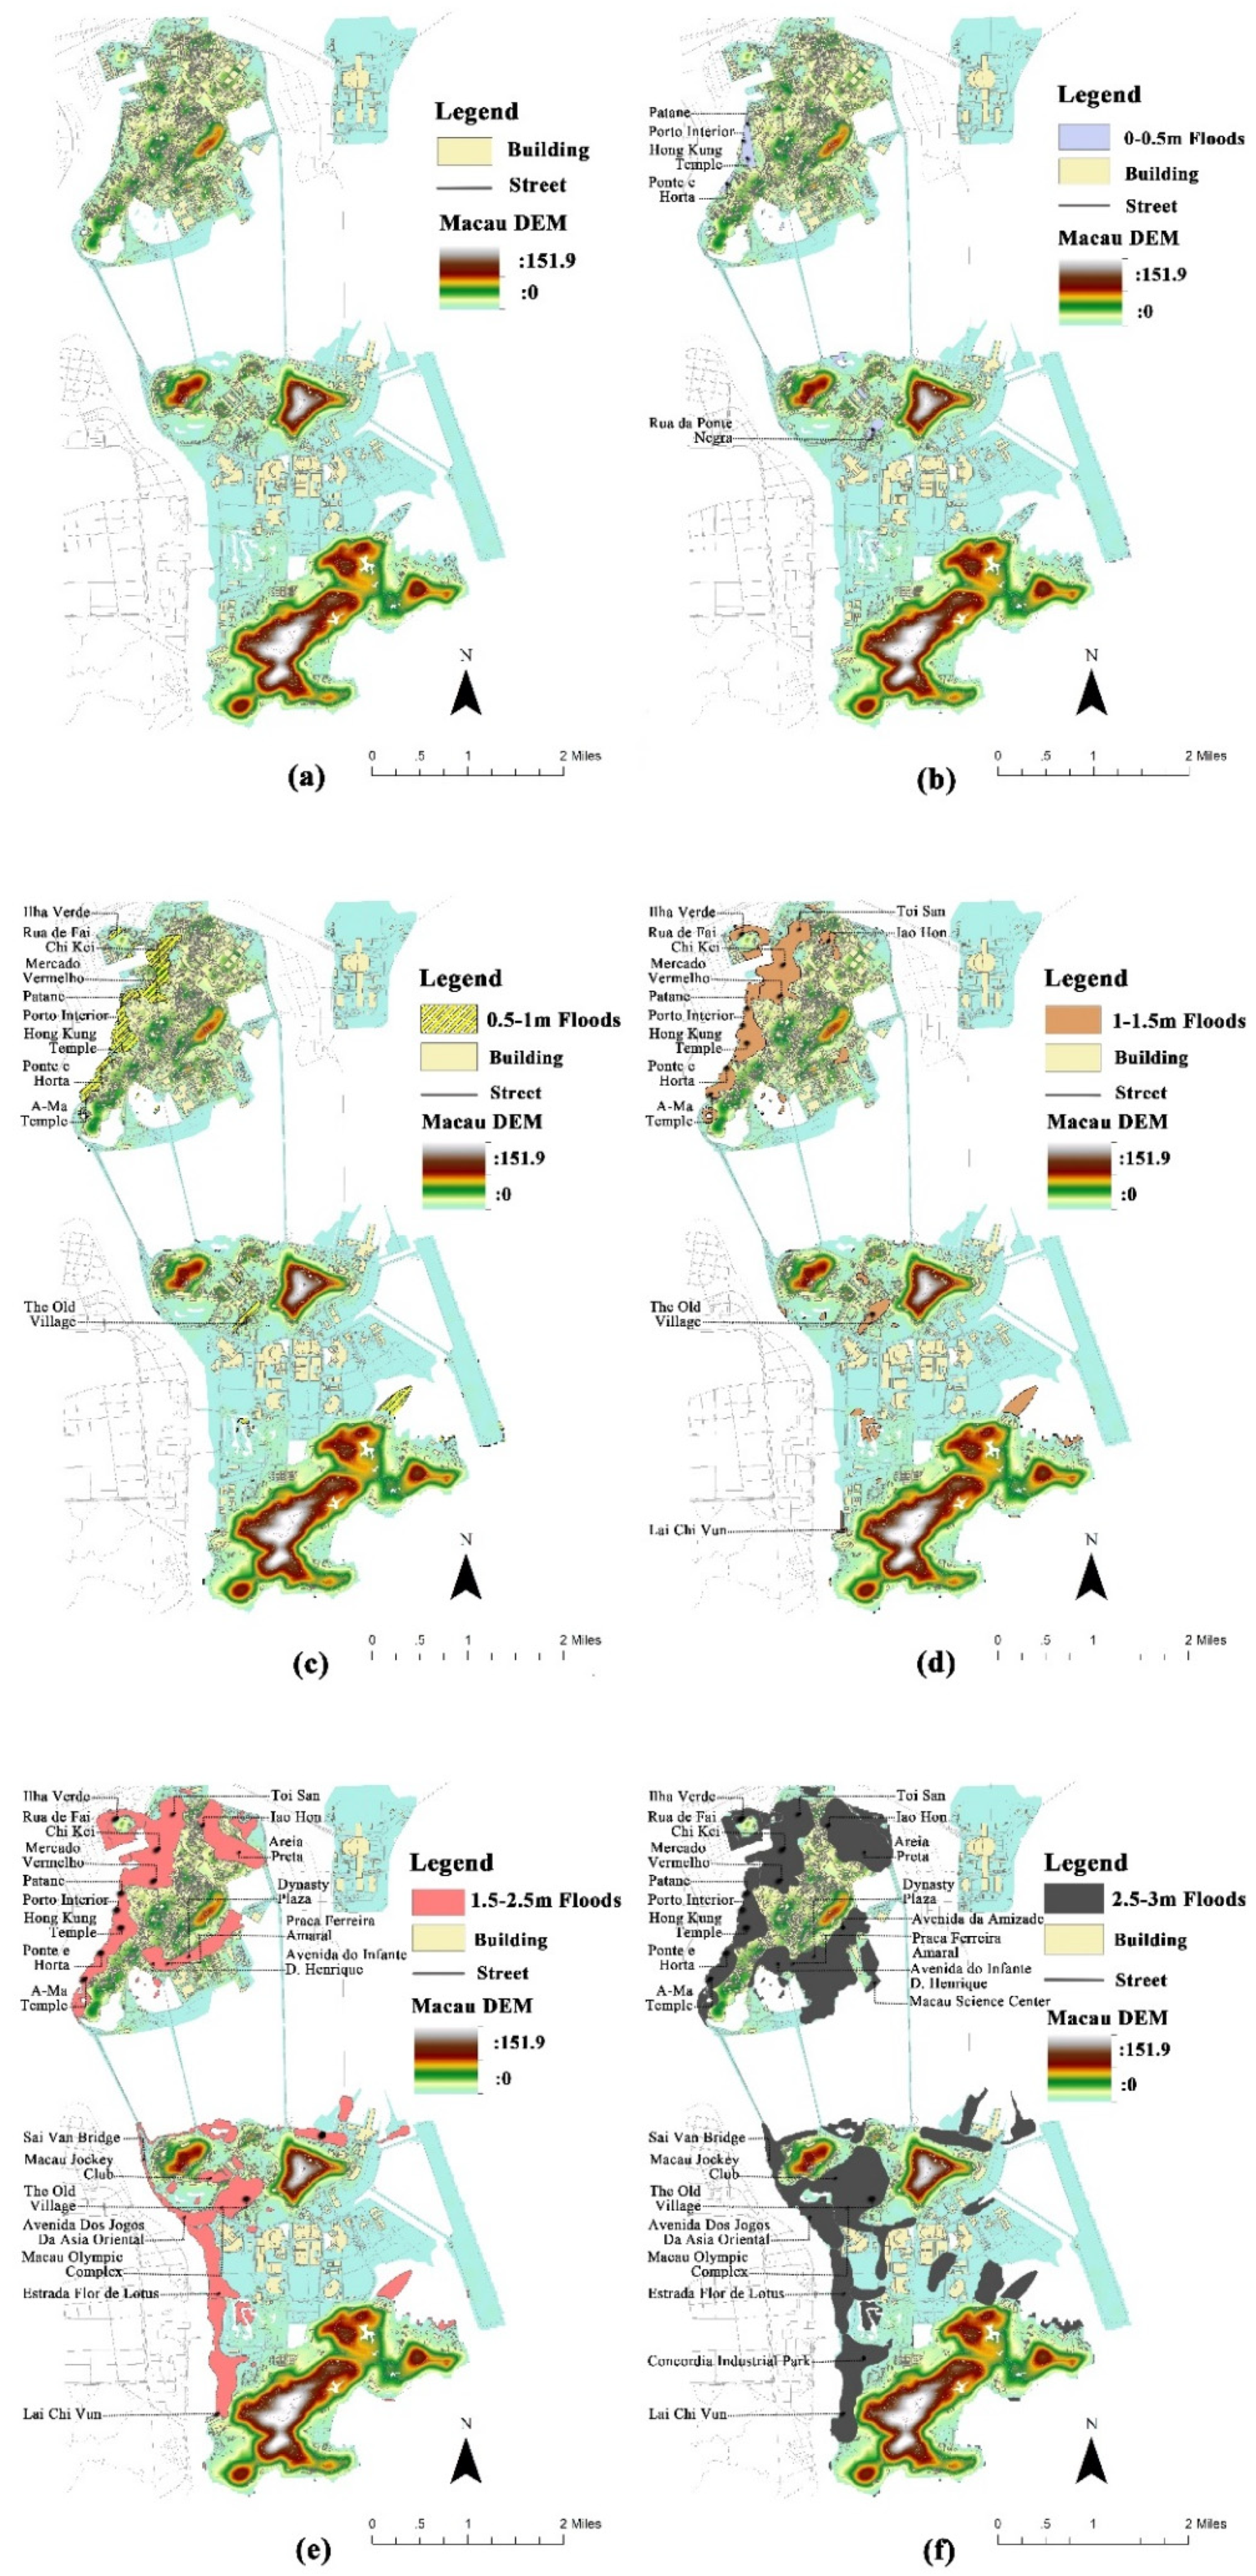
Flooding simulations were performed based on the high-precision digital elevation model (DEM) (Figure 4a) and the hydrological analysis on different storm surge warning categories provided by the Macau Cartography and Cadastre Bureau [35].
Figure 4b shows that the area affected by SSW-1 storm surge flood is on the west part of the Macau Peninsula and in the middle of Taipa. The total area is 315,189.98 m2 (0.315 km2), which accounts for 0.9% of the total land in Macau. The affected areas simulated under SSW-2 storm surge flood would cover 1,076,183.78 m2 (1.076 km2), which accounts for 3.2% of the total land in Macau (Figure 4c). Areas in addition to these affected by SSW-1 would be in the northern part of the Macau Peninsula. In the event of SSW-3, the size of the affected area would increase to 2,138,833.10 m2 (2.138 km2) (Figure 4d), which accounts for 6.5% of the total land in Macau. The western part of Coloane would be affected in addition to the areas affected by SSW-1 and SSW-2. However, Taipa’s affected areas would not be substantially different from the areas affected by SSW-2. This might be attributed to the new urban drainage system and a higher percentage of green space [38]. Figure 4e shows that the areas affected by SSW-4 storm surge floods are located on the eastern part of the Macau Peninsula and western Taipa in addition to those affected by SSW-1, SSW-2, and SSW-3 events. The total area is 5,307,022.97 m2 (5.307 km2), which accounts for 16.1% of the total land in Macau. Figure 4f shows that the areas affected by SSW-5 storm surge flood are located on the southern part of the Macau Peninsula and on the west of Taipa. The total area is up to 9,560,885.68 m2 (9.561 km2), which accounts for 29.1% of the total land in Macau.
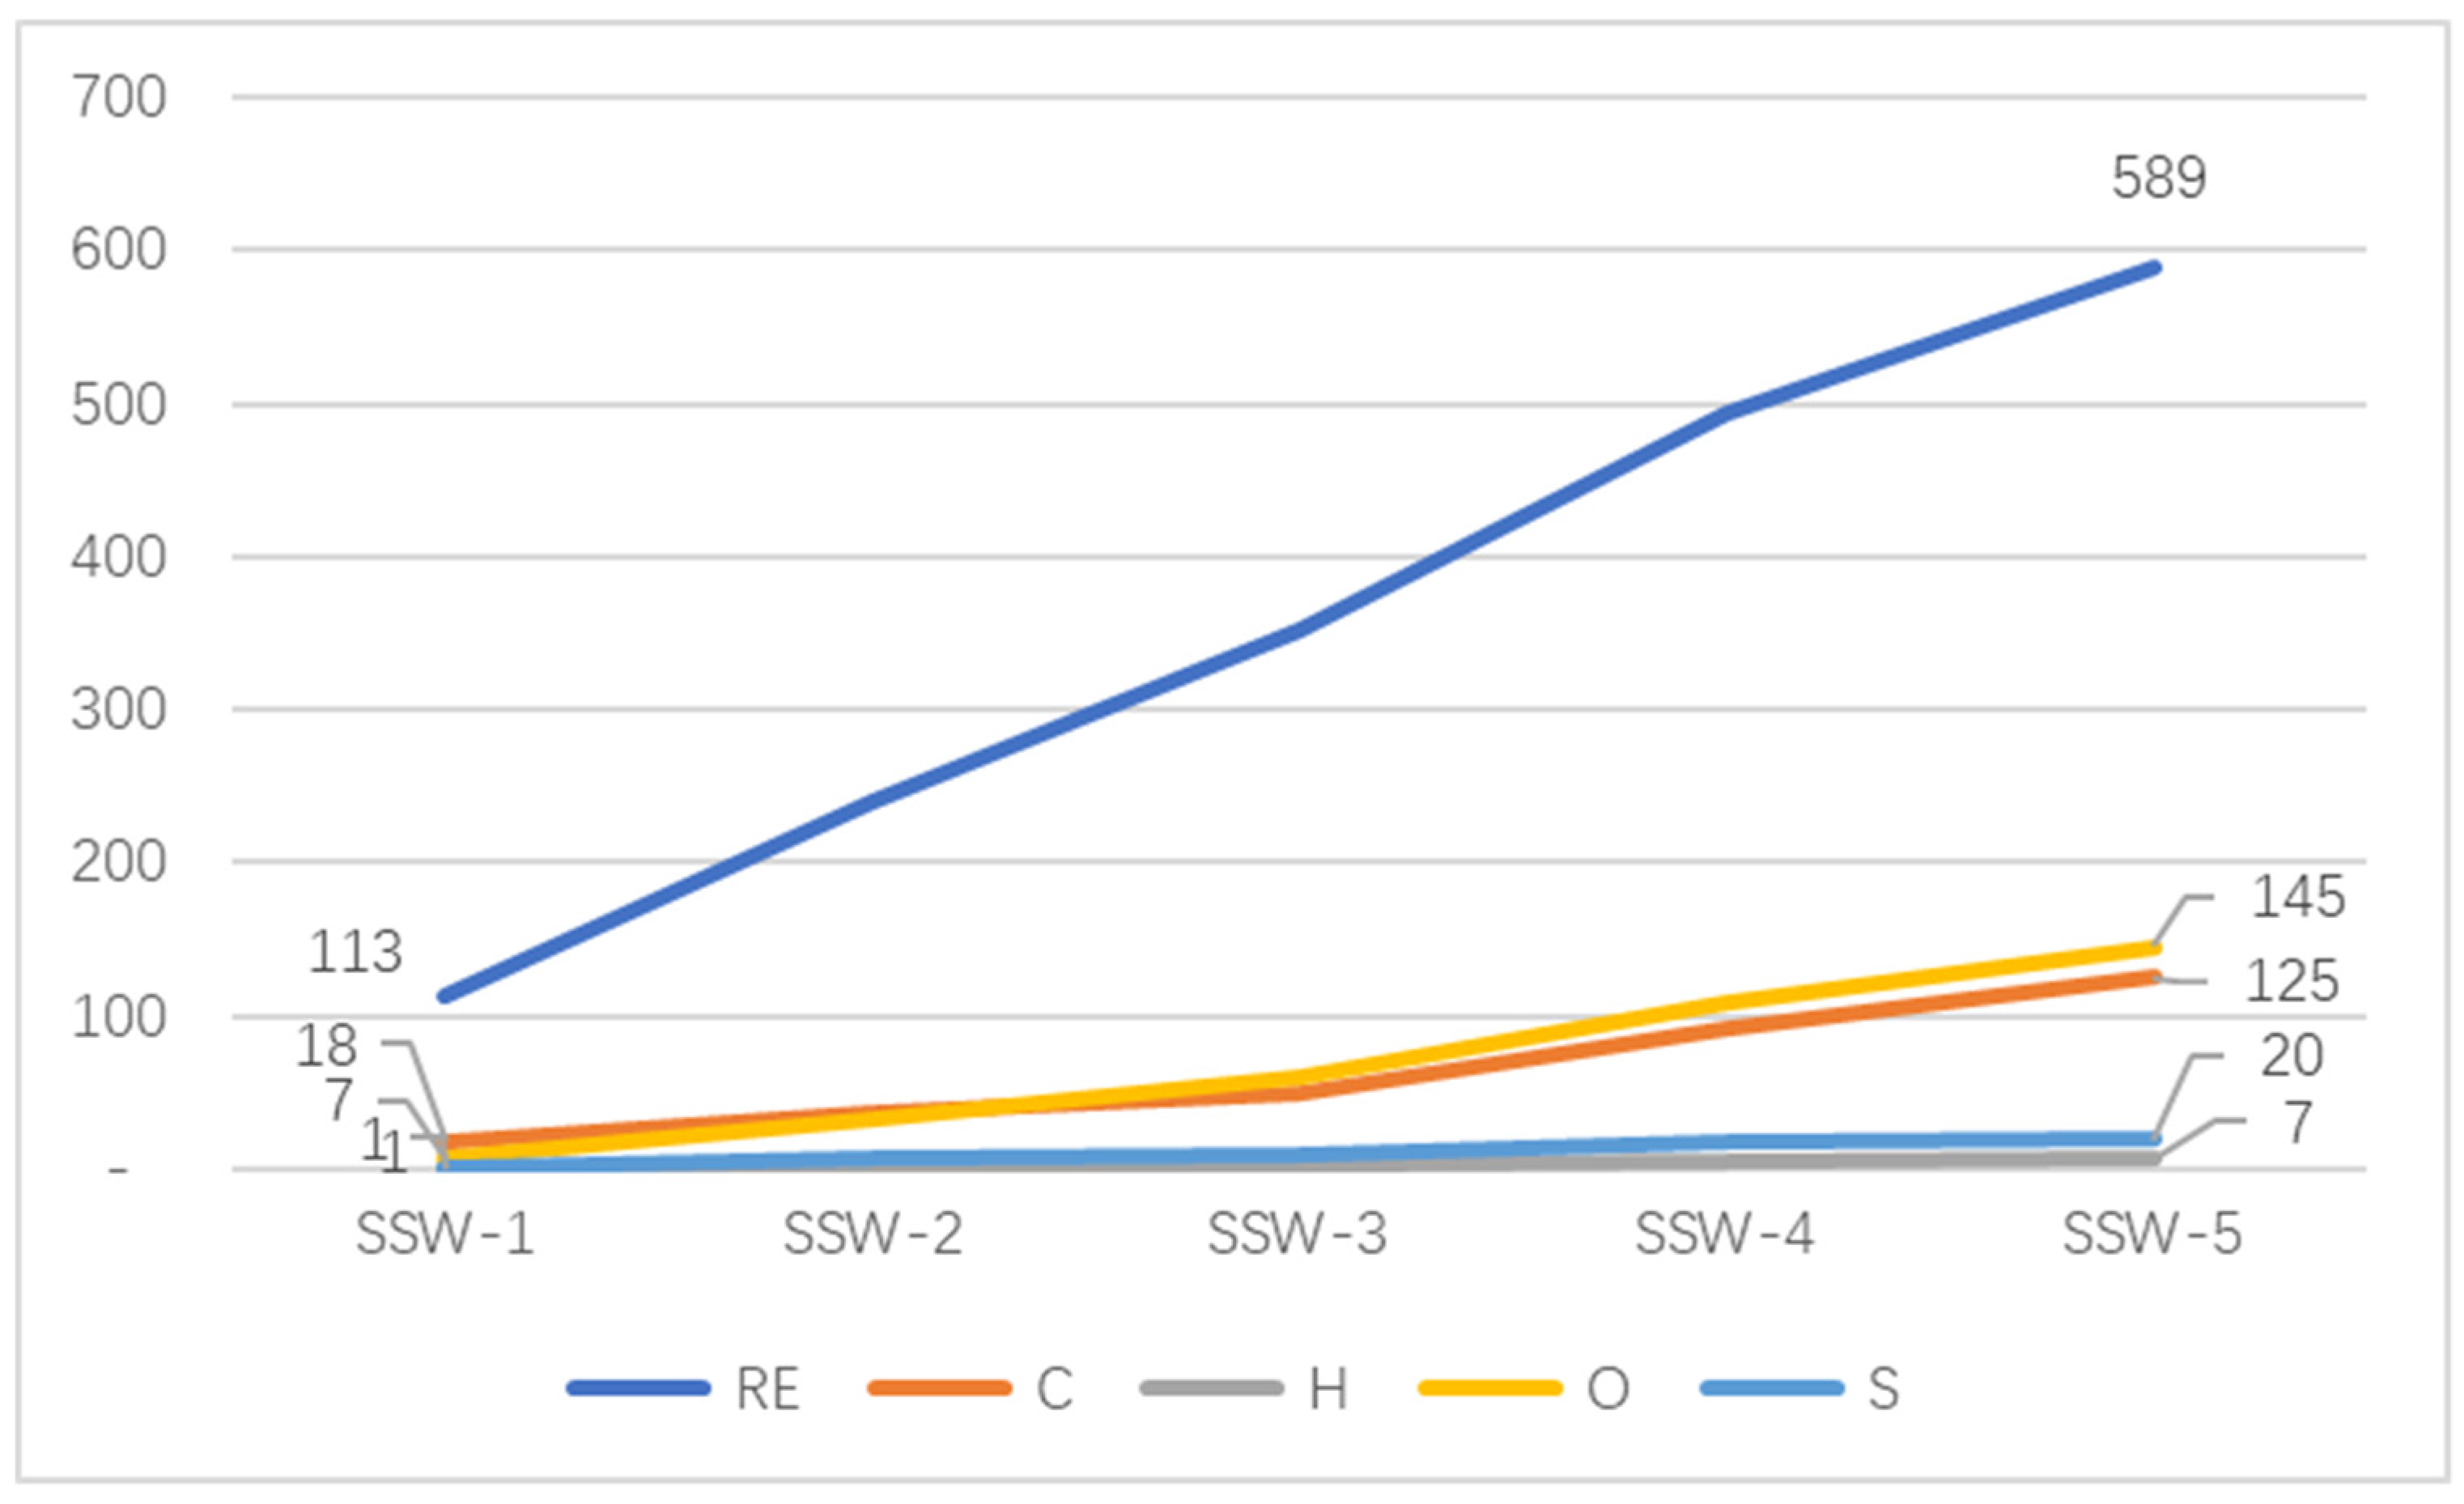
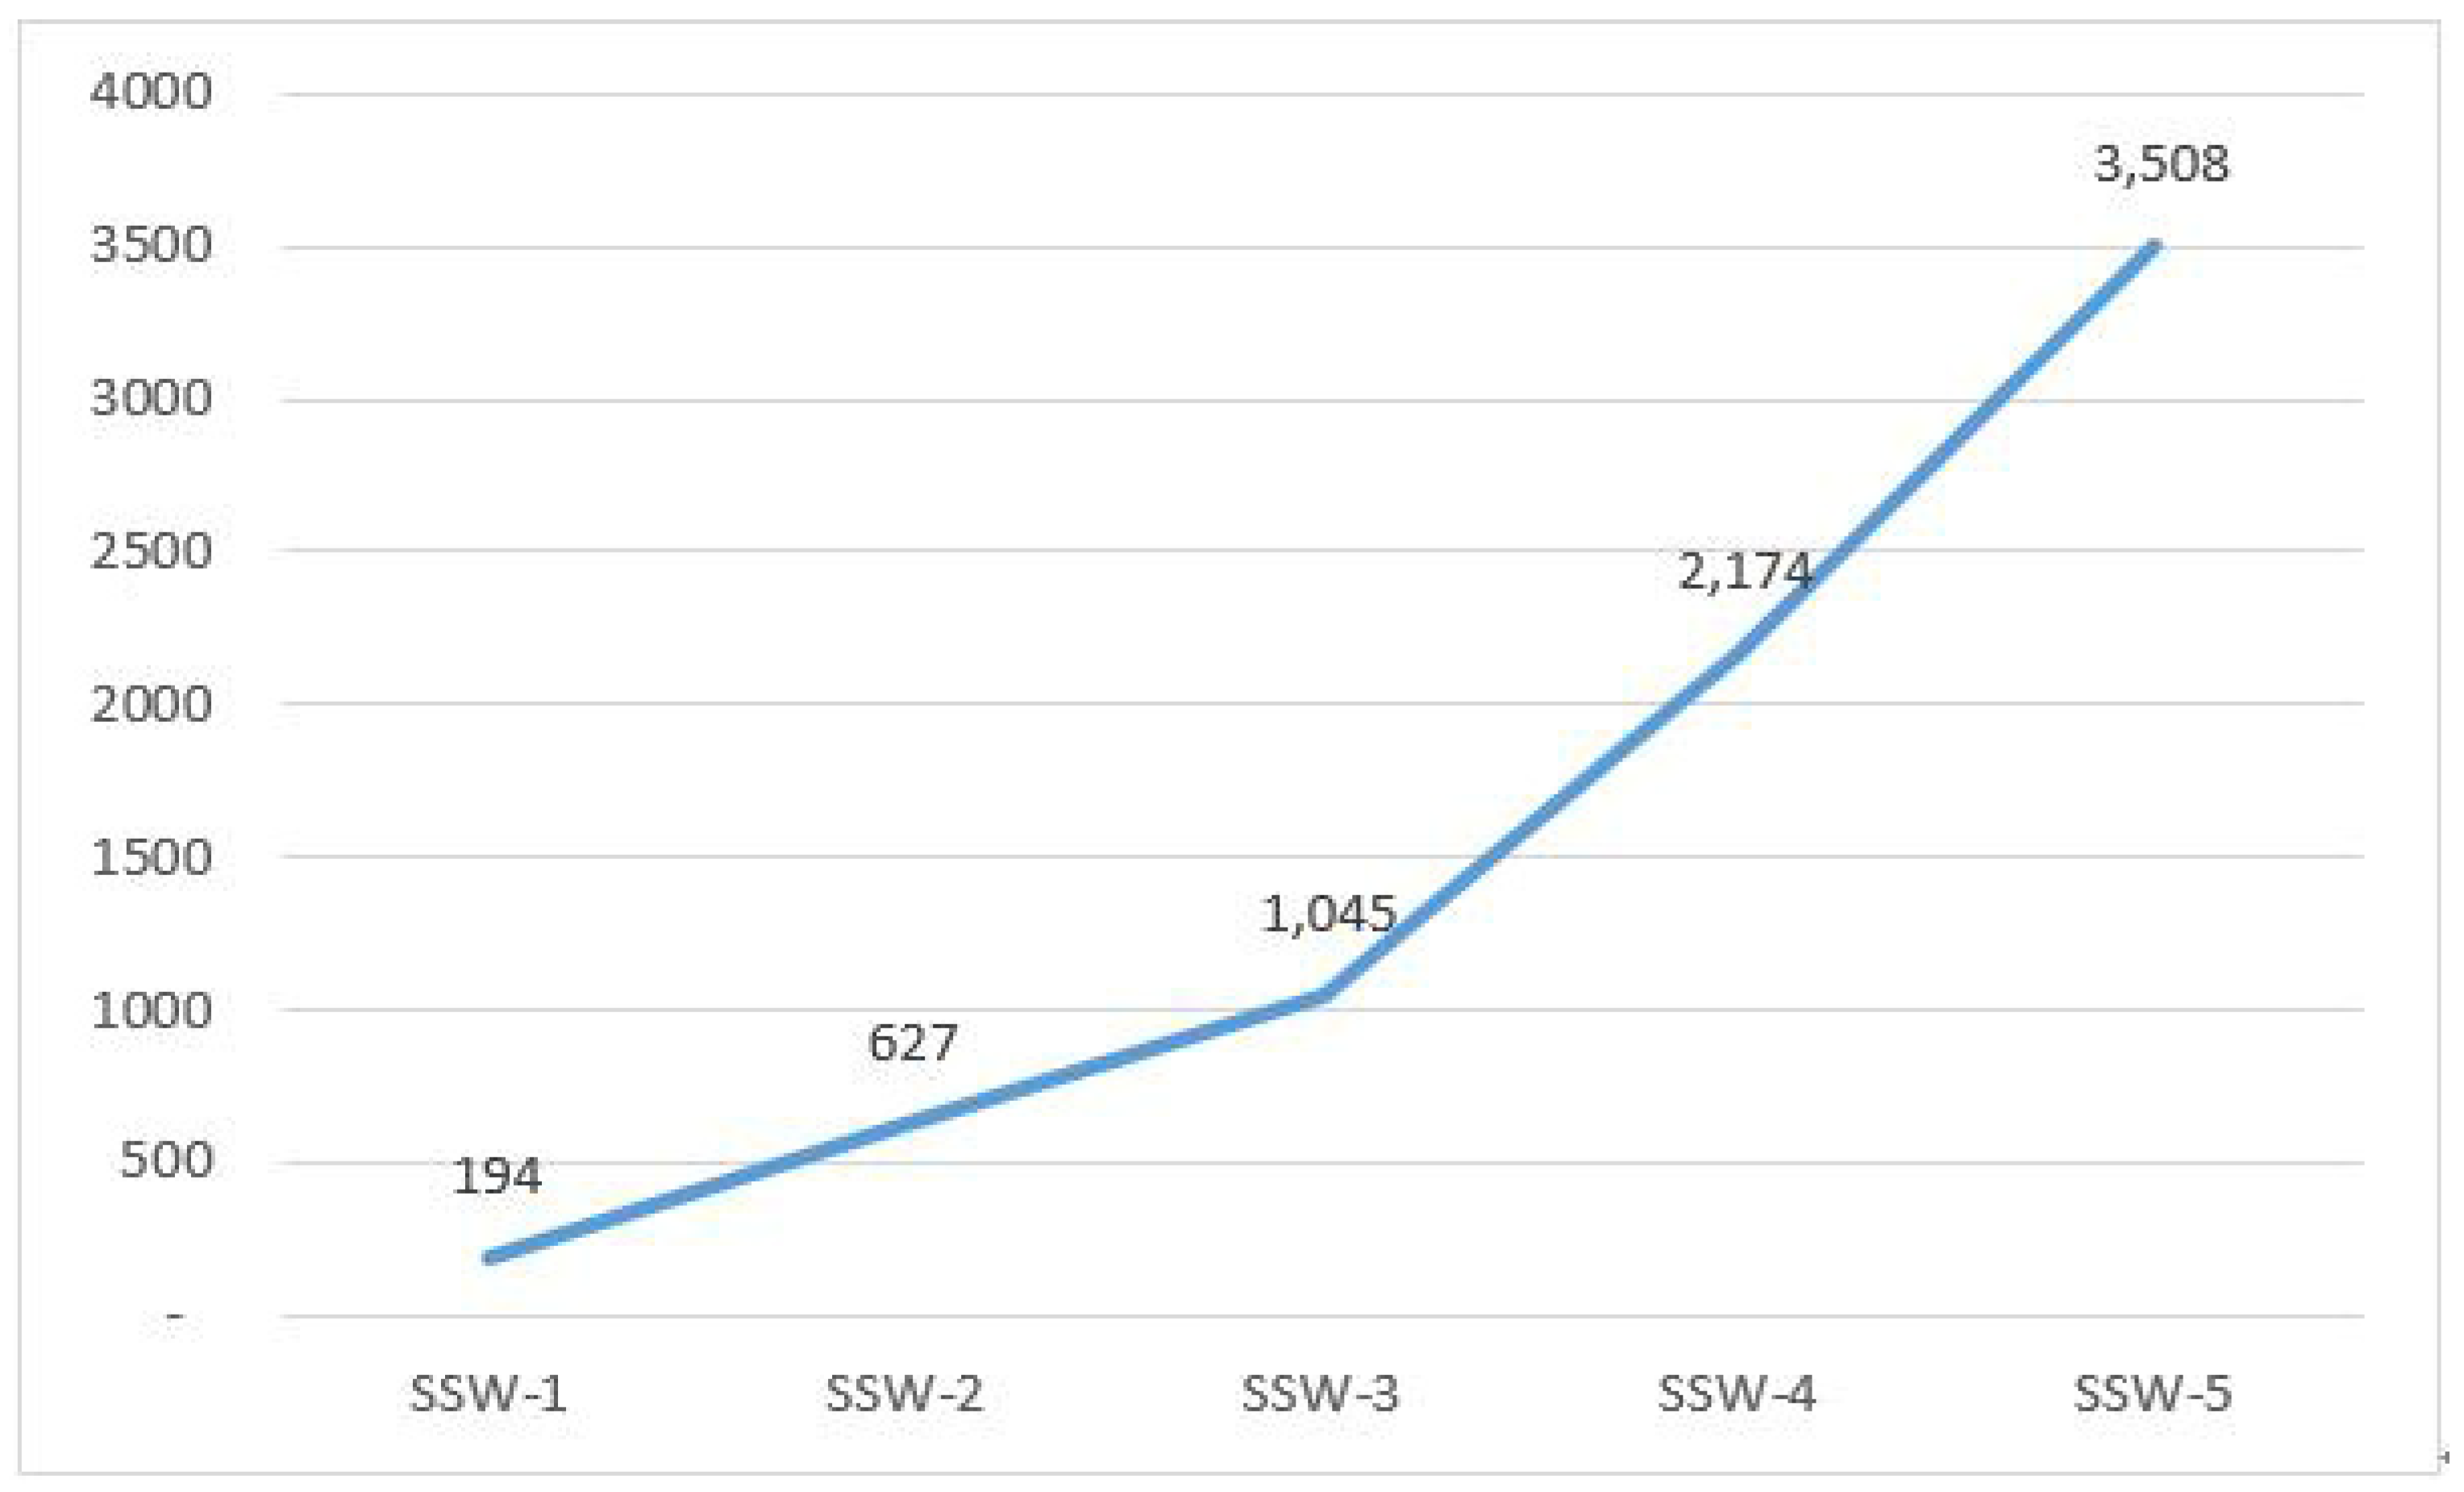
Figure 5 shows the number of buildings located in the areas inundated by flood water under the five SSW levels considered in this study. Overall, the rate of buildings of all types affected by the flood event increased in the same manner than the impact rate of the SSW event. Office buildings were the most affected, increasing from 7 to 145 buildings (from about 3% to about 56% of the total) as the SSW increased in severity from 1 to 5. Commercial buildings were second most affected, increasing from 18 to 125 surrounded by flood water (from about 7% to about 51% of the total). Residential buildings ranked third, increasing from 113 to 589 buildings (from about 8% to 40% of the total). The numbers of affected hospitals and schools were similar, increasing from 1 to 7 (from about 4% to 29% of the total) and from 1 to 20 (from about 1% to 26% of the total), respectively. Figure 6 shows the number of roads located in the areas inundated by flood water, increasing from 194 to 3508 roads with higher rate from SSW 1 to 5 (from about 3% to about 46% of the total), and the increasing rate was higher when the warning levels escalate from 3 to 5.
3.2. Impact of Urban Floods on Residents’ Distance of Travel Analyzed for Each Parish
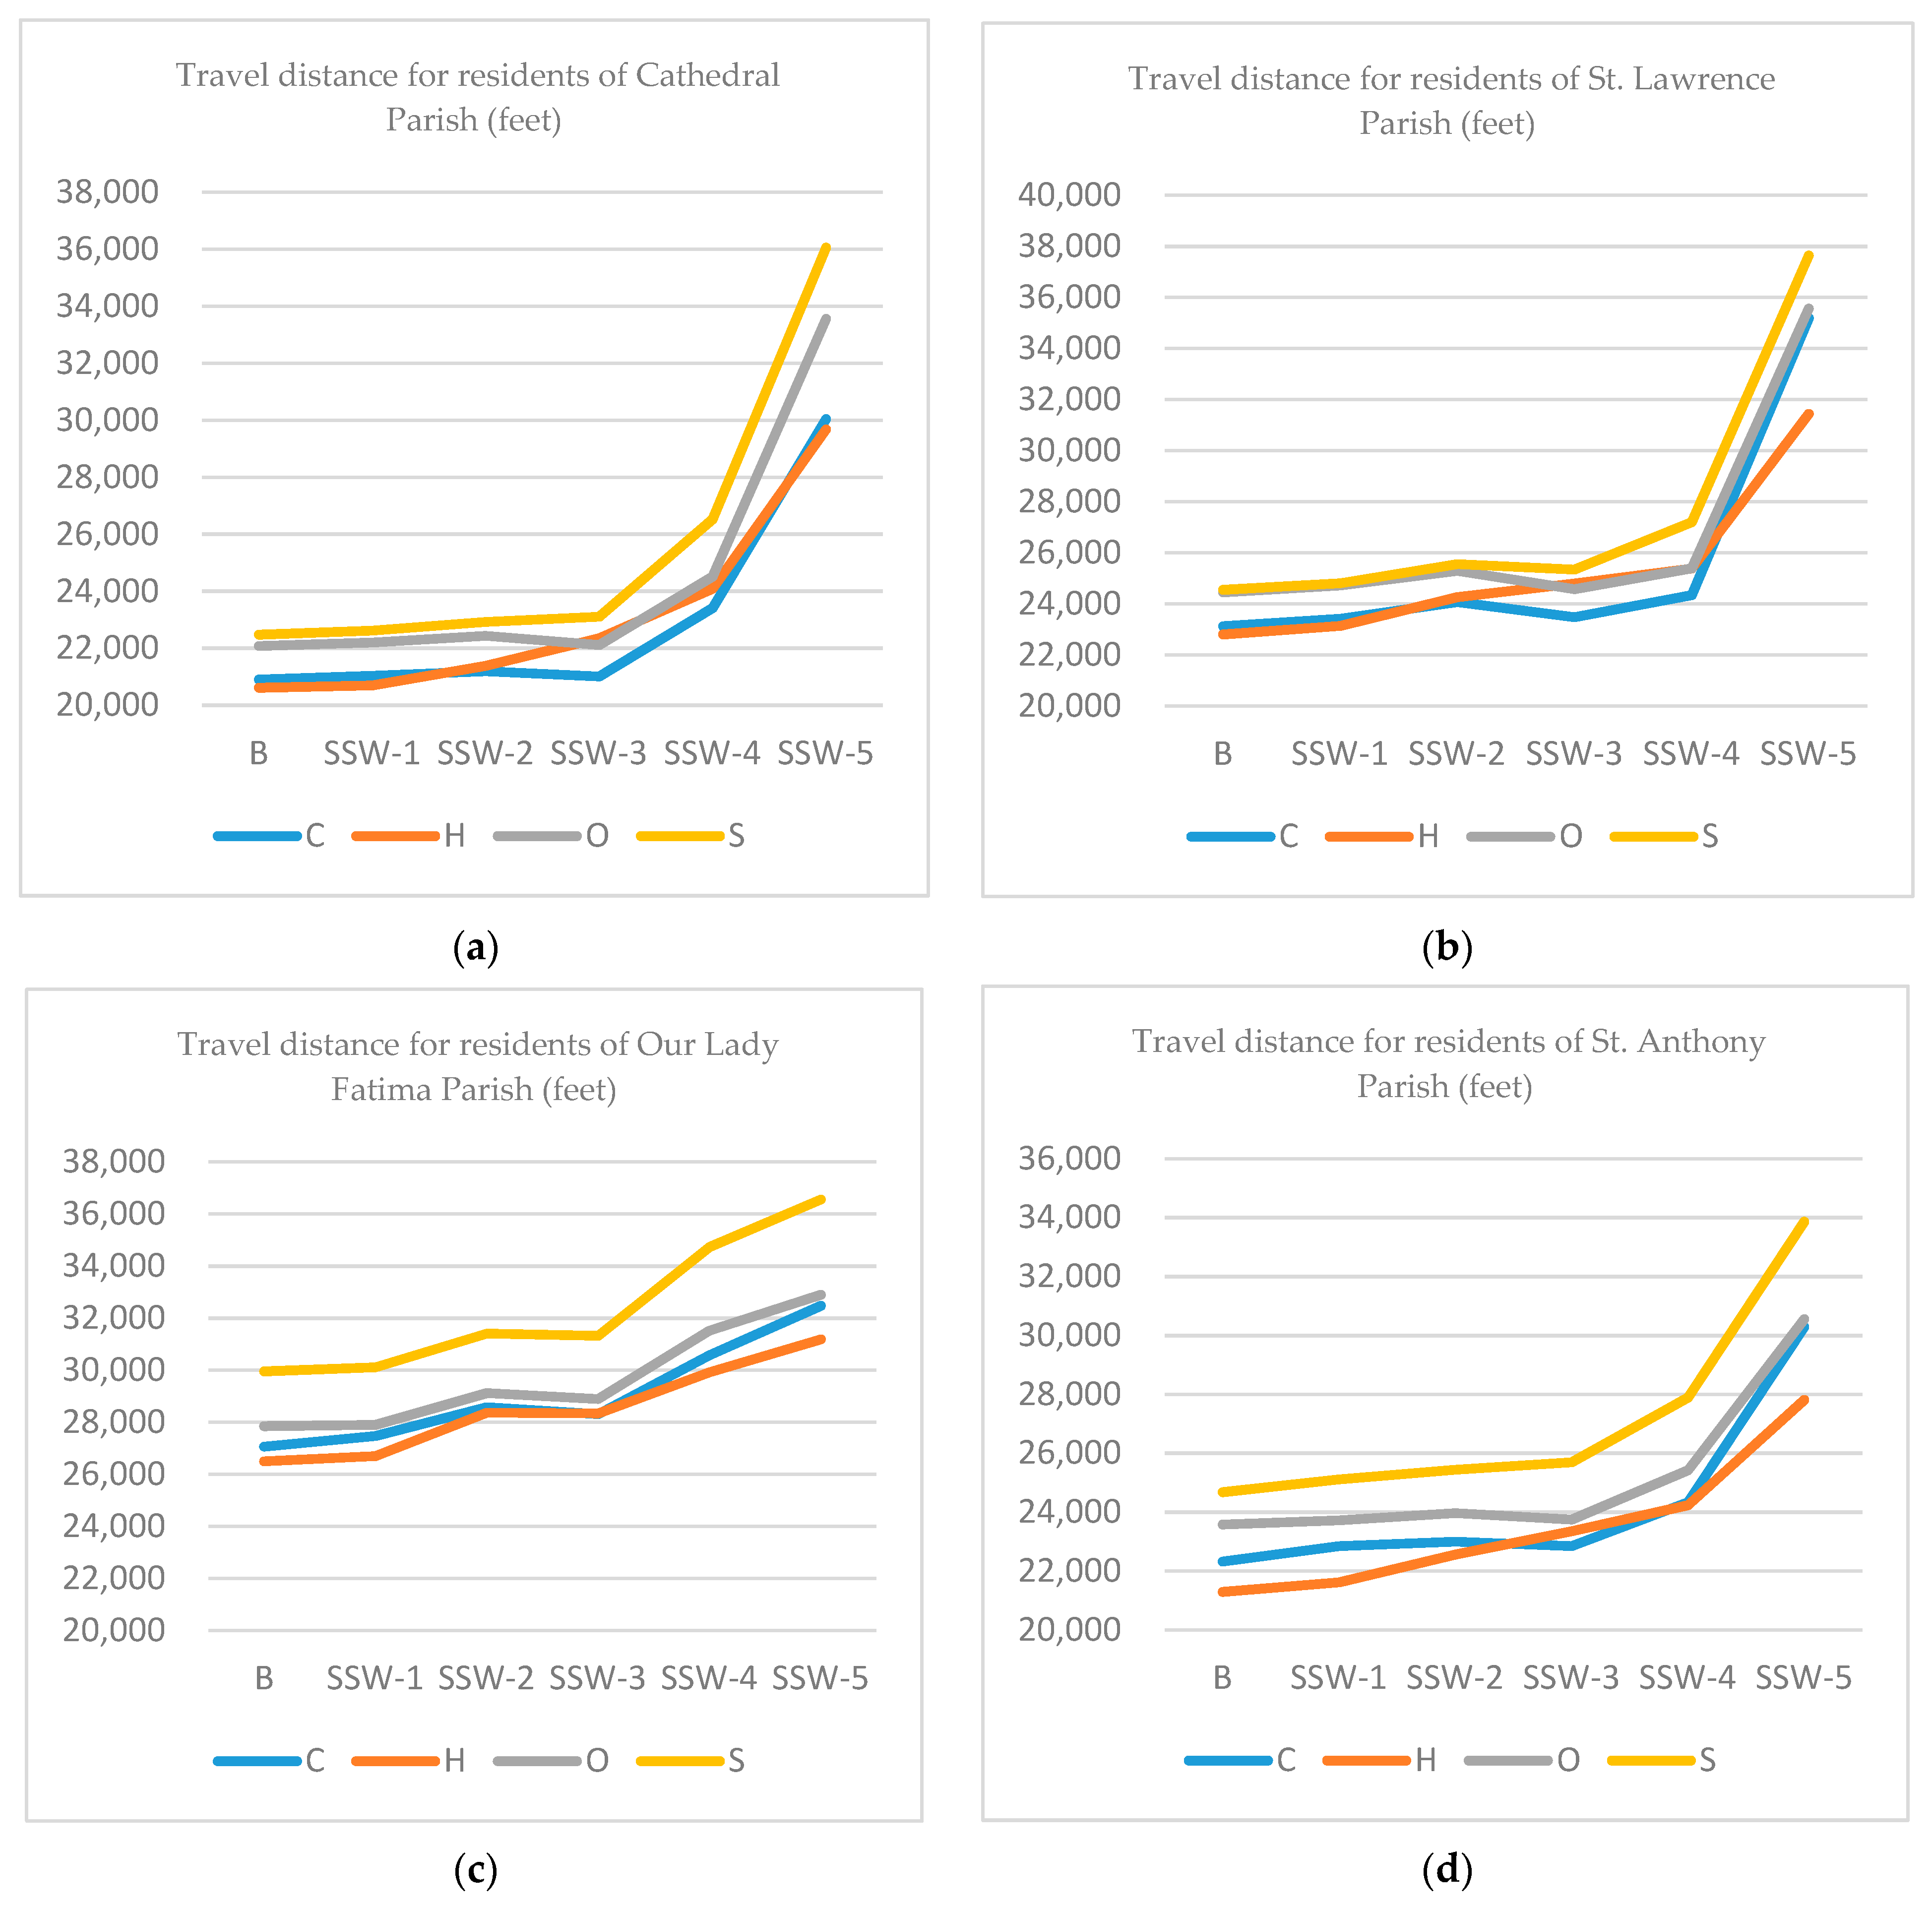
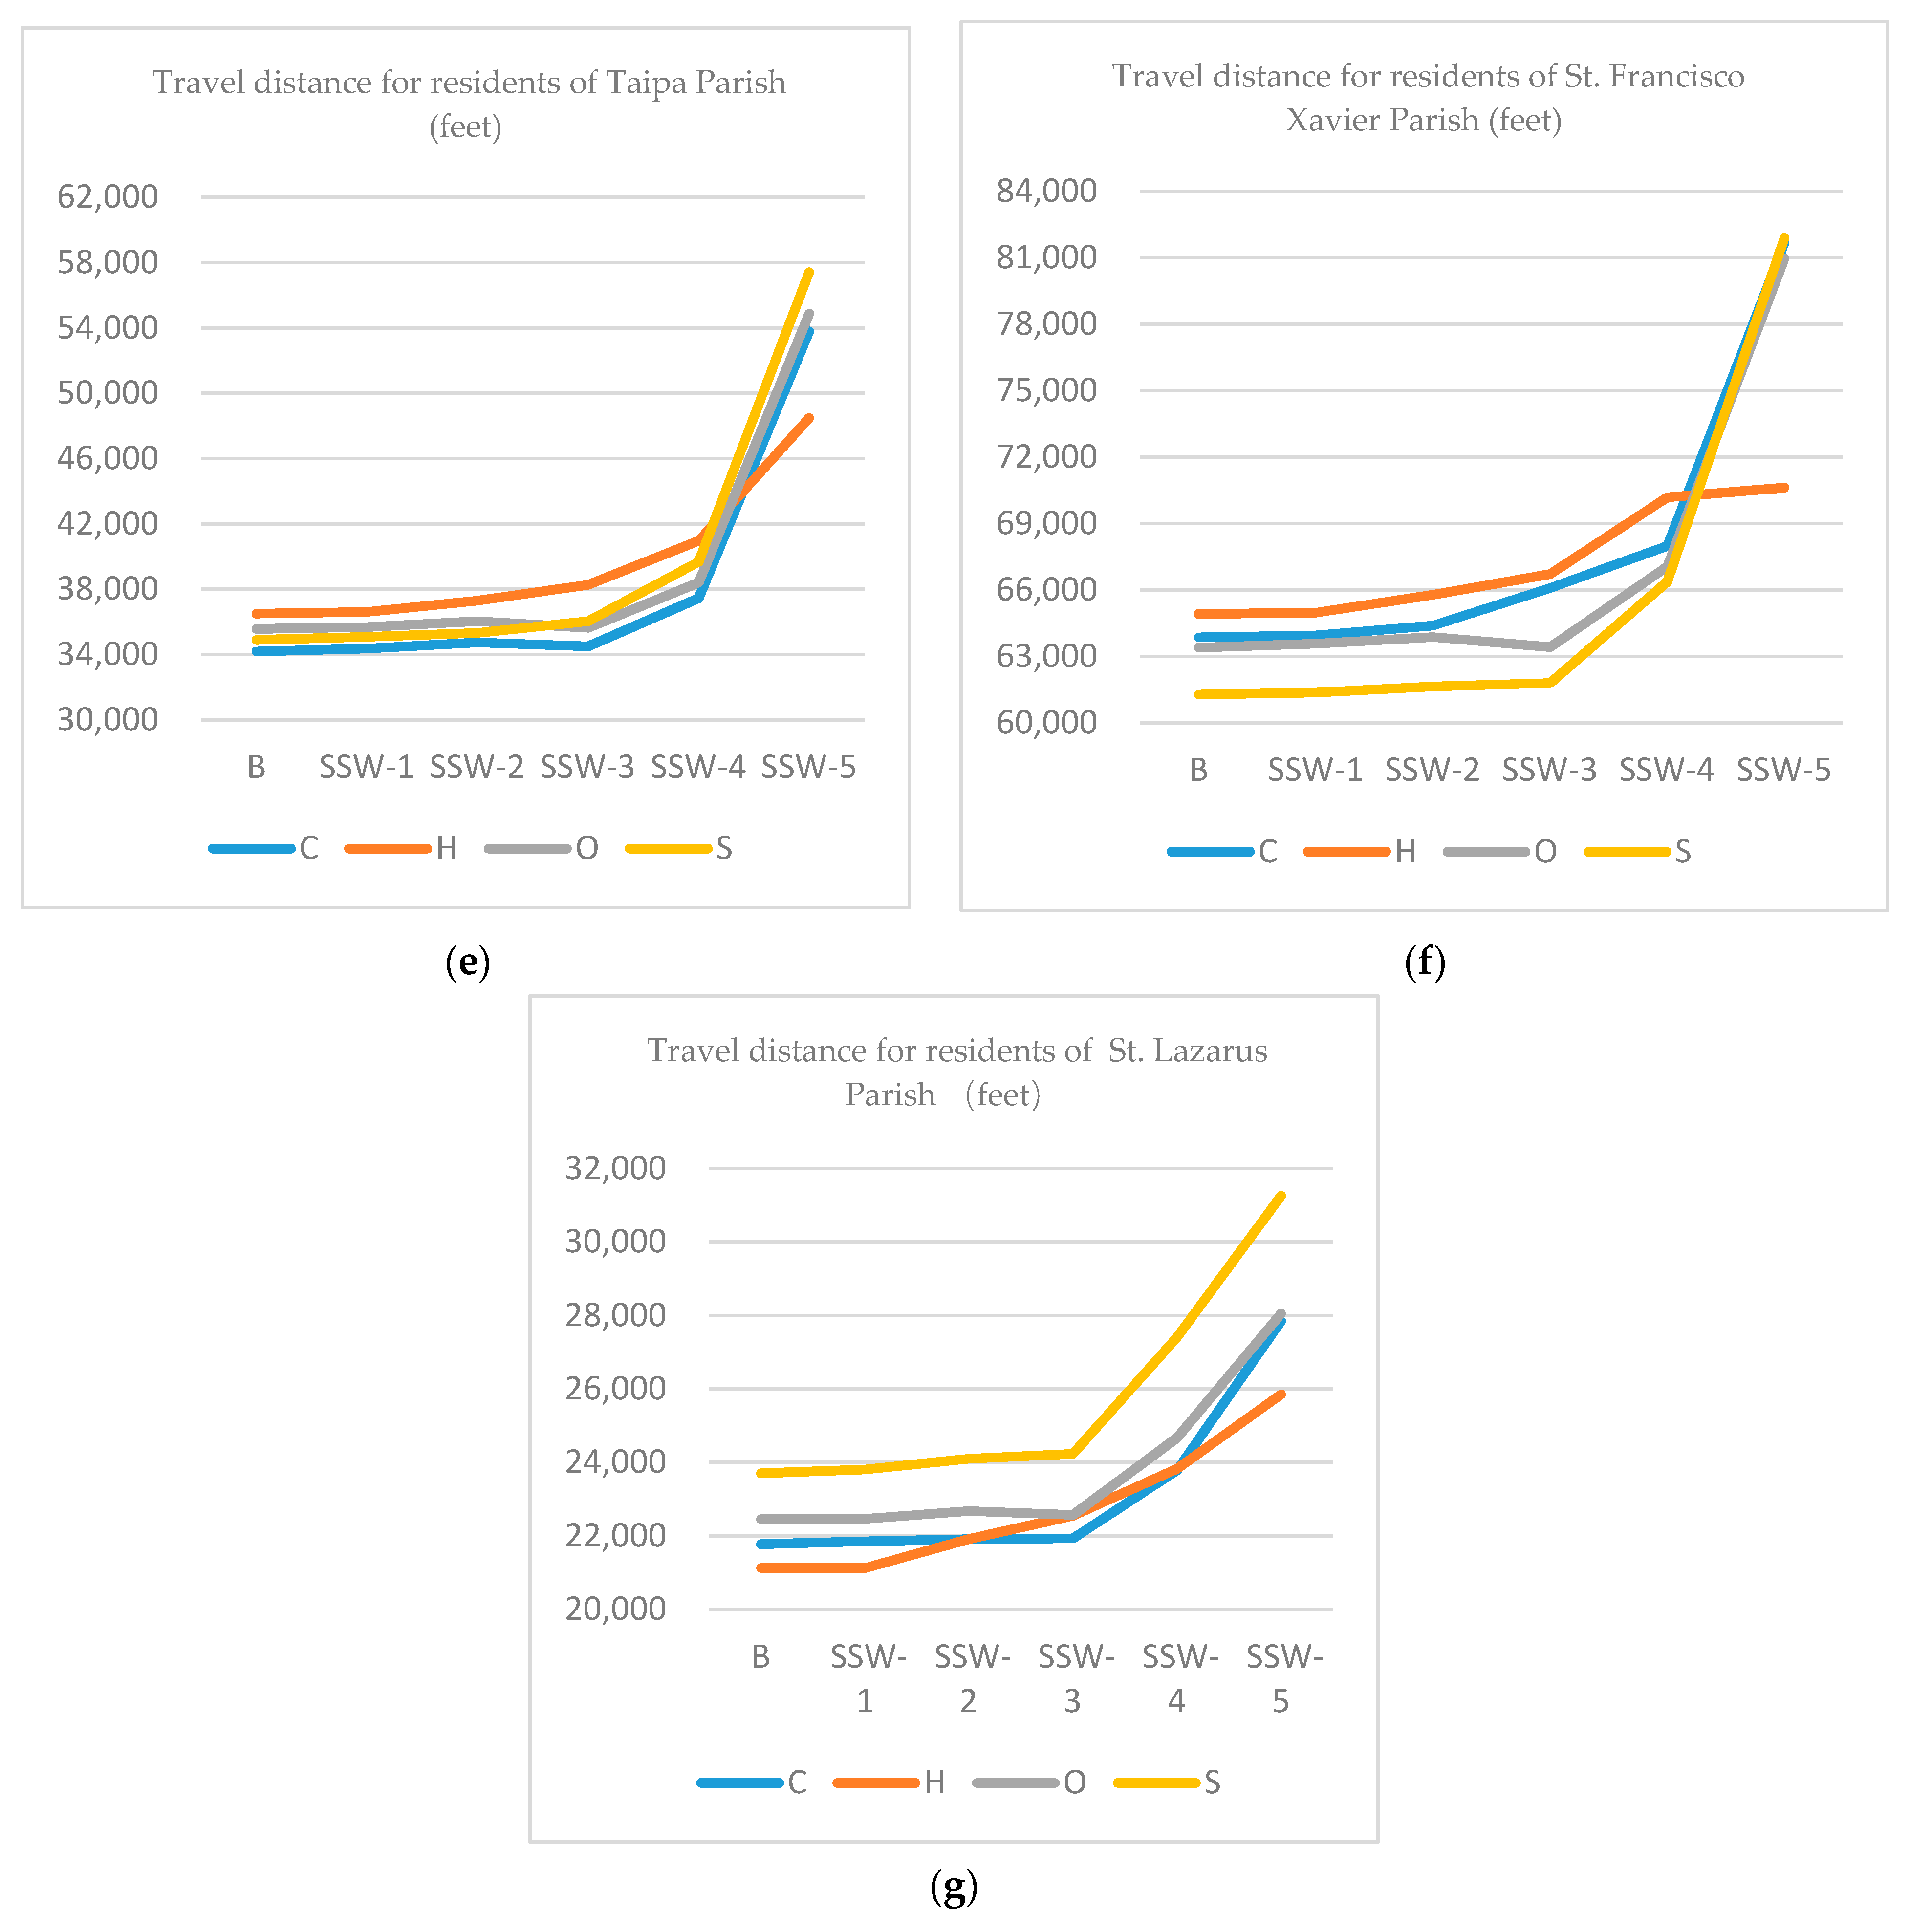
The distance of travel plays an important role in assessing the ease of movement [39,40]. In this study, the simulated total travel distances from residential origins to daily destinations gradually increased as the SSW level rose in each parish (Figure 7a–g and Appendix A). This finding shows that more residents need to detour from their regular route when travelling to their destinations as the situation worsens, which indicates deterioration in the ease of movement.
Travel distances for the residents in Cathedral Parish would be slightly affected under SSW-1, SSW-2, and SSW-3 conditions; however, starting at SSW-4, travel distances to schools and offices would be particularly affected (Figure 7a). This might be attributed to the fact that the elevation of Cathedral Parish is high, but large sections are occupied by streets and parking lots with low or no permeability, and streets can easily become flooded and impassable, which restricts residents’ ability to travel [40].
In St. Lawrence Parish, all types of travel would be affected whenever storm surges occur (Figure 7b). The travel distance would increase steadily with the flood level. Travelling to commercial buildings and schools would be more affected, probably because of the lack of commercial destinations and schools in St. Lawrence Parish and its poor road network connectivity to other parishes [41].
Residents of Our Lady Fatima Parish face similar travel problems across the SSW levels (Figure 7c). Travel distances would gradually increase as flooding worsened, particularly to commercial and school destinations. This finding might be related to the parish’s relatively higher population density and construction density compared to the other parishes [42,43]. Consequently, storm water rapidly accumulates, and flooding immediately follows [44]. If storm surges escalate, water easily inundates this parish and impedes residents’ travel.
Flooding in St. Anthony Parish would not seriously affect the daily travel route of its residents with floods levels between SSW-1 and SSW-3 (Figure 7d). However, at SSW-4 or higher, flooding would seriously interfere with travel, particularly the travel to school destinations. St. Anthony is almost as densely populated as Our Lady Fatima [38]. During the twentieth century, Chinese merchants wanted to improve land-use efficiency to stimulate socioeconomic developments. This led to an overwhelming construction of commercial and enclosed buildings at Porto Interior in St. Anthony Parish [45]. During a storm surge at all levels, storm water would rapidly flow towards the relatively low-lying areas (including Patane and the vicinities of Rua de Fai Chi Kei, Mercado Vermelho, and Porto Interior). Flooding and road closures would ensue and interfere with residents’ travel.
The situation in Taipa and St. Francisco Xavier Parishes are similar (Figure 7e,f). In both cases, when the areas are affected by storm surges with levels between SSW-1 and SSW-4, the impacts would not be particularly serious. However, at SSW-5, daily routines would be seriously disrupted. Both parishes are on the outlying islands, and the residents depend on the Macau-Taipa, Amizade, and Sai Van Bridges to connect to the Macau Peninsula. During a storm surge at SSW-5, urban floods impede the travel activities of residents of both parishes to the Macau Peninsula through bridges.
As shown in Figure 7g, buildings and roads in St. Lazarus Parish would be rarely affected by floods, which could be attributed to its mountainous terrain and higher elevation [33]. However, flooding at SSW-4 and SSW-5 would restrict residents’ travel from St. Lazarus Parish to destinations in other parishes. The rapidly increasing travel distance for people living in St. Lazarus Parish indicates that these residents’ travel activities would mostly be restricted by road conditions on the ways to destinations in other parishes.
3.3. Parishes Prioritization to Install Preventative Measures to Alleviate The Impacts of Urban Floods on Daily Travel
Risk prevention measures had to be urgently applied in Macau after Typhoon Hato [9]. The simulation results revealed that all the parishes would be affected by flooding except for St Lazarus Parish (Figure 4). To alleviate the impacts of urban floods, the key task consists of the rational organization of the parishes’ prevention applications in order to maximize efficiency to prevent floods. To that end, this study employed scenario analysis and forecasting, and it assigned ranking scores to the seven parishes based on the extent to which flood avoidance in each parish scenario would alleviate floods’ influence on the city’s overall roads network based on Equation (4). The ranking score ranged from one through six, in which one and six represented the lowest and highest alleviation need of the roads network paralysis (travel distance), respectively. The parish with the higher cumulative score would be more in more urgent need of flood prevention measures and vice versa. The assessment result is shown in Table 2.
The results show the extent in each scenario to alleviate roads network paralysis, from most to least: CA (155), T (126), SF (102), SA (83), SC (68), and OL (54). Therefore, Cathedral Parish was identified as the area with the highest need for the deployment of prevention and adaptation measures to alleviate the impacts of floods. This indicates that, contrary to the results discussed in other studies [46,47], the more densely populated area is not necessarily the one requiring the more urgent deployment of prevention measures. It also demonstrates that traffic analysis is an important factor to consider for the identification of the key area requiring disaster prevention.
3.4. Floods Prevention and Adaption Plan Demonstration
The low impact development (LID) approach is highly recommended in published studies and reports as an effective set of techniques for the prevention and control of urban floods [48,49]. LID includes sunken green spaces, vegetation ditches, storm water wetlands, and permeable pavement. [50]. Based on results of the hydrological analysis, the scenario forecasting analysis, and the field examination in Macau, this study proposes an LID plan for CA Parish as a way to combat the impact of floods.
In Cathedral Parish, the land surfaces are mostly hard pavement, structural rooftops and green parks (Figure 8). Generally, there is a clear difference in development between the newer and older urban districts in Macau [35]. In Cathedral Parish, the older urban district is in the northwestern region, and the new urban district is along the water on the south. The development and building densities are high, resulting in high proportions of impervious pavement and rooftops. In this context, residential, office, and commercial blocks need to reduce storm water discharge by implementing flood prevention measures.
A hydrological analysis was performed in GIS, and the source, channels, and endpoints of the surface runoff in Cathedral Parish were identified for the application of LID techniques. The LID demonstration plan proposed is shown in Figure 9 and Figure 10. Section 3.4.1 and Section 3.4.2 describe the proposals at the points of storm water generations and along the flow channels with details, respectively.
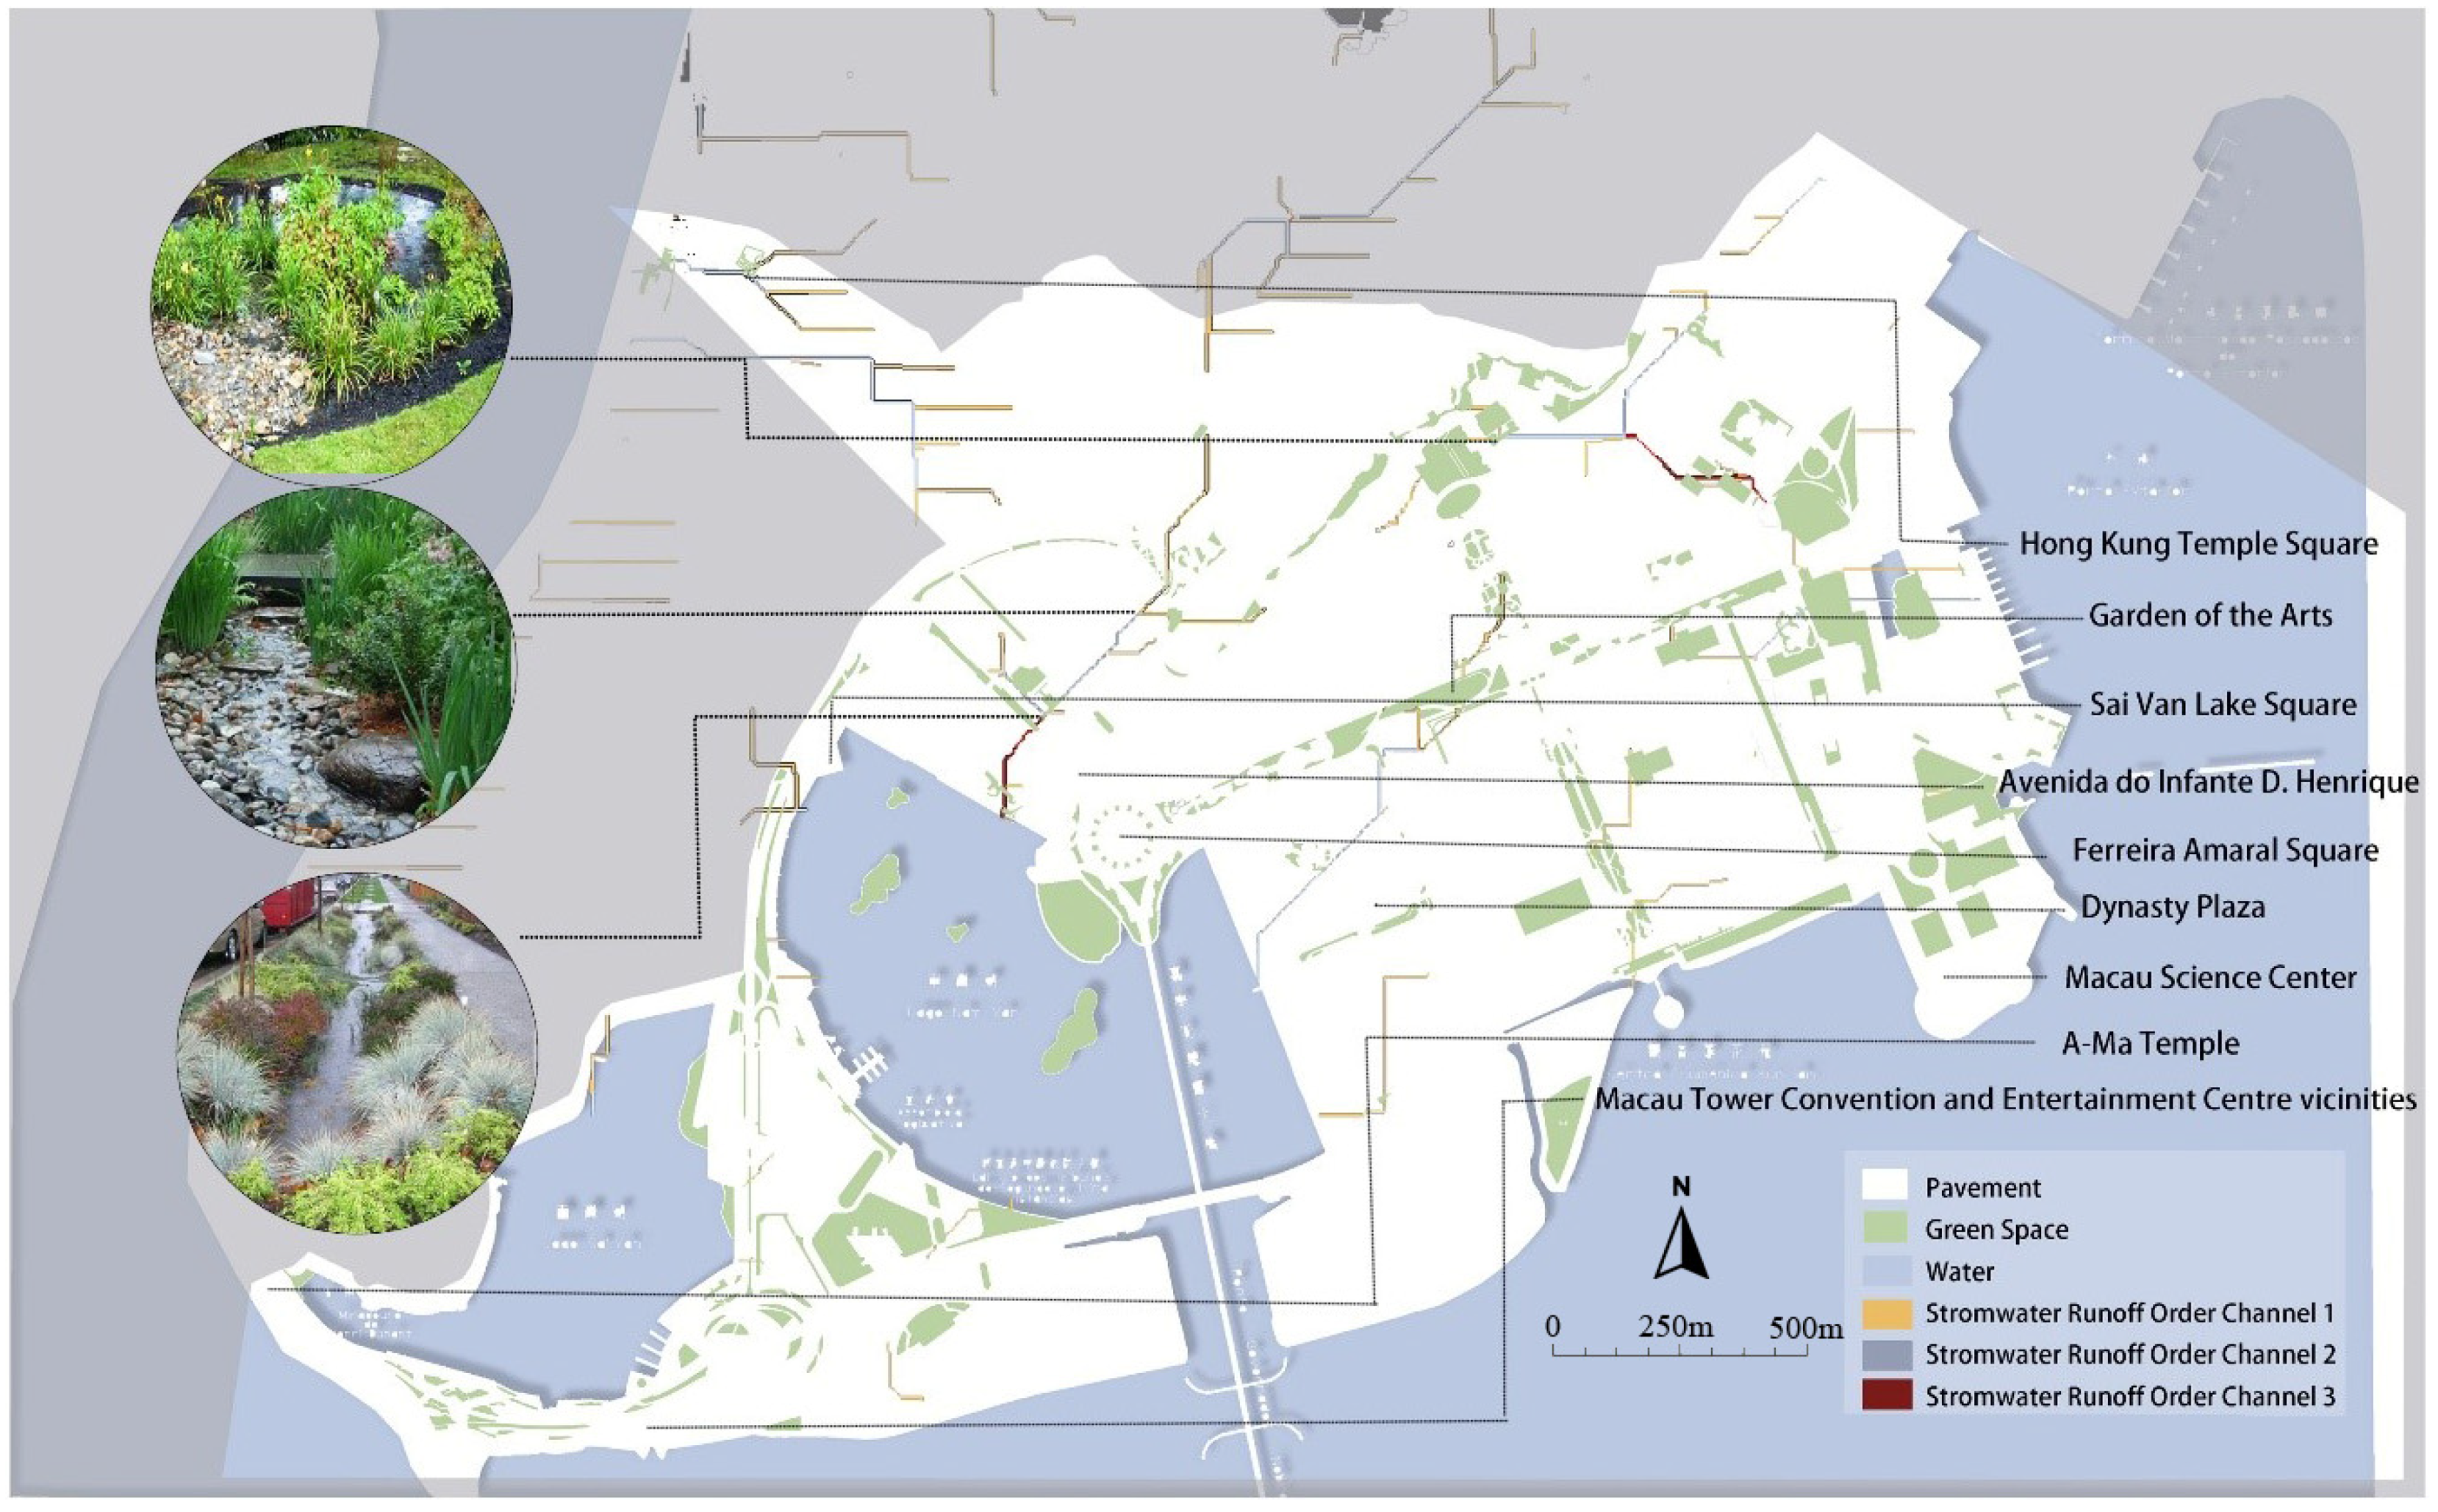
3.4.1. LID Technique Proposal at Storm Water Runoff Points
Rain gardens were added to the map in the Macau Tower Convention and Entertainment Center vicinity; they were also added to Avenida do Infante D. Henrique, Dynasty Plaza, Macau Science Center, and the A-Ma Temple. The advantage of rain gardens is managing storm water runoff and reduce runoff pollution onsite with inexpensive installation costs in some old neighborhoods with many low-income families and deficient public storm water facilities in the north of Cathedral Parish. Larger bio-retention ponds were placed in areas with low-lying terrain (i.e., the runoff endpoints), such as the Sai Van Lake Square, Garden of the Arts, Ferreira Amaral Square, and Hong Kung Temple Square. These features enable the collection, storing, and purification of storm water. Storm water runoff from rooftops could be conveyed to these ponds via rainwater downspouts and piping [51]. The large bio-retention ponds fit into the new and large-scale public space in the south of Cathedral Parish, and they provide high ecological, aesthetic and amenity benefits to the local commercial property.
At the renovated midstream runoff points (such as Avenida da Amizade, Avenida do Infante D. Henrique, and Rua do Guimaraes), sunken vegetation spaces were proposed to arrange as scattered strips for storm water to permeate and be transported farther downstream. The layout and design of these sunken green spaces would include storm water storage and infiltration space on roadsides. Usually, inception gullies are in sunken green spaces to ensure storm water overflow discharge [52,53,54]. The sunken vegetation is low cost and easy to incorporate into existing roadside landscaping, and its daily maintenance can be carried out at the same time by general landscape management, which is effective in Macau where labor cost is much higher than most other cities in the PRD region [55].
3.4.2. LID Technique Proposal along Storm Water Runoff Channels and on Hard Surfaces in Cathedral Parish
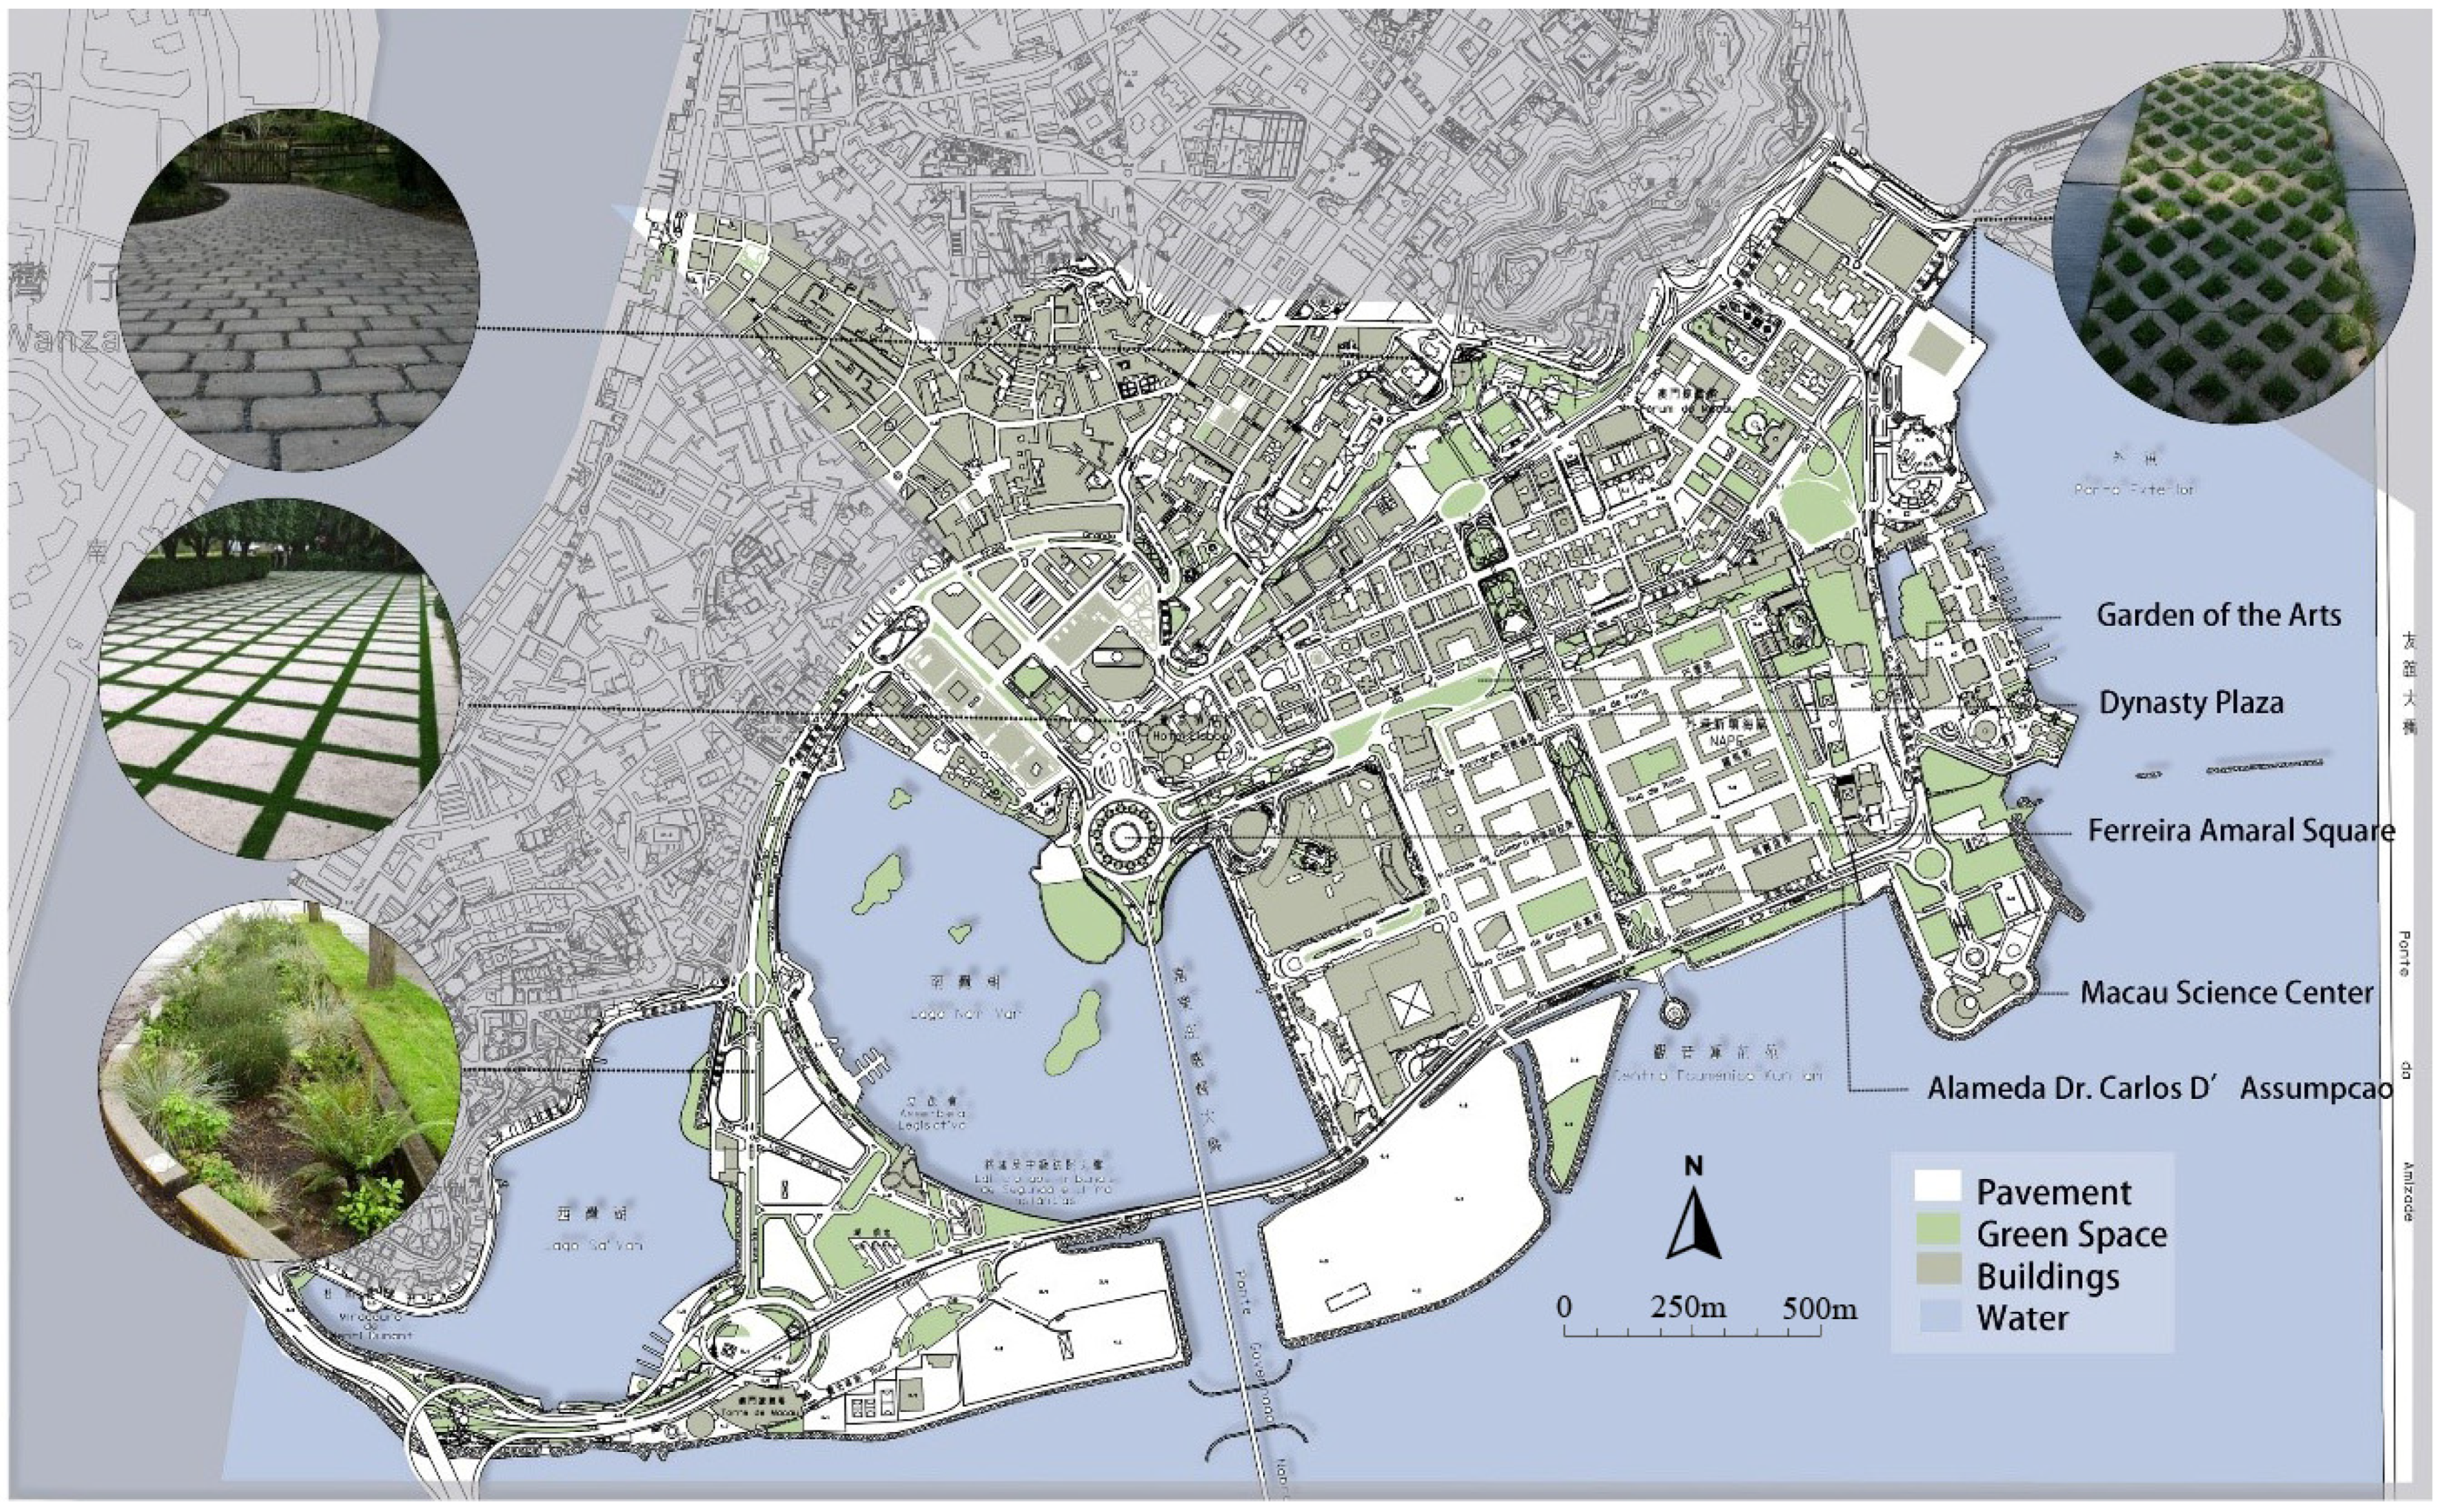
Permeable brick pavements would be used at the square, on sidewalks, and roads along the runoff channels with relatively low loading capacities [56]. Cobble stone, gravel, or reinforced grass could be used at Alameda Dr. Carlos D’Assumpcao, Garden of the Arts, and the automobile lanes at Ferreira Amaral Plaza and in the vicinities of Dynasty Plaza. Macau Science Center is proposed to be paved with permeable asphalt or concrete (Figure 9 and Figure 10). Perforated pipes connected to drainage pipes would be installed beneath these permeable road surfaces. Due to the subtropical climate and high population density, the weather is generally hot from April to September in Macau [57]. The permeable pavement allows the soil underneath to breathe, reduces heat islands, and brings temperatures down.
To direct storm water appropriately, road intersections should be designed along the transverse slope, and vertical relationships should be established between the road surfaces and the roadside vegetation strips. Curb gaps should be added, and drainage troughs should be installed on roads’ surfaces to facilitate rapid storm water channeling into LID facilities [58,59]. The overflow height should be controlled to limit the depth of retained storm water, and intercepting embankments should reduce the impacts of roads’ longitudinal slopes on the extent of storm water retention. Moisture-resistant and drought-resistant vegetation should be planted in roadside strips. Bio-retention ponds and shallow vegetation ditches should be established in low-lying areas where storm water collects, and vegetation ditches should be created in parking lots [60,61].
4. Conclusions
Scientific and sustainable management strategies are needed to protect Macau from floods disasters in the current context of global climate change and frequent extreme weather events. This study quantitatively examined the impacts of urban floods on residents’ travel in Macau. The simulation results revealed that up to one third of the land is threatened by floods under different storm surge warnings, and the travel distances between residential areas and common destinations increase by up to 64.5% as storm surge warning levels escalate. The scenarios analysis and forecasting reveal that the areas with higher population densities are not necessarily the ones requiring most urgently the installation of preventative measures. We demonstrated that traffic network analysis is the key area to tackle to ensure disaster prevention in terms of alleviating overall traffic paralysis. The analysis described here was based on Macau’s digital elevation, hydrological analysis, and network analysis models, as well as geographic information data. It provides scientific evidence and support in decision-making and the design of flood prevention measures which could be recommended to manage flood risk in other coastal cities where there are limited land resources.
Due to the lack of data, there are some limitations with this study. First, the use of a DEM and a hydrological analysis model to simulate flooding disaster risks on the city scale cannot accurately express the total extent of the affected areas in Macau in every case, because urban flooding is influenced by numerous factors in addition to variations in topography, such as wind speed and underground drainage systems. Improved precision with a fine scale in the hydrodynamic models (such as the storm water management model) [62,63,64] might be useful for future research and confirmation. Second, this study used the mean distance from home to destinations in the parishes to measure the residents’ travel distance. A more realistic approach might be needed to analyze transportation modes, traffic flow, congestion during flood events and destinations to other types of buildings. All of these call for future studies.
Author Contributions
K.L. provided the initial concept, data collection, and wrote the manuscript. L.Z. provided the research design, analysis approach and revision of the manuscript.
Funding
This research was funded by National Natural Science Foundation of China (No. 51708399); Macao Foundation (MF 1814) and Macao Cultural Affairs Bureau Academic Research Grant (No. 2018). The APC was funded by City University of Macau Foundation.
Acknowledgments
The authors acknowledge the three anonymous reviewers for their constructive comments, which have helped to improve the paper significantly.
Conflicts of Interest
The authors declare no conflict of interest.
Abbreviations
| A | Travel Conditions During Flood Events |
| BL | Blue |
| CA | Cathedral |
| D | Travel Distance |
| F | Building’s functional |
| Travel Distances During Flood Events at Five Levels of Intensity | |
| LID | Low Impact Development |
| m | Numbers of Residential Origins |
| O | Office |
| OL | Our Lady Fatima |
| P | Parish |
| PRD | Pearl River Delta |
| RE | Residential |
| s | Five SSW Warning Levels |
| SC | St. Lawrence Parish |
| SU | St. Lazarus Parish |
| SSW | Storm Surge Warning |
| Y | Yellow |
| B | Travel Conditions Under Normal Condition |
| C | Commercial |
| D | Black |
| DEM | Digital Elevation Model |
| Travel Distances Under Normal Condition | |
| H | Hospital |
| LITDI | Travel Distance Increase Percentage |
| n | Numbers of Travel Destinations |
| OD | Origin–Destination |
| OR | Orange |
| PP | Prevention Priority Order |
| R | Red |
| S | School |
| SA | St. Anthony Parish |
| SF | St. Francisco Parish |
| SAR | Special Administrative Region |
| T | Taipa Parish |
Appendix A
Travel distances under normal conditions and different storm surge warnings.

Table A1.
Travel distance from residents in Cathedral Parish to destinations.
| F | B | SSW-1 | SSW-2 | SSW-3 | SSW-4 | SSW-5 |
|---|---|---|---|---|---|---|
| C | 20,905 | 21,035 (0.6%↑) | 21,189 (1.4%↑) | 21,012 (0.5%↑) | 23,413 (12.0%↑) | 30,042 (43.7%↑) |
| H | 20,614 | 20,698 (0.4%↑) | 21,383 (3.7%↑) | 22,349 (8.4%↑) | 24,087 (16.8%↑) | 29,680 (44.0%↑) |
| O | 22,080 | 22,198 (0.5%↑) | 22,440 (1.6%↑) | 22,111 (0.1%↑) | 24,518 (11.0%↑) | 33,556 (52.0%↑) |
| S | 22,476 | 22,621 (0.6%↑) | 22,925 (2.0%↑) | 23,106 (2.8%↑) | 26,526 (18.0%↑) | 36,053 (60.4%↑) |
Table A2.
Travel distance from residents in St. Lawrence Parish to destinations.
| F | B | SSW-1 | SSW-2 | SSW-3 | SSW-4 | SSW-5 |
|---|---|---|---|---|---|---|
| C | 23,117 | 23,412 (1.3%↑) | 24,070 (4.1%↑) | 23,470 (1.5%↑) | 24,342 (5.3%↑) | 35,188 (52.2%↑) |
| H | 22,800 | 23,131 (1.5%↑) | 24,264 (6.4%↑) | 24,795 (8.8%↑) | 25,376 (11.3%↑) | 31,438 (37.9%↑) |
| O | 24,449 | 24,713 (1.1%↑) | 25,292 (3.5%↑) | 24,573 (0.5%↑) | 25,388 (3.8%↑) | 35,560 (45.4%↑) |
| S | 24,548 | 24,802 (1.0%↑) | 25,552 (4.1%↑) | 25,339 (3.2%↑) | 27,194 (10.8%↑) | 37,637 (53.3%↑) |
Table A3.
Travel distance from residents in Our Lady Fatima Parish to destinations.
| F | B | SSW-1 | SSW-2 | SSW-3 | SSW-4 | SSW-5 |
|---|---|---|---|---|---|---|
| C | 27,062 | 27,471 (1.5%↑) | 28,578 (5.6%↑) | 28,313 (4.6%↑) | 30,573 (13.0%↑) | 32,473 (20.0%↑) |
| H | 26,496 | 26,698 (0.8%↑) | 28,366 (7.1%↑) | 28,332 (6.9%↑) | 29,919 (12.9%↑) | 31,185 (17.7%↑) |
| O | 27,845 | 27,899 (0.2%↑) | 29,114 (4.6%↑) | 28,886 (3.7%↑) | 31,519 (13.2%↑) | 32,894 (18.1%↑) |
| S | 29,951 | 30,110 (0.5%↑) | 31,402 (4.8%↑) | 31,320 (4.6%↑) | 34,728 (15.9%↑) | 36,556 (22.1%↑) |
Table A4.
Travel distance from residents in St. Anthony Parish to destinations.
| F | B | SSW-1 | SSW-2 | SSW-3 | SSW-4 | SSW-5 |
|---|---|---|---|---|---|---|
| C | 22,317 | 22,843 (2.4%↑) | 22,998 (3.1%↑) | 22,844 (2.4%↑) | 24,337 (9.0%↑) | 30,286 (35.7%↑) |
| H | 21,288 | 21,613 (1.5%↑) | 22,556 (6.0%↑) | 23,352 (9.7%↑) | 24,232 (13.8%↑) | 27,812 (30.6%↑) |
| O | 23,575 | 23,723 (0.6%↑) | 23,963 (1.6%↑) | 23,744 (0.7%↑) | 25,420 (7.8%↑) | 30,554 (29.6%↑) |
| S | 24,674 | 25,109 (1.8%↑) | 25,435 (3.1%↑) | 25,692 (4.1%↑) | 27,887 (13.0%↑) | 33,864 (37.2%↑) |
Table A5.
Travel distance for residents in Taipa Parish to destinations.
| F | B | SSW-1 | SSW-2 | SSW-3 | SSW-4 | SSW-5 |
|---|---|---|---|---|---|---|
| C | 34,186 | 34,365 (0.5%↑) | 34,735 (1.6%↑) | 34,492 (0.9%↑) | 37,439 (9.5%↑) | 53,779 (57.3%↑) |
| H | 36,501 | 36,607 (0.3%↑) | 37,290 (2.2%↑) | 38,264 (4.8%↑) | 40,960 (12.2%↑) | 48,483 (32.8%↑) |
| O | 35,569 | 35,683 (0.3%↑) | 36,041 (1.3%↑) | 35,633 (0.2%↑) | 38,410 (8.0%↑) | 54,856 (54.2%↑) |
| S | 34,892 | 35,079 (0.5%↑) | 35,327 (1.2%↑) | 36,032 (3.3%↑) | 39,672 (13.7%↑) | 57,400 (64.5%↑) |
Table A6.
Travel distance for residents in St. Francisco to destinations.
| F | B | SSW-1 | SSW-2 | SSW-3 | SSW-4 | SSW-5 |
|---|---|---|---|---|---|---|
| C | 63,861 | 63,945 (0.1%↑) | 64,392 (0.8%↑) | 66,085 (3.5%↑) | 67,988 (6.5%↑) | 81,662 (27.9%↑) |
| H | 64,916 | 64,980 (0.1%↑) | 65,781 (1.3%↑) | 66,717 (2.8%↑) | 70,177 (8.1%↑) | 70,617 (8.8%↑) |
| O | 63,396 | 63,572 (0.3%↑) | 63,878 (0.8%↑) | 63,417 (0.1%↑) | 67,055 (5.8%↑) | 80,951 (27.7%↑) |
| S | 61,282 | 61,366 (0.1%↑) | 61,642 (0.6%↑) | 61,804 (0.9%↑) | 66,370 (8.3%↑) | 81,890 (33.6%↑) |
Table A7.
Travel distance for residents in St. Lazarus Parish to destinations.
| F | B | SSW-1 | SSW-2 | SSW-3 | SSW-4 | SSW-5 |
|---|---|---|---|---|---|---|
| C | 21,777 | 21,852 (0.3%↑) | 21,910 (0.6%↑) | 21,929 (0.7%↑) | 23,787 (9.2%↑) | 27,849 (27.95%↑) |
| H | 21,127 | 21,127 (0.0%) | 21,915 (3.7%↑) | 22,553 (6.7%↑) | 23,828 (12.8%↑) | 25,854 (22.4%↑) |
| O | 22,458 | 22,465 (0.0%) | 22,676 (0.1%↑) | 22,573 (0.5%↑) | 24,674 (9.9%↑) | 28,051 (24.9%↑) |
| S | 23,705 | 23,807 (0.4%↑) | 24,102 (1.7%↑) | 24,233 (2.2%↑) | 27,405 (15.6%↑) | 31,262 (31.9%↑) |
References
- Trenberth, K.E. Changes in precipitation with climate change. Clim. Res. 2011, 47, 123–138. [Google Scholar] [CrossRef] [Green Version]
- Grimm, N.B.; Faeth, S.H.; Golubiewski, N.E. Global change and the ecology of cities. Science 2008, 319, 756–760. [Google Scholar] [CrossRef] [PubMed]
- The OFDA/CRED—International Disaster Database. Available online: www.emdat.be (accessed on 11 November 2018).
- Hanson, S.; Nicholls, R.; Ranger, N. A global ranking of port cities with high exposure to climate extremes. Clim. Chang. 2011, 104, 89–111. [Google Scholar] [CrossRef]
- Kuenzer, C.; Renaud, F.G. Climate and environmental change in river deltas globally: Expected impacts, resilience, and adaptation. In The Mekong Delta System; Springer: Dordrecht, The Netherlands, 2012; pp. 7–46. [Google Scholar]
- Yang, L.; Scheffran, J.; Qin, H.; You, Q. Climate-related flood risks and urban responses in the Pearl River Delta, China. Reg. Environ. Chang. 2015, 15, 379–391. [Google Scholar] [CrossRef]
- Hou, Q.; Li, S.M. Transport infrastructure development and changing spatial accessibility in the Greater Pearl River Delta, China, 1990–2020. J. Transp. Geogr. 2011, 19, 1350–1360. [Google Scholar] [CrossRef]
- World Countries by Population Density 2019. Available online: http://worldpopulationreview.com/countries/countries-by-density/ (accessed on 11 August 2019).
- Lo, S. Eight Routes to Better Typhoon Management in Macau, as Pakhar Response Reveals Crisis Lessons Learnt from Hato. Available online: https://www.scmp.com/comment/insight-opinion/article/2108608/eight-routes-better-typhoon-management-macau-pakhar-response (accessed on 16 August 2019).
- Hincks, J. A Battered Macau Struggles to Come to Terms with Deadly Typhoon Hato. Available online: https://time.com/4917981/typhoon-hato-macau-aftermath/ (accessed on 16 August 2019).
- Governo da Regiao Administrative Especial de Macau. Available online: https://www.dsec.gov.mo/getAttachment/e20c6bab-ada4-4f83-9349-e72605674a42/E_ICEN_PUB_2016_Y.aspx (accessed on 11 November 2018).
- Wang, P. Hong Kong Picks Itself up after Typhoon Mangkhut. Chaos in Public Transport with 600 Blocked Roads. Available online: http://www.asianews.it/news-en/Hong-Kong-picks-itself-up-after-typhoon-Mangkhut.-Chaos-in-public-transport-with-600-blocked-roads-44950.html (accessed on 16 August 2019).
- Kim, K.; Pant, P.; Yamashita, E. Integrating travel demand modeling and flood hazard risk analysis for evacuation and sheltering. Int. J. Disaster Risk Reduct. 2018, 31, 1177–1186. [Google Scholar] [CrossRef]
- Debionne, S.; Ruin, I.; Shabou, S.; Lutoff, C.; Creutin, J.D. Assessment of commuters’ daily exposure to flash flooding over the roads of the Gard region, France. J. Hydrol. 2016, 541, 636–648. [Google Scholar] [CrossRef]
- Guilloux, A. Cross-Boundary Disaster Risk Governance: Lessons from the Pearl River Delta. In Crossing Borders; Springer: Singapore, 2018; pp. 133–151. [Google Scholar] [CrossRef]
- Price, R.K.; Vojinovic, Z. Urban flood disaster management. Urban Water J. 2008, 5, 259–276. [Google Scholar] [CrossRef]
- Acosta-Coll, M.; Ballester-Merelo, F.; Martinez-Peiro, M.; Hoz-Franco, E. Real-time early warning system design for pluvial flash floods—A review. Sensors 2018, 18, 2255. [Google Scholar] [CrossRef]
- Yang, B.; Li, M.; Li, S. Design-with-nature for multifunctional landscapes: Environmental benefit and social barriers in community development. Int. J. Environ. Res. Public Health 2013, 10, 5433–5458. [Google Scholar] [CrossRef]
- Kurte, K.R.; Durbha, S.S. High resolution disaster data clustering using Graphics Processing Units. In Proceedings of the 2013 IEEE International Geoscience and Remote Sensing Symposium—IGARSS, Melbourne, Australia, 21–26 July 2013; IEEE (The Institute of Electrical and Electronics Engineers): Piscataway, NJ, USA; pp. 1696–1699. [Google Scholar] [CrossRef]
- Mark, O.; Weesakul, S.; Apirumanekul, C.; Aroonnet, S.B.; Djordjević, S. Potential and limitations of 1D modelling of urban flooding. J. Hydrol. 2004, 299, 284–299. [Google Scholar] [CrossRef]
- Mathews, A.J.; Ellis, E.A. An evaluation of tornado siren coverage in Stillwater, Oklahoma: Optimal GIS methods for a spatially explicit interpretation. Appl. Geogr. 2016, 68, 28–36. [Google Scholar] [CrossRef]
- Hasnat, M.M.; Islam, M.R.; Hadiuzzaman, M. Application of GIS for Disaster Response in Dense Urban Areas: A Case Study for Dhaka City. J. Public Transp. 2018, 8, 1–19. Available online: https://trid.trb.org/view/1496884 (accessed on 15 November 2018).
- Usman, R.A.; Olorunfemi, F.B.; Awotayo, G.P.; Tunde, A.M.; Usman, B.A. Disaster Risk Management and Social Impact Assessment: Understanding Preparedness, Response and Recovery in Community Projects. Available online: https://www.intechopen.com/books/environmental-change-and-sustainability/disaster-risk-management-and-social-impact-assessment-understanding-preparedness-response-and-recove (accessed on 15 August 2019).
- Pregnolato, M.; Ford, A.; Wilkinson, S.M.; Dawson, R.J. The impact of flooding on road transport: A depth-disruption function. Transp. Environ. 2017, 55, 67–81. [Google Scholar] [CrossRef]
- Hammond, M.J.; Chen, A.S.; Djordjević, S.; Butler, D.; Mark, O. Urban flood impact assessment: A state-of-the-art review. Urban. Water J. 2015, 12, 14–29. [Google Scholar] [CrossRef]
- US EPA. Urban Runoff: Low Impact Development. Available online: https://www.epa.gov/nps/urban-runoff-low-impact-development (accessed on 19 August 2019).
- Jia, H.F.; Yu, S.L.; Qin, H.P. Low Impact Development and Sponge City Construction for Urban Stormwater Management. Front. Environ. Sci. Eng. 2017, 11, 20. [Google Scholar] [CrossRef]
- Zhou, L.; Shen, G.Q.; Woodfin, T.; Chen, T.; Song, K. Ecological and economic impacts of green roofs and permeable pavements at the city level: The case of Corvallis, Oregon. J. Environ. Plan. Manag. 2017, 61, 430–450. [Google Scholar] [CrossRef]
- Seo, M.; Jaber, F.; Srinivasan, R.; Jeong, J. Evaluating the Impact of Low Impact Development (LID) Practices on Water Quantity and Quality under Different Development Designs Using SWAT. Water 2017, 9, 193. [Google Scholar] [CrossRef]
- Ward, P.J.; Marfai, M.A.; Yulianto, F.; Hizbaron, D.R.; Aerts, J.C.J.H. Coastal inundation and damage exposure estimation: A case study for Jakarta. Nat. Hazards 2011, 56, 899–916. [Google Scholar] [CrossRef]
- OD Cost Matrix Analysis. Available online: https://desktop.arcgis.com/en/arcmap/latest/extensions/network-analyst/od-cost-matrix.htm (accessed on 30 December 2018).
- Hydrologic Analysis Sample Applications. Available online: https://pro.arcgis.com/en/pro-app/tool-reference/spatial-analyst/hydrologic-analysis-sample-applications.htm (accessed on 30 December 2018).
- Macao Meteorological and Geophysical Bureau. Available online: http://www.smg.gov.mo/smg/c_index.htm (accessed on 11 November 2018).
- Wan, Y.K.P. A comparison of the governance of tourism planning in the two Special Administrative Regions (SARs) of China–Hong Kong and Macao. Tour. Manag. 2013, 36, 164–177. [Google Scholar] [CrossRef]
- Governo da Regiao Administrative Especial de Macau. Available online: https://www.dscc.gov.mo/ENG/knowledge/geo_statistic.html (accessed on 11 November 2018).
- Li, L.L.; Yang, J.; Lin, C.Y.; Chua, C.T.; Wang, Y.; Zhao, K.F.; Wu, Y.T.; Liu, L.F.; Switzer, A.D.; Mok, K.M.; et al. Field survey of Typhoon Hato (2017) and a comparison withstorm surge modeling in Macau. Nat. Hazards Earth Syst. Sci. 2018, 3167–3178. [Google Scholar] [CrossRef]
- Marfai, M.A.; King, L. Potential vulnerability implications of coastal inundation due to sea level rise for the coastal zone of Semarang city, Indonesia. Environ. Geol. 2008, 54, 1235–1245. [Google Scholar] [CrossRef]
- Macau SAR Yearbook of Statistics. Available online: https://yearbook.gcs.gov.mo/zh-hant/ (accessed on 11 November 2018).
- Jenelius, E.; Petersen, T.; Mattsson, L.G. Importance and exposure in road network vulnerability analysis. Transp. Res. Part A Policy Pract. 2006, 40, 537–560. [Google Scholar] [CrossRef]
- Cova, T.J.; Johnson, J.P. A network flow model for lane-based evacuation routing. Transp. Res. Part A Policy Pract. 2003, 37, 579–604. [Google Scholar] [CrossRef]
- Bhaduri, B.; Minner, M.; Tatalovich, S.; Harbor, J. Long-term hydrologic impact of urbanization: A tale of two models. J. Water. Res. Plan. Manag. 2001, 127, 13–19. [Google Scholar] [CrossRef]
- Feng, C.; Wang, H.; Rao, X. The morphological evolution of Macau. In Proceedings of the Eighth International Space Syntax Symposium; 2012. Available online: https://www.academia.edu/3535278/The_Morphological_Evolution_of_Macau (accessed on 21 November 2018).
- Xi, X.; Min, L.I. Research on the Increment of Micro-Green Space in High-Density City of Macao Peninsula. Available online: http://en.cnki.com.cn/Article_en/CJFDTotal-CXGH201505016.htm (accessed on 6 December 2018).
- Qie, Z.J.; Rong, L.L. An integrated relative risk assessment model for urban disaster loss in view of disaster system theory. Nat. Hazards 2017, 88, 165–190. [Google Scholar] [CrossRef]
- Porter, J. The transformation of Macau. Pac. Aff. 1993, 66, 7–20. [Google Scholar] [CrossRef]
- Tingsanchali, T. Urban flood disaster management. Procedia Eng. 2012, 32, 25–37. [Google Scholar] [CrossRef] [Green Version]
- Tenerelli, P.; Gallego, J.F.; Ehrlich, D. Population density modelling in support of disaster risk assessment. Int. J. Disaster Risk Reduct. 2015, 13, 334–341. [Google Scholar] [CrossRef]
- Dietz, M.E. Low impact development practices: A review of current research and recommendations for future directions. Water Air Soil Pollut. 2007, 186, 351–363. [Google Scholar] [CrossRef]
- Ahiablame, L.M.; Engel, B.A.; Chaubey, I. Effectiveness of low impact development practices: Literature review and suggestions for future research. Water Air Soil Pollut. 2012, 223, 4253–4273. [Google Scholar] [CrossRef]
- Qin, H.; Li, Z.; Fu, G. The effects of low impact development on urban flooding under different rainfall characteristics. J. Environ. Manag. 2013, 129, 577–585. [Google Scholar] [CrossRef] [PubMed] [Green Version]
- Foster, J.; Lowe, A.; Winkelman, S. The Value of Green Infrastructure for Urban Climate Adaptation. Available online: https://ccap.org/resource/the-value-of-green-infrastructure-for-urban-climate-adaptation/ (accessed on 5 December 2018).
- Ellis, J.B. Managing urban runoff. In Handbook of Catchment Management; Wiley-Blackwell: Oxford, UK, 2009; Available online: https://onlinelibrary.wiley.com/doi/book/10.1002/9781444307672 (accessed on 3 December 2018).
- Stephenson, D.; Barta, B. Impacts of Stormwater and Groundwater Ingress on Municipal Sanitation Services. Available online: http://www.wrc.org.za/Knowledge%20Hub%20Documents/Research%20Reports/1386-1-05.pdf (accessed on 5 December 2018).
- Rossman, L.A. Storm Water Management Model User’s Manual, Version 5.0. Available online: https://cfpub.epa.gov/si/si_public_record_report.cfm?Lab=NRMRL&dirEntryId=114231 (accessed on 10 December 2018).
- Stotz, J. The Average and Minimum Salary in Macau will be Analyzed in this Post, Featuring also an Economic Outlook of This Chinese Special Administrative Region. Available online: https://checkinprice.com/average-and-minimum-salary-in-macau-china/ (accessed on 17 August 2019).
- Valinski, N.A.; Chandler, D.G. Infiltration performance of engineered surfaces commonly used for distributed stormwater management. J. Environ. Manag. 2015, 160, 297–305. [Google Scholar] [CrossRef] [PubMed] [Green Version]
- Macau Weather. Available online: https://www.travelchinaguide.com/climate/macau.htm (accessed on 17 August 2019).
- Luzar, J.A. A sustainable Design Solution for Stormwater: The Great Northern Mall in North. Available online: http://cardinalscholar.bsu.edu/handle/123456789/193764 (accessed on 5 December 2018).
- Olmsted. Available online: https://pdfs.semanticscholar.org/6ecf/7fcf81eaaf35644fba46e32d7aa6c2e7fa4d.pdf (accessed on 10 December 2018).
- Introduction to Stormwater Treatment Practices. Available online: https://www.caciwc.org/library/presentations/IW%20Training%20Sessions.pdf (accessed on 15 December 2018).
- Rauch, I. Parking Lot Typical Stormwater Runoff Constituents and Stormwater. Ph.D. Thesis, Stellenbosch University, Stellenbosch, South Africa, 2019. Available online: http://scholar.sun.ac.za/handle/10019.1/105938 (accessed on 11 December 2018).
- Getter, K.L.; Rowe, D.B.; Andresen, J.A. Quantifying the effect of slope on extensive green roof stormwater retention. J. Ecol. Eng. 2007, 31, 225–231. [Google Scholar] [CrossRef]
- Coffman, L.S. Method and Apparatus for Treating Stormwater Runoff. Available online: https://patents.google.com/patent/US6277274B1/en (accessed on 15 December 2018).
- Pina, R.; Ochoa-Rodriguez, S.; Simões, N.; Mijic, A.; Marques, A.; Maksimović, Č. Semi-vs. fully-distributed urban stormwater models: Model set up and comparison with two real case studies. Water 2016, 8, 58. [Google Scholar] [CrossRef]
Figure 1.
Research framework.

Figure 2.
Macau Special Administrative Region (SAR). (a) Parish in Macau; (b) Population density [34,35].

Figure 3.
Travel route simulation in GIS. (a) Shortest route from origins to destinations under normal condition; (b) shortest route from origins to destinations during floods events.
Figure 3.
Travel route simulation in GIS. (a) Shortest route from origins to destinations under normal condition; (b) shortest route from origins to destinations during floods events.

Figure 4.
Spatial extent affected by urban floods. (a) Digital elevation model (DEM) of buildings and roads in Macau [35]; (b) SSW Level 1 (blue) flooding simulation results (0–0.5 m floods); (c) SSW Level 2 (yellow) flooding simulation results (0.5–1 m floods); (d) SSW Level 3 (orange) flooding simulation results (1–1.5 m floods); (e) SSW Level 4 (red) flooding simulation results (1.5–2.5 m floods); (f) SSW Level 5 (black) flooding simulation results (2.5–3.0 m floods).

Figure 5.
Numbers of buildings (grouped by type) affected by flooding at each SSW level.

Figure 6.
Number of roads affected by flooding at each SSW level.

Figure 7.
Travel distances from residential areas to commercial, office, educational, and hospital destinations by parish. (a) Cathedral Parish; (b) St. Lawrence Parish; (c) Our Lady Fatima Parish; (d) St. Anthony Parish; (e) Taipa Parish; (f) St. Francisco Xavier Parish; and (g) St. Lazarus Parish.


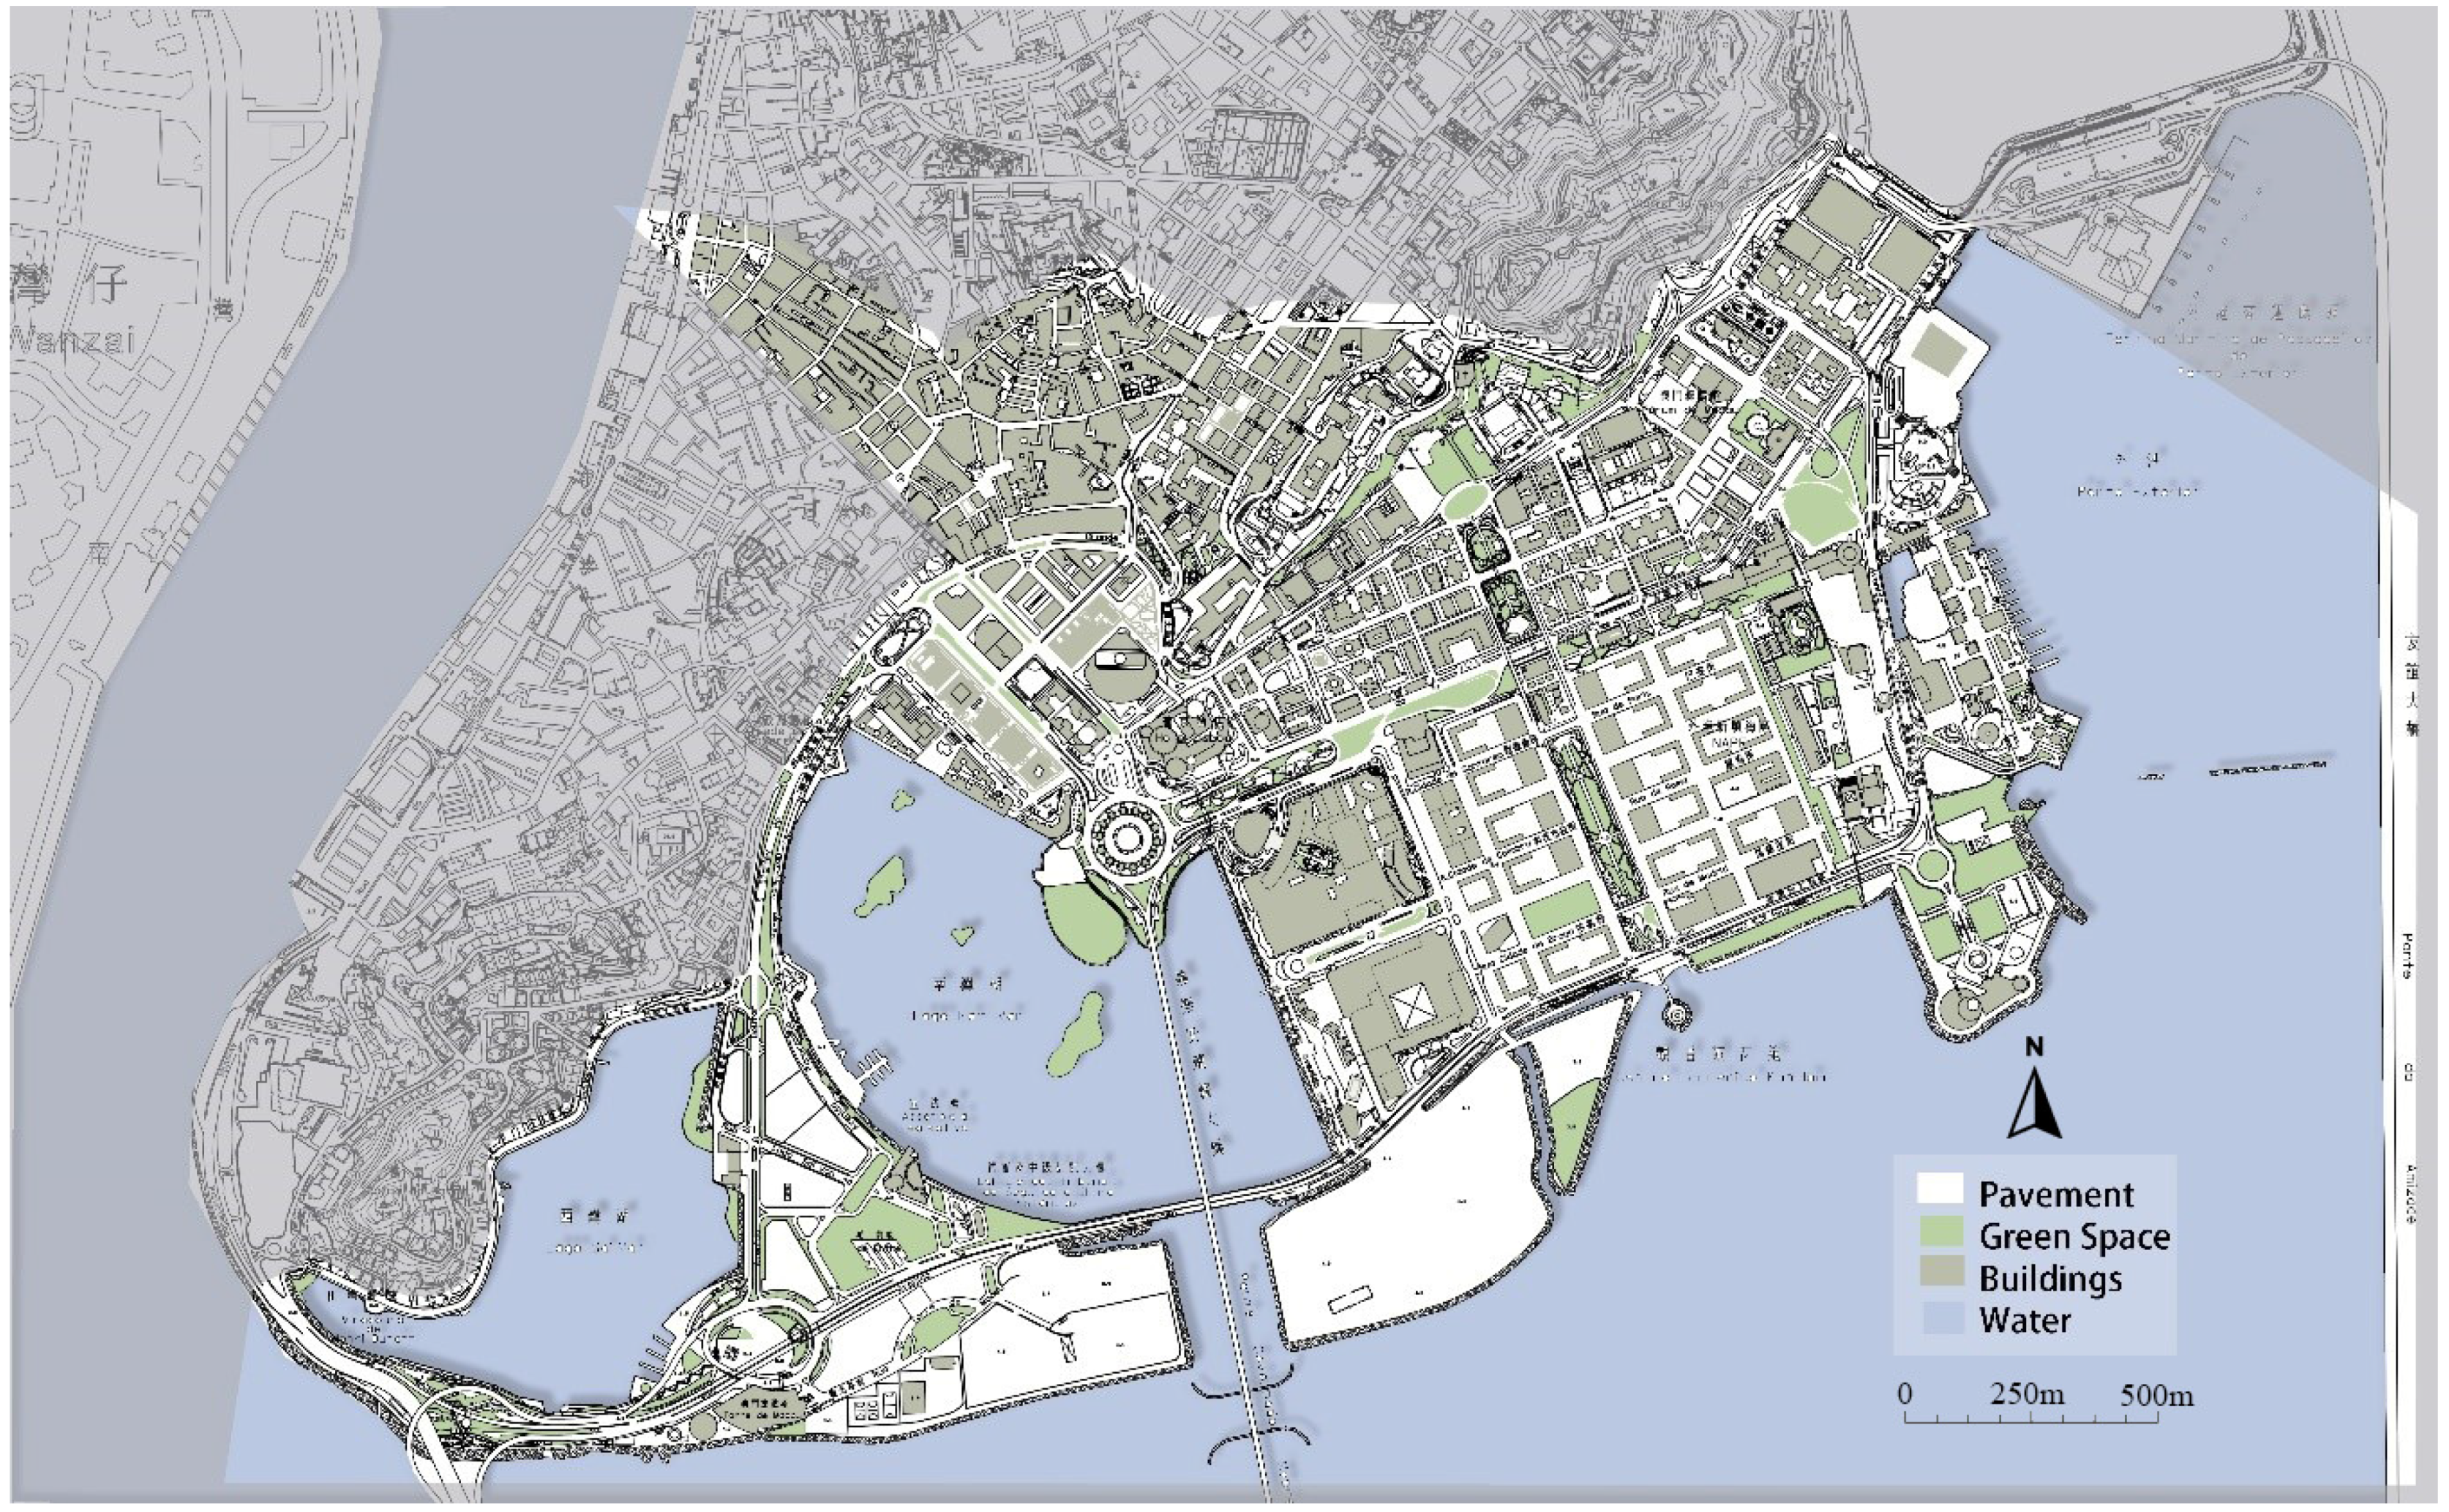
Figure 8.
Map of the existing surface types of Cathedral Parish.

Figure 9.
Low impact development (LID) technique proposal at storm water onsite runoff points and channels in Cathedral Parish.
Figure 9.
Low impact development (LID) technique proposal at storm water onsite runoff points and channels in Cathedral Parish.

Figure 10.
LID technique proposal along the storm water runoff channels in Cathedral Parish.

Table 1.
Surge warning levels (SSW) in Macau.
| Storm Surge Warning Levels | Water Level |
|---|---|
| SSW-1/Blue | The storm surge water level is expected to be below 0.5 m. |
| SSW-2/Yellow | The storm surge water level is expected to be between 0.5–1.0 m. |
| SSW-3/Orange | The storm surge water level is expected to be between 1.0–1.5 m. |
| SSW-4/Red | The storm surge water level is expected to be between 1.5–2.0 m. |
| SSW-5/Black | The storm surge water level is expected to be between 2.0–3.0 m. |
Table 2.
Assessment of priority parish to install prevention measures.
| Origin-Destination Alleviation | Scenario Analysis and Forecasting | |||||
|---|---|---|---|---|---|---|
| CA Ranking Score (Travel Distance Increase Alleviation) | SC Ranking Score (Travel Distance Increase Alleviation) | OL Ranking Score (Travel Distance Increase Alleviation) | SA Ranking Score (Travel Distance Increase Alleviation) | T Ranking Score (Travel Distance Increase Alleviation) | SF Ranking Score (Travel Distance Increase Alleviation) | |
| CA- | ||||||
| C | 6 (10,582↓) | 3 (6416↓) | 1 (5715↓) | 4 (6039↓) | 5 (8093↓) | 2 (5965↓) |
| H | 6 (9921↓) | 2 (5711↓) | 1 (2847↓) | 3 (5813↓) | 5 (7329↓) | 4 (5878↓) |
| O | 6 (10,139↓) | 4 (6263↓) | 2 (6074↓) | 3 (6196↓) | 5 (7720↓) | 1 (5984↓) |
| S | 6 (9098↓) | 2 (4981↓) | 1 (4462↓) | 3 (4992↓) | 4 (6084↓) | 5 (7254↓) |
| SC- | ||||||
| C | 6 (9939↓) | 3 (6660↓) | 2 (6414↓) | 4 (7354↓) | 5 (9543↓) | 1 (3669↓) |
| H | 6 (9624↓) | 3 (6396↓) | 1 (2777↓) | 4 (7189↓) | 5 (8566↓) | 2 (3555↓) |
| O | 6 (9388↓) | 2 (5945↓) | 3 (6229↓) | 4 (7092↓) | 5 (8505↓) | 1 (3505↓) |
| S | 6 (8183↓) | 2 (5041↓) | 3 (5132↓) | 4 (5925↓) | 5 (7477↓) | 1 (4666↓) |
| OL- | ||||||
| C | 5 (3426↓) | 1 (1983↓) | 2 (2458↓) | 3 (2839↓) | 4 (3315↓) | 6 (3448↓) |
| H | 4 (2831↓) | 1 (1366↓) | 2 (1607↓) | 3 (2708↓) | 5 (3096↓) | 6 (3539↓) |
| O | 2 (3136↓) | 1 (2541↓) | 4 (3440↓) | 3 (3420↓) | 6 (3838↓) | 5 (3620↓) |
| S | 4 (1615↓) | 1 (539↓) | 2 (1153↓) | 5 (1976↓) | 3 (1609↓) | 6 (4547↓) |
| SA- | ||||||
| C | 6 (6113↓) | 3 (3782↓) | 1 (2714↓) | 2 (2934↓) | 4 (3991↓) | 5 (4019↓) |
| H | 6 (5540↓) | 2 (2680↓) | 1 (1026↓) | 3 (2834↓) | 4 (3566↓) | 5 (3849↓) |
| O | 6 (5597↓) | 4 (4034↓) | 2 (3419↓) | 1 (3005↓) | 3 (3957↓) | 5 (4052↓) |
| S | 5 (4257↓) | 4 (2172↓) | 1 (1169↓) | 3 (1958↓) | 2 (1702↓) | 6 (4926↓) |
| T- | ||||||
| C | 6 (16,607↓) | 4 (8073↓) | 3 (7952↓) | 2 (7725↓) | 5(12,497↓) | 1 (5075↓) |
| H | 6 (14,918↓) | 2 (7429↓) | 1 (233↓) | 3 (7778↓) | 5(10,531↓) | 4 (7877↓) |
| O | 6 (16,893↓) | 3 (8068↓) | 2 (7683↓) | 4 (8080↓) | 5 (12,031↓) | 1 (5008↓) |
| S | 6 (17,044↓) | 4 (8647↓) | 2 (8243↓) | 3 (8602↓) | 5 (12,776↓) | 1 (7257↓) |
| SF- | ||||||
| C | 6 (13,079↓) | 3 (6907↓) | 4 (7731↓) | 2 (6730↓) | 5 (8589↓) | 1 (6630↓) |
| H | 6 (23,420↓) | 2 (6134↓) | 1 (4718↓) | 3 (6470↓) | 4(18,912↓) | 5(19,628↓) |
| O | 6 (13,300↓) | 1 (6863↓) | 3 (7045↓) | 2 (6988↓) | 5 (8597↓) | 4 (7608↓) |
| S | 6 (15,860↓) | 1 (8258↓) | 4 (9267↓) | 2 (9007↓) | 5(11,181↓) | 3 (9050↓) |
| SU- | ||||||
| C | 6 (4880↓) | 3 (2716↓) | 1 (2224↓) | 2 (2258↓) | 4 (3329↓) | 5 (3337↓) |
| H | 4 (3117↓) | 2 (1964↓) | 1 (522↓) | 3 (2232↓) | 5 (3391↓) | 6 (4518↓) |
| O | 6 (4485↓) | 3 (3027↓) | 2 (2,893↓) | 1 (2837↓) | 5 (3558↓) | 4 (3335↓) |
| S | 5 (3135↓) | 2 (1276↓) | 1 (798↓) | 4 (1447↓) | 3 (1319↓) | 6 (4306↓) |
| Total Score Prevention and Adaptation Priority Order | 155 1 | 68 5 | 54 6 | 83 4 | 126 2 | 102 3 |
© 2019 by the authors. Licensee MDPI, Basel, Switzerland. This article is an open access article distributed under the terms and conditions of the Creative Commons Attribution (CC BY) license (http://creativecommons.org/licenses/by/4.0/).
Share and Cite
MDPI and ACS Style
Li, K.; Zhou, L. The Influence of Urban Flooding on Residents’ Daily Travel: A Case Study of Macau with Proposed Ameliorative Strategies. Water 2019, 11, 1825. https://doi.org/10.3390/w11091825
AMA Style
Li K, Zhou L. The Influence of Urban Flooding on Residents’ Daily Travel: A Case Study of Macau with Proposed Ameliorative Strategies. Water. 2019; 11(9):1825. https://doi.org/10.3390/w11091825
Chicago/Turabian StyleLi, Kehong, and Long Zhou. 2019. "The Influence of Urban Flooding on Residents’ Daily Travel: A Case Study of Macau with Proposed Ameliorative Strategies" Water 11, no. 9: 1825. https://doi.org/10.3390/w11091825
Note that from the first issue of 2016, this journal uses article numbers instead of page numbers. See further details here.