Application of GALDIT in Assessing the Seawater Intrusion Vulnerability of Jeju Island, South Korea


1
Department of Land, Water and Environmental Research, Korea Institute of Civil Engineering and Building Technology, Goyang 10223, Korea
2
Department of Smart City & Construction Engineering, University of Science and Technology, Daejeon 34113, Korea
3
Jeju Regional Infrastructure Technology Development Center, Jeju Province Development Co., Jeju 63345, Korea
*
Authors to whom correspondence should be addressed.
Water 2019, 11(9), 1824; https://doi.org/10.3390/w11091824
Submission received: 4 July 2019
/
Revised: 22 August 2019
/
Accepted: 28 August 2019
/
Published: 31 August 2019
(This article belongs to the Section Water Resources Management, Policy and Governance)
Abstract
:Seawater intrusion (SWI) is a major environmental threat to groundwater resources in coastal regions. GALDIT is an index-based SWI vulnerability model that is increasingly being used in many parts of the world to identify regions that are vulnerable to various types of SWI based on six major parameters. In this study, we conducted a vulnerability assessment of Jeju Island to SWI based on several years of collected groundwater level data and hydrogeological values where the objectives of the study were to visualize the distribution of recent SWI, to increase the reliability of the GALDIT assessment method by improving current GALDIT techniques, and to respond effectively to diagnoses of SWI on Jeju. To improve the GALDIT assessment method to fit the Jeju model, the possibility of electrical conductivity was explored instead of standard GALDIT parameters that represented the existing impact of SWI. Improvements to the GALDIT vulnerability assessment method made it clear that groundwater became increasingly vulnerable to SWI in the existing high-vulnerability group. The results of this research may be used to develop a quantitative index for rational decision-making on policies and suggest the need for further improvements in groundwater management, with a stronger focus on easing groundwater use.
1. Introduction
Global water use is increasing because of population growth and industrial development, as well as recent changes in land and water use patterns. In regions where surface water alone may not meet the water demand or surface water management is not well-developed, groundwater is a stable water resource for everyday use, agriculture, and industry. Coastal regions are usually populated and dependent on groundwater [1]; seawater intrusion (SWI) is a representative type of groundwater obstruction that reduces the availability of water resources from coastal aquifers. Seawater intrusion is a natural and anthropogenic issue that occurs in many parts of the world and is also a freshwater pollution mechanism where saltwater from the sea intrudes into the coastal aquifer. The pattern of SWI is highly correlated with the characteristics of associated regions. In particular, SWI severely affects the water use and management for islands and some coastal regions where groundwater is the only source of freshwater [2,3,4,5,6].
Approaches to assessment of the vulnerability of coastal aquifers include numerical simulations with the variable density flow-transport model, the sharp interface approach, and the overlay and index method. Numerical simulations reproduce the dynamics of groundwater flow and salt transport in the coastal aquifer and can incorporate site characteristics [2,7,8,9,10,11,12]. However, despite their accuracy and usefulness, numerical simulations require a considerable amount of hydrogeologic data as input and a difficult calibration process, therefore substantial computing power is needed for data processing and modeling.
An alternative vulnerability assessment method uses a steady-state analytical solution based on the sharp interface model with the Ghyben–Herzberg principle, where the mixing of freshwater and saltwater is neglected and instead a sharp interface is assumed [13]. The sharp interface model is often employed to assess the vulnerability of aquifers to the effects of SWI because of the relatively easy and rapid computations. For example, Werner et al. [14] proposed a SWI vulnerability index based on the sharp interface approach to predict the impacts of future climate change and groundwater depletion by anthropogenic activities. Morgan and Werner [15] combined the analytical approach with qualitative investigation to assess the vulnerability of confined aquifers in Australia.
Recently, assessments using overlay and index techniques based on spatial mapping have been developed and improved to intuitively show the intrinsic vulnerability of aquifers. Some of the common methods used for classification and mapping of groundwater vulnerability zones include DRASTIC [16], GALDIT [17], SINTACS [18], and Aquifer Vulnerability Index (AVI) [19]. With the exception of GALDIT, the methods were developed from the concept that pollutants originate from the land surface and are transported through the vadose zone with infiltrated water. Thus, they were mostly used for non-coastal aquifers. The index-based numerical ranking method is advantageous because it is relatively independent of the boundary condition problem. For the inland region of South Korea, Yang and Kim [20] performed a SWI vulnerability test that used the analysis hierarchy process method and considered the fields of the humanities, economics, sociology, and environmental science.
GALDIT [17,21,22] is an overlay and index technique that was developed to assess the vulnerability of coastal aquifers to SWI. The GALDIT method indexes six parameters to assess SWI vulnerability; it weighs each index and prioritizes the indices through a decision-making process and then assesses the possibility of SWI via numerical calculation. The parameters used are the groundwater occurrence (G), aquifer hydraulic conductivity (A), height of the groundwater level above sea level (L), distance inland perpendicular from the shoreline (D), impact of existing seawater intrusion in the area (I), and thickness of the aquifer considered (T). Many studies have employed the GALDIT method to assess the overall vulnerability of coastal aquifers to SWI in coastal regions and islands of different countries in Europe, Asia, and Africa over very small (2 km2) and large (2835 km2) areas [4,22,23,24,25,26,27].
Lobo-Ferreira and Chachadi [21,22] used GALDIT to conduct vulnerability tests on an unconfined aquifer covering an area of approximately 10 km2 at Monte Gordo, Portugal. They mapped the spatial distributions of the six GALDIT parameters and prepared SWI scenarios describing sea level rises of 0.25 and 0.5 m and applied them to the parameter G to calculate the vulnerability depending on individual scenarios. In a recent study, Kura et al. [4] performed a GALDIT assessment on Kapas Island, a tropical island in northeastern Malaysia and concluded that the alluvial deposits west of the island were highly vulnerable to SWI. Recinos et al. [26] carried out a GALDIT assessment on a Mediterranean alluvial aquifer, which is a representative pilot site for various case studies on SWI and reported that the intrinsic vulnerability shifted from moderate to high vulnerability in 15% of the regions between 1992 and 2004.
Some studies have compared the GALDIT method to other index-based methods like DRASTIC, SINTACS, and AVI to evaluate the model performance [3,23,24,28]. Pedreira et al. [25] applied two overlay and index techniques to one field; they assessed nitrate pollution using the DRASTIC model, while the SWI vulnerability was tested with the GALDIT method. The individual rankings obtained from the two models were processed into spatial distribution maps, which showed that 45% of the field was highly vulnerable to SWI and that nitrate pollution caused by agricultural activities created a low-to-moderate amount of vulnerability. Kura et al. [4] also employed the DRASTIC and GALDIT models simultaneously to comprehensively investigate the pollution vulnerability of coastal groundwater in the tropical islands of Malaysia.
This study is the first to use the GALDIT method to assess the vulnerability of coastal aquifers throughout Jeju Island to SWI, which could serve as a good example for the application of GALDIT to volcanic islands. The risk of SWI based on long-term observations was analyzed, and the effects of local characteristics on GALDIT results were investigated using parameter data obtained through observations and mapping with geographic information systems (GIS). To improve the assessment method, this study used electrical conductivity instead of standard GALDIT parameters to represent the current impact of SWI. In addition, the ranges of the groundwater parameters obtained from daily and monthly monitoring data were modified according to the local characteristics of Jeju Island to clearly distinguish vulnerable regions and identify falling groundwater levels, which provided strong evidence of increasing vulnerability due to anthropogenic activities. To improve the GALDIT assessment method to fit the Jeju model, we explored the possibility of using electric conductivity instead of the standard parameters representing the existing impact of SWI. The results of the GALDIT assessment with modified ranges and weights were mapped to show the SWI vulnerability of Jeju Island.
2. Materials and Methods
2.1. Site Description
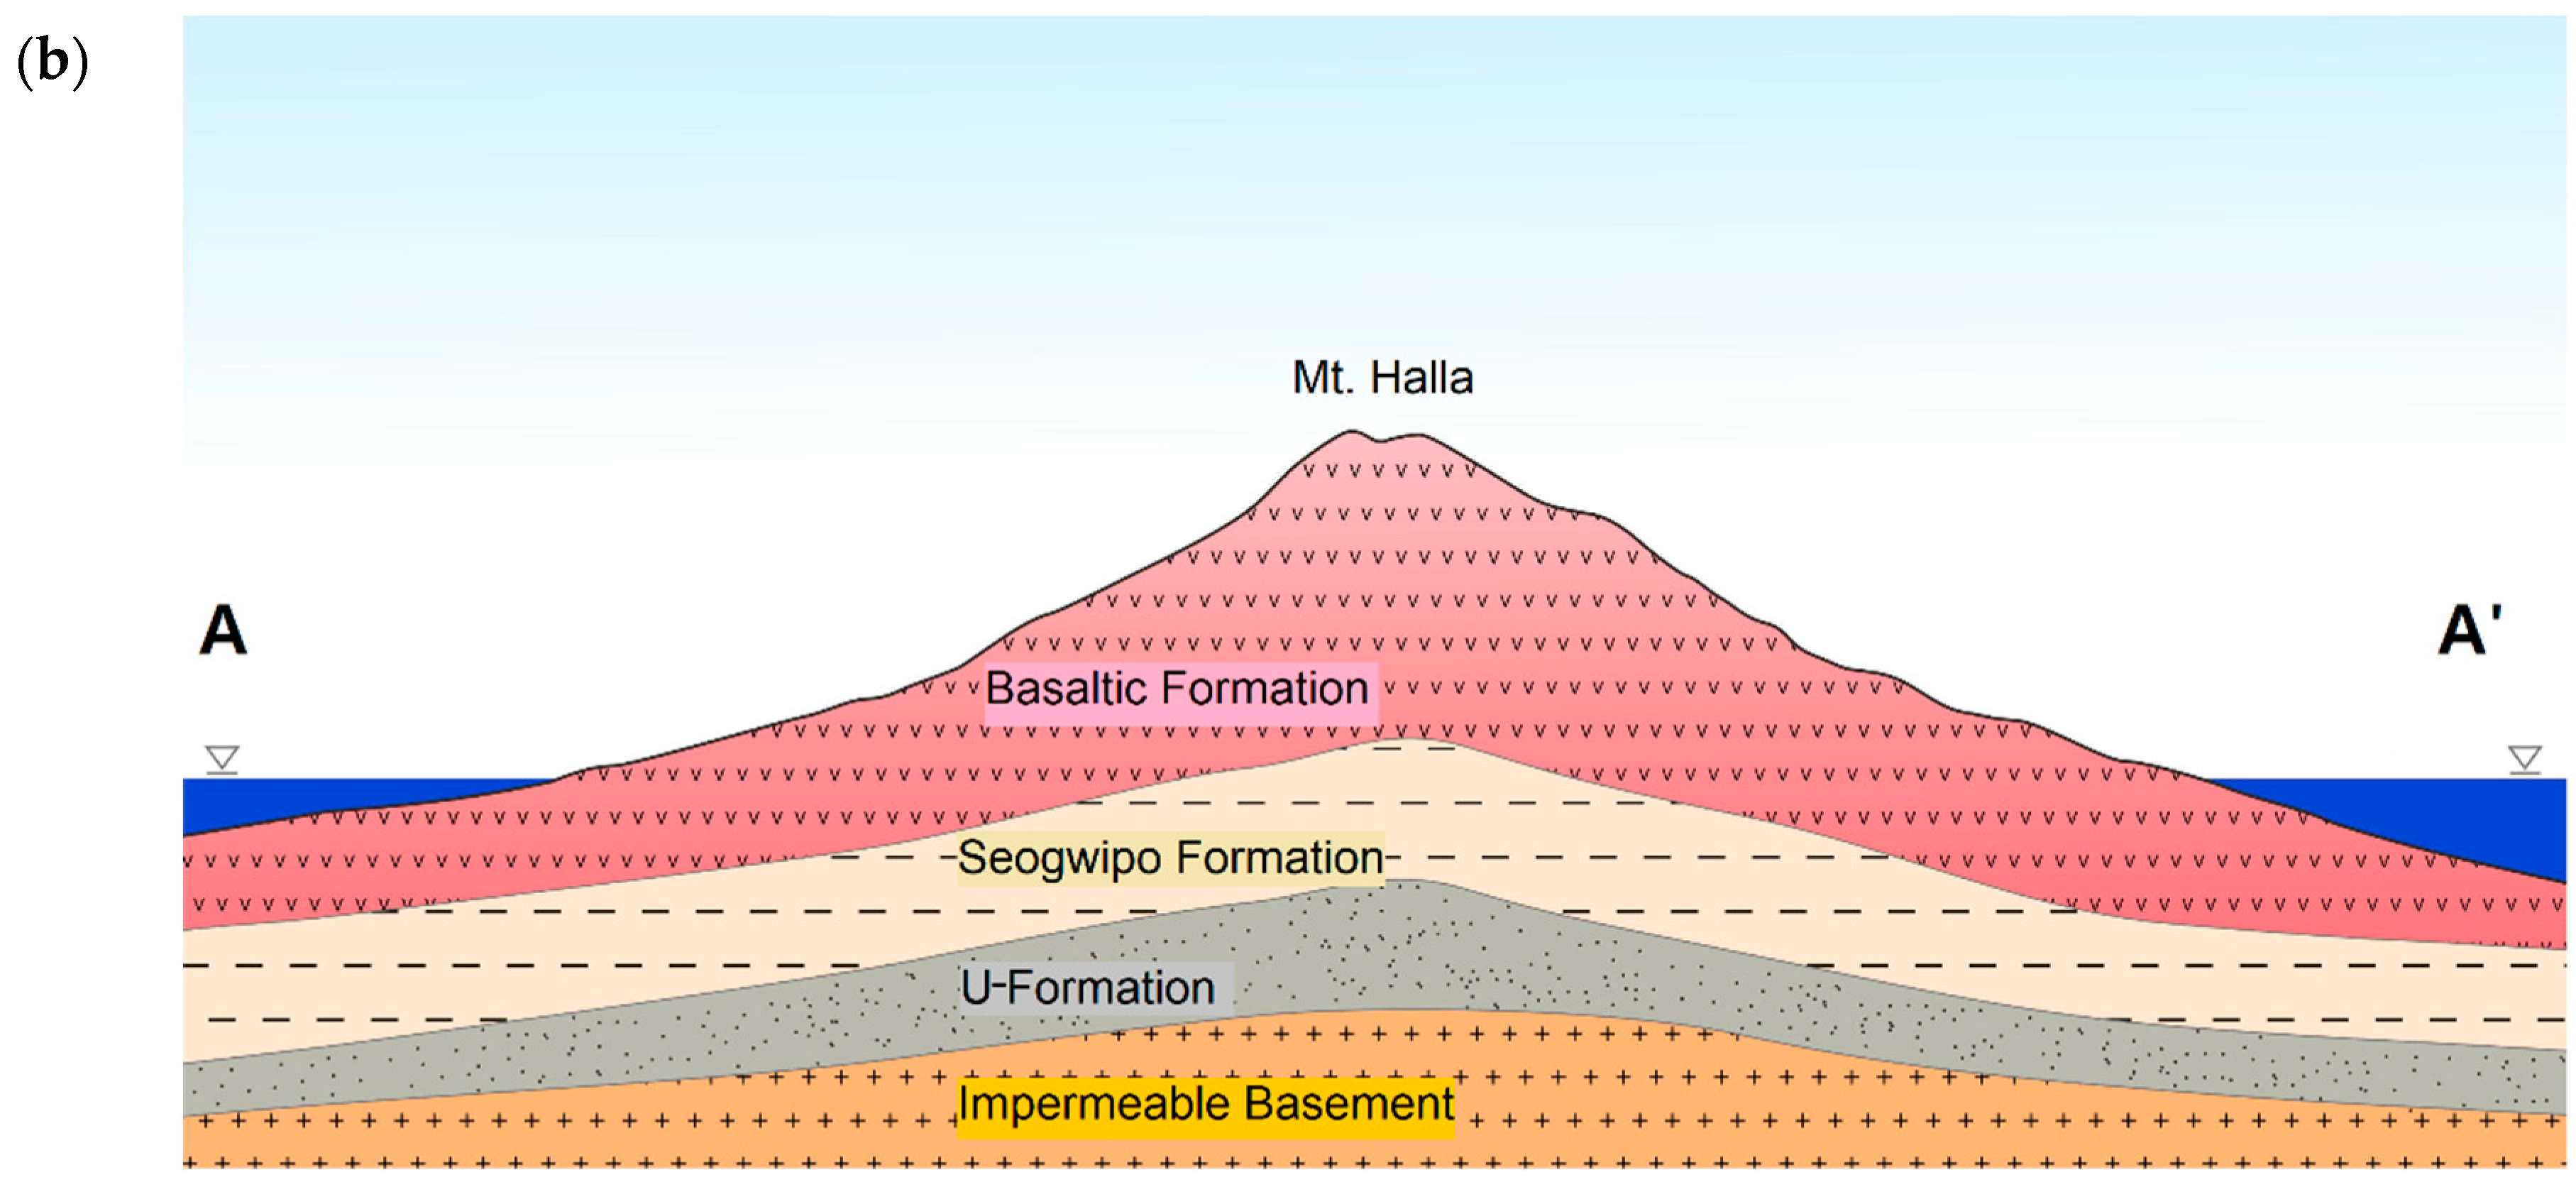
Jeju Island is South Korea’s largest island, and it is located south of the mainland. Its main source of water is groundwater. Jeju Island was formed by volcanic activity and is oval-shaped with an area of about 1846 km2. It is located at a longitude of 33°10′–33°57′ N and latitude of 126°10′–127°00′ E (Figure 1). The island is 73.3 km long from east to west and 41.0 km wide from north to south. Mt. Halla, at the center of the island, is 1950 m high, and the altitude decreases from the mountains to the shoreline. Groundwater is mostly developed in the coastal regions. The unconfined aquifer corresponds to the top layer that consists of basalt, and the confined aquifer is located below the unconfined aquifer.
The entirety of Jeju Island is classified into four types of geologic formations based on hydrogeological characteristics. The principal groundwater aquifers are located in the top formation, which is called the Basaltic Formation in this study, between lava layers from different eruption periods and layers of clinker. The Seogwipo Formation (average thickness of 100 m) and sedimentary layers, such as tuff, generally yield very little groundwater and are classified as aquicludes or low permeable layers. The U-Formation occurred with an average thickness of 150 m, and the oldest formation is the relatively Impermeable Basement. We considered the top formation as the unconfined layer that is the object site of this study. The unconfined aquifers are all in the coastal setting. You can see the outline of the formations from the cross-section of Jeju Island shown in Figure 1b.
With the recent population increase and changes in industrial activities, groundwater use is increasing throughout the island. SWI is occurring in various patterns throughout Jeju Island due to the hydrogeological heterogeneity and different anthropogenic activities depending on the region. Fish farms have been installed along the shoreline, and groundwater wells have been developed near the shoreline that take in a significant volume of brackish groundwater. This not only threatens the present agricultural activities but also limits the municipal use of coastal groundwater and local development of the island.
To ensure the sustainable management of water resources, the government has established a seawater intrusion monitoring network (SIMN) on the shoreline of the island and collected basic data about the groundwater level and quality. This has enabled integrated research to support the appropriate management and planning of water resources. El-Kadi et al. [30] mapped the water level and salinity distributions of the island through simulations with MODFLOW [31] and SEAWAT [32], and their results predicted an increase in SWI due to climate change and drought. SWI vulnerability tests using overlay and index techniques have never been performed for Jeju Island. Jung et al. [33] analyzed the water quality of the springs distributed from the peak of Mt. Halla to the coastal regions and found that the overall dissolved ion concentration in freshwater free from the effect of SWI was relatively low and that the HCO3− concentration was 13–75 mg/L.
Jeju Island has no perennial streams; all water use, including drinking water, depends on groundwater. It has a high level of rainfall and receives the most precipitation in Korea. Jeju Island shows very large differences in precipitation according to the region and altitude with the southern and eastern parts receiving greater precipitation than the northern and western parts and the precipitation increasing with altitude. The island’s annual rainfall is 2061 mm (1991–2011); the monthly rainfall is highest in August (at least 200 mm) and lowest in December. Seasonal differences in precipitation and water use can lead to falling groundwater levels and SWI into coastal aquifers at times of drought with below-average rainfall and heavy groundwater intake. In some areas with a high groundwater intake, the groundwater level is continuously falling, and the chloride ion level is exceeding the permissible drinking water quality [34]. During heat waves and droughts (e.g., 2013 and 2017), water supplies were interrupted in some areas of Jeju Island due to low groundwater levels. As of 2017, Jeju Island’s permitted water intake has been estimated to have reached 89% of the total sustainable availability. In areas with concerns over excessive groundwater use and falling groundwater levels, monitoring systems are being installed on an ongoing basis, and long-term monitoring of sudden drops in groundwater level, exhaustion of groundwater sources, and the influx of pollutants are taking place.
2.2. Methods
2.2.1. Calculation of GALDIT Indices and Criteria for Decision-Making
The GALIT model is a numerical ranking method based on overlay and index techniques. The GALDIT model considers six hydrogeological parameters with regard to significant SWI, and the name GALDIT is a combination of letters from the six parameters [21,22]. Among the GALDIT parameters, the aquifer type, aquifer hydraulic conductivity, distance inland perpendicular from the shoreline, and thickness of the aquifer are assumed to be static, while the height of the groundwater level above sea level and salinity are assumed to be time-dependent parameters reflecting the stress on an aquifer [26].
The GALDIT parameters are given three attribute values: weight, range, and importance. The parameter with the largest impact on SWI is given a weight of 4, and lesser parameters are given a smaller weight. The range of parameter variables is divided into four ratings specific to the area under investigation based on available hydrogeologic and morphologic data. An importance rating of 2.5, 5, 7.5, or 10 is given to the range of each rating, and a higher importance rating indicates a larger effect on SWI. The predetermined weight and rating values are substituted into the GALDIT equation (Equation (1)), which determines the GALDIT index by multiplying the weights with the rating parameters assigned to each data point:
where W and R are the weight of the indicator parameter and importance rating of the ith indicator parameter, respectively.
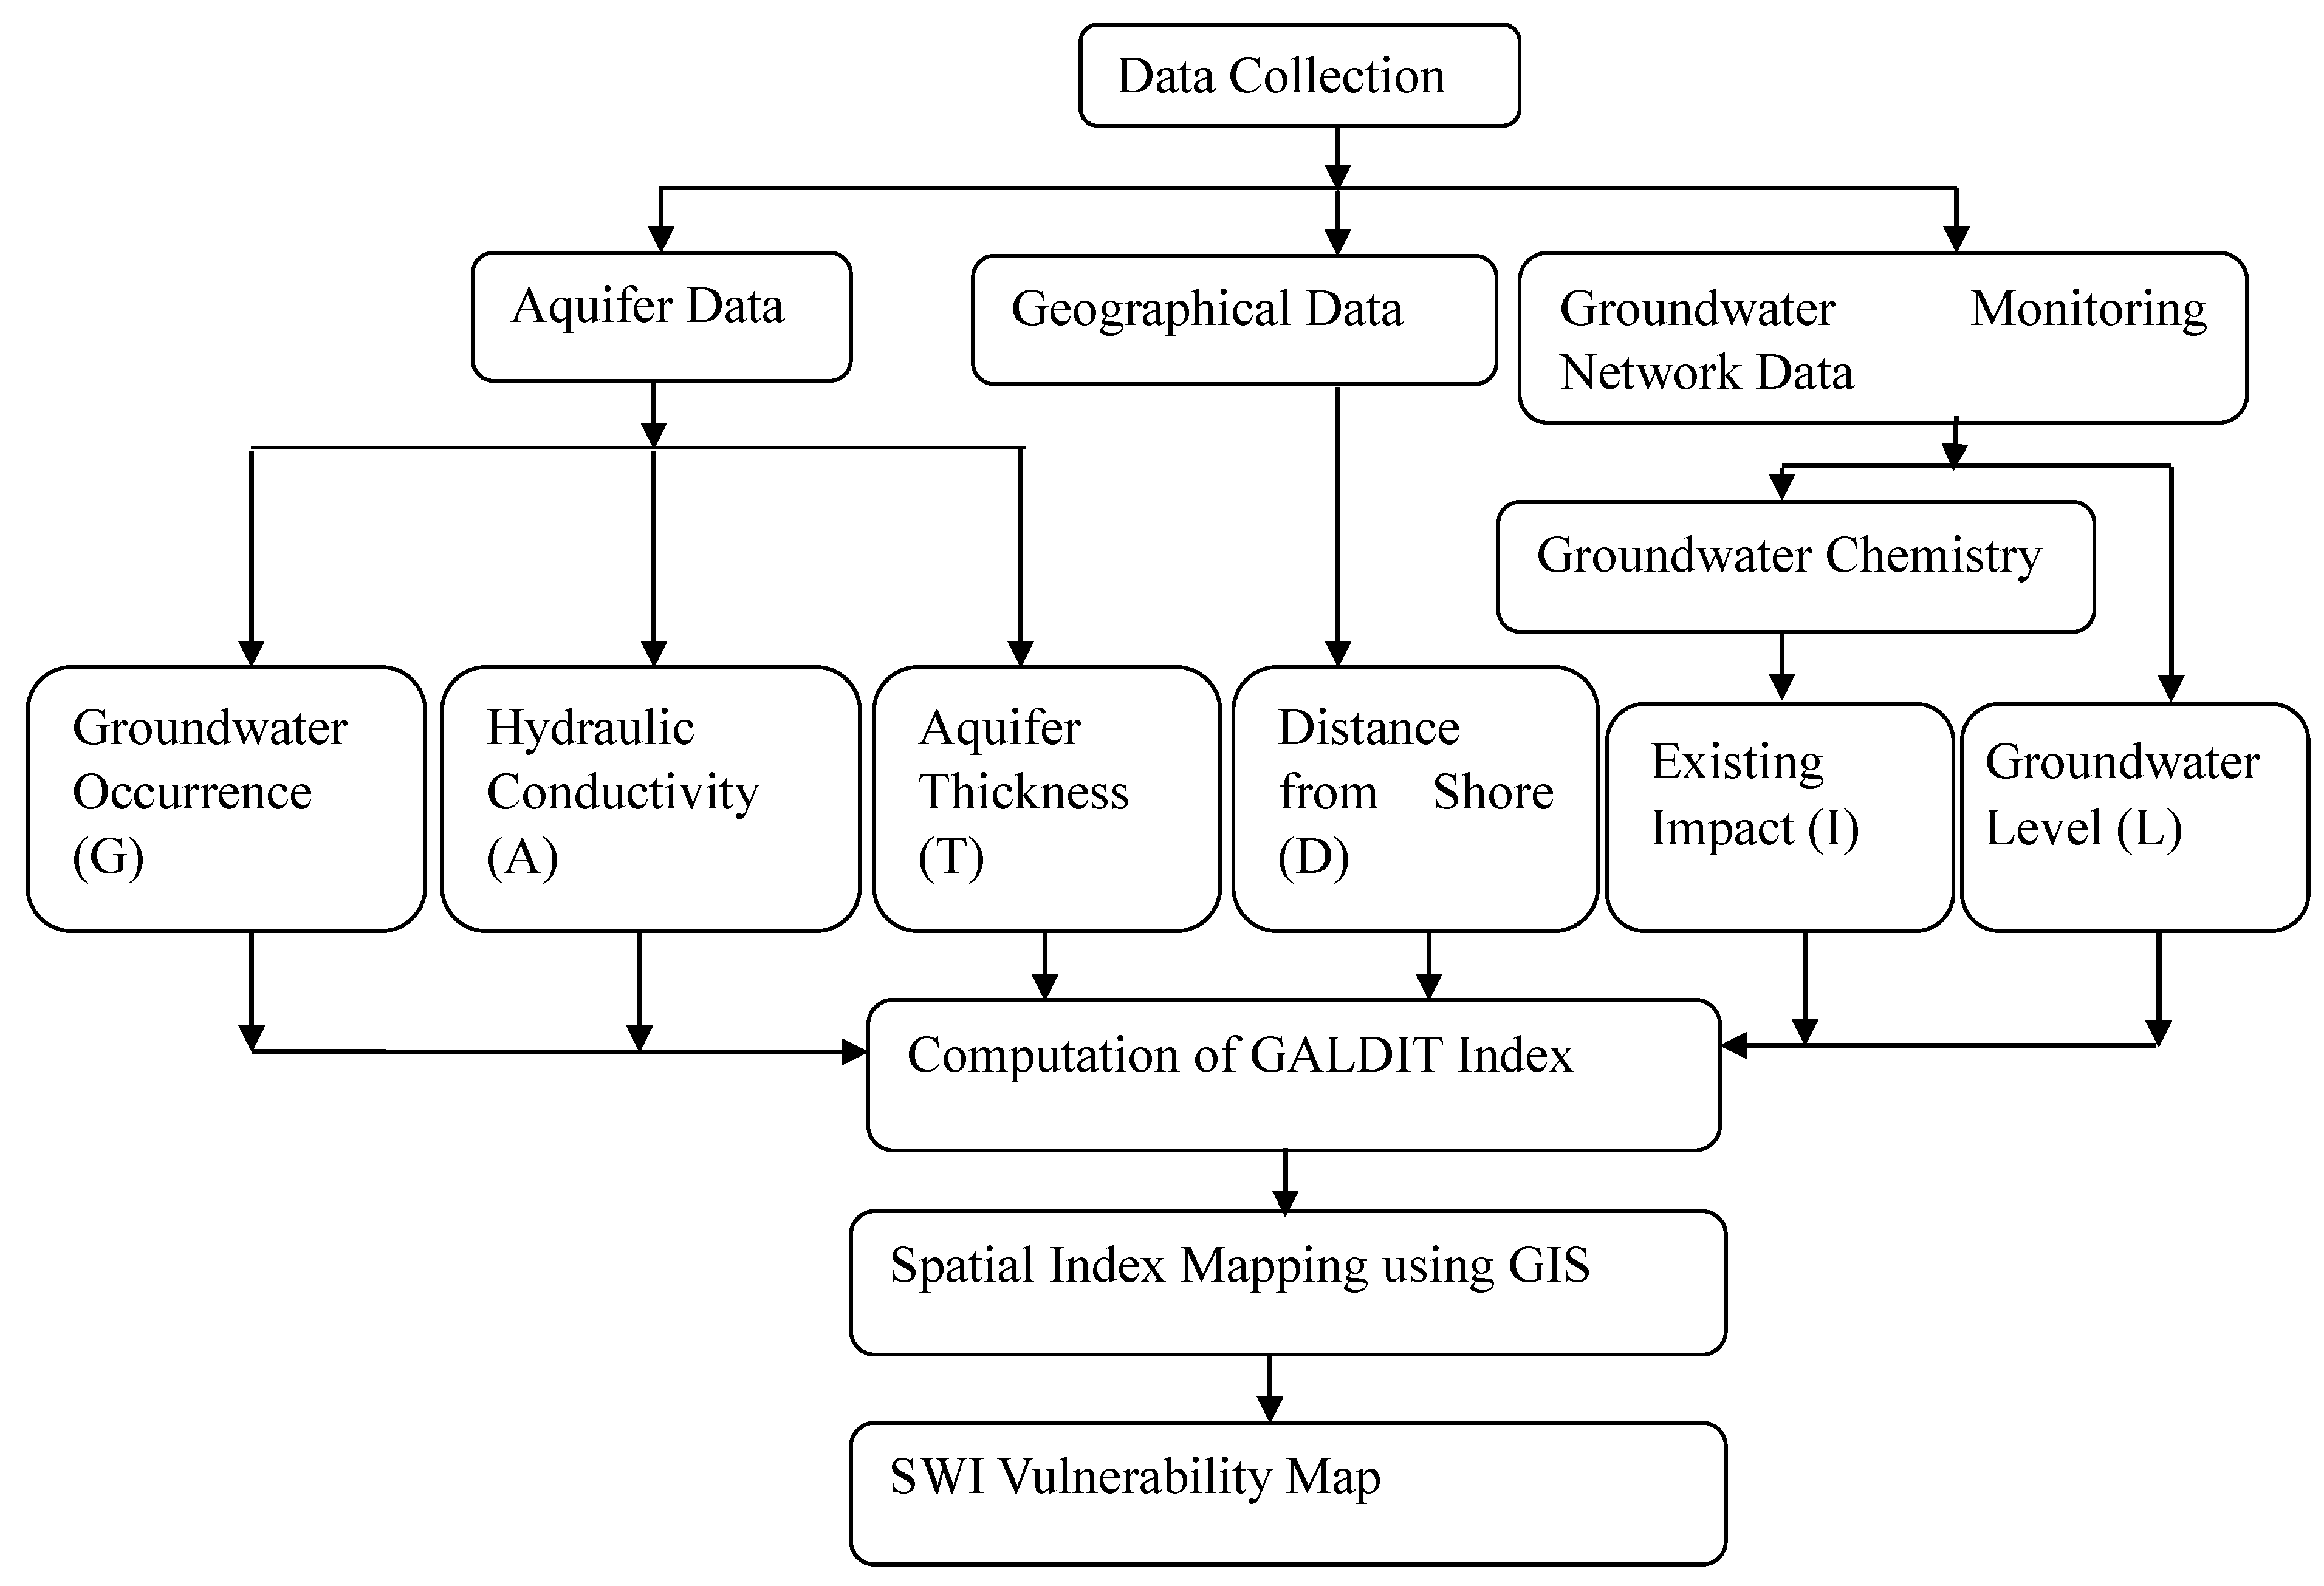
The GALDIT index calculated with the additive model in Equation (1) has a range with a maximum of 10 and minimum of 2.5. If the GALDIT index is less than 5, the vulnerability is classified as low. A value between 5 and 7 indicates moderate vulnerability, and a value equal to or higher than 7.5 indicates high vulnerability. The calculated GALDIT index can be used to identify regions that may be more vulnerable to SWI, and a region with higher vulnerability has greater potential for SWI [3,20,21,22,26]. A map visualizing the spatial distribution of the GALDIT results can help decision-makers take appropriate action to promote the sustainability of coastal groundwater resources. As an overview, Figure 2 shows a flowchart for the process of the GALDIT estimation method.
2.2.2. GALDIT Indexing of Parameters for Jeju Island
Table 1 presents the general assessment guidelines for the GALDIT parameters and a detailed explanation for each index. Each parameter value range is subdivided into four groups according to the specified characteristics of the site, and the relative significance of the variable is determined during the vulnerability assessment. This table provides the weight, variable range, and importance rating of the individual parameters.
Groundwater occurrence (G): The groundwater occurrence or aquifer type has a considerable effect on the degree of SWI [35]. A confined aquifer is given the highest weight among the aquifer types. As this study was on the unconfined aquifers of Jeju, all areas were assigned an importance rating of 7.5.
Aquifer hydraulic conductivity (A): The magnitude of the intrusion into an aquifer is affected by the hydraulic conductivity of the aquifer. At a higher aquifer hydraulic conductivity, the saltwater front penetrates further inland. Chang et al. [2] performed a SWI sensitivity test by using a cross-sectional simplified model and showed that the saltwater wedge is placed more deeply in an aquifer with higher hydraulic conductivity. Regions with hydraulic conductivity greater than 40 m/day were given the highest vulnerability rating, while regions with hydraulic conductivity of less than 5 m/day were given the lowest vulnerability rating (Table 1).
Height of the groundwater level above sea level (L): An aquifer with freshwater high above sea level has a low possibility of SWI; because the parameter is dynamic, the long-term temporal variation in the groundwater level should be considered. Previous studies have shown that a region with a groundwater level greater than 2 m should be given the lowest vulnerability rating, while a region with a groundwater level less than 1 m should be given the highest vulnerability rating. In this study, the range was modified; a region with a groundwater level greater than 2 m was given the lowest vulnerability rating, while a region with a groundwater level less than 0 m was given the highest vulnerability rating (Table 1).
Distance inland perpendicular from the shoreline (D): The effect of SWI generally decreases away from the shoreline. Lobo-Ferreira and Chachadi [21] determined that the distance inland perpendicular from the shoreline and height of the groundwater level above sea level are the parameters with the greatest effect on the SWI potential and gave them a maximum weight of 4. In this study, a region more than 1000 m from the shoreline was given a rating of 2.5 (i.e., lowest vulnerability rating), while a region with a distance less than 500 m was given a rating of 10.0 (i.e., highest vulnerability rating) (Table 1).
Impact of existing seawater intrusion in the area (I): This parameter considers the existing occurrence of SWI. The molar ratio of chloride ions to bicarbonate ions (Cl−/[HCO + CO3]) is used as a measure of the degree of seawater intrusion into a coastal aquifer in standard GALDIT studies [4,20,21,26]. In this study, instead of the molar ratio or Cl− concentration, electrical conductivity (EC) was adopted as a GALDIT index parameter because EC data is currently being collected by a groundwater monitoring network in Jeju. The EC of water, which is controlled by the concentration of dissolved ions, shows how well the groundwater conducts electricity. Sherif et al. [36] showed an empirical relationship between the observed chloride ion concentration data and EC data of collected water samples to delineate SWI in Wadi Ham, UAE.
In this study, EC data were used to evaluate the salinity of the monitoring wells providing the time-series EC data. In inland South Korea, the seawater intrusion monitoring well network (SIMN) provides chemical analysis data including the molar ratio by taking water quality samples periodically. To verify the appropriateness, the molar ratio, Cl− concentration, and EC data acquired in a domestic SWI study [36] from the SIMN were correlated and are plotted in Figure 3. If the molar ratio is 1 or smaller, the water is considered freshwater in the GALDIT method. In the regions affected by SWI, the EC value increased with the molar ratio, and the Cl− concentration showed an approximately linear correlation with the EC when the Cl− concentration is less than approximately 500 mg/L, which is the range threshold suggested by Recinos et al. [26]. The EC range of freshwater provided by the Ministry of Agriculture, Food and Rural Affairs and Korea Rural Community Corporation was less than 1000 µS/cm [37], which is consistent with the results shown in Figure 3. Considering the effect on the crops, water with an EC range of 0–20,000 µS/cm was considered to be water that can be used for all agricultural products in South Korea. In the present study, the GALDIT index was set to 2.5 for EC values below 1000 µS/cm, 5 for values between 1000 and 2000, 7.5 for values between 2000 and 4000, and 10 for values over 3000. As far as we know, this is the first attempt to obtain the correlations between molar values of chloride and bicarbonates ions versus EC data in a GALDIT assessment.
Thickness of the aquifer (T): This parameter represents the thickness of a saturated aquifer. A thicker aquifer is affected by SWI more than a thinner aquifer. In this study, the thickness of the aquifer was defined as the distance from the groundwater level to the bottom of the basalt aquifer (or top elevation of the Seogwipo Formation). A region with an aquifer thickness greater than 10 m was given the highest vulnerability rating, while a region with a thickness less than 5 m was given the lowest vulnerability rating (Table 1).
3. Results
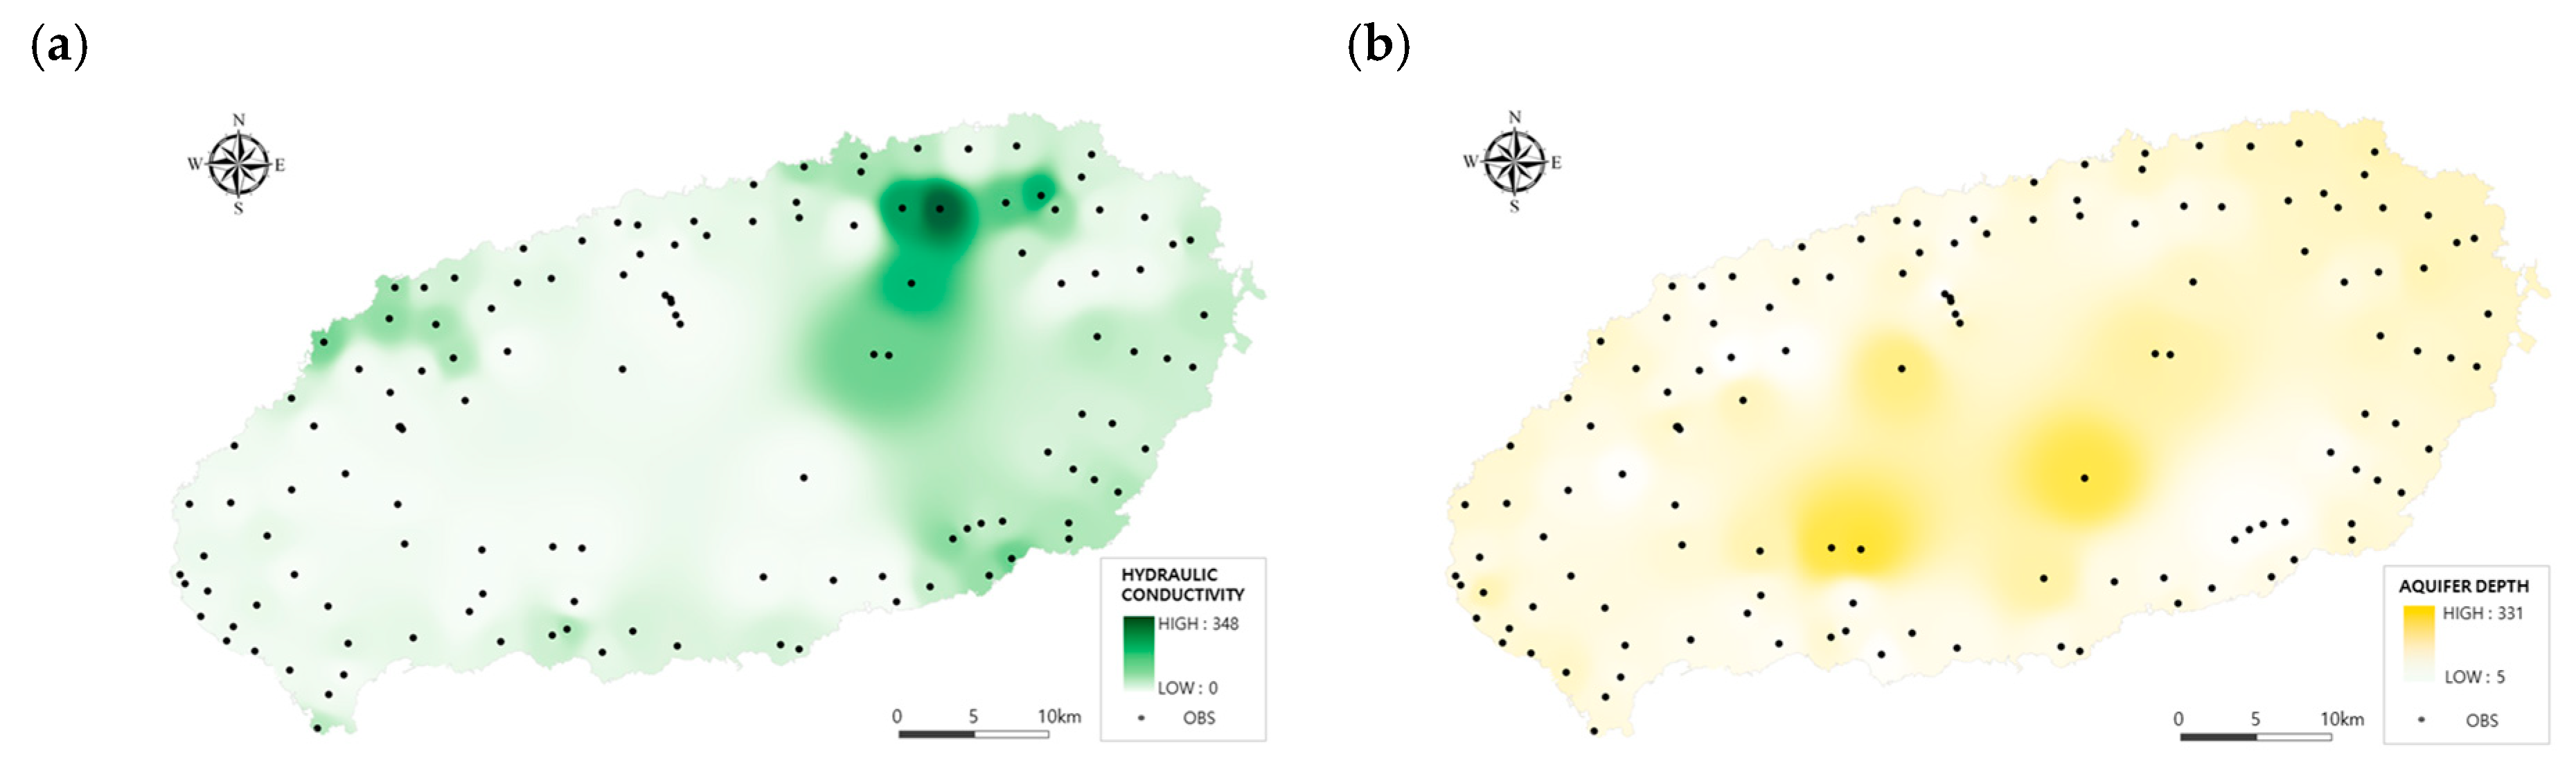
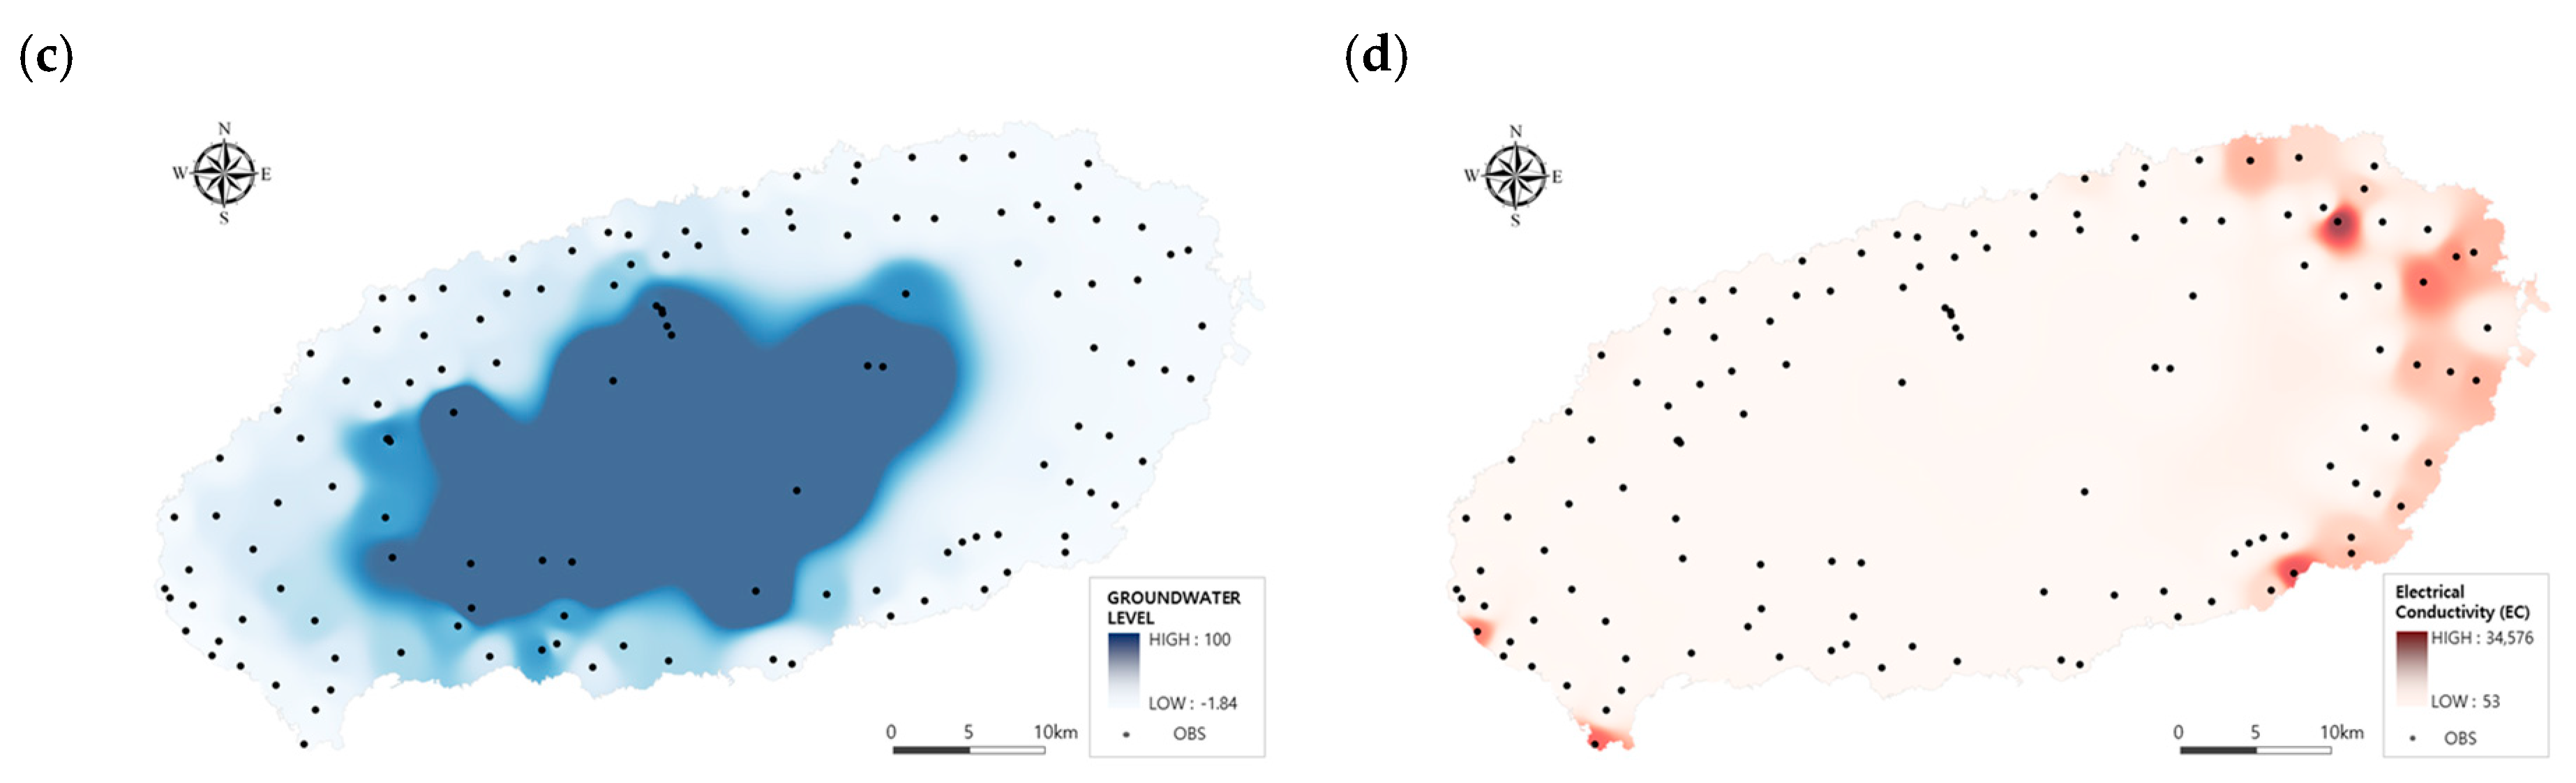
Figure 4 shows the spatial distributions of the GALDIT parameters representing the SWI in 2015: (a) hydraulic conductivity, (b) aquifer depth, (c) height of the groundwater level above sea level, and (d) EC values. Figure 4a shows that the spatial distribution of the hydraulic conductivity ranged between 0.1 and 380 m/day, which corresponds to importance ratings of 2.5–10 for parameter (A). At the center of the island, the hydraulic conductivity tended to decrease with increasing altitude. Figure 4b shows a map of the aquifer depth distribution up to 330 m, which corresponds to importance ratings of 2.5–10 for parameter (T). Approximately 95% of the area has an aquifer depth greater than 10 m. Figure 4c shows that the spatial distribution of the annual average groundwater level (L) above sea level ranged between −2 and 360 m, which corresponded to importance ratings of 2.5–10. Approximately 18% of the area had a groundwater level less than 1 m, and 4% of the area had a groundwater level below the mean sea level. The northern and southern areas had high groundwater levels and rapidly formed hydraulic slopes near the coast because of topographic influences. Figure 4d shows that the spatial distribution of the annual average EC ranged between 37 and 44,500 µS/cm, which corresponded to importance ratings of 2.5–10 for parameter (I). Approximately 84% of the area had a salinity level of less than 1000 µS/cm, which implies a relatively safe level for agriculture. Only around 6% of the monitoring wells had EC values between 1000 and 4000 µS/cm, which may be because this range of EC corresponds to a very narrow realm of the mixing zone constituting the boundary between the groundwater and seawater. Consequently, most areas in Jeju were assigned an importance rating of either 2.5 or 10 and showed a very clear distinction in the existing SWI.
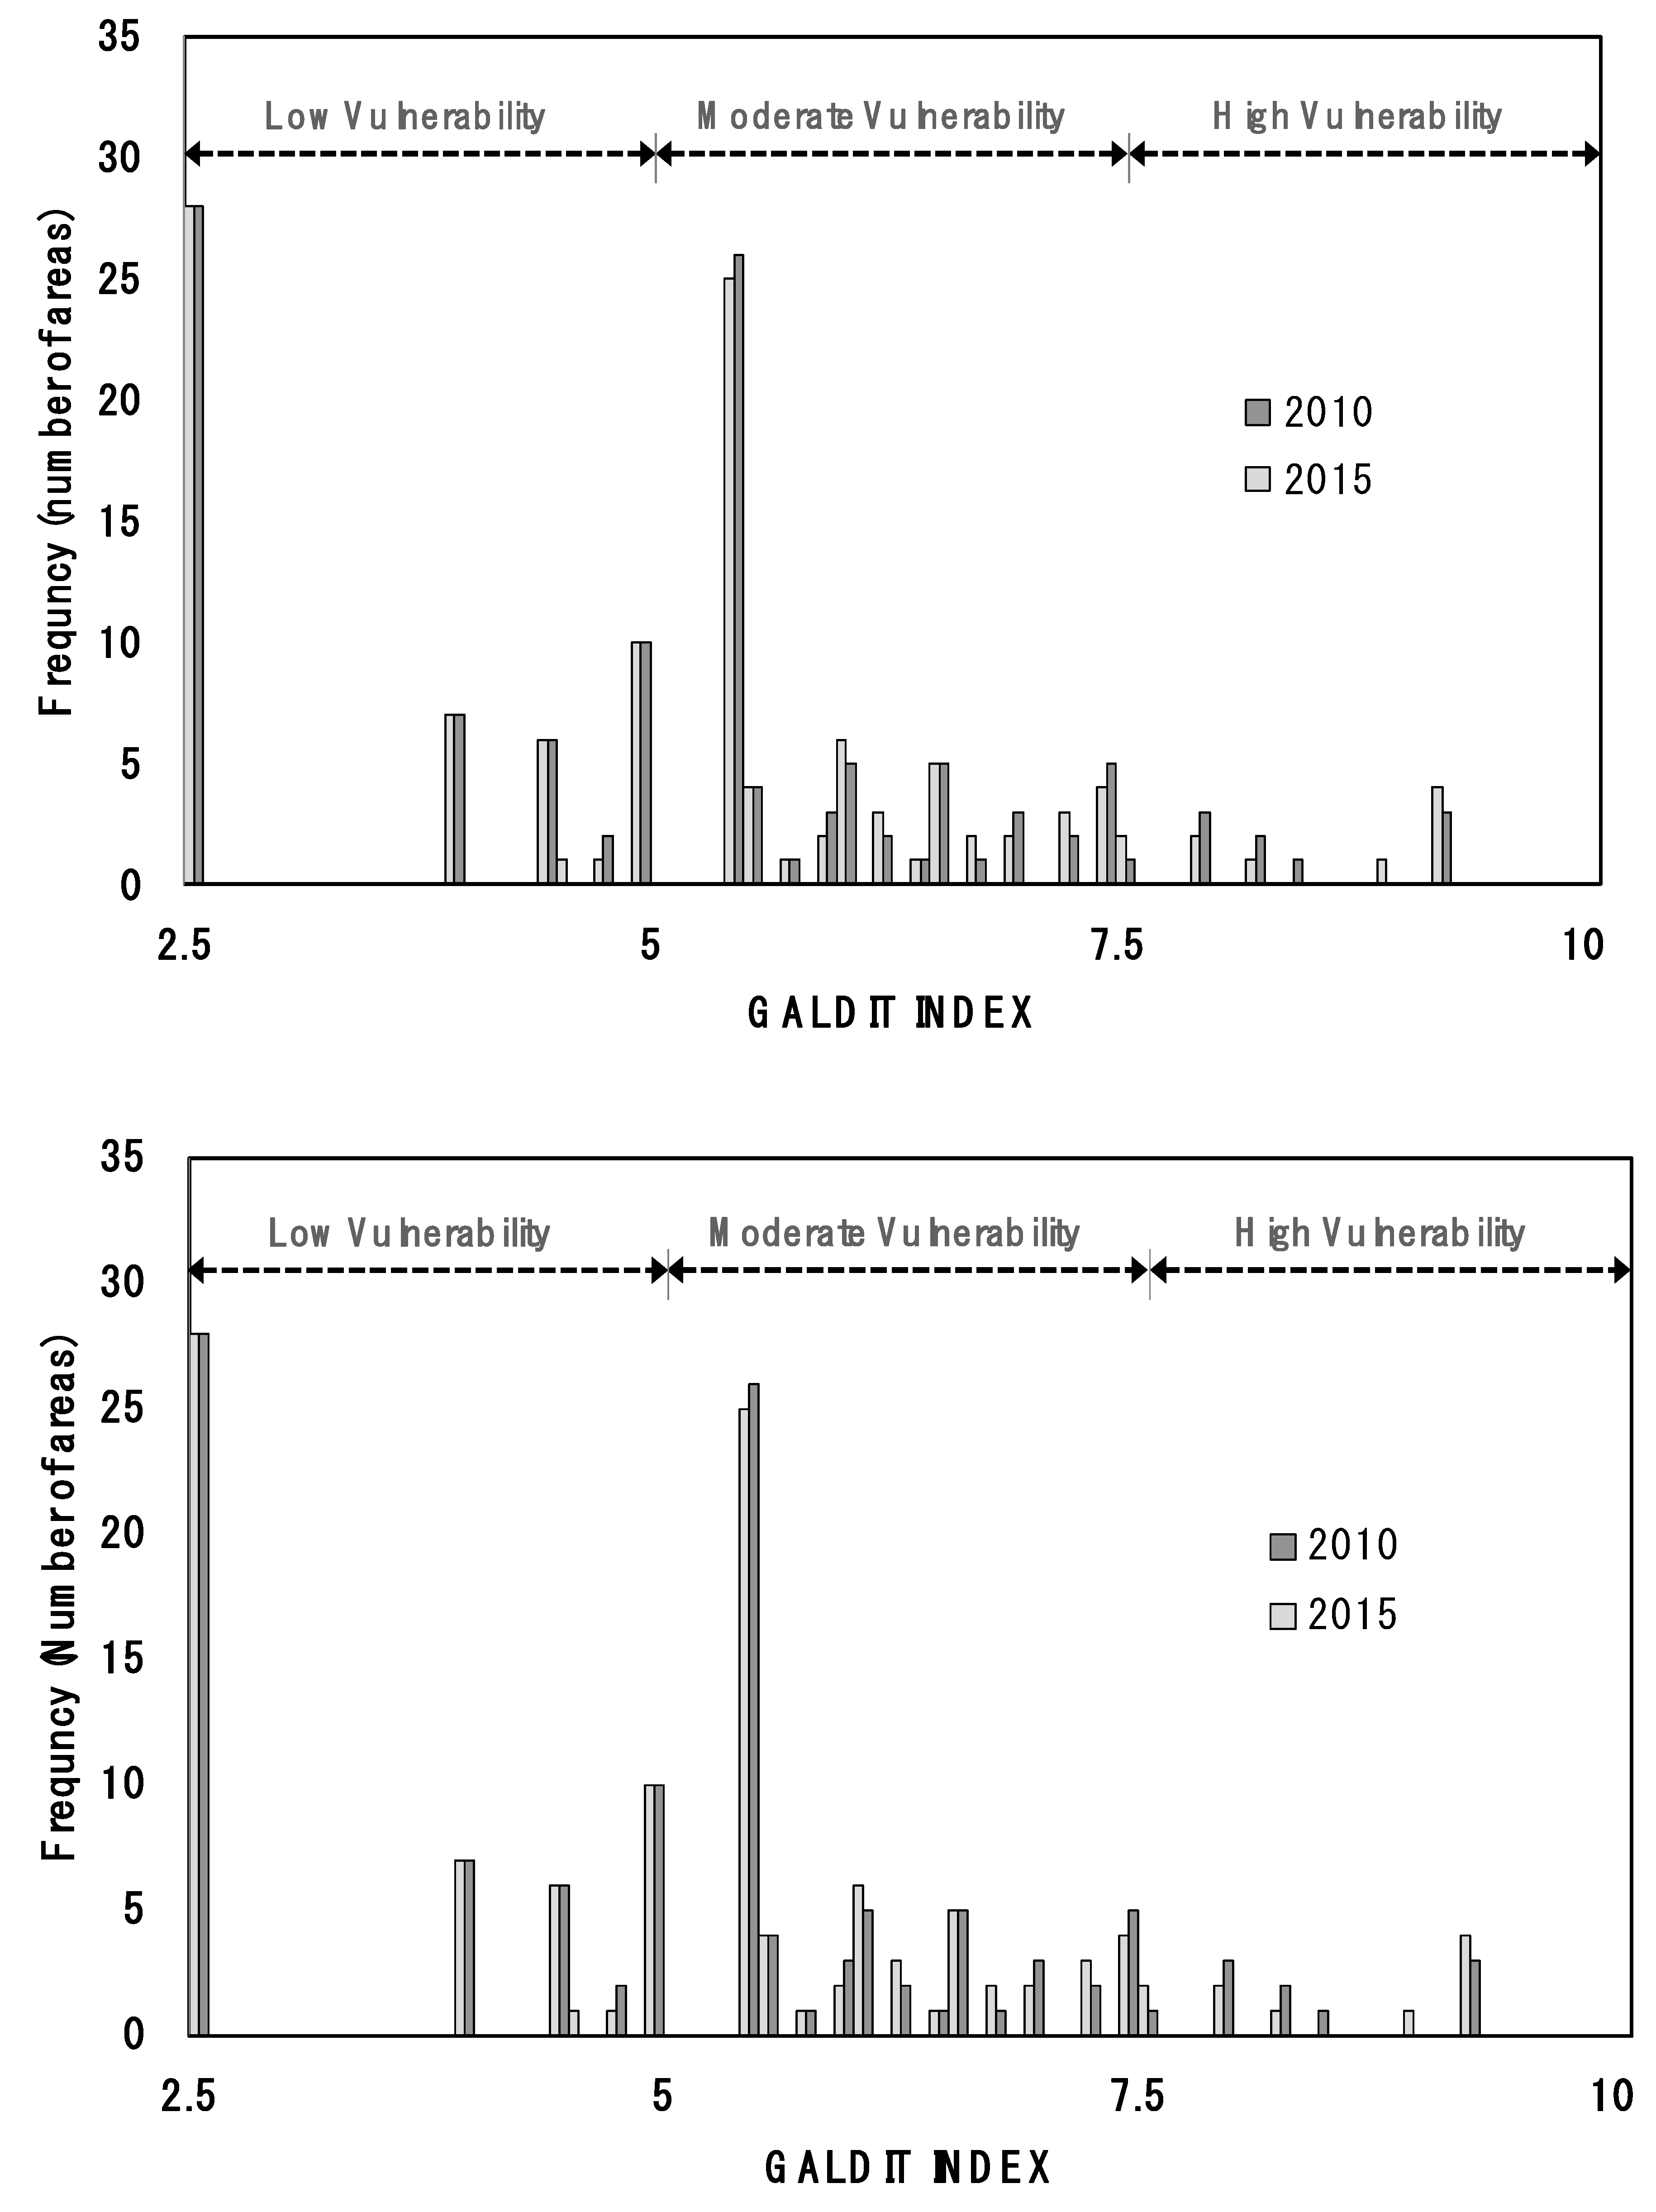
Figure 5 shows a histogram comparing the GALDIT results from 121 locations collected during October 2015 with those collected during October 2010. The GALDIT values from the 121 locations ranged between 4.0 and 10.0. Some locations were assigned the lowest index value of 2.5 because the bottom elevations of these unconfined layers were located at a higher altitude than sea level, so the risk of SWI was completely eliminated. Wells assigned a value of 2.5 were generally on the central slopes of Mt. Halla or in the southern part of the island. When GALDIT values from 2010 and 2015 were compared, no change in vulnerability in areas with values of 2.5–5.3 was observed over the five-year period. Areas with a value of 5.3 appeared most frequently; this value was yielded in cases where the hydraulic conductivity was at least 40 m/day, the aquifer depth was at least 10 m, the water level was at least 2 m, the distance from the shoreline was at least 1000 m, and the EC value was up to 1000 µS/cm. Data from 2010 and 2015 shows that approximately 43.8% of areas could be classified as low vulnerability, 47.9% could be classified as moderate vulnerability, and 8.2% could be classified as high vulnerability. At five locations between 2010 and 2015, the GALDIT value rose to an average of approximately 0.7 between 2010 and 2015, without any change in vulnerability status. At three locations, the GALDIT values fell to an average of approximately 0.56 without any change in vulnerability status. The Mureung area was in the high vulnerability group and yielded a higher vulnerability in 2015 than in 2010; this is discussed in detail later.
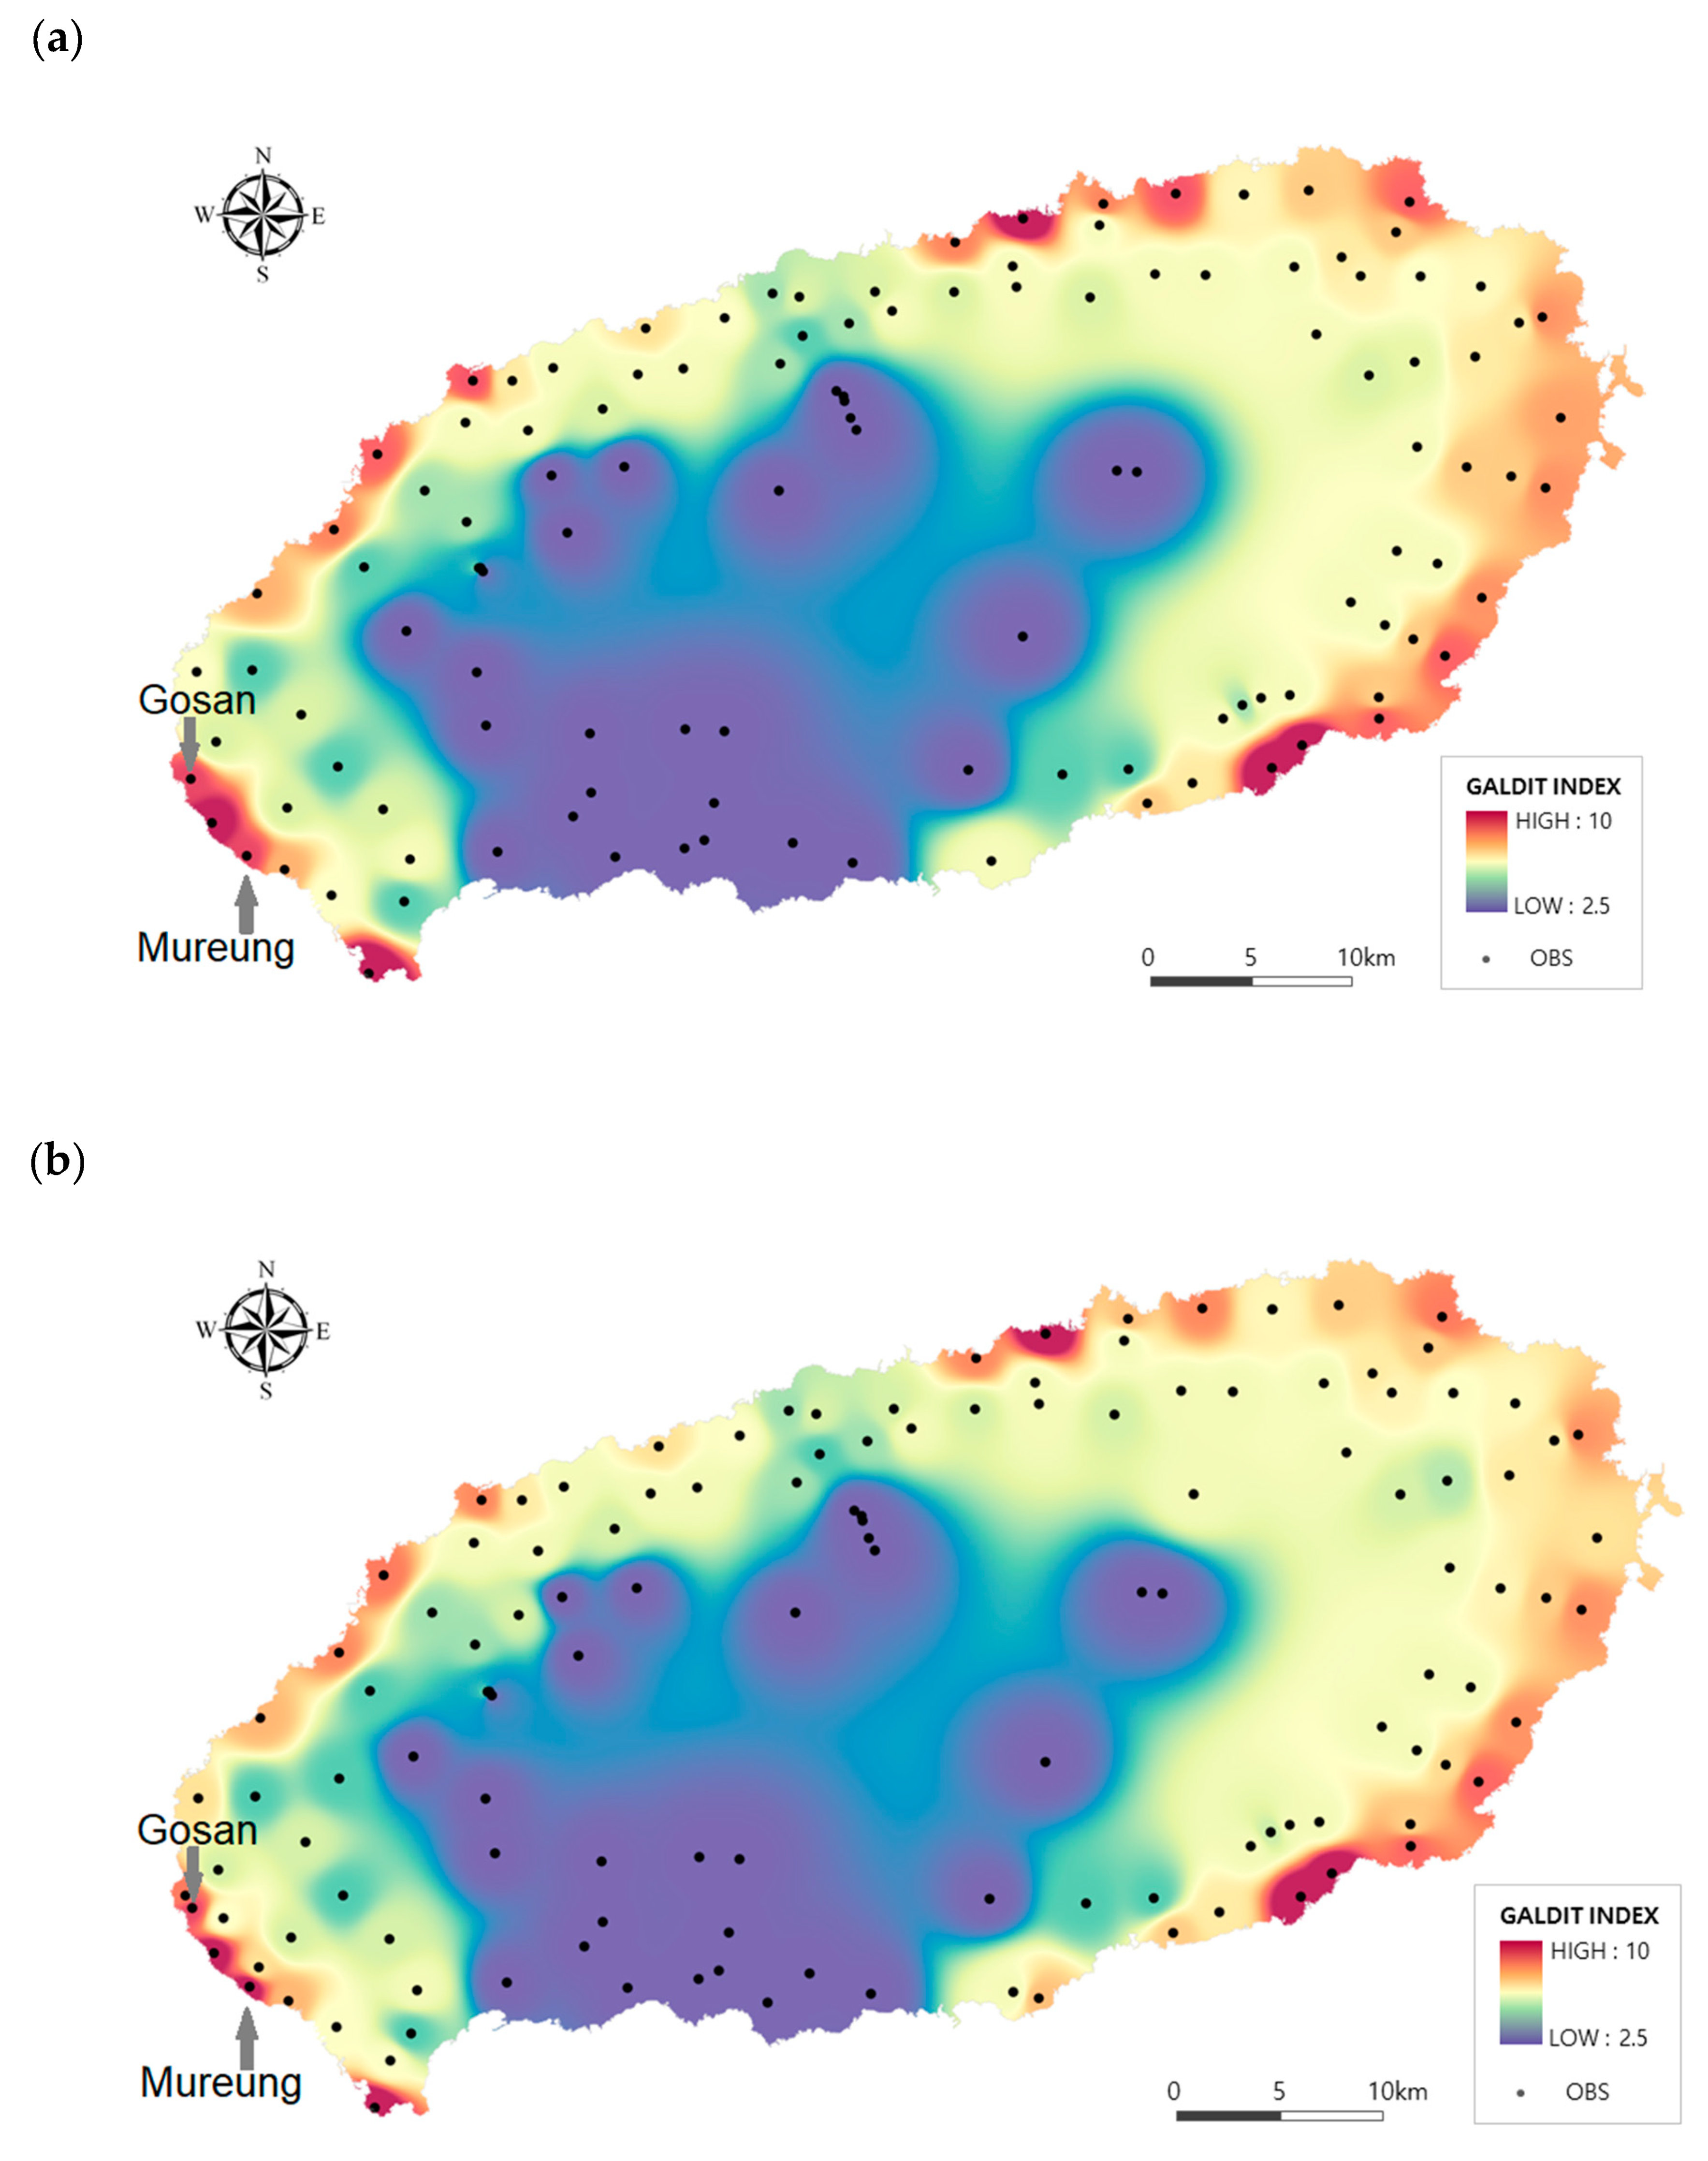
Figure 6a is a spatial map of the modified GALDIT indices calculated using input data from observations at 121 monitoring wells in 2010. Figure 6b is a similar map created using input data from observations at 130 wells in 2015. The Jeju provincial government is continually installing new monitoring wells in order to reinforce its groundwater monitoring network. The maps of the GALDIT assessment results show the spatial distribution of the vulnerability to SWI. Both maps clearly reveal the characteristics of SWI vulnerability on Jeju Island. They show high vulnerability across a wide area of the eastern part of the island; the high vulnerability in the western part of the island was limited to a smaller area. The western areas with high vulnerability in 2015 were narrower than in 2010 because of the increased data, which enabled more precise interpolation with the newly installed monitoring wells. Areas that were forcibly assigned a value of 2.5 because their base was located above sea level were excluded, and the distribution of GALDIT values was calculated based on groundwater level observations and EC data from Jeju Island’s monitoring network. Together with hydrogeological data, the distribution maps showed a minimum index value of 3.8. Most areas classified as low vulnerability (3.8–5) were located in the central mountainside areas. Index values of 7.5 and above were generally concentrated in the western and eastern parts of the island. Locations with a high vulnerability were distributed across a wide area in eastern Jeju Island. Overall, high vulnerability was observed in Jeju Island’s eastern catchment area and on the coast, where the altitude is low, and the hydraulic conductivity is high. Mountainous areas showed low vulnerability because of the high altitude and low hydraulic conductivity. The distribution of EC data, which indicated whether SWI actually occurred, showed that high EC was not detected in most areas of western Jeju Island. However, GALDIT analysis indicated high vulnerability along the southwestern coast of the island. This was because the groundwater level dropped below sea level; these areas showed excessive use of groundwater for agriculture. During periods in which crop cultivation coincided with drought, salinity was detected at some groundwater wells while water was being drawn, which frequently resulted in crop damage. Outside such periods, however, the EC values were generally not particularly high. The detection of salinity when water is drawn can be seen as the result of temporary upconing. Upconing is a different form of SWI from lateral intrusion of SWI that is rather slow or static intrusion and is calculated with the Ghyben–Herzberg relationship. The local government is attempting to introduce measures in response to the detection of salinity in these areas by upconing. Here, more than anywhere else, the vulnerability of coastal groundwater due to anthropogenic activity is becoming a problem. Although the GALDIT results in this study do not show that existing SWI is having a strong impact, they do show intrinsic SWI vulnerability where intrusion is possible.
The difference in groundwater vulnerability between 2010 and 2015 was not substantial, and differences appeared only in some specific southwestern areas of the island. The arrow on the map in the southwestern part of Jeju Island indicates an area where the increase in vulnerability was particularly notable. In the following section, we offer an analysis of the GALDIT outcomes for this high-vulnerability location, which was undergoing long-term changes according to the temporal monitoring data.
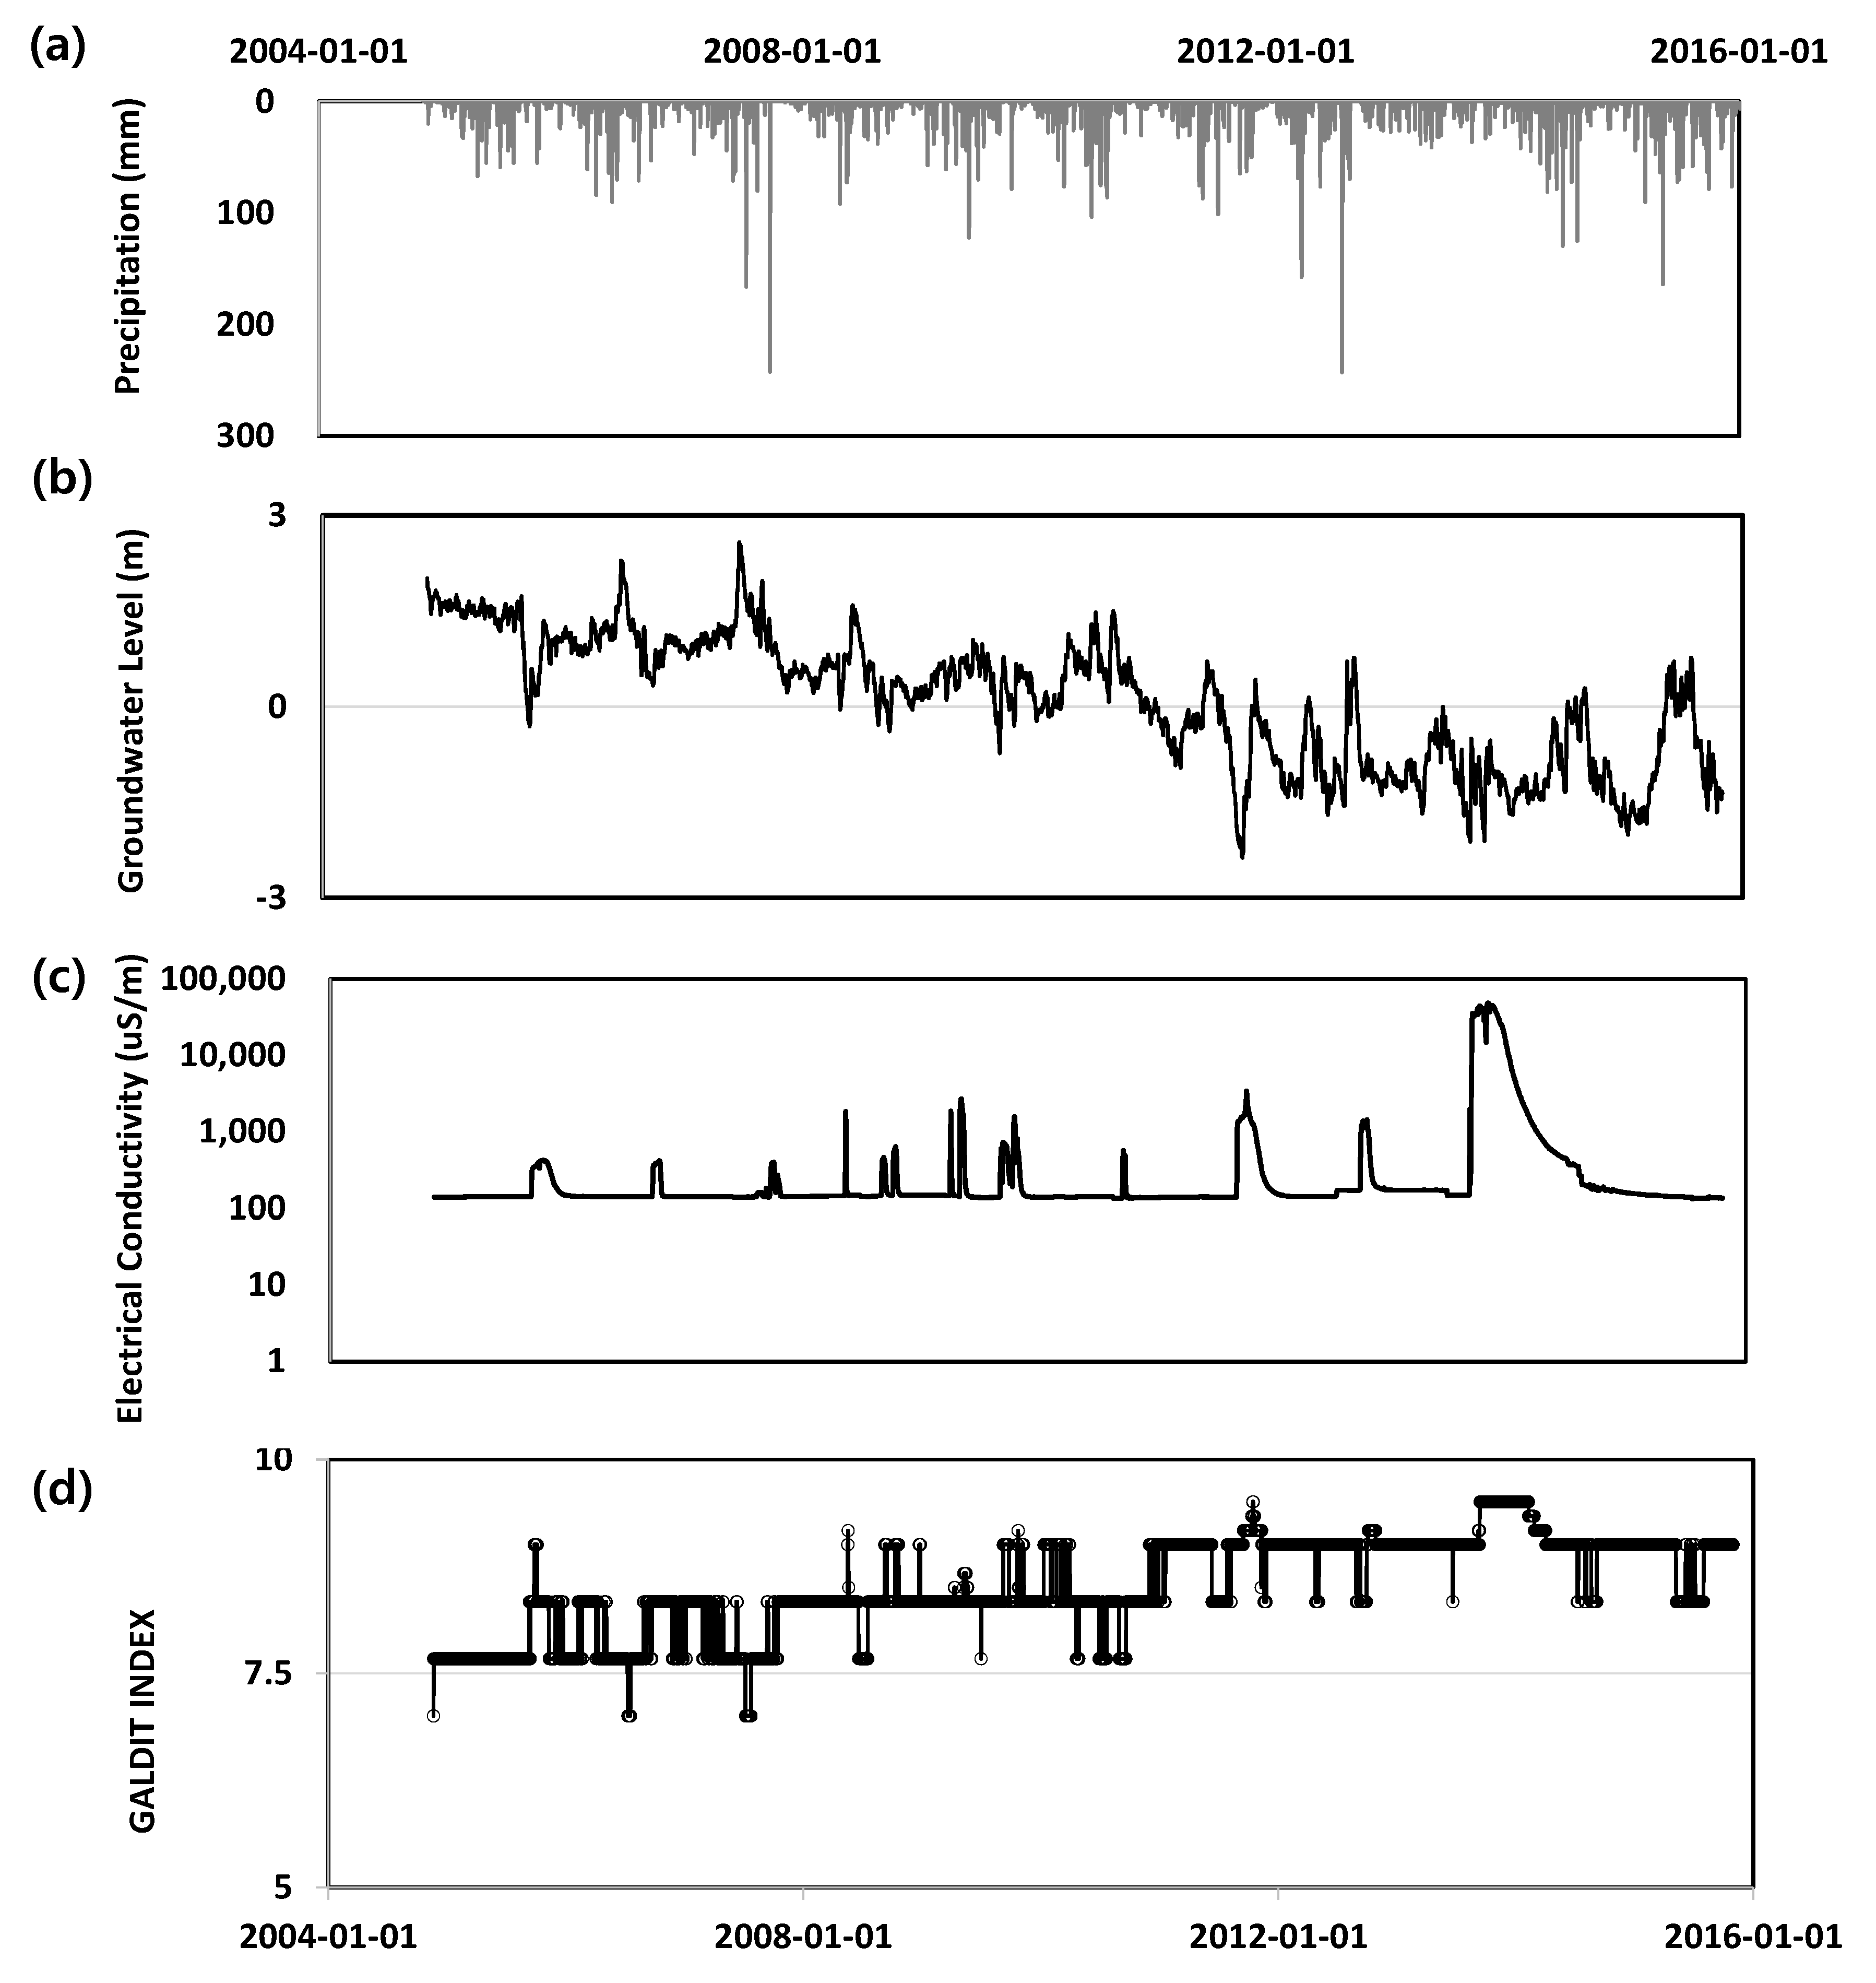
Figure 7 shows data gathered from the Mureung area in southwestern Jeju Island on a daily basis. Concerns about SWI emerged relatively early in this area, which prompted the installation of a monitoring well. Figure 7a shows the precipitation trends in the Mureung area and indicates very low rainfall levels due to a drought in 2013, and Figure 7b shows groundwater monitoring data in Mureung. The groundwater level varied in response to the precipitation. In the long term, the groundwater level has fallen continuously since monitoring began in November 2004 and fell below the mean sea level around 2012. Since then, it has only risen to positive values intermittently during wet seasons with high rainfall. The groundwater level has continued falling since 2013 despite abundant rainfall during this time. Figure 7c shows EC monitoring data that represents the seasonal stress, shown by higher peaks. In order to reflect changes in precipitation and the resulting seasonal stress, we graphed the results of the GALDIT assessment (Figure 7d). The GALDIT assessment showed that the major reason for shifts to higher values was the long-term decline in the groundwater level, while the EC trends were rather site-specific. Since the GALDIT assessment method in this study changed the highest rating of groundwater level criteria from less than 1 m to less than 0 m, the long-term trend of GALDIT clearly indicates an increase in aquifer vulnerability. Even though this is actually an area with a long-term increase in vulnerability, it has sometimes risen to positive values intermittently during wet seasons with high rainfall. It should be also noted that small changes in groundwater level brought the average groundwater level across the range thresholds (0 m, 1 m, and 2 m). This outcome shows that the GALDIT method is by nature liable to misinterpretation because the ranges used in assigning importance ratings are not continuous but change discretely.
4. Discussion
Jeju is a relatively large volcanic island that has hydrogeological heterogeneity. A vulnerability assessment of the whole area, which compares different areas of the island, is needed by the government and society to support coastal water resource management. Seawater intrusion (SWI) is a concern for the coastal groundwater management of Jeju Island. Droughts occurred in Jeju Island in 2009, 2011–2013, and in the summer and fall of 2017. The lowest groundwater levels since records began occurred in December 2017 because the cumulative rainfall from January to November 2017 was only 77% of the annual average; only 52% of the previous year’s rainfall occurred on the upper slopes of Mt. Halla, which is the island’s main groundwater recharge area.
In the southwestern part of Jeju Island, excessive salinity was detected in several agricultural groundwater sources, which led to their temporary shutdown. Demand has been growing to investigate the current status of SWI and prepare appropriate countermeasures so that a general policy regarding the water resources of Jeju Island can be formulated. The GALDIT model with GIS mapping techniques was used to identify regions vulnerable to various types of seawater intrusion. This study improved the method to fit the Jeju Island model by exploring the possibility of electrical conductivity instead of GALDIT standard parameters. As per our knowledge, this is the first GALDIT study to use electrical conductivity data collected from monitoring wells in Korea and the conversion between three different parameters representing the impact of SWI could be widely used for other vulnerability studies, including numerical model simulations, as well as index-based approaches. In addition, the ranges of the groundwater parameters obtained from daily and monthly monitoring data were modified since groundwater levels falling below sea level were considered strong evidence of increasing vulnerability to anthropogenic activities.
Overall, the GALDIT assessment of Jeju Island showed sustainable groundwater management with mid- to long-term vulnerability in most areas. However, the southwestern areas clearly indicated that a long-term decrease in the groundwater level was increasing the vulnerability to SWI. Another concerning area in southwestern Jeju, Gosan, also recently showed a continuous decrease in groundwater level and seasonal SWI since 2017. Thus, new areas vulnerable to seawater intrusion could appear.
This study has the following implications. First, a large high-altitude area at the center of the island with a steep slope to the coast was classified as having almost no risk of seawater intrusion. In the visualization of the vulnerability assessment results, areas where the vulnerability assessment could not be done properly were cropped from the map, and default values were provided instead. As a result, the spatial distribution of the GALDIT values could be observed on a complete island-shaped map. The method used in this study can provide a reference for many volcanic islands where the elevation of the terrain and groundwater level are high enough that there is no need for a vulnerability assessment and there are few monitoring wells. As shown in this study, the GALDIT method should be modified in line with the topographic features of the area, and a relevant guide should be prepared for follow-up studies. Second, the GALDIT method was applied to examine not only the spatial distribution of the study site but also the temporal variations of specific sites. The GALDIT method will become a more useful assessment tool if the visualization and data provision are improved.
The application of the SWI vulnerability method based on numerical ranking will be extended because the analytical method is familiar, the method is not limited by the scale or scope of the study, and the method is free from the difficulties involved with boundary conditions. The rapidly growing number of monitoring wells on Jeju Island mean that the accumulated data will gradually contribute to the future improvement of the GALDIT method to describe the regional characteristics. During this process, we should also try to improve the application of the GALDIT method to correspond with the characteristics of Jeju Island. First, the Jeju Island government has gradually installed new multi-depth monitoring systems or has performed multi-depth monitoring at some existing monitoring wells since 2015. Currently, the GALDIT method does not consider the monitoring depth of the acquired EC (or chloride or molar ratio) data. Therefore, methods of using data collected from multi-depth monitoring wells should be discussed in order to apply time-series data after 2015 to the GALDIT method. Second, the hydraulic conductivity of a monitoring site used in this study cannot fully represent a large area because of the high geological heterogeneity of Jeju Island. The amount of hydraulic conductivity data collected and analyzed throughout Jeju Island in previous studies on the geological structure and hydraulic conductivity far exceeds the number of monitoring wells. If the amount of acquired data differs for each parameter, more reliable GALDIT assessment results will be obtained by introducing a usage method for parameters with a vast amount of data.
Finally, as Gogu and Dassargues [38] suggested, new research on vulnerability assessments should be conducted that develop dynamic links between numerical models and overlay and index methods. Although almost 20 years have passed since Gogu and Dassargues [38] study, there have been no clear outcomes in terms of linking numerical and overlay and index approaches. The previous study by El-Kadi et al. [30] was the first numerical study for the whole of Jeju Island to assess the sustainability of the water resources that compared the overall groundwater levels based on simulated and observed data. These models showed a good match when the groundwater level was higher than 2 m, which was far from the coastal regions. However, discrepancies occurred between observed and simulated results when the groundwater level was less than 2 m. In Jeju Island, most seawater intrusion occurs where groundwater levels are less than 2 m, which comprises a large proportion of the area. Moreover, in the GALDIT model, 2 m is an important level for determining the risk of seawater intrusion. Unfortunately, El-Kadi [30] only modeled the saline distribution for the eastern Jeju watershed and Jung et al. [33] only considered low levels of ion concentration for springs in coastal areas. Therefore, this study is the only one to consider the saline distribution for the entire island.
Author Contributions
Conceptualization, S.-W.C. and G.-W.K.; methodology, M.T.; validation, S.-W.C., M.-G.K. and M.T.; investigation, M.T. and S.-W.C.; resources, G.-W.K.; data curation, M.-G.K.; writing—original draft preparation, S.-W.C.; writing—review and editing, S.-W.C. and I.-M.C.; visualization, S.-W.C.; supervision, I.-M.C.; project administration, I.-M.C.; funding acquisition, G.-W.K.
Funding
This work was supported by a grant (19RDRP-B076272-05) from the Infrastructure and Transportation Technology Promotion Research Program funded by the Ministry of Land, Infrastructure, and Transport of Korean government.
Conflicts of Interest
The authors declare no conflicts of interest.
References
- US Geological Survey. Ground-Water Resources for the Future—Atlantic Coastal Zone; US Geological Survey: Reston, VA, USA, 2000.
- Chang, S.W.; Clement, T.P.; Simpson, M.J.; Lee, K.-K. Does sea-level rise have an impact on saltwater intrusion? Adv. Water Resour. 2011, 34, 1283–1291. [Google Scholar] [Green Version]
- Moghaddam, H.K.; Jafari, F.; Javadi, S. Vulnerability evaluation of a coastal aquifer via GALDIT model and comparison with DRASTIC index using quality parameters. Hydrol. Sci. J. 2017, 62, 137–146. [Google Scholar] [CrossRef]
- Kura, N.U.; Ramli, M.F.; Ibrahim, S.; Sulaiman, W.N.A.; Aris, A.Z.; Tanko, A.I.; Zaudi, M.A. Assessment of groundwater vulnerability to anthropogenic pollution and seawater intrusion in a small tropical island using index-based methods. Environ. Sci. Pollut. Res. 2015, 22, 1512–1533. [Google Scholar] [CrossRef]
- Barlow, P.M.; Reichard, E.G. Saltwater intrusion in coastal regions of North America. Hydrogeol. J. 2010, 18, 247–260. [Google Scholar] [CrossRef]
- Ivkovic, K.M.; Marshall, S.K.; Morgan, L.K.; Werner, A.D.; Carey, H.; Cook, S.; Sundaram, B.; Norman, R.; Wallace, L.; Caruana, L.; et al. A National Scale Vulnerability Assessment of Seawater Intrusion: Summary Report; National Water Commission: Canberra, Australia, 2012. [Google Scholar]
- Fahs, M.; Ataie-Ashtiani, B.; Younes, A.; Simmons, C.T.; Ackerer, P. The Henry problem: New semi-analytical solution for velocity-dependent dispersion. Water Resour. Res. 2016. [Google Scholar] [CrossRef]
- Oude Essink, G.H.P.; van Baaren, E.S.; de Louw, P.G.B. Effects of climate change on coastal groundwater systems: A modeling study in the Netherlands. Water Resour. Res. 2010, 46. [Google Scholar] [CrossRef]
- Praveena, S.M.; Aris, A.Z. Groundwater resources assessment using numerical model: A case study in low-lying coastal area. Int. J. Environ. Sci. Technol. 2009, 7, 135–146. [Google Scholar] [Green Version]
- Shao, Q.; Fahs, M.; Hoteit, H.; Carrera, J.; Ackerer, P.; Younes, A. A 3-D semianalytical solution for density-driven flow in porous media. Water Resour. Res. 2018, 54. [Google Scholar] [CrossRef]
- Sulzbacher, H.; Wiederhold, H.; Siemon, B.; Grinat, M.; Igel, J.; Burschil, T.; Günther, T.; Hinsby, K. Numerical modelling of climate change impacts on freshwater lenses on the North Sea Island of Borkum using hydrological and geophysical methods. Hydrol. Earth Syst. Sci. 2012, 16, 3621–3643. [Google Scholar] [CrossRef] [Green Version]
- Younes, A.; Fahs, M. A semi-analytical solution for saltwater intrusion with very narrow transition zone. Hydrogeol. J. 2014, 22, 501–506. [Google Scholar] [CrossRef]
- Strack, O.D.L. A single-potential solution for regional interface problems in coastal aquifers. Water Resour. Res. 1976, 12, 1165–1174. [Google Scholar] [CrossRef]
- Werner, A.D.; Ward, J.D.; Morgan, L.K.; Simmons, C.T.; Robinson, N.I.; Teubner, M.D. Vulnerability indicators of sea water intrusion. Groundwater 2012, 50, 48–58. [Google Scholar] [CrossRef] [PubMed]
- Morgan, L.K.; Werner, A.D. A national inventory of seawater intrusion vulnerability for Australia. J. Hydrol. Reg. Stud. 2015, 4, 686–698. [Google Scholar] [CrossRef] [Green Version]
- Aller, L.; Bennet, T.; Lehr, J.H.; Petty, R.J. DRASTIC: A Standardised System for Evaluating Groundwater Pollution Potential Using Hydrologic Settings; US EPA Report, 600/2–87/035; Robert, S., Ed.; Kerr Environmental Research Laboratory: Ada, OK, USA, 1987. [Google Scholar]
- Chachadi, A.G.; Lobo-Ferreira, J.-P. Sea water intrusion vulnerability mapping of aquifers using the GALDIT method. In Proceedings of the UNESCO-IHP Workshop on Modelling in Hydrogeology, Chennai, India, 3–7 December2001; Available online: http://www.teriin.org/teri-wr/coastin/newslett/coastin4.pdf (accessed on 29 August 2019).
- Civita, M. Le Carte Della Vulnerabilità Degli Acquiferi All’inquinamento (in Italian); Teoria and Practica Pitagora: Bologna, Italy, 1994. [Google Scholar]
- Van Stempvoort, D.; Ewert, L.; Wassenaar, L. Aquifer vulnerability index: A GIS-compatible method for groundwater vulnerability mapping. Can. Water Resour. J. 1993, 18, 25–37. [Google Scholar] [CrossRef]
- Yang, J.-S.; Kim, I.-H. Development of seawater intrusion vulnerability index using AHP. J. Korean Soc. Civ. Eng. 2015, 35. [Google Scholar] [CrossRef]
- Lobo-Ferreira, J.P.; Chachadi, A.G. Assessing aquifer vulnerability to seawater intrusion using Galdit method. Part 2GALDIT Indicators Description. In Proceedings of the 4th InterCeltic Colloquium on Hydrology and Management of Water. Water in Celtic Countries: Quantity, Quality, and Climate Variablity, Guimaraes, Portugal, 11–13 July 2005. [Google Scholar]
- Lobo-Ferreira, J.P.; Chachadi, A.G.; Diamantino, C.; Henriques, M.J. Assessing aquifer vulnerability to seawater intrusion using Galdit method. Part 1: Application to the Portuguese aquifer of Monte Gordo. In Proceedings of the 4th InterCeltic Colloquium on Hydrology and Management of Water. Water in Celtic Countries: Quantity, Quality, and Climate Variablity, Guimaraes, Portugal, 11–13 July 2005. [Google Scholar]
- Bouderbala, A.; Remini, B.; Saaed Hamoudi, A.; Pulido-Bosch, A. Assessment of groundwater vulnerability and quality in coastal aquifers: A case study (Tipaza, North Algeria). Arab. J. Geosci. 2016, 9, 181. [Google Scholar] [CrossRef]
- Luoma, S.; Okkonen, J.; Korkka-Niemi, K. Comparison of the AVI, modified SINTACS and GALDIT vulnerability methods under future climate-change scenarios for a shallow low-lying coastal aquifer in southern Finland. Hydrogeol. J. 2017, 25, 203–222. [Google Scholar] [CrossRef]
- Pedreira, R.; Kallioras, A.; Pliakas, F.-K.; Gkiougkis, I.; Schüth, C. Groundwater vulnerability assessment of a coastal aquifer system at River Nestos eastern Delta, Greece. Environ. Earth Sci. 2014, 73, 6387–6415. [Google Scholar] [CrossRef]
- Recinos, N.; Kallioras, A.; Pliakas, F.; Schuth, C. Application of GALDIT index to assess the intrinsic vulnerability to seawater intrusion of coastal granular aquifers. Environ. Earth Sci. 2015, 73, 1017–1032. [Google Scholar] [CrossRef]
- Trabelsi, N.; Triki, I.; Hentati, I.; Zairi, M. Aquifer vulnerability and seawater intrusion risk using GALDIT, GQISWI and GIS: Case of a coastal aquifer in Tunisia. Environ. Earth Sci. 2016, 75, 669. [Google Scholar] [CrossRef]
- Saidi, S.; Bouri, S.; Hassine, S.; Ben Dhia, H. Comparison of three applied methods of groundwater vulnerability mapping: Application to the coastal aquifer of Chebba–Mellouleche (Tunisia). Desalin. Water Treat. 2014, 52, 2120–2130. [Google Scholar] [CrossRef]
- Koh, G.W.; Park, J.B.; Moon, D.C. Geology and Groundwater Occurence of Volcanic Island; JPDC: Jeju, Korea, 2017. [Google Scholar]
- El-Kadi, A.I.; Tillery, S.; Whittier, R.B.; Hagedorn, B.; Mair, A.; Ha, K.; Koh, G.-W. Assessing sustainability of groundwater resources on Jeju Island, South Korea, under climate change, drought, and increased usage. Hydrogeol. J. 2014, 22, 625–642. [Google Scholar] [CrossRef]
- Harbaugh, A.; Banta, E.; Hill, M.; McDonald, M. MODFLOW-2000: The U.S. Geological Survey Modular Ground-Water Model User Guide to Modularization Concepts and the Ground-Water Flow Process; US Geological Survey: Reston, VA, USA, 2000.
- Guo, W.; Langevin, C.D. User’s Guide to SEWAT: A Computer Program for Simulation of Three-Dimensional Variable-Density Ground-Water Flow; US Geological Survey: Reston, VA, USA, 2002.
- Jung, Y.-Y.; Koh, D.-C.; Yu, Y.-J.; Ko, K.-S. Analysis of groundwater flow system for springs in the southern slope of Jeju Island using hydrogeochemical parameters. J. Geol. Soc. Korea 2010, 46, 253–273. [Google Scholar]
- K-Water. The Basic Groundwater Investigation in Jeju Region; K-Water: Daejeon, Korea, 2018. [Google Scholar]
- Sherif, M.M.; Hamza, K.I. Mitigation of seawater intrusion by pumping brackish water. Transp. Porous Media 2001, 43, 29–44. [Google Scholar] [CrossRef]
- Sherif, M.; Mahmoudi, A.E.; Garamoon, H.; Kacimov, A.; Akram, S.; Ebraheem, A.; Shetty, A. Geoelectrical and hydrogeochemical studies for delineating seawater intrusion in the outlet of Wadi Ham, UAE. Environ. Geol. 2006, 49, 536–551. [Google Scholar] [CrossRef]
- Korea Rural Community Corporation. Seawater Intrusion Estimation Report; No. 11-1543000-001105-10; Korea Rural Community Corporation: Naju-si, Korea, 2016. [Google Scholar]
- Gogu, R.; Dassargues, A. Current trends and future challenges in groundwater vulnerability assessment using overlay and index methods. Environ. Geol. 2000, 39, 549–559. [Google Scholar] [CrossRef]
Figure 1.
(a) Location of Jeju Island, Korea and (b) schematic crosscut of Jeju Island, modified from Koh et al. [29].
Figure 1.
(a) Location of Jeju Island, Korea and (b) schematic crosscut of Jeju Island, modified from Koh et al. [29].


Figure 2.
General flowchart for GALDIT method of seawater vulnerability assessment. GIS—geographic information systems; SWI—seawater intrusion.
Figure 2.
General flowchart for GALDIT method of seawater vulnerability assessment. GIS—geographic information systems; SWI—seawater intrusion.

Figure 3.
Comparison between (a) ratio of Cl−/HCO3− to electrical conductivity (EC) and (b) chloride ion (Cl−) to electrical conductivity for the seawater of Korea, provided by the Ministry of Agriculture, Food and Rural Affairs and Korea Rural Community Corporation [37].
Figure 3.
Comparison between (a) ratio of Cl−/HCO3− to electrical conductivity (EC) and (b) chloride ion (Cl−) to electrical conductivity for the seawater of Korea, provided by the Ministry of Agriculture, Food and Rural Affairs and Korea Rural Community Corporation [37].

Figure 4.
Spatial mapping of GALDIT parameters for (a) hydraulic conductivity, (b) aquifer depth, (c) groundwater level above sea, and (d) electric conductivity.
Figure 4.
Spatial mapping of GALDIT parameters for (a) hydraulic conductivity, (b) aquifer depth, (c) groundwater level above sea, and (d) electric conductivity.


Figure 5.
Histogram of GALDIT index distribution for the years 2010 and 2015.

Figure 6.
Modified GALDIT map considering anthropogenic activities for the years (a) 2010 and (b) 2015.
Figure 6.
Modified GALDIT map considering anthropogenic activities for the years (a) 2010 and (b) 2015.

Figure 7.
Temporal daily variation of GALDIT in the Mureung area for (a) precipitation, (b) groundwater level, (c) electrical conductivity, and (d) GALDIT index.
Figure 7.
Temporal daily variation of GALDIT in the Mureung area for (a) precipitation, (b) groundwater level, (c) electrical conductivity, and (d) GALDIT index.


Table 1.
Assessment guidelines for GALDIT parameters.
| Factor/Parameter | Weight | Standard GALDIT Factor Variables Range | Modified Factor Variables Range | Importance Rating |
|---|---|---|---|---|
| Groundwater occurrence (G) | 1 | Confined aquifer | Confined aquifer | 10 |
| Unconfined aquifer | Unconfined aquifer | 7.5 | ||
| Leaky confined aquifer | Leaky confined aquifer | 5 | ||
| Bounded aquifer | Bounded aquifer | 2.5 | ||
| Aquifer hydraulic conductivity (A) [m/day] | 3 | >40 | >40 | 10 |
| 10–40 | 10–40 | 7.5 | ||
| 5–10 | 5–10 | 5 | ||
| <5 | <5 | 2.5 | ||
| Height of groundwater level above sea level (L) [m] | 4 | <1.0 | <0 | 10 |
| 1.0–1.5 | 0–1.0 | 7.5 | ||
| 1.5–2.0 | 1.0–2.0 | 5 | ||
| >2.0 | >2.0 | 2.5 | ||
| Distance from the shore (D) [m] | 4 | <500 | <500 | 10 |
| 500–750 | 500–750 | 7.5 | ||
| 750–1000 | 750–1000 | 5 | ||
| >1000 | >1000 | 2.5 | ||
| Impact of existing status of seawater intrusion (I) | 1 | >2 (Ratio of (Cl−/HCO3)) | >3000 EC (uS/m) | 10 |
| 1.5–2.0 | 2000–3000 | 7.5 | ||
| 1–1.5 | 1000–2000 | 5 | ||
| <1 | <1000 | 2.5 | ||
| Saturated aquifer thickness (T) [m] | 2 | >10 | >10 | 10 |
| 7.5–10 | 7.5–10 | 7.5 | ||
| 5–7.5 | 5–7.5 | 5 | ||
| <5 | <5 | 2.5 |
© 2019 by the authors. Licensee MDPI, Basel, Switzerland. This article is an open access article distributed under the terms and conditions of the Creative Commons Attribution (CC BY) license (http://creativecommons.org/licenses/by/4.0/).
Share and Cite
MDPI and ACS Style
Chang, S.W.; Chung, I.-M.; Kim, M.-G.; Tolera, M.; Koh, G.-W. Application of GALDIT in Assessing the Seawater Intrusion Vulnerability of Jeju Island, South Korea. Water 2019, 11, 1824. https://doi.org/10.3390/w11091824
AMA Style
Chang SW, Chung I-M, Kim M-G, Tolera M, Koh G-W. Application of GALDIT in Assessing the Seawater Intrusion Vulnerability of Jeju Island, South Korea. Water. 2019; 11(9):1824. https://doi.org/10.3390/w11091824
Chicago/Turabian StyleChang, Sun Woo, Il-Moon Chung, Min-Gyu Kim, Mesfin Tolera, and Gi-Won Koh. 2019. "Application of GALDIT in Assessing the Seawater Intrusion Vulnerability of Jeju Island, South Korea" Water 11, no. 9: 1824. https://doi.org/10.3390/w11091824
Note that from the first issue of 2016, this journal uses article numbers instead of page numbers. See further details here.