Scaling up Microbial Fuel Cells for Treating Swine Wastewater


1
Division of Experimental, Japan Bioassay Research Center, Japan Organization of Occupational Health and Safety, Hadano, Kanagawa 257–0015, Japan
2
Department of Biomedical Science, Chubu University, Kasugai, Aichi 487–8501, Japan
3
Department of Civil Engineering, Nagoya Institute of Technology, Nagoya, Aichi 466–8555, Japan
*
Author to whom correspondence should be addressed.
Water 2019, 11(9), 1803; https://doi.org/10.3390/w11091803
Submission received: 23 July 2019
/
Revised: 24 August 2019
/
Accepted: 26 August 2019
/
Published: 29 August 2019
(This article belongs to the Special Issue Advances in Water and Wastewater Monitoring and Treatment Technology)
Abstract
:Conventional aerobic treatment of swine wastewater, which generally contains 4500–8200 mg L−1 of organic matter, is energy-consuming. The aim of this study was to assess the application of scaled-up microbial fuel cells (MFCs) with different capacities (i.e., 1.5 L, 12 L, and 100 L) for removing organic matter from swine wastewater. The MFCs were single-chambered, consisting of an anode of microbially reduced graphene oxide (rGO) and an air-cathode of platinum-coated carbon cloth. The MFCs were polarized via an external resistance of 3–10 Ω for 40 days for the 1.5 L-MFC and 120 days for the 12L- and 100 L-MFC. The MFCs were operated in continuous flow mode (hydraulic retention time: 3–5 days). The 100 L-MFC achieved an average chemical oxygen demand (COD) removal efficiency of 52%, which corresponded to a COD removal rate of 530 mg L−1 d−1. Moreover, the 100 L-MFC showed an average and maximum electricity generation of 0.6 and 2.2 Wh m−3, respectively. Our findings suggest that MFCs can effectively be used for swine wastewater treatment coupled with the simultaneous generation of electricity.
1. Introduction
Twenty-one million tons of swine manure (solid, liquid, and slurry) are produced annually in Japan [1]. Swine wastewater generally contains 4500–8200 mg L−1 of organic matter as biochemical oxygen demand (BOD) [2]. Swine wastewater is generally treated via activated sludge processes with aeration, which enhances microbial oxidation of organic matter. The electrical power consumption of aeration is 0.3 kWh m−3 and accounts for approximately two-thirds of the total power consumption [3,4]. Additionally, the operation of standard activated sludge processes is estimated to discharge 0.13–0.41 t-CO2 m−3 [5].
Anaerobic wastewater treatment such as methane fermentation has received considerable attention because of the advantages in energy conservation due to its aeration-free treatment and biogas-recovery from waste hydrocarbons [6]. The power generation efficiency of methane fermentation is in the range of 20–50% [7]. Additionally, the degradation of nitrogenous substances such as proteins and urea produces ammonia, which inhibits methane fermentation [8,9]. Furthermore, the residues remaining after methane fermentation of animal waste and wastewater have a high BOD and should therefore be treated before they are discharged to public waters [10].
Microbial fuel cells (MFCs) have received increasing attention as alternative anaerobic treatment systems due to their ability to convert organic matter into electricity. MFCs typically comprise one or two chambers, which have a platinum (Pt)-coated carbon cathode [11]. The electrons produced during microbial oxidization are transferred from the anode to the cathode for the reduction of oxygen in the air. Several single-chamber MFCs have been applied for the effective removal of organic matter from real wastewater with a chemical oxygen demand (COD) of 440–2250 mg L−1, such as domestic wastewater [12,13] and brewery wastewater [14,15] with the simultaneous generation of electricity. Furthermore, the electrons generated in the MFCs treating swine wastewater may be utilized for denitrification [16]. Many studies used small-scale MFCs (< 1 L) for treating various wastewaters, while the largest MFC treating swine wastewater was approximately 1.5 L [17]. Even larger MFCs (4.0–250 L) treating other real wastewaters, such as municipal wastewater [18,19,20] and brewery wastewater [21,22] have been reported. These large-scale MFCs were operated in continuous flow mode with hydraulic retention times (HRTs) of 0.2 h–13 d and could remove 52–88% of the initial COD content (50–5800 mg L−1) with electricity generation at a maximum of 0.12–6.0 W m−3. The scale of the MFC is expected to affect its performance. Generally, large-scale MFCs produce lower power densities due to the decrease in the ratio of electrode surface area to volume and the increase in the distance between the anode and cathode [23].
In this study, an MFC with a relatively small capacity (1.5 L) was used for swine wastewater treatment and subsequently scaled up to 12 and 100 L. The aim was to assess the application of scaled-up microbial fuel cells (MFCs) with different capacities (i.e., 1.5 L, 12 L, and 100 L) for removing organic matter from swine wastewater. A complex containing microbially reduced graphene oxide (rGO) and GO-reducing bacteria (rGO complex) was used as the anode material [24,25] for enhanced electricity generation from artificial dialysis wastewater and municipal sewage wastewater [26,27]. The performance parameters i.e., electricity production, COD removal efficiency (COD RE), and Coulombic efficiency of the different MFCs were compared.
2. Materials and Methods
2.1. Swine Wastewater Used as Influent
Effluent from the primary sedimentation tank of a swine wastewater treatment on a pig farm in Toyohashi, Japan was used as influent for the MFCs in this study. The swine wastewater was collected in a 20 L plastic bag and stored anaerobically in the laboratory at room temperature for MFC having 1.5L capacity (1.5 L-MFC). For MFC with 12 L capacity (12 L-MFC), the swine-wastewater was collected in a 20 L water tank and kept at room temperature in the laboratory. The wastewater was used in a week. The MFC with 100 L capacity (100 L-MFC) was set up near the wastewater treatment plant on a pig farm and supplied with the influent from the sedimentation tank. The COD content of the swine wastewater used as influent for the MFCs was in the range of 1700–12,000 mg L−1.
2.2. Electricity Generation Using Two Different Anodes
Swine wastewater was used to generate electricity through electrochemical cultivation (EC) using two different anodes: A hydrogel complex of rGO and microorganisms (rGO complex) and a graphite felt complex (GF complex). The rGO complex was prepared as described in the Supplementary Material and composed of black precipitates consisting of microbes and reduced GO (Supplementary Figure S1). Each anode was placed in a platinum cage, connected with a platinum wire, and introduced into a 0.93 L sterilized glass bottle filled with swine wastewater as the working electrode. An Ag/AgCl (KCl salt) electrode and another platinum wire were used as the reference and counter electrodes, respectively. Polarization was conducted by applying a potential of + 200 mV (vs. Ag/AgCl) to the working electrode by using a potentiostat (HA-1510; Hokuto Denko, Tokyo, Japan) for 30 days. During polarization, the current in the MFC was recorded every 60 min using a data logger (T&D Corporation, Nagano, Japan).
2.3. Microbial Fuel Cells with 1.5 L Capacity
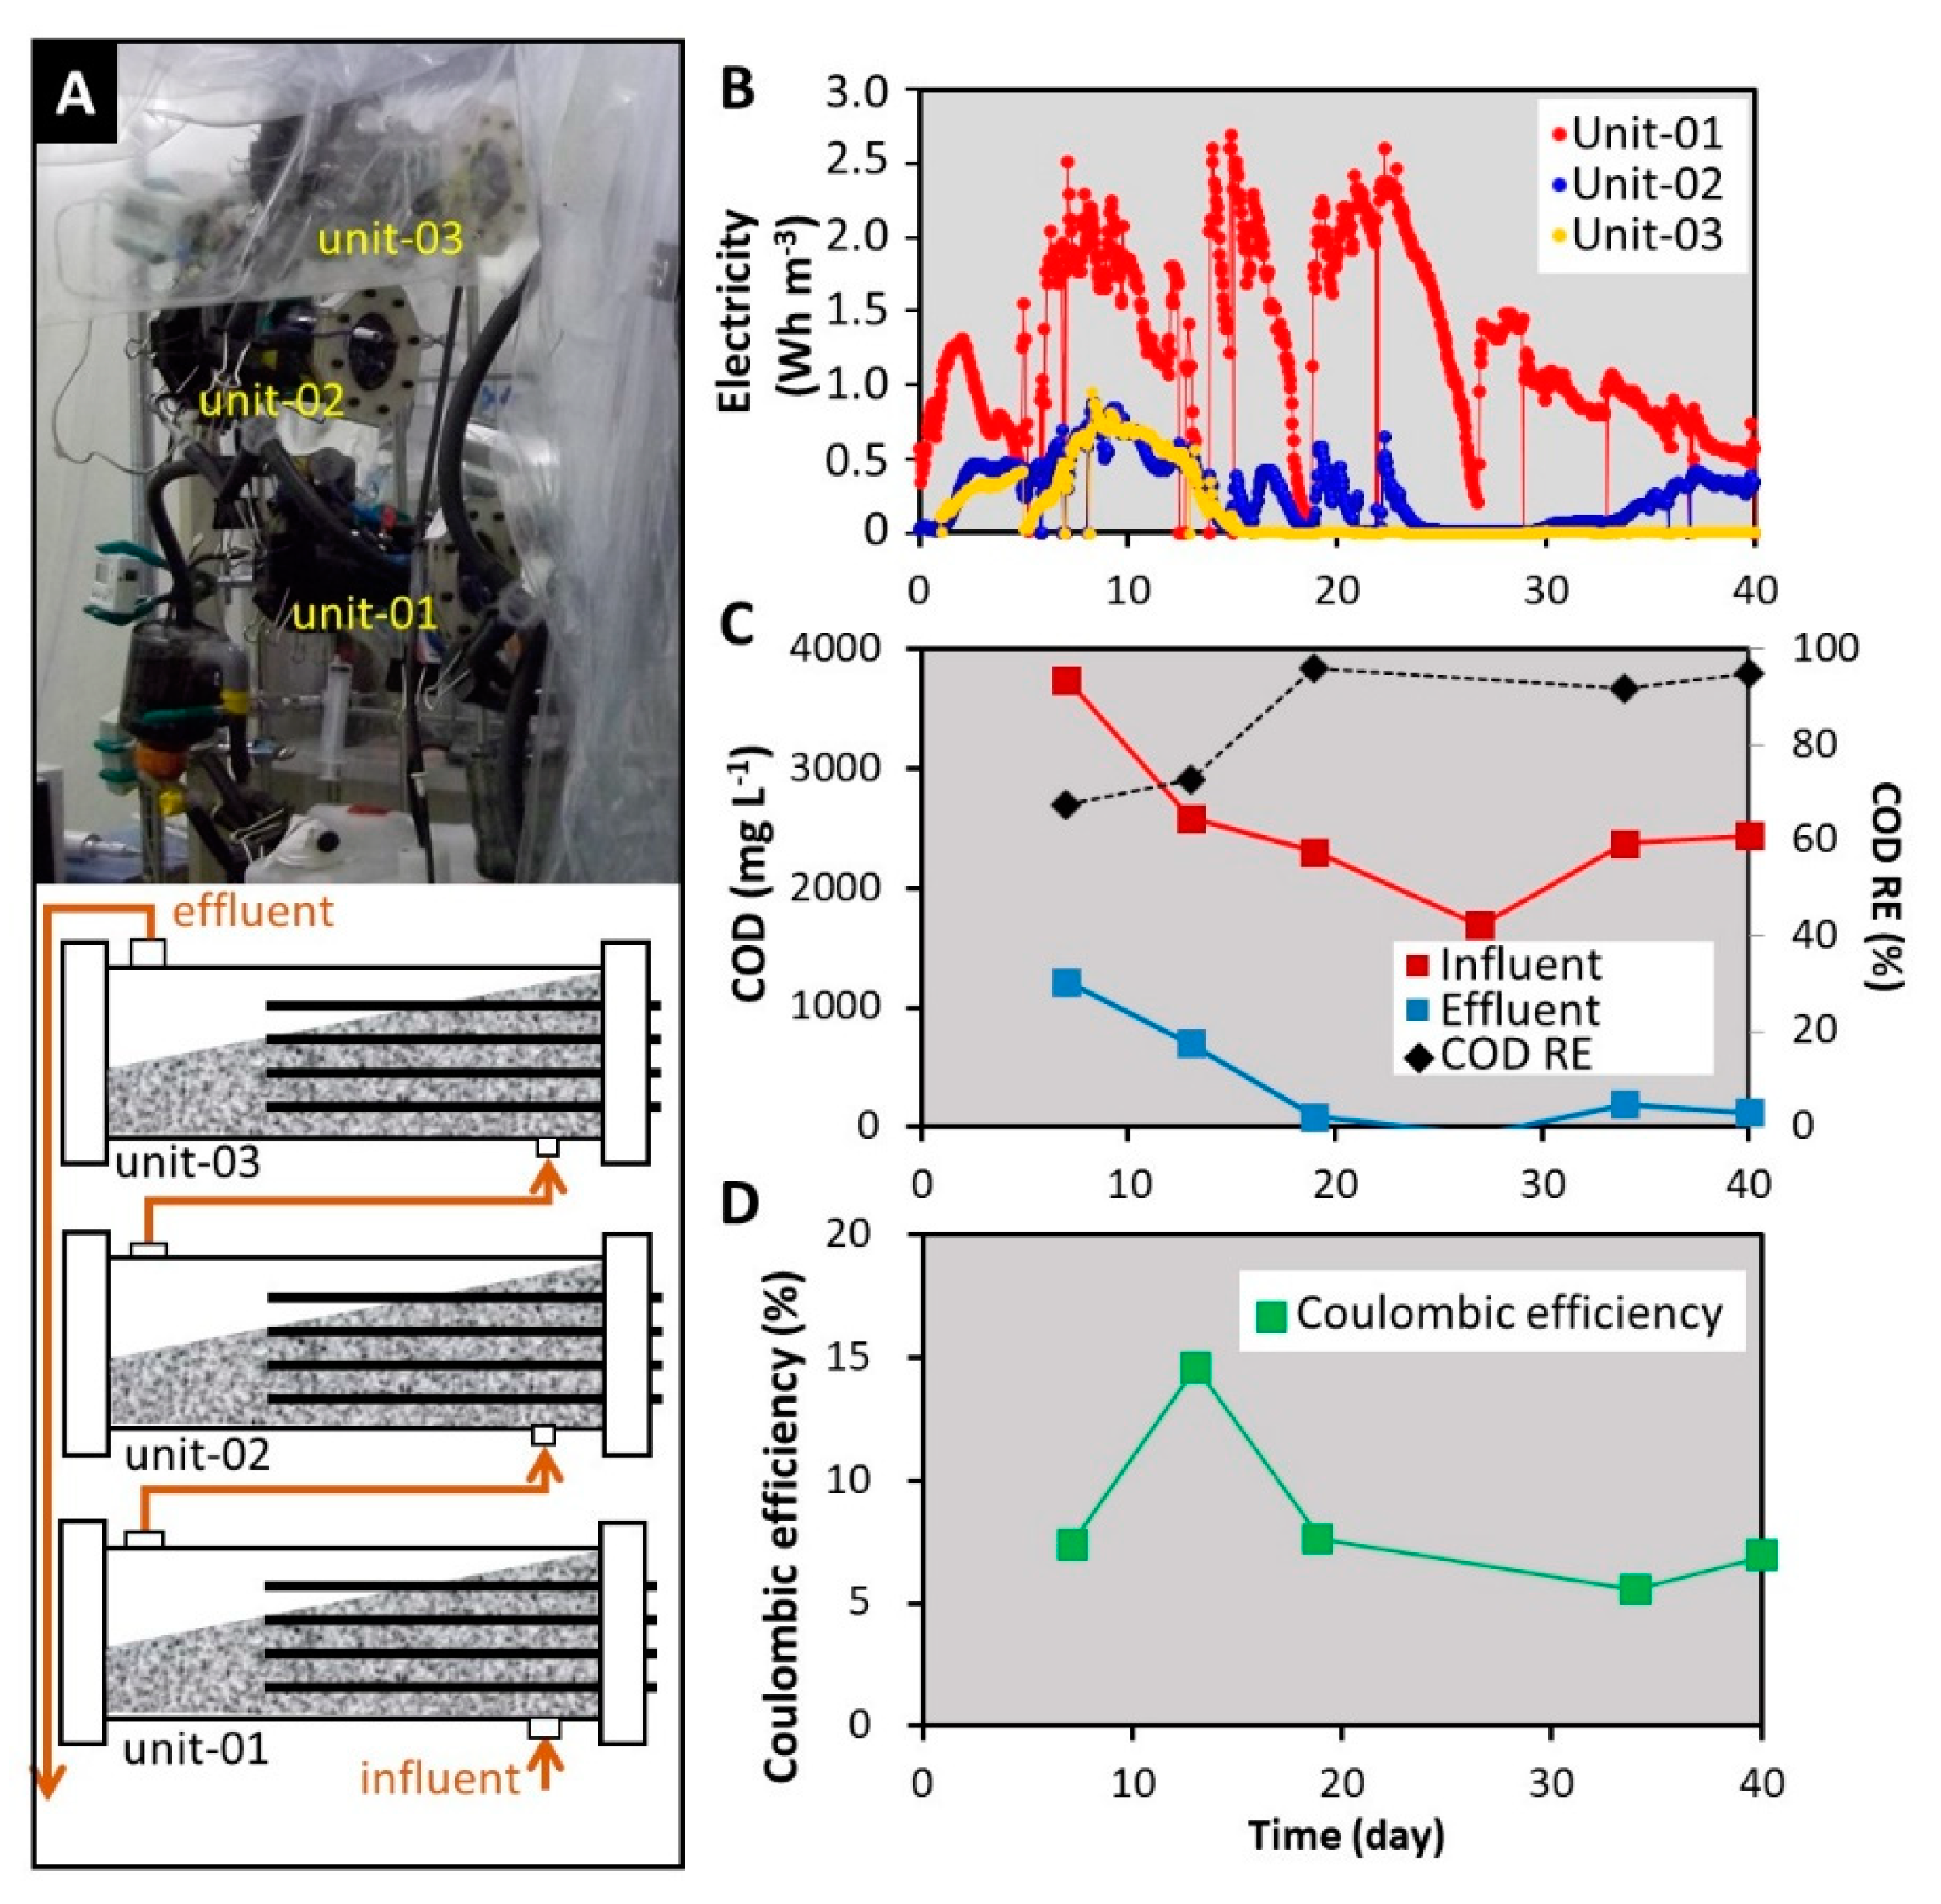
The 1.5 L-MFC consisted of three single-chamber cylindrical acrylic MFC units (capacity: 0.5 L each; diameter: 8.8 cm; height: 15 cm) hydraulically connected in series by silicon tubes (Figure 1A). The MFC was operated in continuous plug-flow mode and supplied with swine wastewater using a peristaltic pump. The HRT of the 1.5 L-MFC was set to three days. Each MFC unit had an inflow port near the four graphite rod anodes and an outflow port near the cathode (projected area: 38.5 cm2). The Pt-coated carbon cloth cathode was prepared according to the method reported in a previous study [28]. The prepared rGO complex (Supplementary method) occupied approximately half the volume of each of the three MFC units. The 1.5 L-MFC was polarized for 40 days by connecting the anode and cathode via an external resistance of 10 Ω at room temperature. The voltage in the MFCs was recorded every 60 min using a data logger (T&D Corporation, Nagano, Japan). The power density was normalized to the volume of the MFC.
2.4. Microbial Fuel Cells with 12 L Capacity
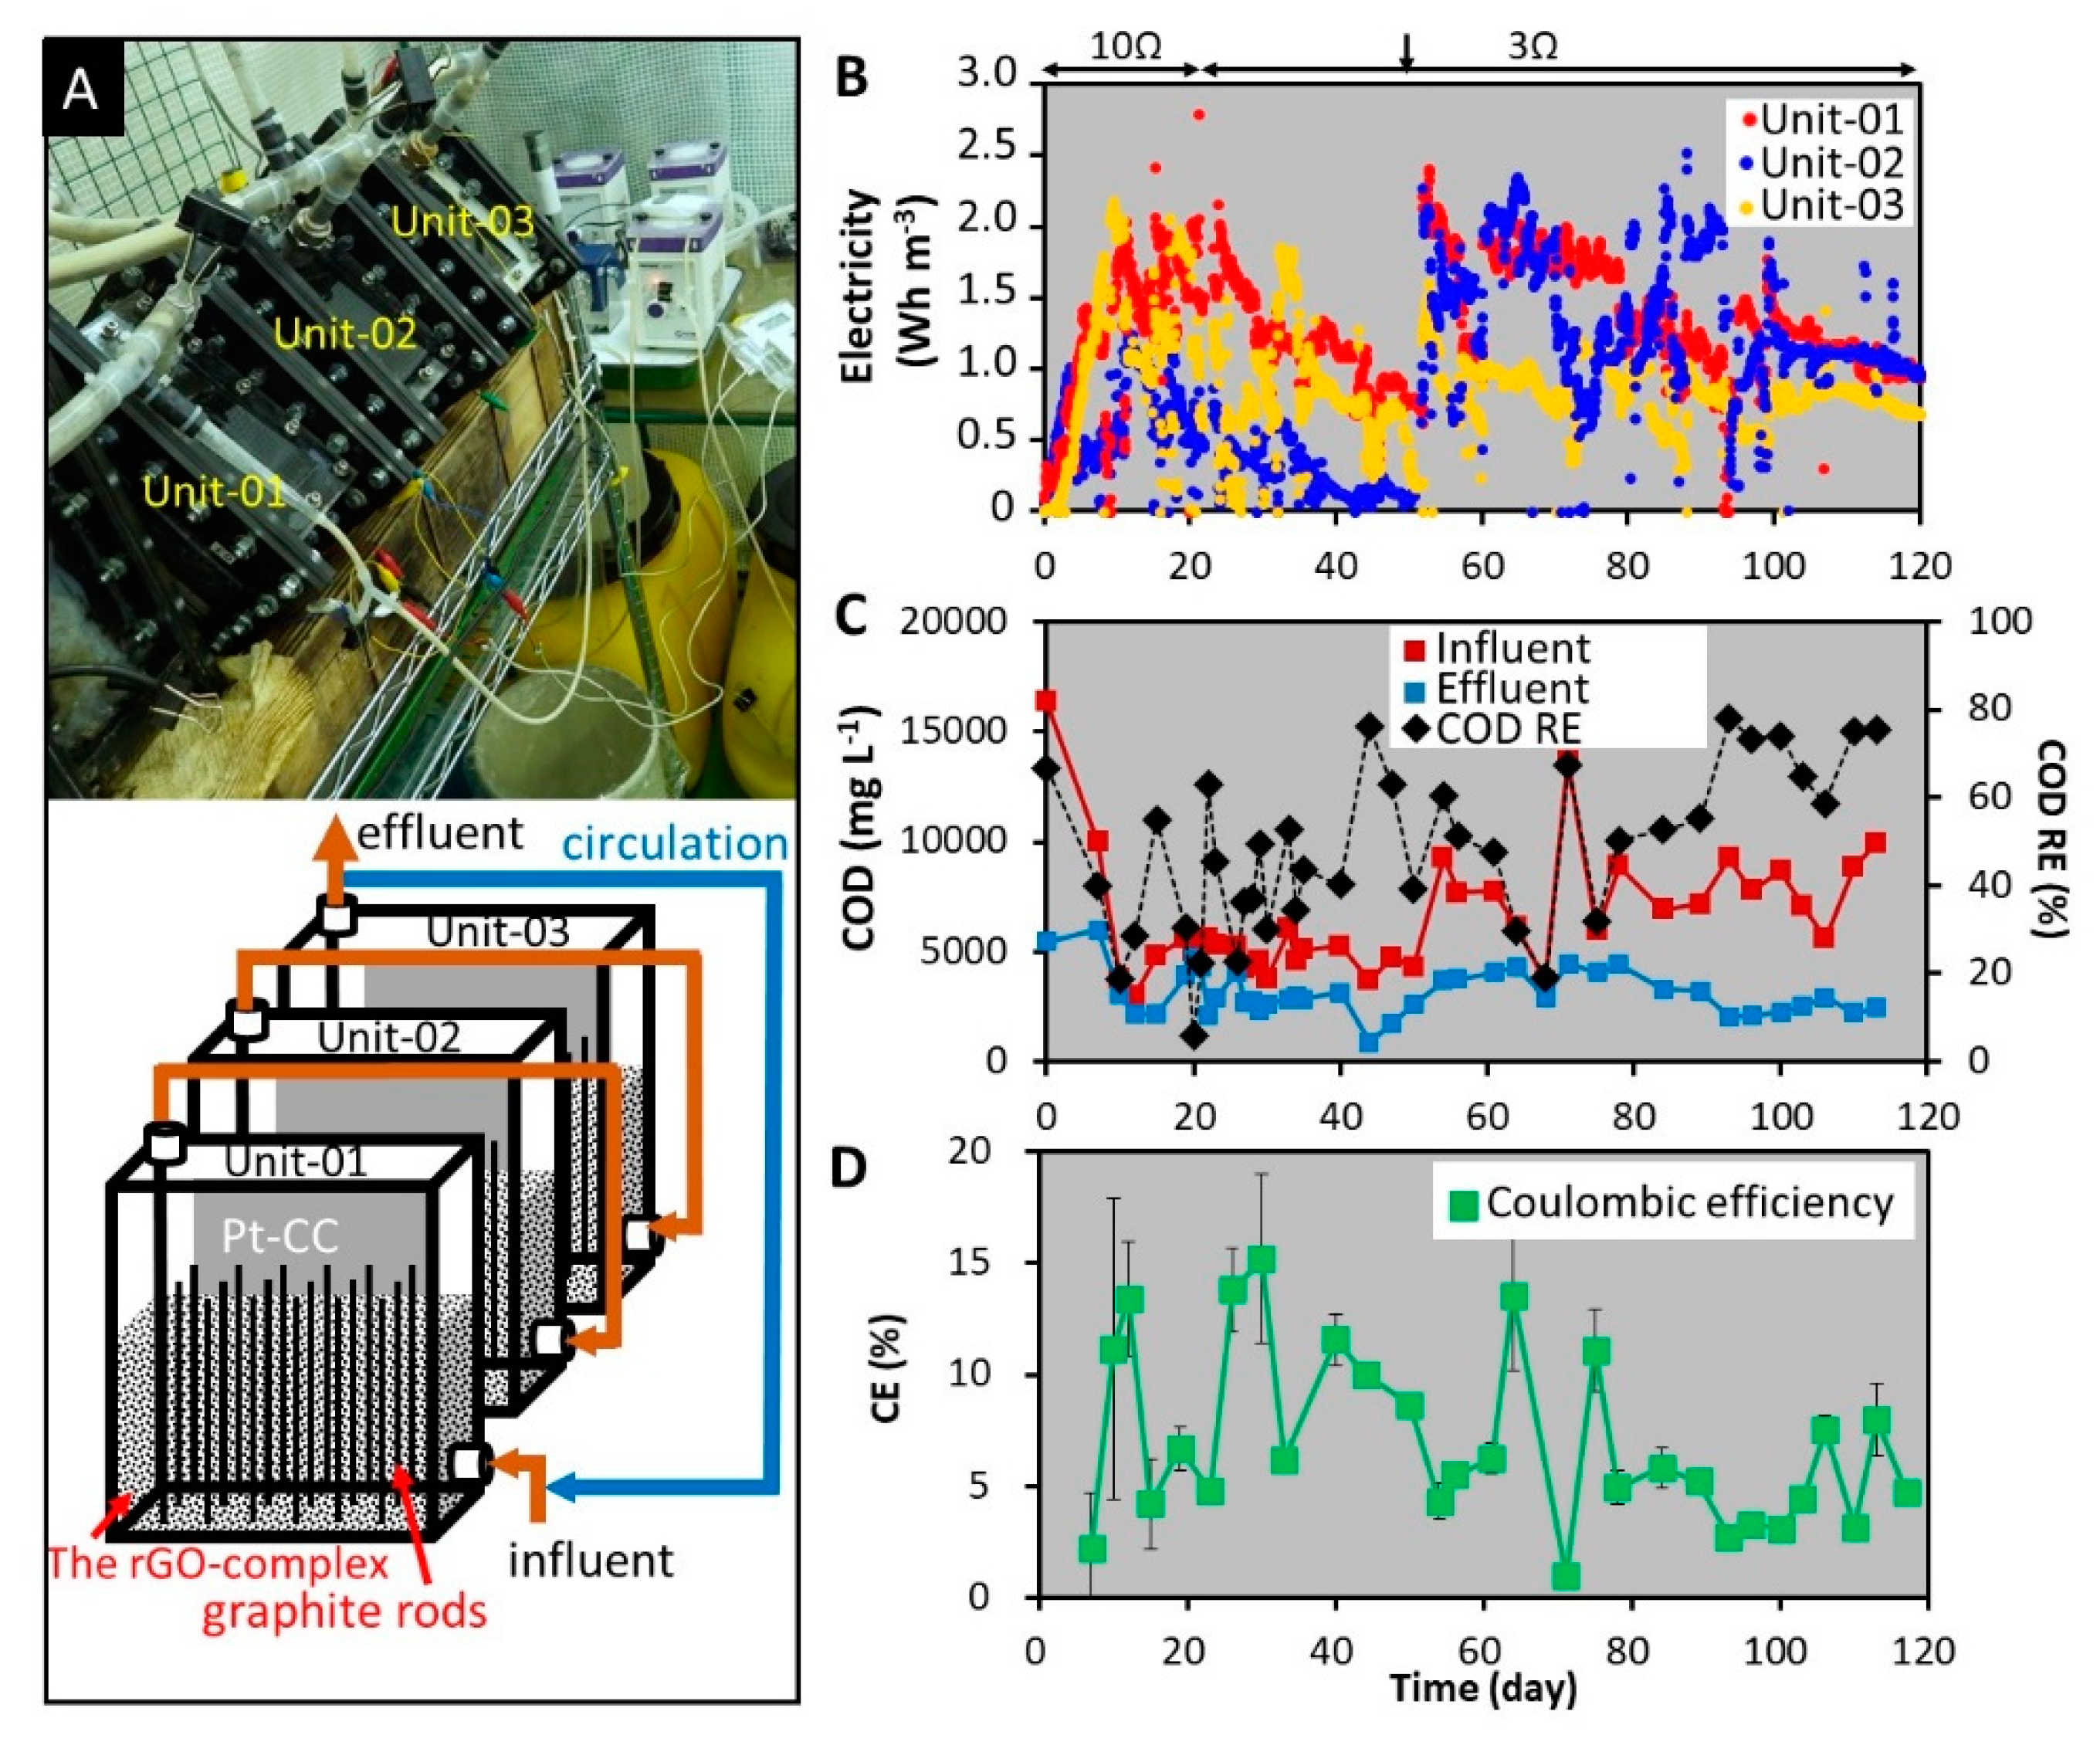
The 12 L-MFC consisted of three single-chamber cubic acrylic MFC units (capacity: 4 L each; height: 20 cm; width: 20 cm; depth: 10 cm) hydraulically connected in series by silicon tubes (Figure 2A). These units were operated in continuous plug-flow mode with an HRT of three days. Swine wastewater was circulated through an outflow port near the top of the third unit and an inflow port at the bottom of the first unit by using a peristaltic pump. A carbon cloth cathode was used on both sides and there were 18 graphite rod anodes at the bottom of each MFC unit. The prepared rGO complex occupied approximately half the volume of each MFC unit. The 12 L-MFC was polarized for 120 days by connecting the anode and cathode via an external resistance of 10 Ω for the first 20 days and 3 Ω for day 21–120 at room temperature.
2.5. Microbial Fuel Fells with 100 L Capacity
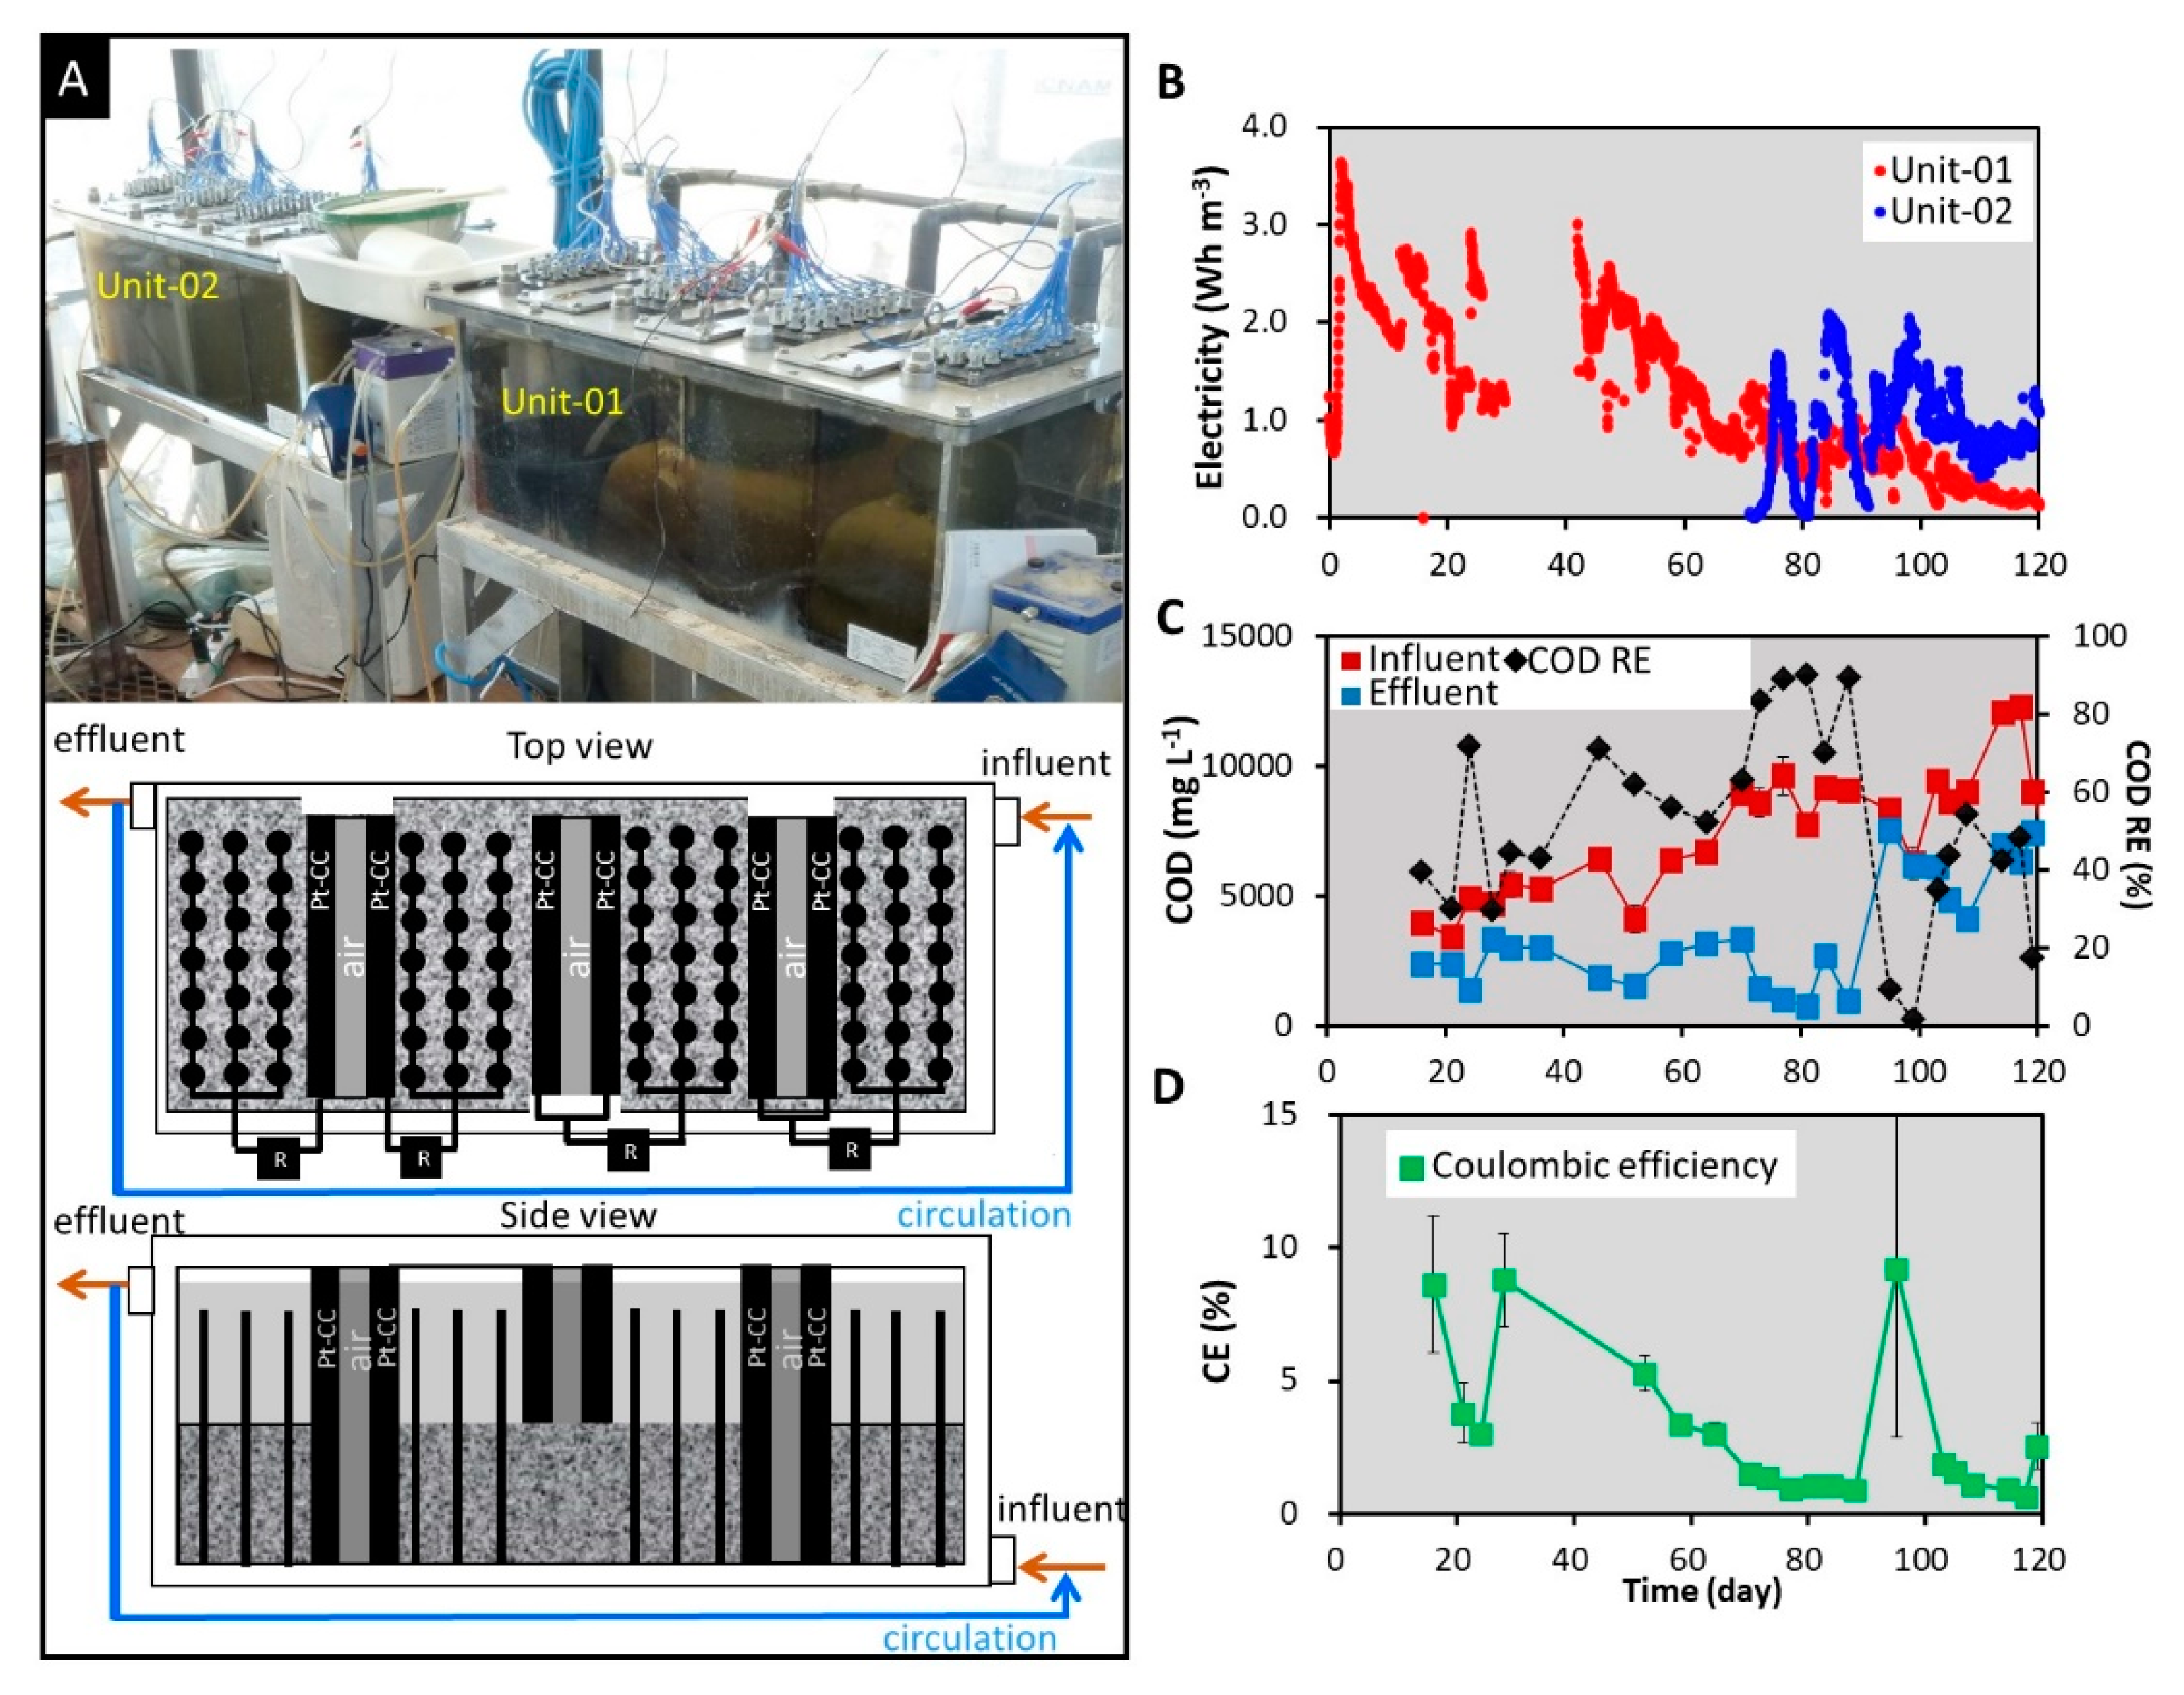
The 100 L-MFC consisted of two single-chamber cubic acrylic MFC units (capacity: 50 L each; height: 34 cm; width: 73.5 cm; depth: 33 cm) hydraulically connected in series by silicon tubes (Figure 3A). Each MFC unit comprised of 3 cathode boxes and 4 anode boxes with 21 graphite rod anodes at the bottom. Both sides of the cathode boxes had Pt-coated (projected area: 523 cm2) carbon cloth cathodes. The MFC units were operated in continuous plug-flow mode but partially circulated from outflow port to inflow port in each MFC unit by using a peristaltic pump. The HRT was set to 3 days but actual HRT was approximate 5 days due to feeding trouble. The prepared rGO complex occupied approximately half the volume of each MFC unit. The 100 L-MFC was polarized for 120 days by connecting the anode and the cathode via an external resistance of 3 Ω at an outdoor temperature in a greenhouse.
2.6. Chemical Analysis
The organic matter content of swine wastewater was determined before and after treatment with each MFC. The organic matter in swine wastewater was chemically oxidized using chromium and the amount of chromium was measured by a colorimetric method as described in a previous study [29] and arithmetically converted to chemical oxygen demand (COD).
2.7. Coulombic Efficiency
Coulombic efficiency (CE) was calculated using the equation given below as described in a previous study [30].
where Cp represents the total Coulombs calculated by integrating the current over time, and CTi is the theoretical Coulombs that can be produced from swine waste water, and is calculated using the equation given below.
where F is Faraday’s constant (98485 C mol−1), bi is the number of moles of electrons transferred to a mole of oxygen (b = 4), Si (g L−1) is the COD concentration, v (L) is the liquid volume, and Mi is the molecular weight of oxygen (32 g mol−1).
3. Results and Discussion
3.1. Electricity Generation Using Two Different Anodes
Supplementary Figure S2 shows the current densities using rGO and GF complexes. The current density of the rGO complex was 99 µA cm−3 on day 0, reached the maximum value (470 µA cm−3) on day 7. Meanwhile, GF complex showed the maximum value (120 µA cm−3) on day 18. These results indicate that the rGO complex could generate electricity from swine wastewater more effectively than the GF complex. Therefore, the rGO complex was used as the anode in the MFCs hereafter in this study.
3.2. Performance of the 1.5 L-MFC
Figure 1B shows the power densities of the 1.5 L-MFC (Figure 1A) during the 40-day polarization period. The three MFC units of the 1.5 L-MFC were numbered starting from the inflow to outflow units as unit−01, −02, and −03. On day 0, these units showed slight electricity production in the range of 0.02–0.6 Wh m−3 of the average volumetric power density and gradually increased to the highest values (0.9–2.7 Wh m−3) within 15 days of polarization. Overall, unit-01 averaged 1.2 Wh m−3, which was always higher than that of unit-02 and unit-03. Unit-02 generated 0.4 Wh m-3 on average until day 22 and 0.1 Wh m−3 from day 23 to 40 while unit-03 generated 0.4 Wh m−3 until day 14 and almost no production from day 15 to 40. This trend was probably due to the decrease in organic compounds in the influent of unit-02 and -03 owing to the upstream degradation of organic compounds. Electricity production occasionally fluctuated due to problems with the influent flow. Specifically, drops in electricity production were observed on day 12, 19, and 23, which recovered after the feeding tubes were repaired.
The COD concentrations during the polarization period are shown in Figure 1C. The COD of the influent (COD-IN) was in the range of 1700–3700, which reduced to 88–1200 after passing through the three MFC units, resulting in an average COD removal efficiency (COD RE) of 85%. The color and turbidity of the effluent were visually less than those of the influent (Supplementary Figure S3A). The influent COD concentration was not stable; it decreased gradually until day 27 and subsequently increased to approximately 2400 mg L−1. However, the effluent COD concentration (COD-EF) stabilized from day 19 onwards (less than 200 mg L−1). The COD trend seemed to correspond to the electricity generation trend recorded in the three MFC units. Therefore, the low electricity generation in unit-02 and -03 in the latter stages of the polarization period may be attributed to the low COD of the wastewater. The CE calculated based on COD consumption and electricity generation was in the range of 5.6–15% (average: 8.4 ± 3.6%) during the 40-day polarization period (Figure 1D).
3.3. Performance of the 12 L-MFC
Like the 1.5 L-MFC, the 12 L-MFC consisted of three units. Although this MFC was polarized for 120 d, the effluent from unit-03 was partially circulated into unit-01 after day 23. The average volumetric power density of the three units during the 40-day operation period was 1.3, 0.9, and 0.9 Wh m−3 for units-01, −02 and −03, respectively (Figure 2B). These values were higher than those for the 1.5 L-MFC. The electricity generated by each unit increased gradually until day 3–5, was maintained at an average of 0.6–1.5 Wh m−3 until approximately day 35, and then gradually decreased. On day 52, the cathode of unit-02 was partially damaged and subsequently replaced. At the same time, the electric wires used for connecting the anode and cathode in all the three units were replaced because of partial corrosion. Following the replacement of the wires, electricity production recovered and finally became stable at 0.8–1.2 Wh m−3 after 100 days.
The COD concentrations during polarization are shown in Figure 2C. The COD-IN averaged 6500 mg L−1 with a range of 3000–16400, while the COD-EF averaged 3400 mg L−1 with a range of 870–6000. The average COD RE was 47%, although the value stabilized at a higher rate later in the experimental period i.e., COD RE average 66% between days 78–113. The effluent showed visually less color and turbidity than that of the influent, similar to that of the 1.5 L-MFC effluent (Supplementary Figure S2B). The influent COD concentration during day 7–50 was lower than that during the first 7 days; however, it increased to 9300 mg L−1 after day 50. The average COD RE during day 7–50 was 40%, while after day 50, it was 57%. Overall, electricity generation and COD REs appeared higher for higher COD-INs. The CE calculated based on COD consumption and electricity generation was in the range of 1.0–15 % (average: 7.0 ± 3.9%) during the 120 day polarization period (Figure 2D).
3.4. Performance of the 100 L-MFC
The 100 L-MFC was comprised of two units (units-01 and -02). Unit-01 was polarized for 120 days while unit-02 was polarized for 49 days, corresponding to 71–120 days after starting the polarization of unit-01. The effluent was partially circulated between each unit. The average volumetric power density of the two units was 0.8 Wh m−3 (unit-01) and 0.6 Wh m−3 (unit-02) during the 120-day operation period (Figure 3B), although the data collected by the data logger during days 30–41 for unit-01 could not be retrieved. The highest electricity production for the two units was 3.7 Wh m−3 on day 2 for unit-01 and 2.1 Wh m−3 on day 84 for unit-02. Overall, electricity production gradually declined, especially for unit-01. The decrease might be partially attributed to the decline in water temperature (Supplementary Figure S4), as reported in a previous study [31], although other reasons such as invisible corrosion or deterioration of electrodes might have affected electricity production.
The COD-IN averaged 7200 mg L−1 and varied in the range of 3500–12000, while the COD-EF averaged 3500 mg L-1 and varied in the range of 770–7500 (Figure 3C). Overall, the average COD RE was 52%. The drop in COD RE on day 95 and 99 was caused by accidental flushing, which recovered after the flow rate was restored. The effluent showed a stronger brown color with less turbidity than that of the influent (Supplementary Figure S2C). The stronger brown color was possibly caused by the oxidation of iron in the effluent due to the longer storage time in the effluent reservoir compared to the two small MFCs maintained in the laboratory. The CE was in the range of 0.7–9.2% (average: 3.0 ± 2.8%), which was significantly lower than that for the two small MFCs (Figure 3D). The CE was relatively high until day 28 i.e., in the range 3.3–8.8%, but gradually decreased to 1.5% on day 70, and then stabilized at a low range of 0.9–2.6%. There was one exception, however, where CE spiked to 9.2% due to accidental flushing of the influent. The CE appeared to respond to the change in electricity production rather than COD RE.
3.5. Effects of Scaling up Microbial Fuel Cells
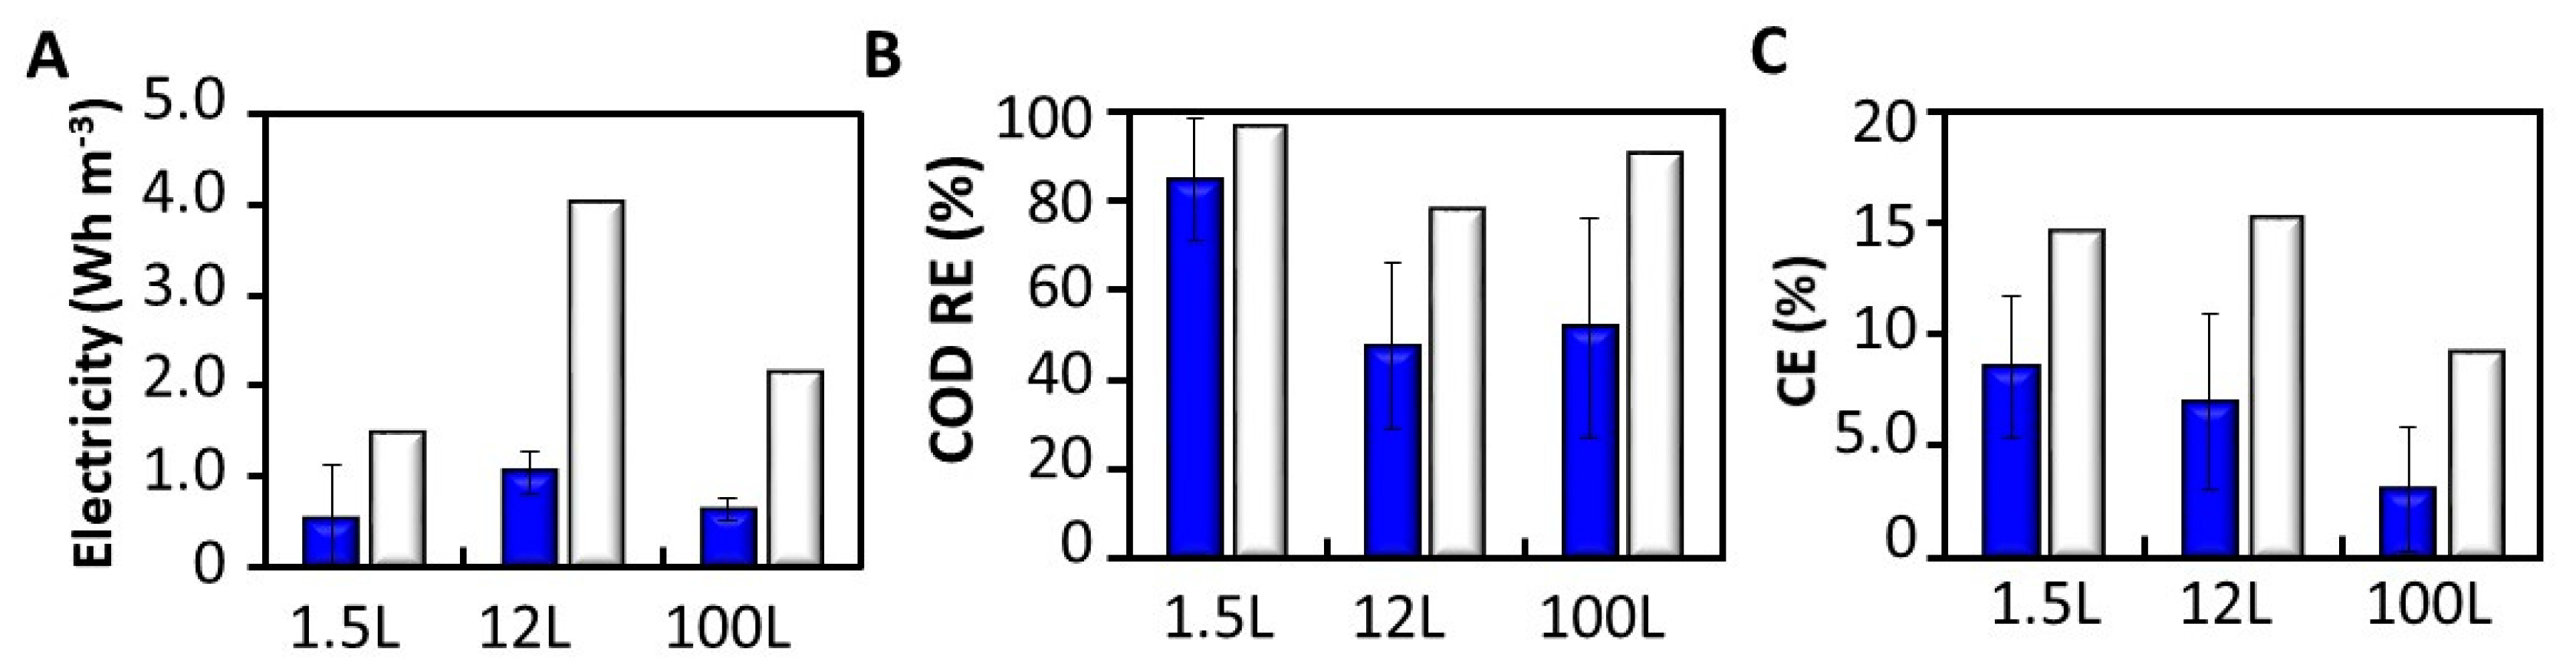
The performance parameters of the three MFCs are summarized in Figure 4. The average values for electricity generation of the MFCs at three different scales were not significantly different, although the smaller-scale MFCs generally achieved greater electricity generation [23,32]. Among the three MFCs used in this study, the 12 L-MFC showed comparatively higher electricity production. This was possibly attributed to the smaller width of the reactor (i.e., 10 cm), in comparison with the 1.5 L-MFC (15 cm) and 100 L-MFC (33 cm). The width is assumed to be the maximum distance between the cathode and anode i.e., the rGO complex, and varies depending on the local position of the rGO complex in the MFCs. An increase in the resistance of the electrolytes as a result of the increase in the electrode spacing has been reported previously [33]. Therefore, it is probable that the distance between the electrodes and not the scale of the MFCs directly affected electricity generation in the present study.
The COD REs of the 1.5 L-, 12 L-, and 100 L-MFCs were in the range of 47–87%, and there were no significant differences among them (Figure 4B). The 1.5 L-MFC achieved a relatively higher COD RE than the other two MFCs. This was possibly caused by the lower COD-IN of the 1.5 L-MFC i.e., 2500 mg L−1 than those of the 12 L-MFC (6500 mg L−1) and 100 L-MFC (7500 mg L−1). The average CEs of the 1.5 L-, 12 L-, and 100 L- MFCs were 8.5%, 7.0%, and 3.0%, respectively (Figure 4C). The average CE of the 100 L-MFC was significantly lower than those of smaller-scale MFCs. Both the lower electricity production and high COD-IN concentration possibly caused the lower energy recovery of the 100 L-MFC. Unlike in a single-chamber MFC [34], NH4+ removal was not observed in all of the MFCs (data not shown). To remove nitrogen, the MFC systems must be supplied with oxygen through processes such as partial recirculation of anode-treated water to the cathode reactor [35].
3.6. Comparison of MFC Performance with Previous Reports
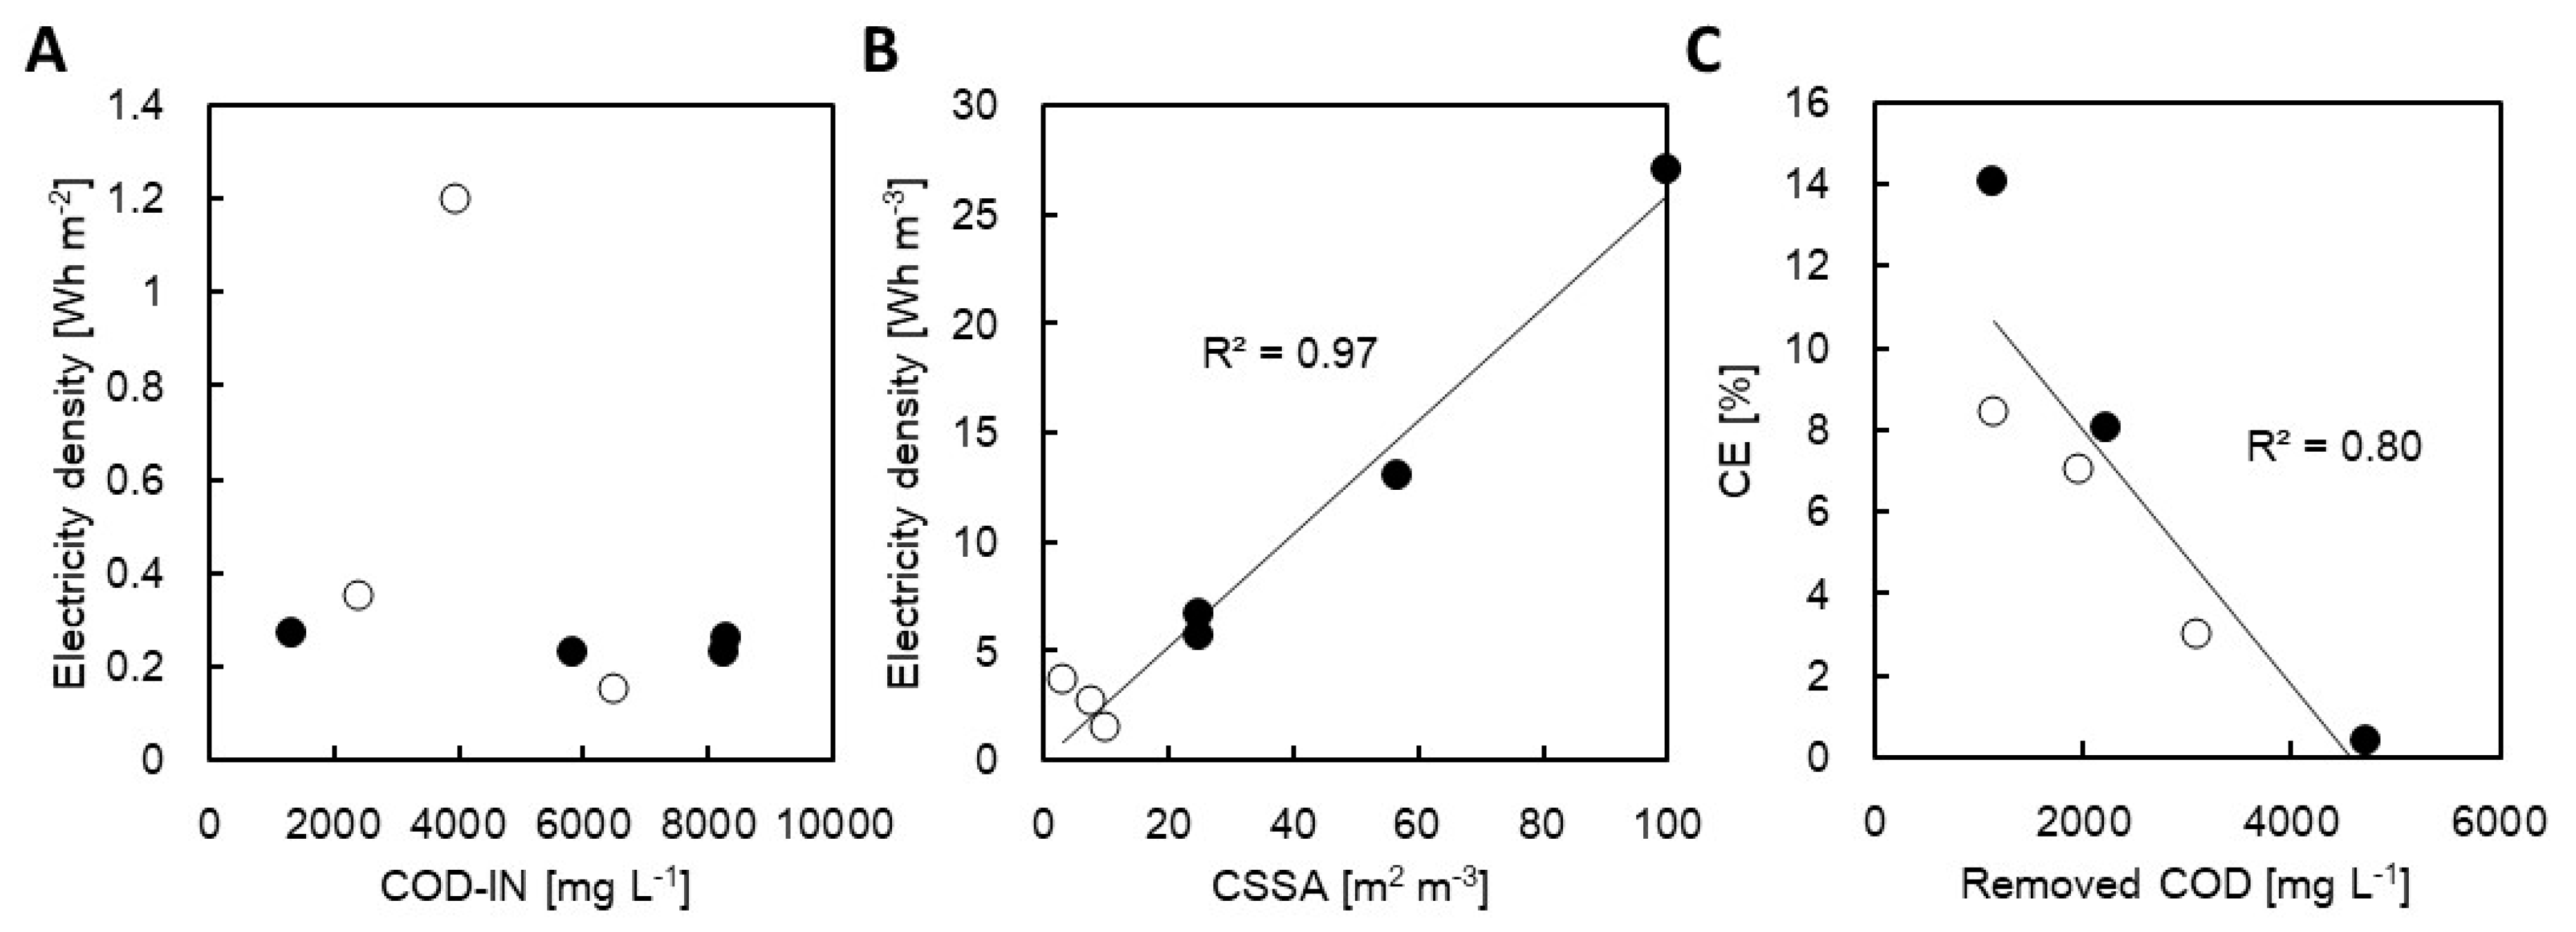
The performance of MFCs at three different scales were compared with other MFCs composed of a single anodic chamber equipped with an air-cathode and treated with swine wastewater (Table 1). In previous reports [17,36,37,38,39], the unit scales ranged from 0.028 to 0.33 L and maximum electricity production ranged from 1.5 to 154 Wh m−3. The highest value was possibly attributed to the extremely high COD i.e., 60,000 mg L-1 [37]. When focusing on the MFCs treating < 10,000 mg L−1 COD, the electricity density normalized cathode area was in the range of 0.15–1.2 Wh m−2 and had no correlation with COD-IN in the range of 1312–8320 mg L−1 (Figure 5A). Other factors in MFC configuration such as membrane, cathode catalyst, and HRT does not seem to affect the electricity density normalized cathode area. The values observed at the three different scales in this study were comparative with the those in other studies. In contrast, electricity density normalized MFC-volume is highly affected by cathode specific surface area (CSSA) [m2 m−3] (R2 = 0.97), as mentioned in a previous report [32] (Figure 5B), indicating that the increase in CSSA is the most important factor for recovering more electricity. CE was inversely correlated with the removed COD concentration (Figure 5C) and corresponded with previous findings [36]. This suggested that other anaerobic digestion of COD are major rather than oxidation of COD coupling electron transfer to the anode.
3.7. Net Energy Balance when Combining MFC and Post-Aeration
The final effluents of the three MFCs in this study contained 355–3500 mg L−1 of COD and required additional treatment such as post aeration before being discharged to public water. When the COD of the discharged water was set to 10 mg L−1, 345–3490 mg L−1 of COD should be aerobically treated with an energy consumption of -0.6 kWh kg-COD−1 [41,42]. According to the electricity production and COD removal observed in this study, electricity generation efficiency (EGE) of the three MFCs was 0.026–0.044 kwh kg-COD−1 (Table 1) and lower than that observed using biogas-based EGE i.e., 1.6 kwh kg-COD−1 [43]. Table 2 shows the net energy in wastewater treatment using MFCs with three different capacities and post-aeration. The energy consumption (EC) using aeration to treat 1 m−3 of wastewater with 2300, 6500, and 7200 mg L−1 of COD was −1.4, −3.9, and −4.3 kwh m−3, respectively. Thus, EC could be reduced to 50–91% by using MFCs, although the net energy balance was still negative. However, the net energy balance in wastewater treatment combining MFCs and post-aeration may be positive when the wastewater contains lower COD concentrations (< 500 mg L−1) [43]. These results suggest that MFC is more effective for reducing lower COD or hydrocarbons with less carbon numbers [36], and should be integrated with the pretreatment of anaerobic digestion and post-aeration for swine wastewater containing high concentrations of COD.
4. Conclusions
Microbial fuel cells (MFCs) with different capacities (1.5 L, 12 L, and 100 L) were used to treat swine wastewater in this study. The average COD removal efficiency and Coulombic efficiency of the scaled-up MFCs were less than those of the 1.5 L-MFC. However, the average and maximum volumetric power density of the 100 L-MFC was 0.6 and 2.1 Wh m−3, respectively, with an average COD removal efficiency of 52%. This is the first study to analyze the performance of scaled-up MFCs with 100 L capacity in swine wastewater treatment. Therefore, the results obtained can be used as a reference for the practical treatment of swine wastewater using MFCs as well as for generating electricity from the system.
Supplementary Materials
The following are available online at https://www.mdpi.com/2073-4441/11/9/1803/s1, Supplementary Method: preparation of the rGO complex and GF complex, Figure S1: The rGO complex used as anode in the MFCs; Figure S2: The comparison of the electricity generation by electrochemical cultivation using reduced graphene oxide (rGO) and graphite felt (GF); Figure S3: Swine wastewater before and after treatment using 1.5L-MFC (A), 12L-MFC (B) and 100L-MFC (C), Figure S4: Changes in water temperature in 100L-MFC set-up at a greenhouse.
Author Contributions
Y.G. conducted the experiments and wrote the paper; N.Y. designed and conducted the experiments and wrote the paper.
Funding
This work was supported by the Toyohashi Innovation Creation Project; Japan Society for the Promotion of Science KAKENHI under Grants 26701010 and 18K18876; and Hibi Science Foundation.
Acknowledgments
We thank Yuri Horie and ICNAM for the construction of scaled-up MFCs.
Conflicts of Interest
The authors declare no conflict of interest.
References
- Ministry of Agriculture, Forestry and Fisheries (MAFF). Production and Management of Livestock Manure; Ministry of Agriculture, Forestry and Fisheries: Tokyo, Japan, 2016. (In Japanese) [Google Scholar]
- Oshida, T.; Fukuyasu, T.; Kohzaki, K. Direct treatment of animal waste water by public sewerage in urban district. Waste Manag. Res. 1994, 5, 357–363. [Google Scholar] [CrossRef]
- McCarty, P.L.; Bae, J.; Kim, J. Domestic wastewater treatment as a net energy producer—Can this be achieved? Environ. Sci. Technol. 2011, 45, 7100–7106. [Google Scholar] [CrossRef] [PubMed]
- Logan, B.E.; Rabaey, K. Conversion of wastes into bioelectricity and chemicals by using microbial electrochemical technologies. Science 2012, 337, 686–690. [Google Scholar] [CrossRef] [PubMed]
- Green, F.B.; Lundquist, T.J.; Oswald, W.J. Energetics of advanced integrated wastewater pond systems. Water Sci. Technol. 1995, 31, 9–20. [Google Scholar] [CrossRef]
- Kondusamy, D.; Kalamdhad, A.S. Pre-treatment and anaerobic digestion of food waste for high rate methane production—A review. J. Environ. Chem. Eng. 2014, 2, 1821–1830. [Google Scholar] [CrossRef]
- New Energy and Industrial Technology Development Organization (NEDO). White Paper on Renewable Energy Technologies, 2nd ed.; New Energy and Industrial Technology Development Organization: Kawasaki, Japan, 2014. (In Japanese) [Google Scholar]
- Gallert, C.; Bauer, S.; Winter, J. Effect of ammonia on the anaerobic degradation of protein by a mesophilic and thermophilic biowaste population. Appl. Microbiol. Biotechnol. 1998, 50, 495–501. [Google Scholar] [CrossRef] [PubMed]
- Chen, Y.; Cheng, J.J.; Creamer, K.S. Inhibition of anaerobic digestion process: A review. Bioresour. Technol. 2008, 99, 4044–4064. [Google Scholar] [CrossRef] [PubMed]
- Kato, K. Regulation of wastewater in the Water Pollution Control Law and waste water standards of nitrogen and phosphorus in livestock industry. Anim. Husb. Environ. Inf. 2004, 24, 19–25. (In Japanese) [Google Scholar]
- Watanabe, K. Recent developments in microbial fuel cell technologies for sustainable bioenergy. J. Biosci. Bioeng. 2008, 106, 528–536. [Google Scholar] [CrossRef] [PubMed]
- Ahn, Y.; Logan, B.E. Effectiveness of domestic wastewater treatment using microbial fuel cells at ambient and mesophilic temperatures. Bioresour. Technol. 2010, 101, 469–475. [Google Scholar] [CrossRef]
- Malaeb, L.; Katuri, K.P.; Logan, B.E.; Maab, H.; Nunes, S.P.; Saikaly, P.E. A hybrid microbial fuel cell membrane bioreactor with a conductive ultrafiltration membrane biocathode for wastewater treatment. Environ. Sci. Technol. 2013, 47, 11821–11828. [Google Scholar] [CrossRef]
- Feng, Y.; Wang, X.; Logan, B.E.; Lee, H. Brewery wastewater treatment using air-cathode microbial fuel cells. Appl. Microbiol. Biotechnol. 2008, 78, 873–880. [Google Scholar] [CrossRef] [PubMed]
- Wang, X.; Feng, Y.J.; Lee, H. Electricity production from beer brewery wastewater using single chamber microbial fuel cell. Water Sci. Technol. 2008, 57, 1117–1121. [Google Scholar] [CrossRef]
- Clauwaert, P.; Rabaey, K.; Aelterman, P.; De Schamphelaire, L.; Pham, T.H.; Boeckx, P.; Boon, N.; Verstraete, W. Biological denitrification in microbial fuel cells. Environ. Sci. Technol. 2007, 41, 3354–3360. [Google Scholar] [CrossRef]
- Zhuang, L.; Zheng, Y.; Zhou, S.; Yuan, Y.; Yuan, H.; Chen, Y. Scalable microbial fuel cell (MFC) stack for continuous real wastewater treatment. Bioresour. Technol. 2012, 106, 82–88. [Google Scholar] [CrossRef]
- Feng, Y.; He, W.; Liu, J.; Wang, X.; Qu, Y.; Ren, N. A horizontal plug flow and stackable pilot microbial fuel cell for municipal wastewater treatment. Bioresour. Technol. 2014, 156, 132–138. [Google Scholar] [CrossRef] [PubMed]
- He, W.; Wallack, M.J.; Kim, K.Y.; Zhang, X.; Yang, W.; Zhu, X.; Feng, Y.; Logan, B.E. The effect of flow modes and electrode combinations on the performance of a multiple module microbial fuel cell installed at wastewater treatment plant. Water Res. 2016, 105, 351–360. [Google Scholar] [CrossRef] [PubMed]
- Zhang, F.; Ge, Z.; Grimaud, J.; Hurst, J.; He, Z. Long-term performance of liter-scale microbial fuel cells treating primary effluent installed in a municipal wastewater treatment facility. Environ. Sci. Technol. 2013, 47, 4941–4948. [Google Scholar] [CrossRef]
- Dong, Y.; Qu, Y.; He, W.; Du, Y.; Liu, J.; Han, X.; Feng, Y.A. A 90-liter stackable baffled microbial fuel cell for brewery wastewater treatment based on energy self-sufficient mode. Bioresour. Technol. 2015, 195, 66–72. [Google Scholar] [CrossRef]
- Lu, M.; Chen, S.; Babanova, S.; Phadke, S.; Salvacion, M.; Mirhosseini, A.; Chan, S.; Carpenter, K.; Cortese, R.; Bretschger, O. Long-term performance of a 20-L continuous flow microbial fuel cell for treatment of brewery wastewater. J. Power Sources 2017, 356, 274–287. [Google Scholar] [CrossRef]
- Oh, S.T.; Kim, J.R.; Premier, G.C.; Lee, T.H.; Kim, C.; Sloan, W.T. Sustainable wastewater treatment: How might microbial fuel cells contribute. Biotechnol. Adv. 2010, 28, 871–881. [Google Scholar] [CrossRef] [PubMed]
- Yoshida, N.; Goto, Y.; Miyata, Y. Selective growth of and electricity production by marine exoelectrogenic bacteria in self-aggregated hydrogel of microbially reduced graphene oxide. C 2016, 2, 15. [Google Scholar] [CrossRef]
- Yoshida, N.; Miyata, Y.; Doi, K.; Goto, Y.; Nagao, Y.; Tero, R.; Hiraishi, A. Graphene oxide-dependent growth and self-aggregation into a hydrogel complex of exoelectrogenic bacteria. Sci. Rep. 2016, 6, 21867. [Google Scholar] [CrossRef]
- Goto, Y.; Yoshida, N. Microbially reduced graphene oxide shows efficient electricity recovery from artificial dialysis wastewater. J. Gen. Appl. Microbiol. 2017, 63, 165–171. [Google Scholar] [CrossRef] [PubMed]
- Yoshida, N.; Miyata, Y.; Mugita, A.; Iida, K. Electricity recovery from municipal sewage wastewater using a hydrogel complex composed of microbially reduced graphene oxide and sludge. Materials 2016, 9, 742. [Google Scholar] [CrossRef]
- Cheng, S.; Liu, H.; Logan, B.E. Increased performance of single-chamber microbial fuel cells using an improved cathode structure. Electrochem. Commun. 2006, 8, 489–494. [Google Scholar] [CrossRef]
- Goto, Y.; Yoshida, N. Preliminary evaluation of a microbial fuel cell treating artificial dialysis wastewater using graphene oxide. AIP Conf. Proc. 2016, 1709, 020007. [Google Scholar]
- Liu, H.; Logan, B.E. Electricity generation using an air-cathode single chamber microbial fuel cell in the presence and absence of a proton exchange membrane. Environ. Sci. Technol. 2004, 38, 4040–4046. [Google Scholar] [CrossRef]
- Liu, H.; Cheng, S.; Logan, B.E. Power generation in fed-batch microbial fuel cells as a function of ionic strength, temperature, and reactor configuration. Environ. Sci. Technol. 2005, 39, 5488–5493. [Google Scholar] [CrossRef] [PubMed]
- Logan, B.E.; Wallack, M.J.; Kim, K.-Y.; He, W.; Feng, Y.; Saikaly, P.E. Assessment of microbial fuel cell configurations and power densities. Environ. Sci. Technol. Lett. 2015, 2, 206–214. [Google Scholar] [CrossRef]
- Ghangrekar, M.M.; Shinde, V.B. Performance of membrane-less microbial fuel cell treating wastewater and effect of electrode distance and area on electricity production. Bioresour. Technol. 2007, 98, 2879–2885. [Google Scholar] [CrossRef] [PubMed]
- Kim, J.R.; Zuo, Y.; Regan, J.M.; Logan, B.E. Analysis of ammonia loss mechanisms in microbial fuel cells treating animal wastewater. Biotechnol. Bioeng. 2008, 99, 1120–1127. [Google Scholar] [CrossRef]
- Ge, Z.; He, Z. Long-term performance of a 200 liter modularized microbial fuel cell system treating municipal wastewater: Treatment, energy, and cost. Environ. Sci.: Water Res. Technol. 2016, 2, 274–281. [Google Scholar] [CrossRef]
- Kim, J.R.; Dec, J.; Bruns, M.A.; Logan, B.E. Removal of odors from swine wastewater by using microbial fuel cells. Appl. Environ. Microbiol. 2008, 74, 2540–2543. [Google Scholar] [CrossRef]
- Ichihashi, O.; Hirooka, K. Removal and recovery of phosphorus as struvite from swine wastewater using microbial fuel cell. Bioresour. Technol. 2012, 114, 303–307. [Google Scholar] [CrossRef]
- Ding, W.; Cheng, S.; Yu, L.; Huang, H. Effective swine wastewater treatment by combining microbial fuel cells with flocculation. Chemosphere 2017, 182, 567–573. [Google Scholar] [CrossRef]
- Min, B.; Kim, J.R.; Oh, S.E.; Regan, J.M.; Logan, B.E. Electricity generation from swine wastewater using microbial fuel cells. Water Res. 2005, 39, 4961–4968. [Google Scholar] [CrossRef] [PubMed]
- Nurmiyanto, A.; Kodera, H.; Kindaichi, T.; Ozaki, N.; Aoi, Y.; Ohashi, A. Dominant Candidatus Accumulibacter phosphatis enriched in response to phosphate concentrations in EBPR process. Microbes Environ. 2017, 32, 260–267. [Google Scholar] [CrossRef] [PubMed]
- He, Z. Microbial fuel cells: Now let us talk about energy. Environ. Sci. Technol. 2013, 47, 332–333. [Google Scholar] [CrossRef]
- Maktabifard, M.; Zaborowska, E.; Makinia, J. Achieving energy neutrality in wastewater treatment plants through energy savings and enhancing renewable energy production. Rev. Environ. Sci. Bio/Technol. 2018, 17, 655–689. [Google Scholar] [CrossRef] [Green Version]
- Sugioka, M.; Yoshida, N.; Iida, K. On site evaluation of a tubular microbial fuel cell using an anion exchange membrane for sewage water treatment. Front. Energy Res. 2019, 7, 480714. [Google Scholar]
Figure 1.
The configuration and photo of the (A) 1.5 L-microbial fuel cell (MFC), and changes in (B) electricity production, (C) COD RE, and (D) Coulombic efficiency during swine wastewater treatment.
Figure 1.
The configuration and photo of the (A) 1.5 L-microbial fuel cell (MFC), and changes in (B) electricity production, (C) COD RE, and (D) Coulombic efficiency during swine wastewater treatment.

Figure 2.
The configuration and photo of (A) the 12 L-microbial fuel cell (MFC), and changes in (B) electricity production, (C) COD RE, and Coulombic efficiency (D) during swine wastewater treatment. The arrow in (B) indicates when the wires of the three MFC units and the cathode of the second MFC unit were replaced (day 52) due to decreased electricity generation.

Figure 3.
The configuration and photo of (A) the 100 L-microbial fuel cell (MFC), and changes in (B) electricity production, (C)COR RE, and (D) Coulombic efficiency during swine wastewater treatment. The data recorded by the data logger for (B) during days 30–41 could not be retrieved.
Figure 3.
The configuration and photo of (A) the 100 L-microbial fuel cell (MFC), and changes in (B) electricity production, (C)COR RE, and (D) Coulombic efficiency during swine wastewater treatment. The data recorded by the data logger for (B) during days 30–41 could not be retrieved.

Figure 4.
Comparison of (A) electricity generation, (B) COD RE, and (C) Coulombic efficiency in microbial fuel cells (MFCs) with different capacities. The blue and white bars show average and maximum electricity generation, respectively.
Figure 4.
Comparison of (A) electricity generation, (B) COD RE, and (C) Coulombic efficiency in microbial fuel cells (MFCs) with different capacities. The blue and white bars show average and maximum electricity generation, respectively.

Figure 5.
The effects of (A) chemical oxygen demand in the influent (COD-IN) and (B) specific cathode area on electricity density, and the effect of (C) removed COD on Coulombic efficiency (CE). Open and closed circles are the data obtained in this study and previous studies [17,36,38,39], respectively.


Table 1.
A comparison of microbial fuel cell (MFC) performance for treating swine wastewater.
| Reference | Previous Research | This Study | ||||||
|---|---|---|---|---|---|---|---|---|
| 17 | 36 | 37 | 38 | 39 | 0.5 L | 4 L | 50 L | |
| Type | SAC a | SAC | SAC | SAC | SAC | SAC | SAC | AIC b |
| Unit scale (L) | 0.30 | 0.028 | 0.07 | 0.4 | 0.028 | 0.5 | 4 | 50 |
| CA c [cm2] | 187 | 7 | 47 | 400 | 7 | 39 | 400 | 1569 |
| CSSA [m2 m−3] | 64 | 25 | 67 | 100 | 25 | 7.8 | 10 | 3.1 |
| CC d | MnO2 e | Pt f | Pt g | AC h | Ptf | Pt g | Pt g | Pt g |
| Membrane | CEM i | Nafion | PTFE | PTFE | PTFE | PTFE | PTFE | PTFE |
| Temp. [°C] | 30 | 30 | RT j | 30 | 30 | RT | RT | 28.5–5.9 |
| IN-COD k [mg/L] | 5845 | 8270l | 60000 | 1313 | 8230 l | 2325 | 6500 | 7200 |
| EF-COD m [mg L−1] | 1110 | 1320l | 2900–9400 | 156 | 6090 l | 355 | 3400 | 3500 |
| Operation | C | FB n | FB | FB | FB | C | C | C |
| HRT | 5.7–23 h | 260 h | 3–17 d | 84 h | 44 h | 3 d | 3 d | 5 d |
| Electricity [Wh m−2] | 0.23 | Max: 0.23 | Max: 2.3 | Max: 0.27 | Max: 0.26 | Max: 0.35 Ave: 0.048 | Max: 0.15 Ave: 0.09 | Max: 1.2 Ave: 0.25 |
| [Wh m−3] | 15 | Max: 5.8 | Max: 154 | Max: 27 | Max: 6.6 | Max: 2.7 Ave: 1.2 | Max: 1.5 Ave: 0.9 | Max: 3.7 Ave: 0.8 |
| COD RE [%] | 81 | 84 | 91 | 88 | 27 | 85 | 49 | 52 |
| CE [%] | 0.3–0.5 | 47 | 14 | 8 | 5.6–15 | 1.0–15 | 0.7–9.2 | |
| EGE p [kwh kg-COD−1] | 0.044 | 0.035 | 0.026 | |||||
a Single anodic chamber, b air-cathode integrated reactor, c cathode area, d cathode catalyst, e 8.0 mg cm−2 MnO2, f 0.35 mg cm−2 Pt, g 0.5 mg/cm2, h activated carbon, I cation exchange membrane, j room temp., k COD of influent [40], l Soluble COD, m COD of effluent, n Fed-batch, Continuous feeding, p electricity generation efficiency.
Table 2.
Net energy calculation in wastewater treatment combining MFCs with three different capacities (1.5 L, 12 L, and 100 L) and post-aeration.
Table 2.
Net energy calculation in wastewater treatment combining MFCs with three different capacities (1.5 L, 12 L, and 100 L) and post-aeration.
| Measurement | 1.5 L | 12 L | 100 L |
|---|---|---|---|
| COD-IN a (mg L−1) | 2300 | 6500 | 7200 |
| COD-EF b (MFC) (mg L−1) | 360 | 3400 | 3500 |
| COD-EF b (aeration) (mg L−1) | 10 | 10 | 10 |
| MFC-HRT c (d) | 3 | 3 | 5 |
| EGE d (kwh kg-COD−1) | 0.044 | 0.035 | 0.026 |
| EC e (kwh kg-COD−1) | ‒0.6 | ‒0.6 | ‒0.6 |
| MFC f (kwh m−3) | 0.086 | 0.11 | 0.096 |
| Aeration g (kwh m−3) | ‒1.4 | ‒3.9 | ‒4.3 |
| Post-aeration h (kwh m−3) | ‒0.21 | ‒2.0 | ‒2.1 |
| Net energy (kwh m−3) | ‒0.12 | ‒1.9 | ‒2.0 |
| Energy reduction (%) | 91 | 50 | 54 |
a COD of the influent, b COD of the effluent, c hydraulic retention time for MFC, d electricity generation efficiency, e energy consumption, f electricity generation by MFC, g EC for aeration, h EC for post-aeration after MFC treatment.
© 2019 by the authors. Licensee MDPI, Basel, Switzerland. This article is an open access article distributed under the terms and conditions of the Creative Commons Attribution (CC BY) license (http://creativecommons.org/licenses/by/4.0/).
Share and Cite
MDPI and ACS Style
Goto, Y.; Yoshida, N. Scaling up Microbial Fuel Cells for Treating Swine Wastewater. Water 2019, 11, 1803. https://doi.org/10.3390/w11091803
AMA Style
Goto Y, Yoshida N. Scaling up Microbial Fuel Cells for Treating Swine Wastewater. Water. 2019; 11(9):1803. https://doi.org/10.3390/w11091803
Chicago/Turabian StyleGoto, Yuko, and Naoko Yoshida. 2019. "Scaling up Microbial Fuel Cells for Treating Swine Wastewater" Water 11, no. 9: 1803. https://doi.org/10.3390/w11091803
Note that from the first issue of 2016, this journal uses article numbers instead of page numbers. See further details here.