Article

Estimating Evaporation from Irrigation Canals in the Midstream Areas of the Heihe River Basin by a Double-Deck Surface Air Layer (DSAL) Model

1
Key Laboratory of Remote Sensing of Gansu Province, Heihe Remote Sensing Experimental Research Station, Northwest Institute of Eco-Environment and Resources, Chinese Academy of Sciences, Lanzhou 730000, China
2
Key Laboratory of Land Surface Process and Climate Change in Cold and Arid Regions, Chinese Academy of Sciences, Lanzhou 730000, China
3
University of Chinese Academy of Sciences, Beijing 100049, China
4
A School of Water Conservancy, North China University of Water Resources and Electric Power, Zhengzhou 450046, China
5
College of Desert Control Science and Engineering, Inner Mongolia Agricultural University, Hohhot 010018, China
6
Society of Agricultural Meteorology of Japan, Fukuoka 812-0016, Japan
*
Author to whom correspondence should be addressed.
Water 2019, 11(9), 1788; https://doi.org/10.3390/w11091788
Submission received: 16 July 2019 / Revised: 23 August 2019 / Accepted: 23 August 2019 / Published: 28 August 2019
(This article belongs to the Section Hydrology)

Abstract

:
Accurate quantification of evaporation loss from irrigation canals at an irrigation district scale is very useful for developing efficient irrigation strategies, particularly in water-deficient regions. The double-deck surface air layer (DSAL) model, a new aerodynamic method proposed by Kobayashi et al. (2013), is used for estimating the evaporation loss from a running water surface in irrigation canals. In this study, based on the long-term meteorological measurements made at automatic weather stations in 2013 and the field experiment conducted at - midstream areas of the Heihe River Basin (HRB), northwestern China, the DSAL model was applied to estimate the long-term evaporation loss from irrigation canals, which was the remarkable highlight of the study. The results showed that the rate of evaporation from irrigation canals exhibited a concave-up trend for the period from June to September, with higher values in June and September (20 to 50 mm day−1) and lower values in July and August (around 10 mm day−1). During the four months, for the Yingke and Daman irrigation districts in the Zhangye Oasis, the total water losses from irrigation canals due to evaporation were approximately 23.9 × 10⁵ m3 and 36.6 × 10⁵ m3, or 3.2% and 4.8% of the total amount of irrigation water, respectively. Results of the study are not only important for improving the irrigation water use efficiency, but also are beneficial to develop sustainable water resource management in the midstream areas of the HRB.

1. Introduction

Many inland river basins in arid and semiarid regions are suffering from the collapse of water resource system and ecology, because of water scarcity, rapid population growth and economic development, and overexploitation of water resources [1,2]. The competition for water uses between economy and ecosystem is also getting more intense, such as in the Heihe River Basin (HRB) of northwestern China [1,3]. The HRB is a typical inland river basin with an area of approximately 1,432,000 km2; its landscape changes from glaciers and alpine biomes in the upper course through steppes and agricultural ecosystems in the middle course to riparian ecosystems surrounded by vast areas of desert in the lower course [2,4]. Cheng et al. [1] focused on exploring how to coordinate the relationships among water resource sustainability, ecosystem health, and economic development in the HRB. More rational management of water resources and implementation of water-saving practices already have been performed in the midstream areas of the HRB, but there is still an imbalance between irrigation and ecological water consumption in this area.
The midstream areas of the HRB are dominated by agricultural fields, and a considerable amount of surface water from the Heihe River is allocated to irrigating agricultural crops through artificial irrigation canals. In arid regions, water losses from irrigation canals due to seepage and evaporation constitute a substantial proportion of the irrigation water [5,6]. Chen et al. [7] reported that about 20% of the irrigation water could evaporate from the irrigation canals in the midstream areas of the HRB. To use the limited water resources for irrigation efficiently, it is urgently required to know the conditions under which water losses are prone to occur from irrigation canals and to estimate their amounts [6]. In addition, accurate quantification of water loss from irrigation canals due to evaporation is significantly important for developing sustainable strategies of water resource management, particularly in arid regions with limited water resources.
Methods commonly used for estimating evaporation loss from canals include [8,9]: the evaporation pan, the water balance method, the heat balance method (also known as the energy balance method), and the aerodynamic method. Evaporation pans have been commonly used to observe open water evaporation such as a large area of open lake [8]. Generally, irrigation canals are very narrow and long, and the flow speed of water is relatively high. Thus, it is very difficult to implement the evaporation pans on a running water surface [10]. Substantial efforts have been performed to estimate the evaporation loss from agricultural irrigation canals. In 1980s, Wang [11] estimated the evaporation from canals using a simple empirical relationship between evaporation rate and water surface area, but for simplicity, the author assumed that the evaporation rate of canal water was equal to that of a local water surface without considering the complexity of natural environment conditions. Several former studies (e.g., [7,12]) have attempted to use the water balance method to estimate the evaporation loss from irrigation canals. However, it is quite a challenge to obtain accurate water losses due to seepage from the canals, particularly when human disturbance in irrigation water (e.g., illegal pumping of canal water) cannot be ignored [12,13]. Mihara et al. [14] investigated the heat balance on the water surface in “canals for warming water” in northern Japan, and they applied the heat balance method in estimating evaporation loss from canals. Jobson [15] also implemented the heat balance method to estimate the evaporation from an aqueduct in California. The heat balance method is much more practical than the water balance method because it considers the impacts of local micrometeorological conditions. Thus, Wang et al. [10] and Liu et al. [16] recently applied the Mihara’s heat balance method for estimating the evaporation loss from irrigation canals in the midstream areas of the HRB. Based on meteorological measurements from an automatic weather station installed on the bank of a lateral canal (dou qu) in 2012, Wang et al. [10] determined the daily evaporation from the lateral canal; Liu et al. [16] investigated diurnal variation in the rate of evaporation from the lateral canal.
Nevertheless, the water and heat balance methods do not take the flow speed of canal water into consideration when calculating the rate of evaporation from the running water surface. The flow speed of water in irrigation canals in arid regions is designed to be rather high to prevent evaporation losses in transport [17]. It is well known that the rate of evaporation from open water depends on the surface wind speed and increases directly with it. Kobayashi et al. [18] asserted that the rate of evaporation from a running water surface depended not only on the surface wind speed but also on the flow speed of water, and they constructed a formula describing the functional dependence of evaporation rate on wind speed and water flow speed based on a double-deck surface air layer model (hereafter referred to as “DSAL model”) over a running water surface. The DSAL model proposed by Kobayashi et al. [18] is operational for estimating the evaporation loss from the water flowing in canals under consideration of water flow speed and wind speed. Details of the DSAL model will be described in the following section. Mori et al. [6] and Kobayashi et al. [17] demonstrated that the DSAL model is applicable to actual agricultural irrigation canals using the micrometeorological variables and stream flow speed. Based on the meteorological measurements made at a lateral canal in the midstream areas of the HRB in 2013, Liu et al. [9] have made comparisons between the estimates of canal evaporation by the DSAL model and the heat balance method being used commonly; and they found that although there were large differences in daily evaporation between the two approaches, the cumulative evaporation over several days had a difference of about 16%, a value within the range of 10% to 20% given by Kobayashi et al. [17]. Wei et al. [19] also applied the DSAL model to estimate daily evaporation from a lateral canal at the same study area based on the meteorological data over several days in 2013. The aforementioned results of the DSAL model appear to substantiate that the DSAL model is reliable for monitoring the evaporation loss from the water flowing in canals. However, the DSAL model has not been applied over the entire irrigation period due to lack of measurements of stream temperature. Furthermore, evaporation loss from canals has not been quantified at the irrigation district-scale with the DSAL model ever before.
This study focused on estimating the evaporation loss from all-level irrigation canals over the whole irrigation period by using the DSAL model. The main issues are: (1) To prepare long-term time series of the input data for the DSAL model, including the wind speed, relative humidity, air temperature, and canal water temperature from the meteorological observations made at a nearby automatic weather station by extrapolation and others; (2) to check the reliability of such extended data by comparing the estimates of evaporation rate during the intensive experiment period between the results based on the observations and on the extended data; and (3) to estimate the total evaporation loss from the whole irrigation canal network during the whole irrigation period.

2. Study Area and Data

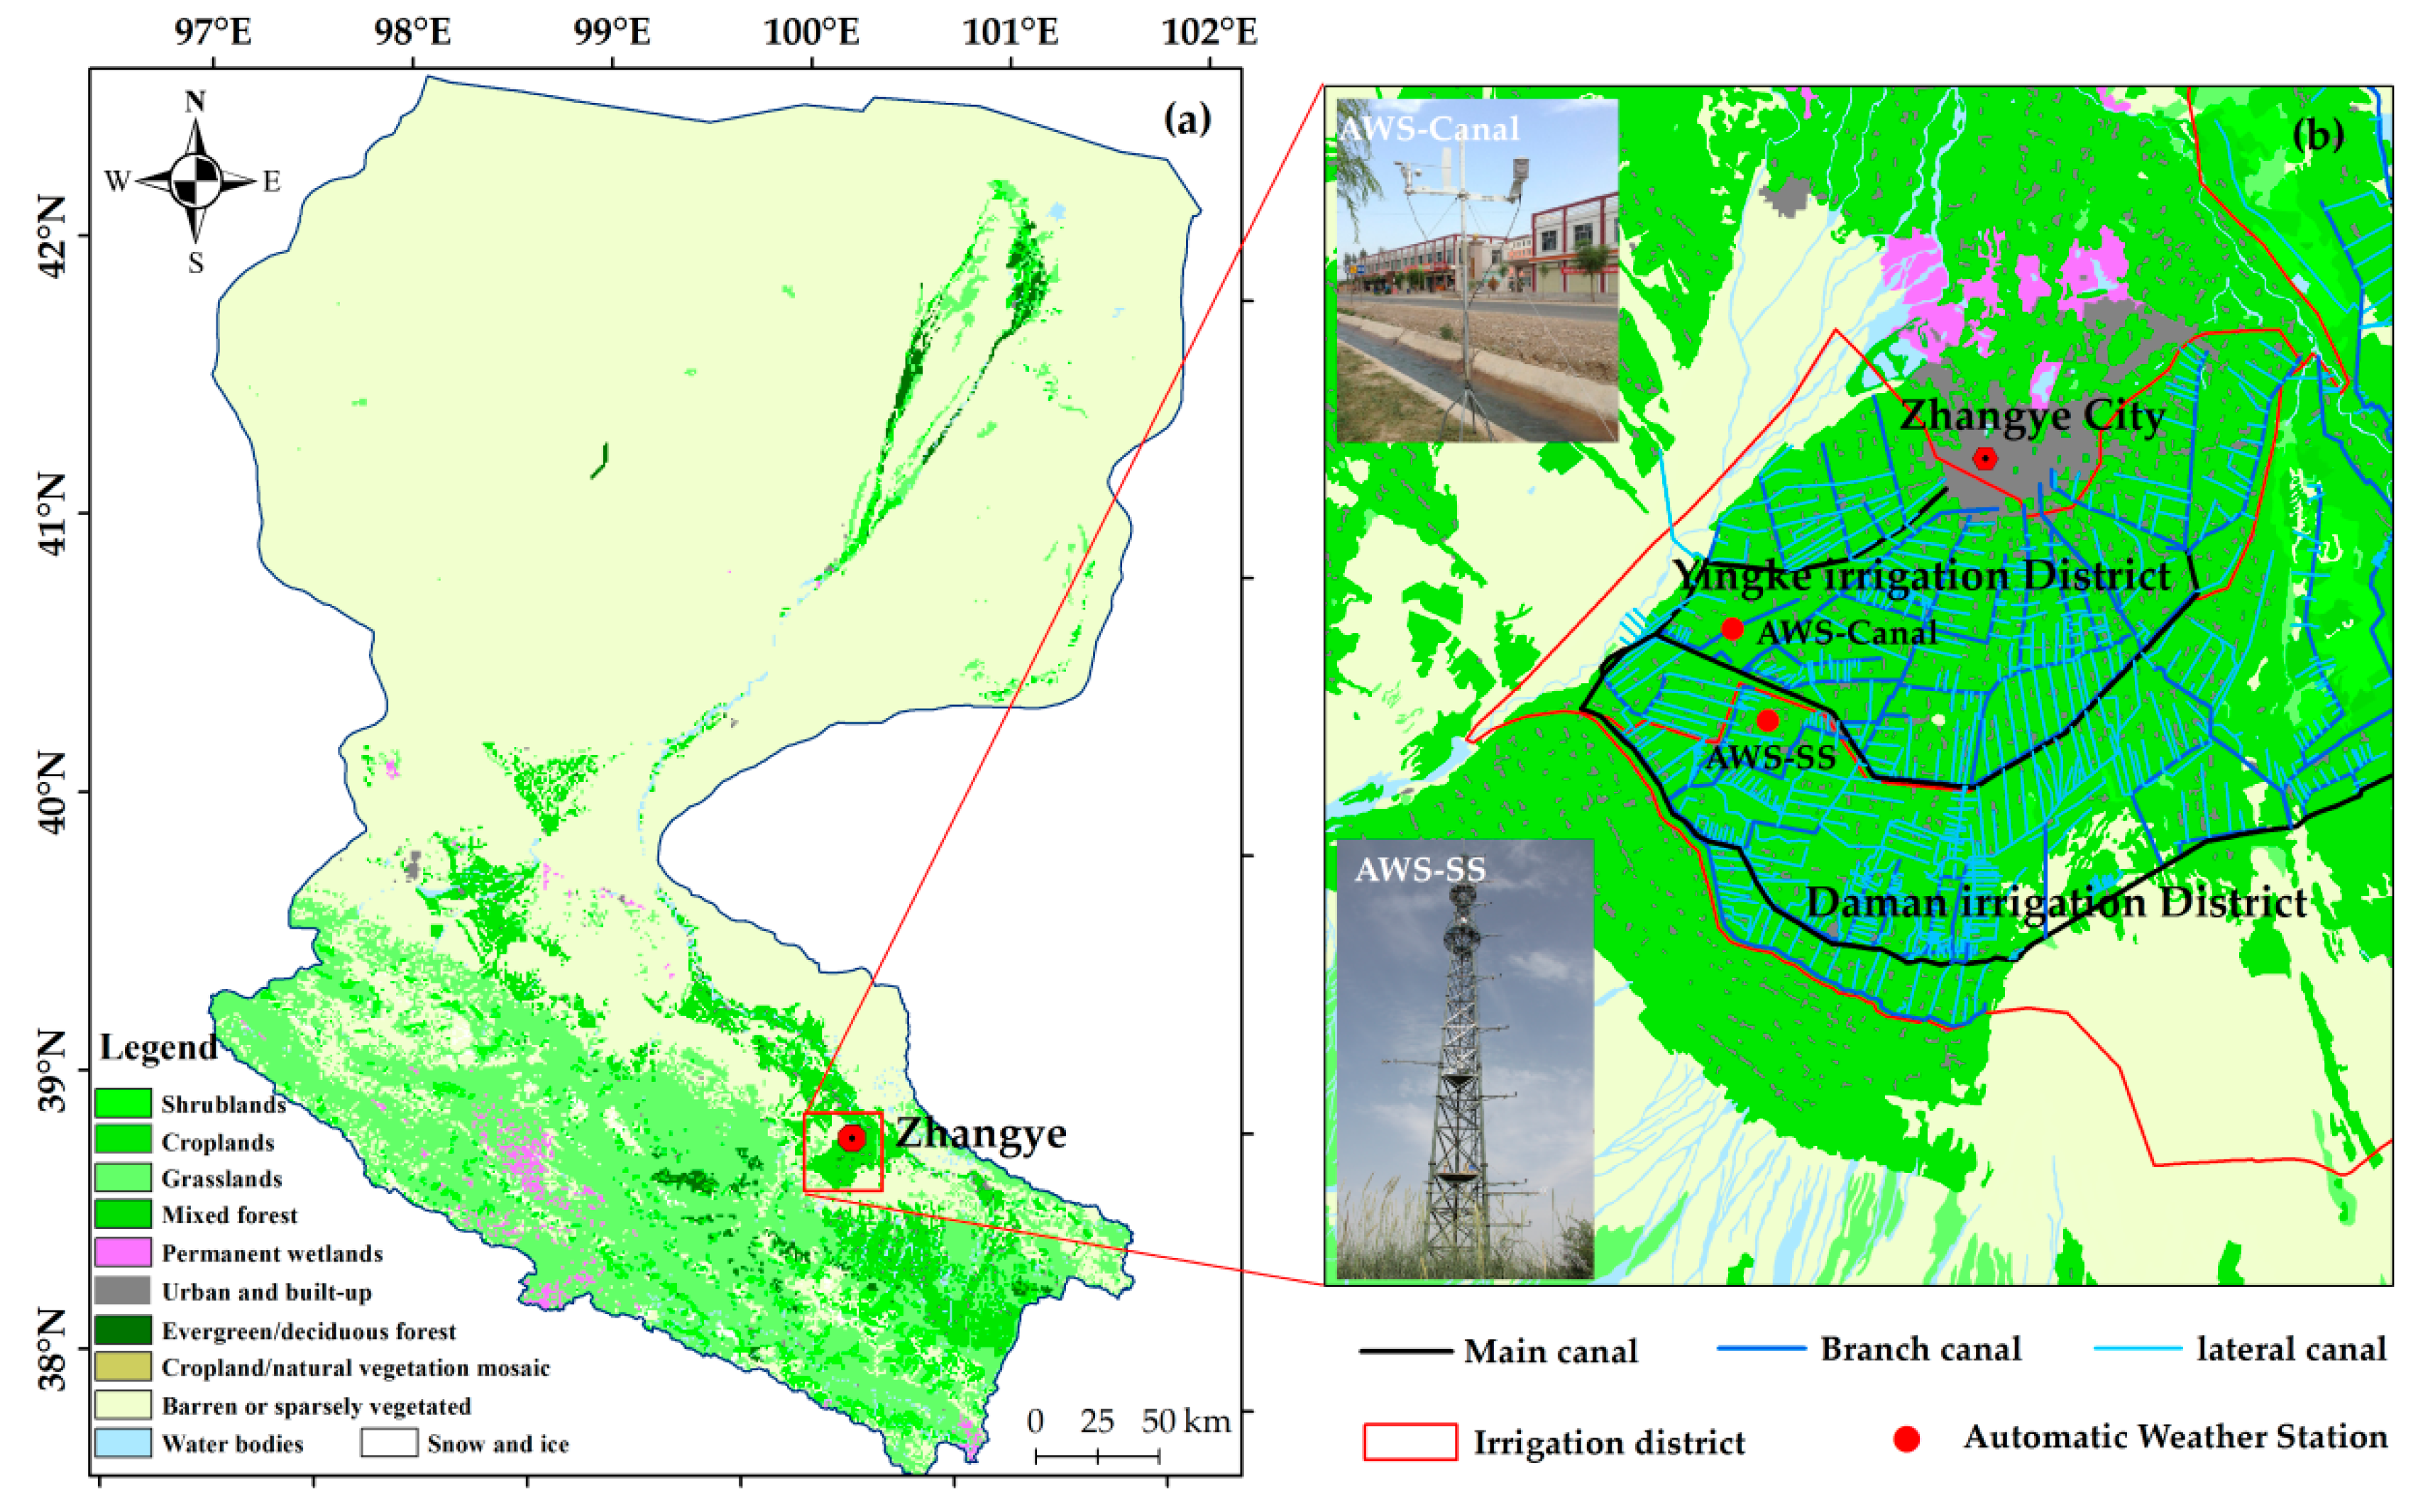
2.1. Description of Study Area

The study area is located at the Zhangye Oasis in the midstream areas of the HRB in northwestern China (Figure 1a). The area includes two typical irrigation districts, namely the Yingke and Daman irrigation districts, in which wheat and corn are mainly grown. The annual mean temperature is about 8 °C, and the precipitation is approximately 100 to 200 mm per year from 1970 to 2012 [2]; while the potential evaporation is as high as 1200 to 1800 mm per year [4]. In the Yingke-Daman irrigation district, higher air temperature (19–20 °C) and relative humidity (70%) occurred at July and August in 2013; in June and September, the relative humidity was around 60%, and the air temperature was about 18 and 14 °C, respectively. For the period of June to September 2013, the cumulative precipitation was 112.8 mm, which accounted for 83% of the total precipitation in the whole year of 2013.
The total amount of water resources available to Zhangye City is 26.5 × 10⁹ m3 per year, and the amount of water available for agricultural irrigation is about 18.64 × 10⁹ m3 per year [20]. It means that more than 70% of the water is supplied for agricultural use, particularly in an area under water scarcity. The diversion canals in the HRB are divided into five levels according to its width like the stream ordering in surface water hydrology, namely, main canal, branch canal, lateral canal, field canal, and field ditch. In the midstream areas of the HRB, the main and branch canals that extend for 4700 km have been paved by concrete. The total lengths of the lateral and field canals are about 1,4000 km. Most of the lateral canals have been paved, while only 30% of the field canals have been paved [15].
The irrigation canals in the Zhangye Oasis are densely distributed (Figure 1b). In the Yingke irrigation district, the lengths of main canal, branch canal, lateral canal, and field canal are about 39.46, 128.86, 299.71, and 665.60 km, respectively; their lengths in the Daman irrigation district are about 59.70, 202.66, 597.65, and 796.00 km, respectively [21,22]. The canals are paved using precast concrete walls with designed thickness of about 10 cm and have a round-bottomed triangle cross section. The gap between the concrete walls and the ground is stuffed with porous material such as gravel and dry sand.

2.2. Data Collection

In 2012, a comprehensive eco-hydrological experiment campaign (HiWATER [4]) was performed in the Zhangye Oasis, and a superstation (AWS-SS; latitude: 38°51′36″ N, longitude: 100°22′12″ E) was setup in the farmland of the Daman irrigation district (Figure 1b). The AWS-SS station was equipped with instruments for measuring wind speed (Windsonic, Gill, Lymington, UK), air temperature, and relative humidity (AV-14TH, Avalon, Somerton, Somerset, UK) at heights of 3, 5, 10, 15, 20, 30, and 40 m. The four-component radiometer was installed at 12 m. Observations made at the AWS-SS station (http://card.westgis.ac.cn/hiwater, doi:10.3972/hiwater.189.2014.db) were taken at intervals of 10 min [23]. In this study, wind speed at heights of 3 and 5 m, and air temperature and relative humidity at 3 m height during the period June–September 2013 were used for the following analysis.
Additionally, another field experiment on canal evaporation was conducted in a lateral canal (U-shaped) in the Yingke irrigation district. The cross section of the canal has a width of about 1.8 m and a depth of about 0.6 m, and the water flows toward the east-southeast (ESE). An automatic weather station (AWS-Canal; latitude: 38°52′48″ N, longitude: 100°21′36″ E) was installed on the bank of a lateral canal (see Figure 1b). The meteorological measurements were also taken, and intensive field observations were performed at the AWS-Canal from 8 June to 8 July 2013. In this irrigation district, the canals have running water, in general, every 20 days, and every irrigation lasts for 3 to 5 days. So, the intensive observation was conducted during a few irrigation periods. Observation elements taken at the AWS-Canal station included wind speed (010C-1, Met One, Washington, D.C., USA), air temperature and relative humidity (HMP45AC, Vaisala, Helsinki, Finland), and four-component radiation (CNR4, Kipp and Zonen, Netherland). All the instruments were installed at about 2 m above the ground and the measurements were logged every 10 min by a digital micro-logger. The net radiation sensor was set up at 0.2 m height above the water surface. Water temperature (Mercury thermometer) and flow speed (Flowatch, Switzerland), as well as water level (U20-001-04, Onset, Bourne, MA, USA), were measured manually every hour or half an hour.

3. Methods

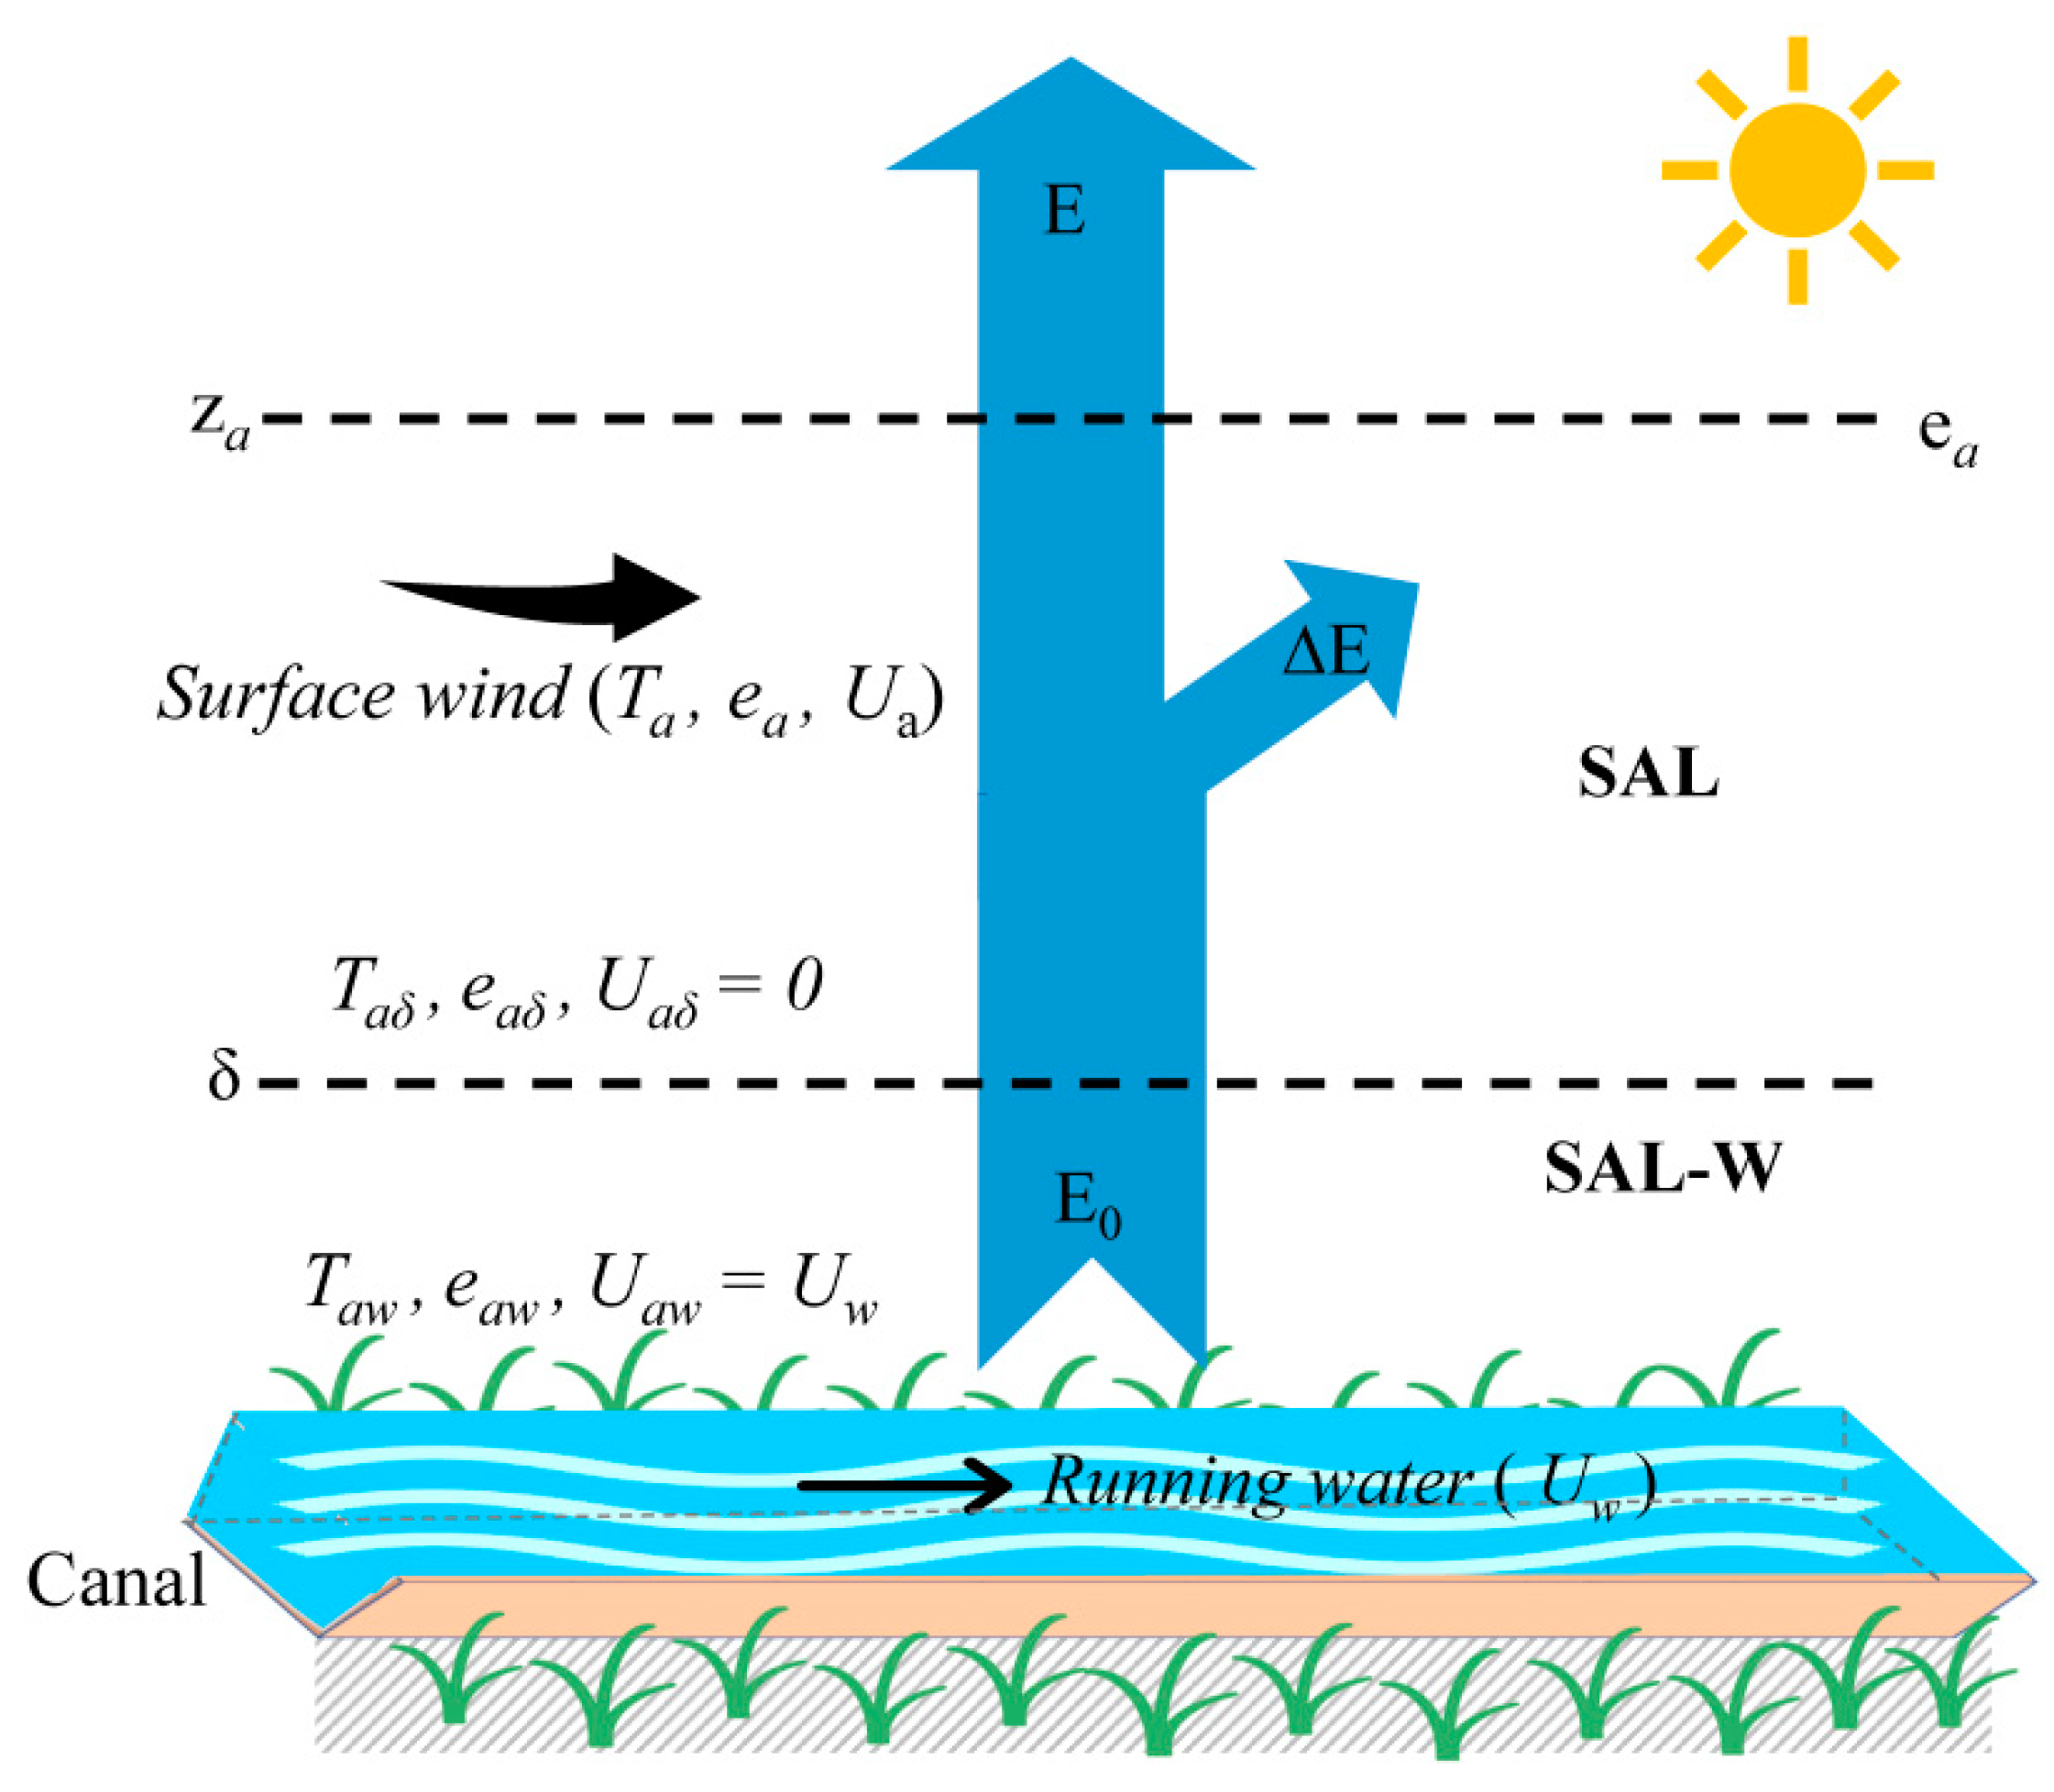
3.1. Double-Deck Surface Air Layer (DSAL) Model

The schematic diagram of the double-deck surface air layer (DSAL) model [18] over the flowing water surface is shown in Figure 2. The composite surface air layer consists of two sub-layers, one being the lower surface air layer dragged by the flowing water in the canal (SAL-W), in which there is no advection because the wind fetch is unlimited, and the other being the upper surface air layer (SAL) that grows over the SAL-W by the surface wind, in which advection is likely to occur [17]. In Figure 2, the thickness of the SAL-W is δ, with a typical value ranging between 0.1 and 0.2 m. Uw is the flow speed of water in the canal (m s−1), and Ua is the wind speed (m s−1), Ta is the air temperature (K), and ea is the actual water vapor pressure of air temperature at height za in the SAL (hpa). The second subscripts δ and w refer to values at the top and bottom of the SAL-W. Thus, U is the wind speed at the height δ and Uaw is that at the bottom of SAL-W (m s−1), which is defined to be equal to Uw. Here, the wind-wise and flow-wise components of the momentum at height δ are assumed to be zero in order to assure the upward water vapor fluxes through the two sub-layers, ESAL-W and ESAL, are equal in magnitude at the boundary. They can be expressed by the bulk equations as:
E SAL-W = A U w ( e w e a δ ) ,
E SAL = B U a ( e a δ e a ) ,
where A and B are the bulk coefficients for the SAL-W and SAL, respectively; ew is calculated as the saturated water vapor pressure for the temperature of water, and ea is calculated as the actual water vapor pressure for the air temperature.
If isothermal conditions and logarithmic vertical profiles of wind speed and air humidity prevail in the two sub-layers, the water vapor flux is assumed to be invariable with height in each sub-layer, or under the assumption of no advection, the coefficients A and B are expressed as [18]:
A = 18 k 2 R T { ln ( δ / z w 0 ) } 2 ,
B = 18 k 2 R T { ln ( z a / δ ) } 2 ,
where zw0 is the roughness length of the running water surface, with a value approximately 1 × 10⁻⁵ m; za is the measurement height of air temperature (2 m); R is the gas constant, 8.314 J (mol K)−1; T is the absolute air temperature (K), and k is the von Kármán constant (= 0.4). Here, the roughness length for the SAL is supposed to be δ, defined as 0.1065 m [6].
At the boundary of the SAL and SAL-W, it is assumed that there is no momentum (U = 0) while the water vapor transfers through the surface air layer and the water vapor flux at the boundary between the two sub-layers is continuous. Under this assumption, E SAL-W is the same as E SAL at the boundary between the two sub-layers. Hence the rate of evaporation (E) is expressed as:
E = A U w ( e w e a δ ) = B U a ( e a δ e a ) ,
According to Equation (5), the water vapor pressure at the height δ is defined as:
e a δ = ( e w + B U a A U w e a ) ( 1 + B U a A U w ) ,
Thus, combining Equation (6) and Equation (1) or Equation (2), E can be finally expressed as:
E = B 1 + B U a A U w U a ( e w e a ) ,
The rate of evaporation from running water surfaces (E, mm 10 min−1) can be estimated by Equation (7), which is related to the surface wind speed, the flow speed of water, and water vapor pressure.
When the surface wind blows in the same direction as the water stream, the relative wind speed to water flow speed is | U a U w | ; in the opposite direction, the relative wind speed is | U a + U w | ; then, the DSAL does not fully develop and the usual single-story boundary layer is formed. In such as a case, the rate of evaporation can be expressed as: E = A | U a U w | ( e w e a ) , where A is the bulk coefficient for these special cases.
In the case when the advection occurs in the SAL (Figure 2), the condition of continuity at the boundary between the two sub-layers is re-written as E = A U w ( e w e a δ ) = B U a ( e a δ e a ) , where primed symbols represent quantities under conditions of advection. The bulk coefficient B′ is equal to the B, plus an increment due to the advection, so B′ > B, and E′ > E as is evident from Equation (7). In Figure 2, E0 represents the actual evaporation rate, E′, which is unknown, and E calculated from Equation (7) is less than E0 by ΔE, which shows the advection effect. Kobayashi et al. [17] showed that the rate of evaporation calculated from Equation (7) would be underestimated by 10% to 20% on average.

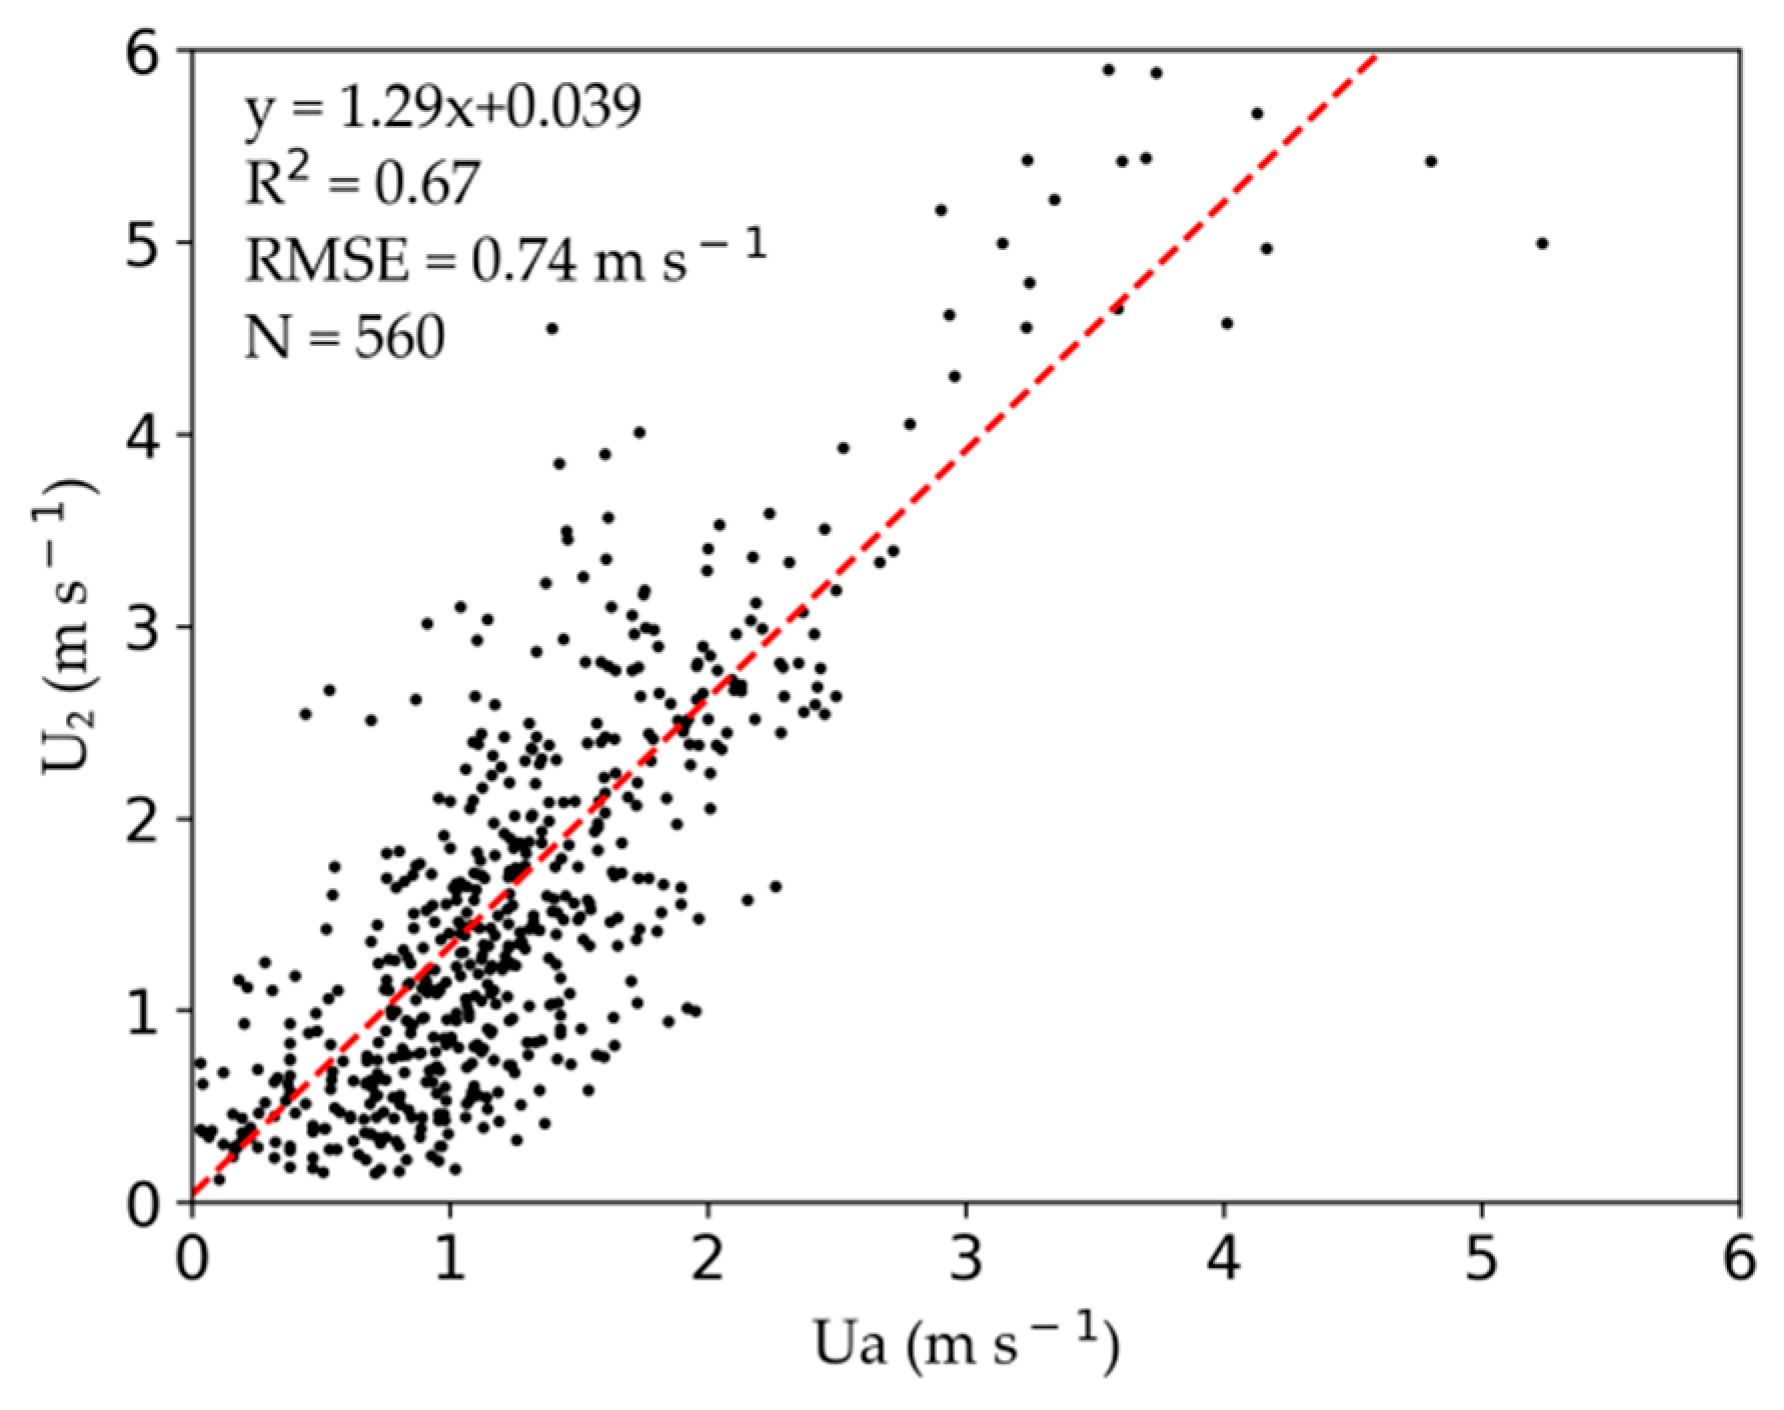
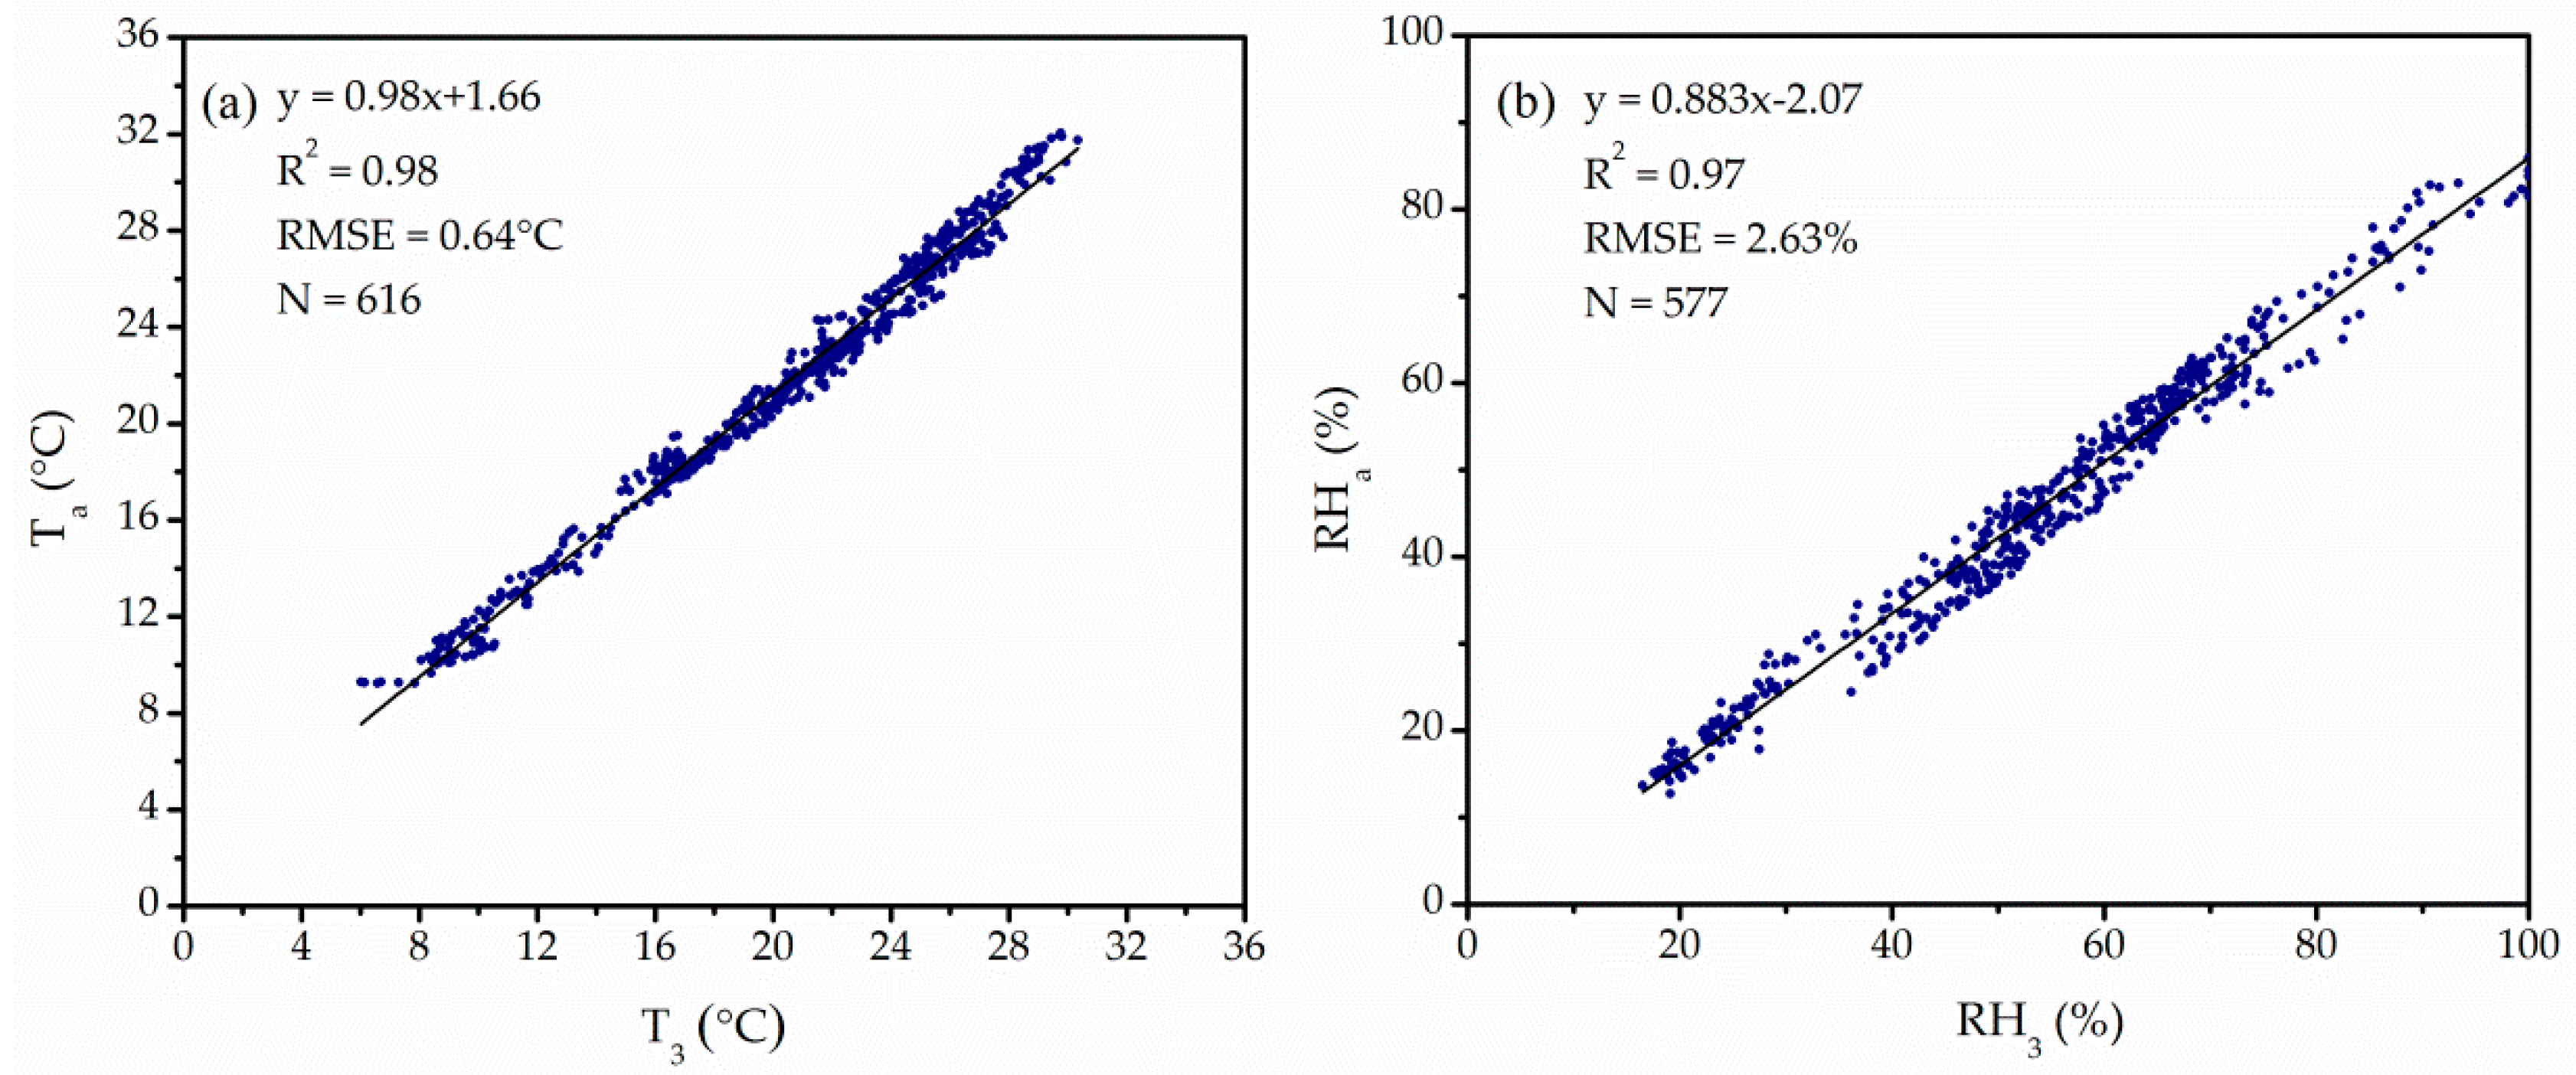
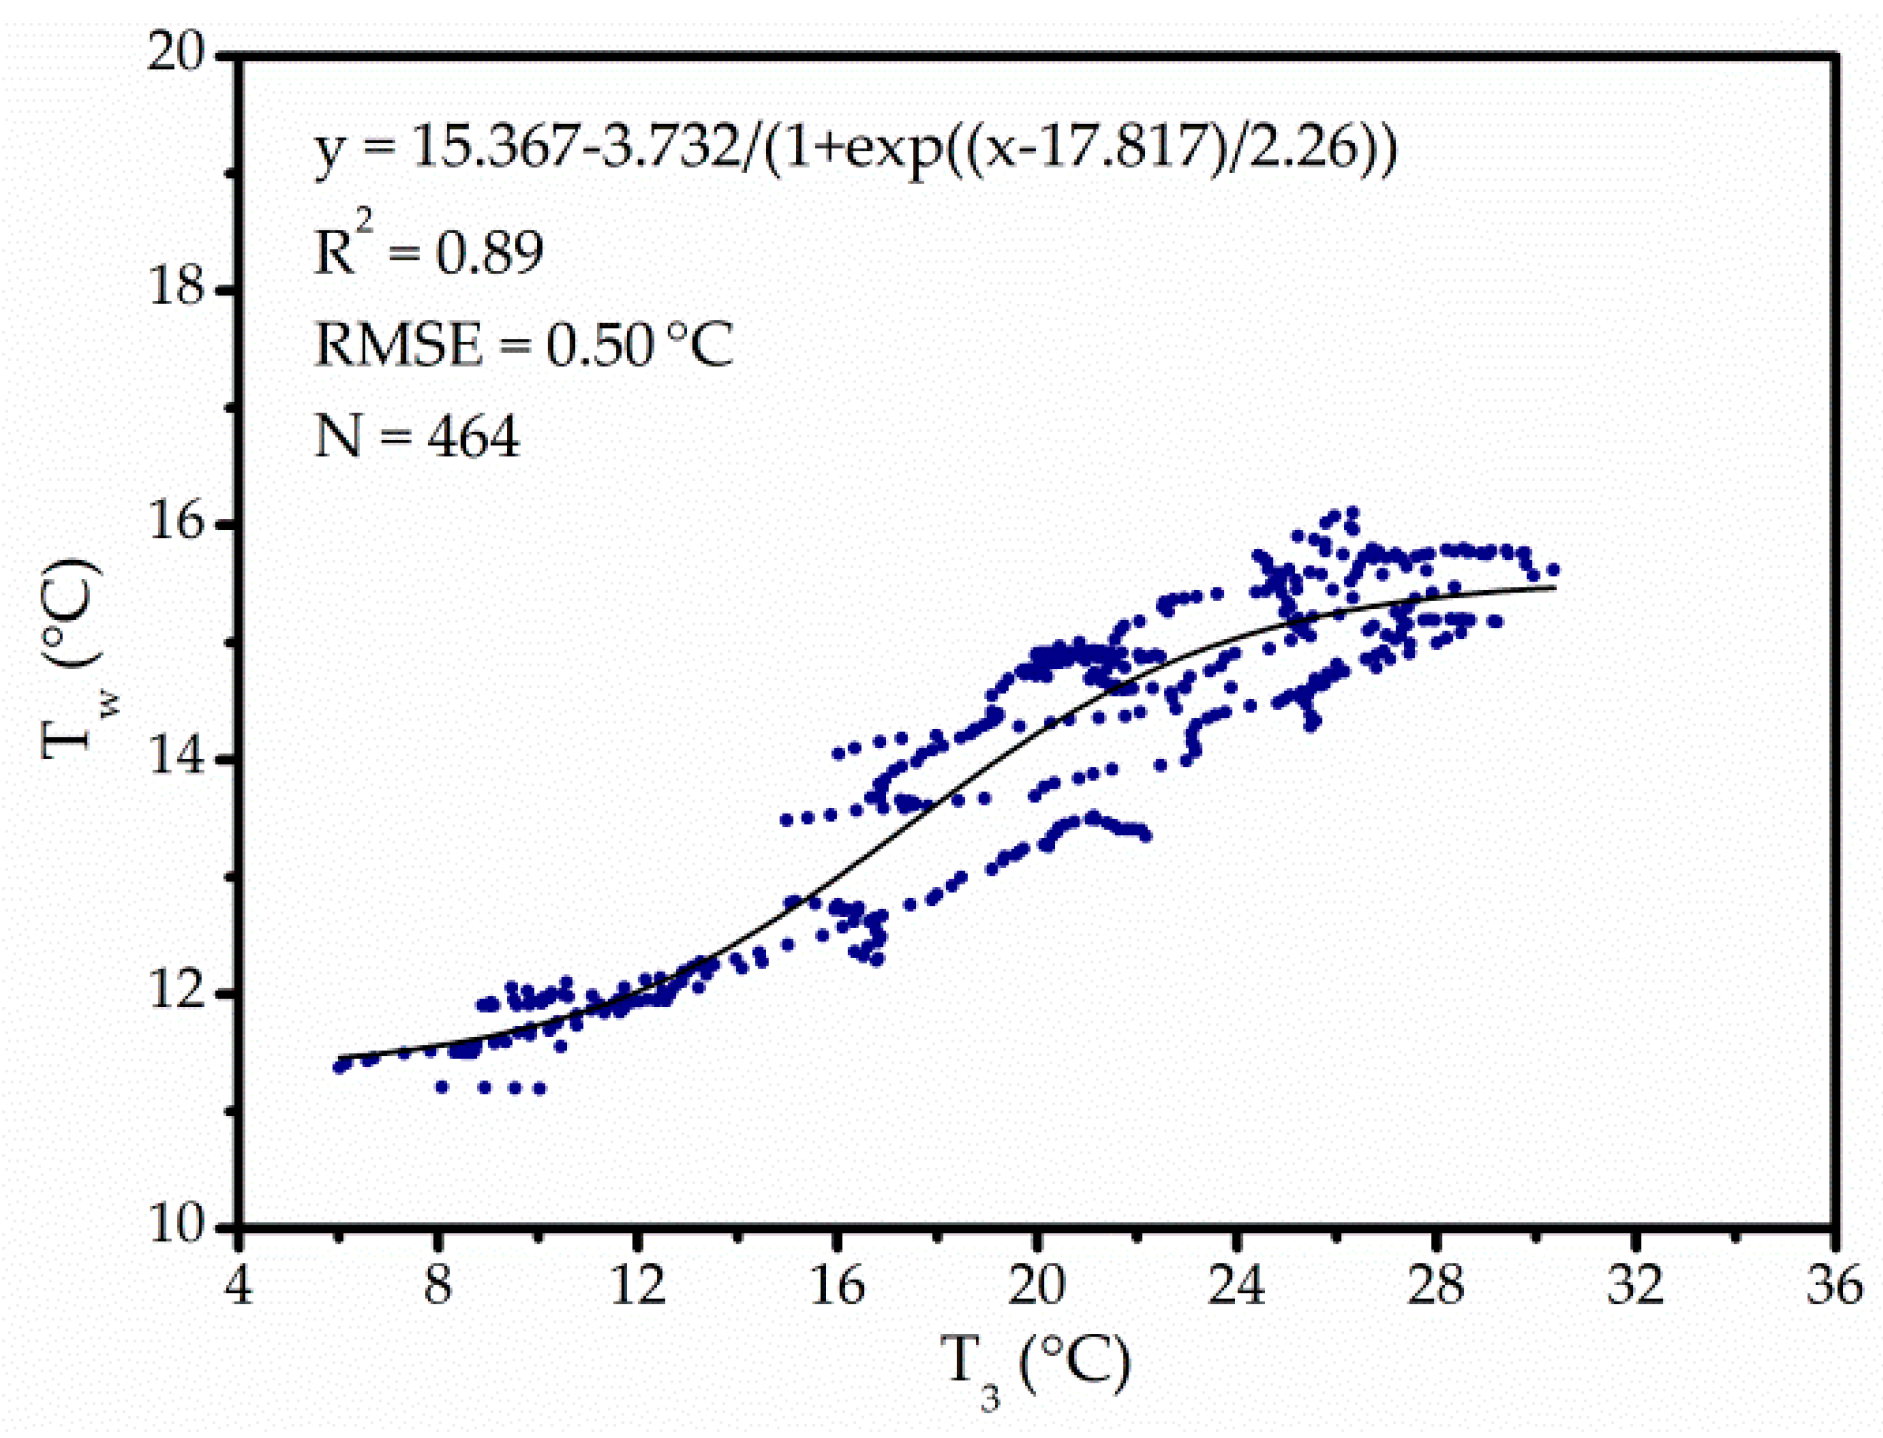
3.2. Preparation of Input Data

In order to estimate the evaporation from the irrigation canal network for the whole irrigation period using the DSAL model, the long-term time series of the input data for the model were prepared. Initially, the relationship between the meteorological measurements made at AWS-Canal and the data obtained routinely at AWS-SS were examined based on the mathematical regression method, because the intensive field observation was performed only for one month (8 June–8 July, 2013) at AWS-Canal.
The wind speeds at a height of 2 m above the canal bank (Ua) were compared with the estimates of the wind speed at 2 m at AWS-SS (U2), which were calculated from the wind speed measurements at 3 m (U3) and 5 m (U5) at AWS-SS by supposing the logarithmic vertical profile as:
U 2 = U 3 + U 5 U 3 ln ( 5 3 ) ln ( 2 3 ) .
Since the wind speed near the ground surface changes irregularly, reflecting the local environment around the observation site, the correlation between Ua and U2 was not good (R2 = 0.66, Figure 3), but it was observed that U2 gave results in the right order of magnitude (RMSE = 0.68 m s−1) for Ua. Thus, U2 was substituted for Ua in this analysis.
T a = 0.98 T 3 + 1.66 ,
RH a = 0.883 RH 3 2.07 .
Equations (9) and (10) were determined by fitting linear regression equations through N pairs of air temperature (T) and relative humidity (RH) measurements made at 2 m at AWS-Canal (Ta, RHa) and 3 m at AWS-SS (T3, RH3), see Figure 4. Since the RMSE values for T and RH shown on the figures seem to be within acceptable limits, Equation (9) and Equation (10) were used to get the input data of Ta and RHa for the DSAL model.
At this study area, the temperature of water flowing through the irrigation canals is not significantly different from that of the source river, namely Heihe River. Air temperature is the most contributing factor to the river water temperature in all the meteorological variables [24,25]. Thus, the relationship between the canal water temperature (Tw) and the 3 m air temperature observed at AWS-SS (T3) was determined by fitting a regression equation like the Boltzmann model as follows:
T w = 15.367 3.732 1 + exp ( T 3 17.817 2.26 ) .
In Figure 5, the canal water temperature showed a close relationship with surface air temperature, with R2 of 0.89 and RMSE of 0.50 °C. In this study, Equation (11) was used for estimating the temperature of water running through the irrigation canals for the whole irrigation period.
The input data for the DSAL model, that is, the air temperature (Ta), relative humidity (RHa), wind speed at 2 m height (Ua = U2), and canal water temperature (Tw), can be obtained from the data observed at AWS-SS using Equations (8)–(11), which are called “extended” data hereafter. The extended data are assumed to be independent with locations in the study area. The speed of water flow in the canal (Uw) was measured in situ during the intensive observation period in 2013.

3.3. Evaporation Loss from Irrigation Canals

In this analysis, the rate of evaporation per 10 min was firstly calculated by Equation (7), and then it was summed up over the course of the whole irrigation period. The evaporation loss from the irrigation district was estimated according to the following expression:
E T = t , δ E ( t ) A δ L δ Δ t ,
where ET is the total evaporation from all levels of canals in the district (main canal, branch canal, lateral canal, field canal) for the irrigation period (m3), Aδ is the width of water surface in the canal of level δ (m), Lδ is the length of canal of level δ (m), and t is the time during the irrigation period, and Δt = 10 min. The summation is done over the whole irrigation period and all levels of canals. In this study area, Aδ of the main canal is 5.5 m, the branch canal 2.5 m, the lateral canal 0.9 m, and the field canal 0.6 m. The values of Lδ were given in Section 2.1.
The ratio of evaporation loss to the total amount of irrigation water (REL) is expressed as:
R EL = E T IW ,
where IW is the total amount of water taken from the source river (Heihe River), which is the product of the cross-sectional area of all the main canal times the water flow speed through the main canal, multiplied by the duration of irrigation. These values were measured in the field, the typical values of which were 3.722 m2 and 2.68 m s−1, respectively. The detailed schedules of irrigation operation at our study areas were provided by the water resource bureau of Zhangye municipal government (WRBZM).
The WRBZM also provides the official values of the water use efficiency of the irrigation canal (CWUE) for each level in the study area. The CWUE, of course, includes the contribution of evaporation loss, which is determined by some conventional technique, although its details are unknown to us. Official values of CWUE for the main canal and the lateral canal are 0.89, the branch canal 0.886, and the field canal 0.88. Another purpose of this study is to specify what portion of the water loss from irrigation canals arises from the surface evaporation using the DSAL model.

4. Results and Discussion

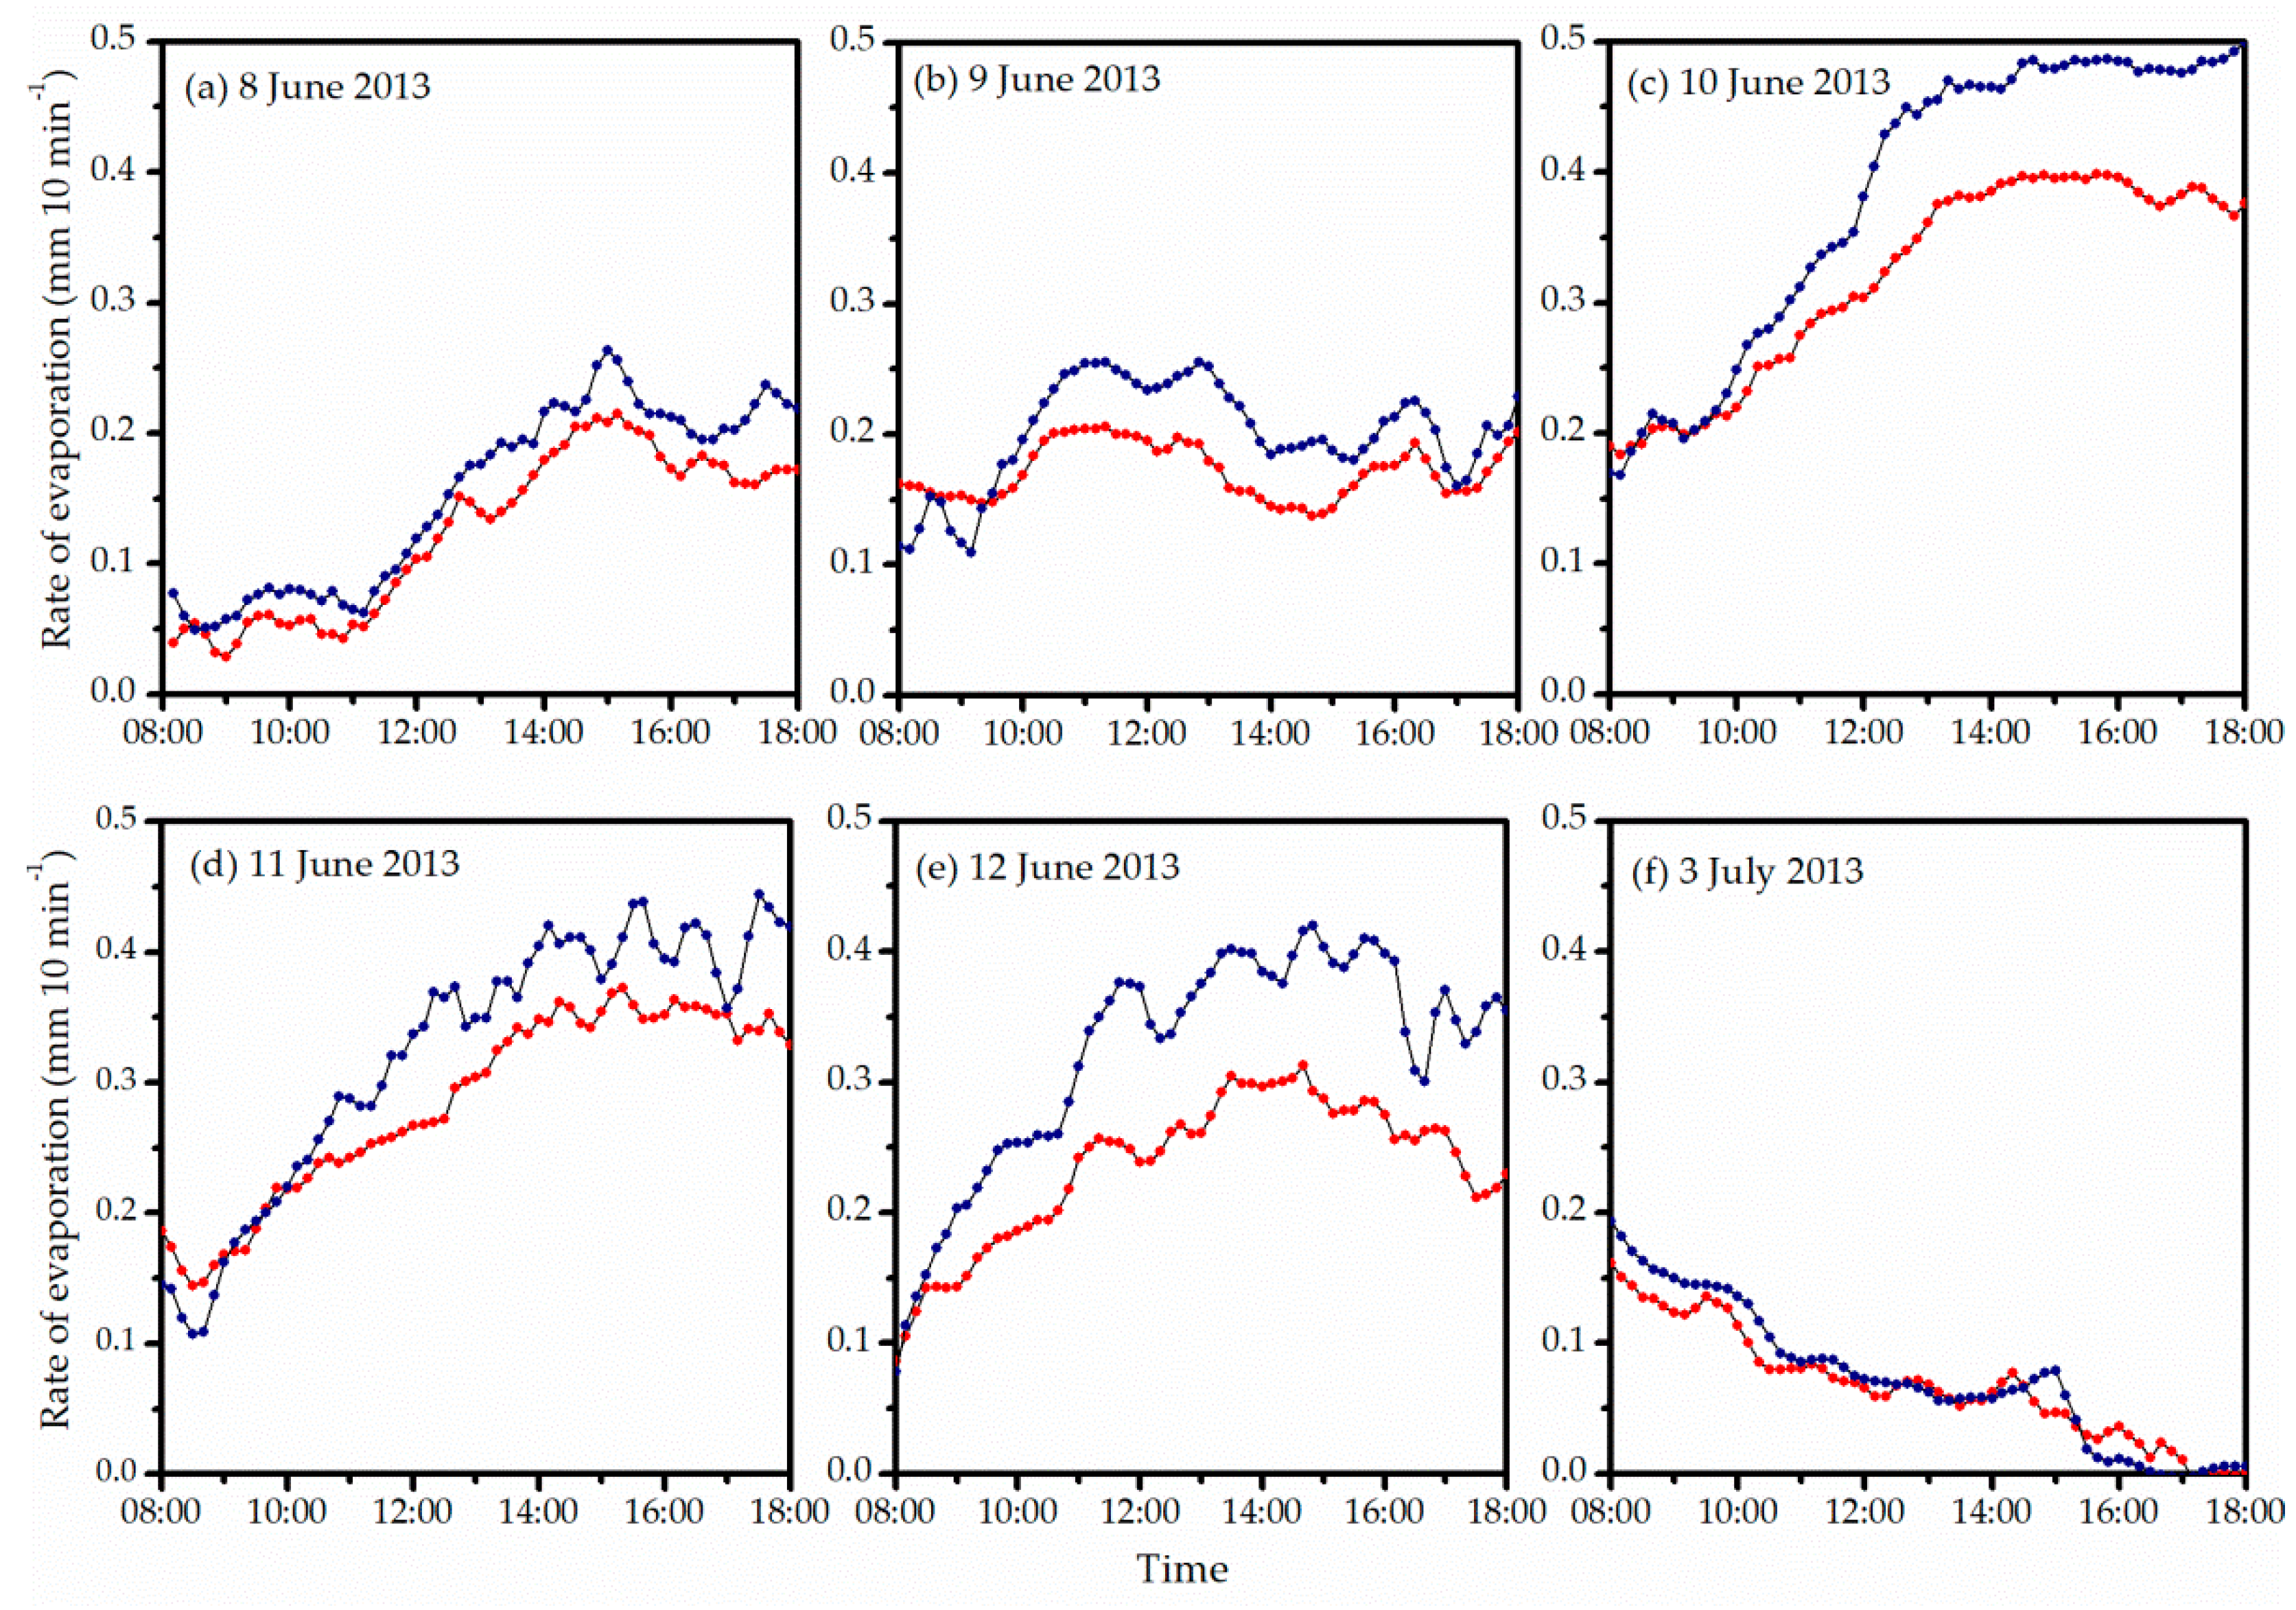
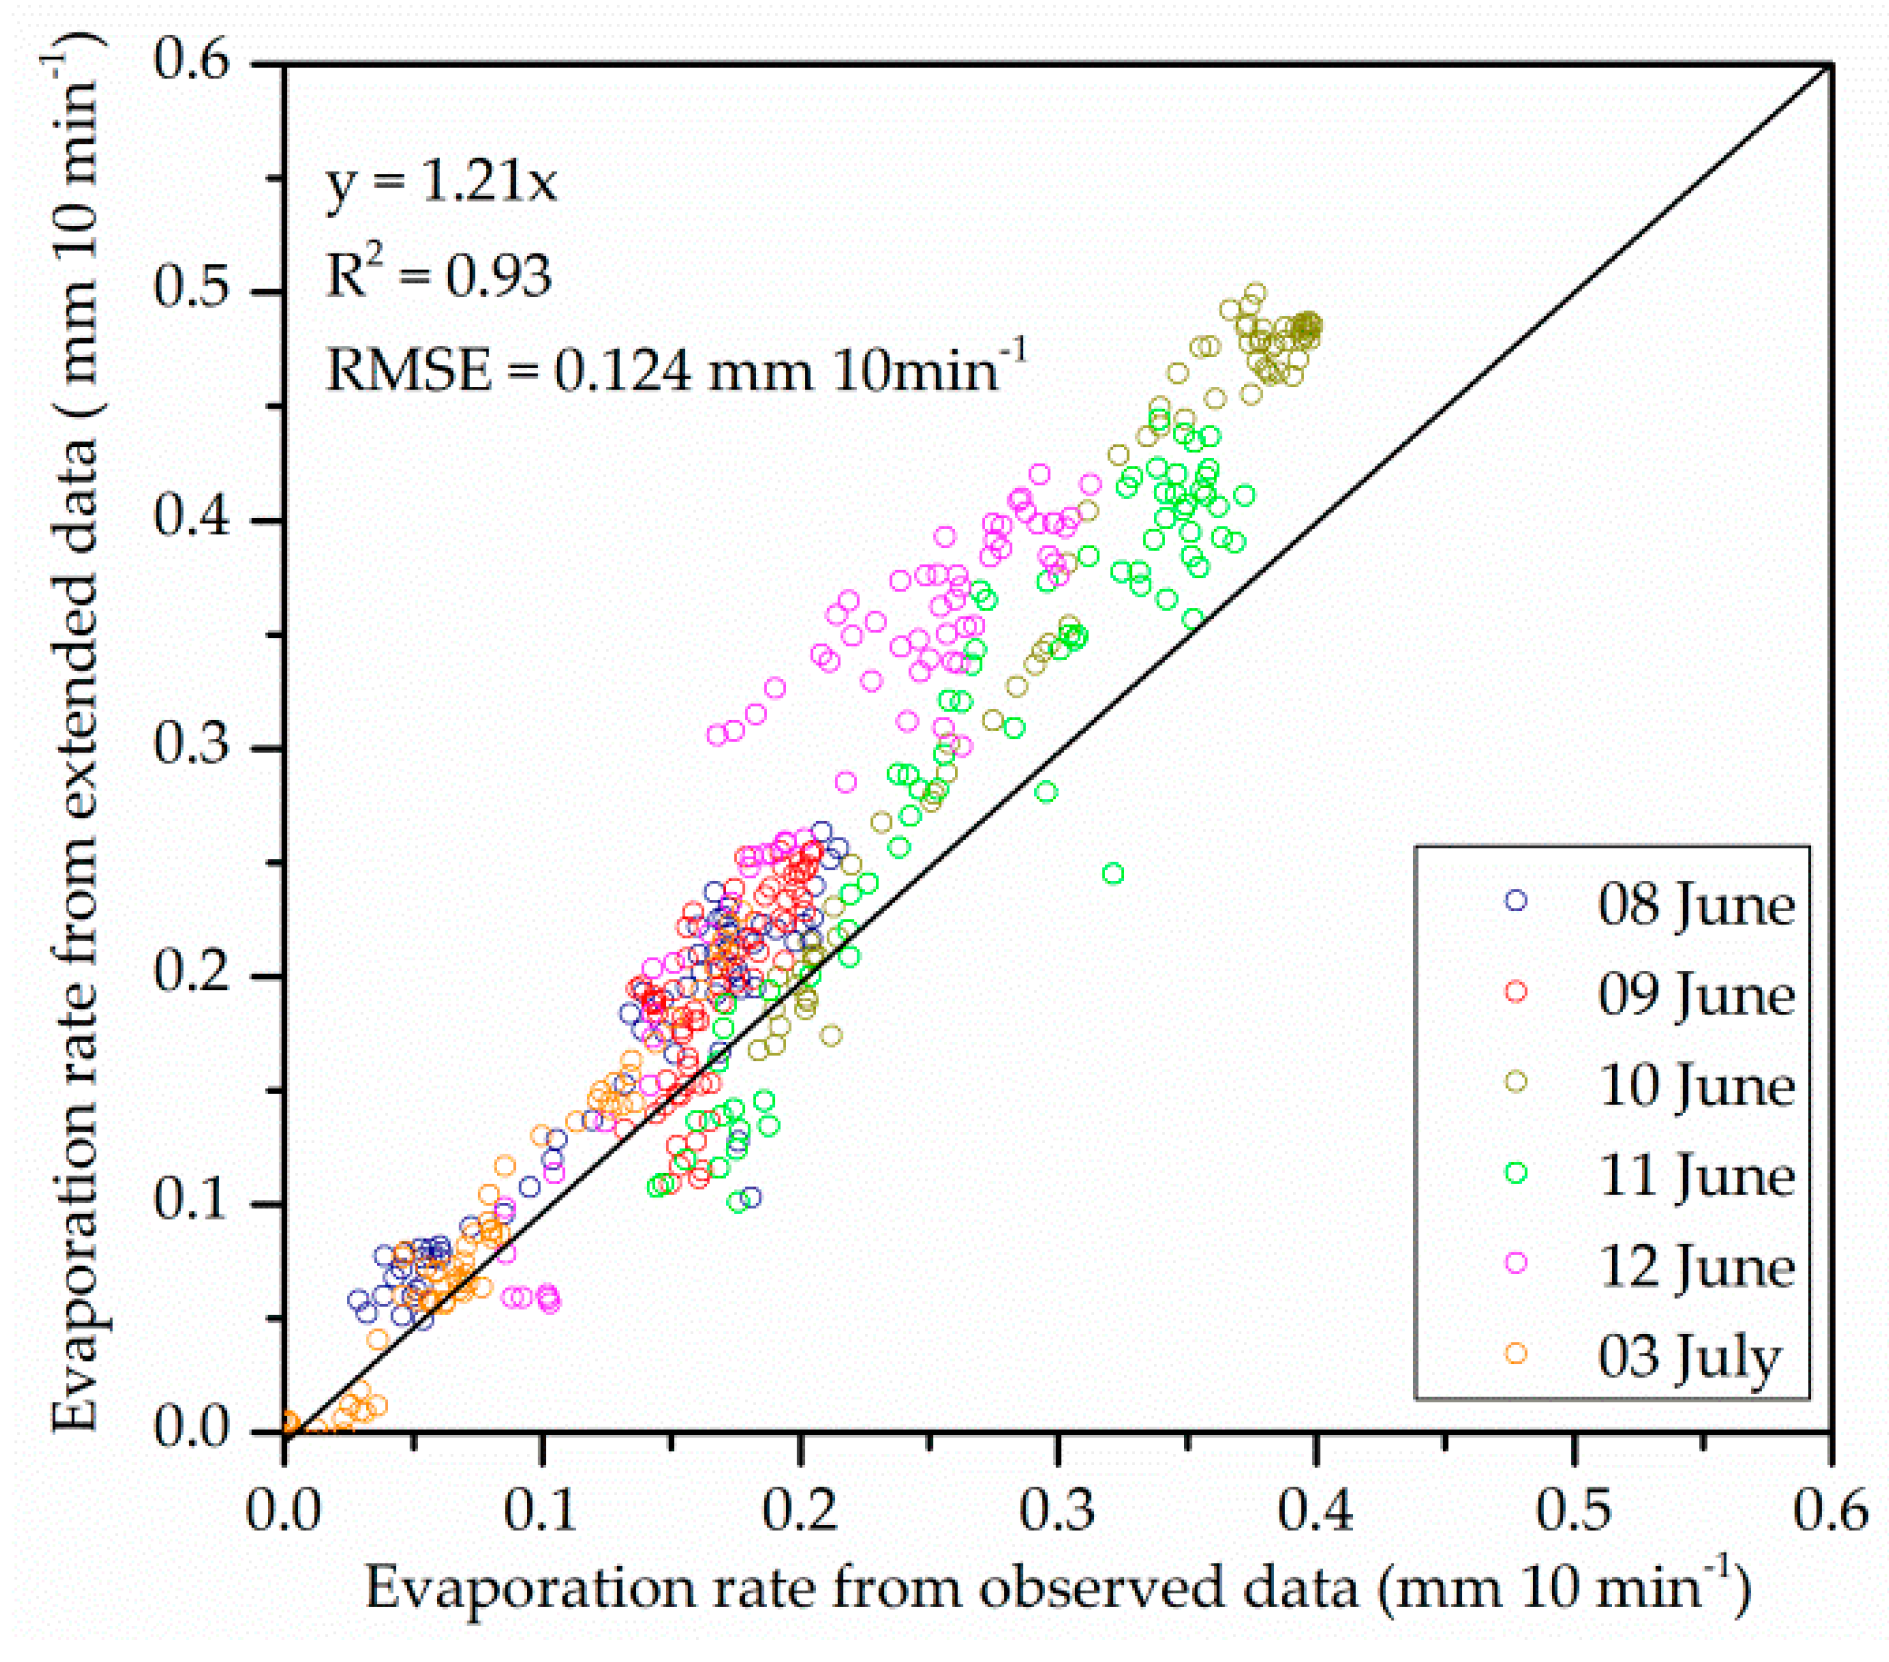
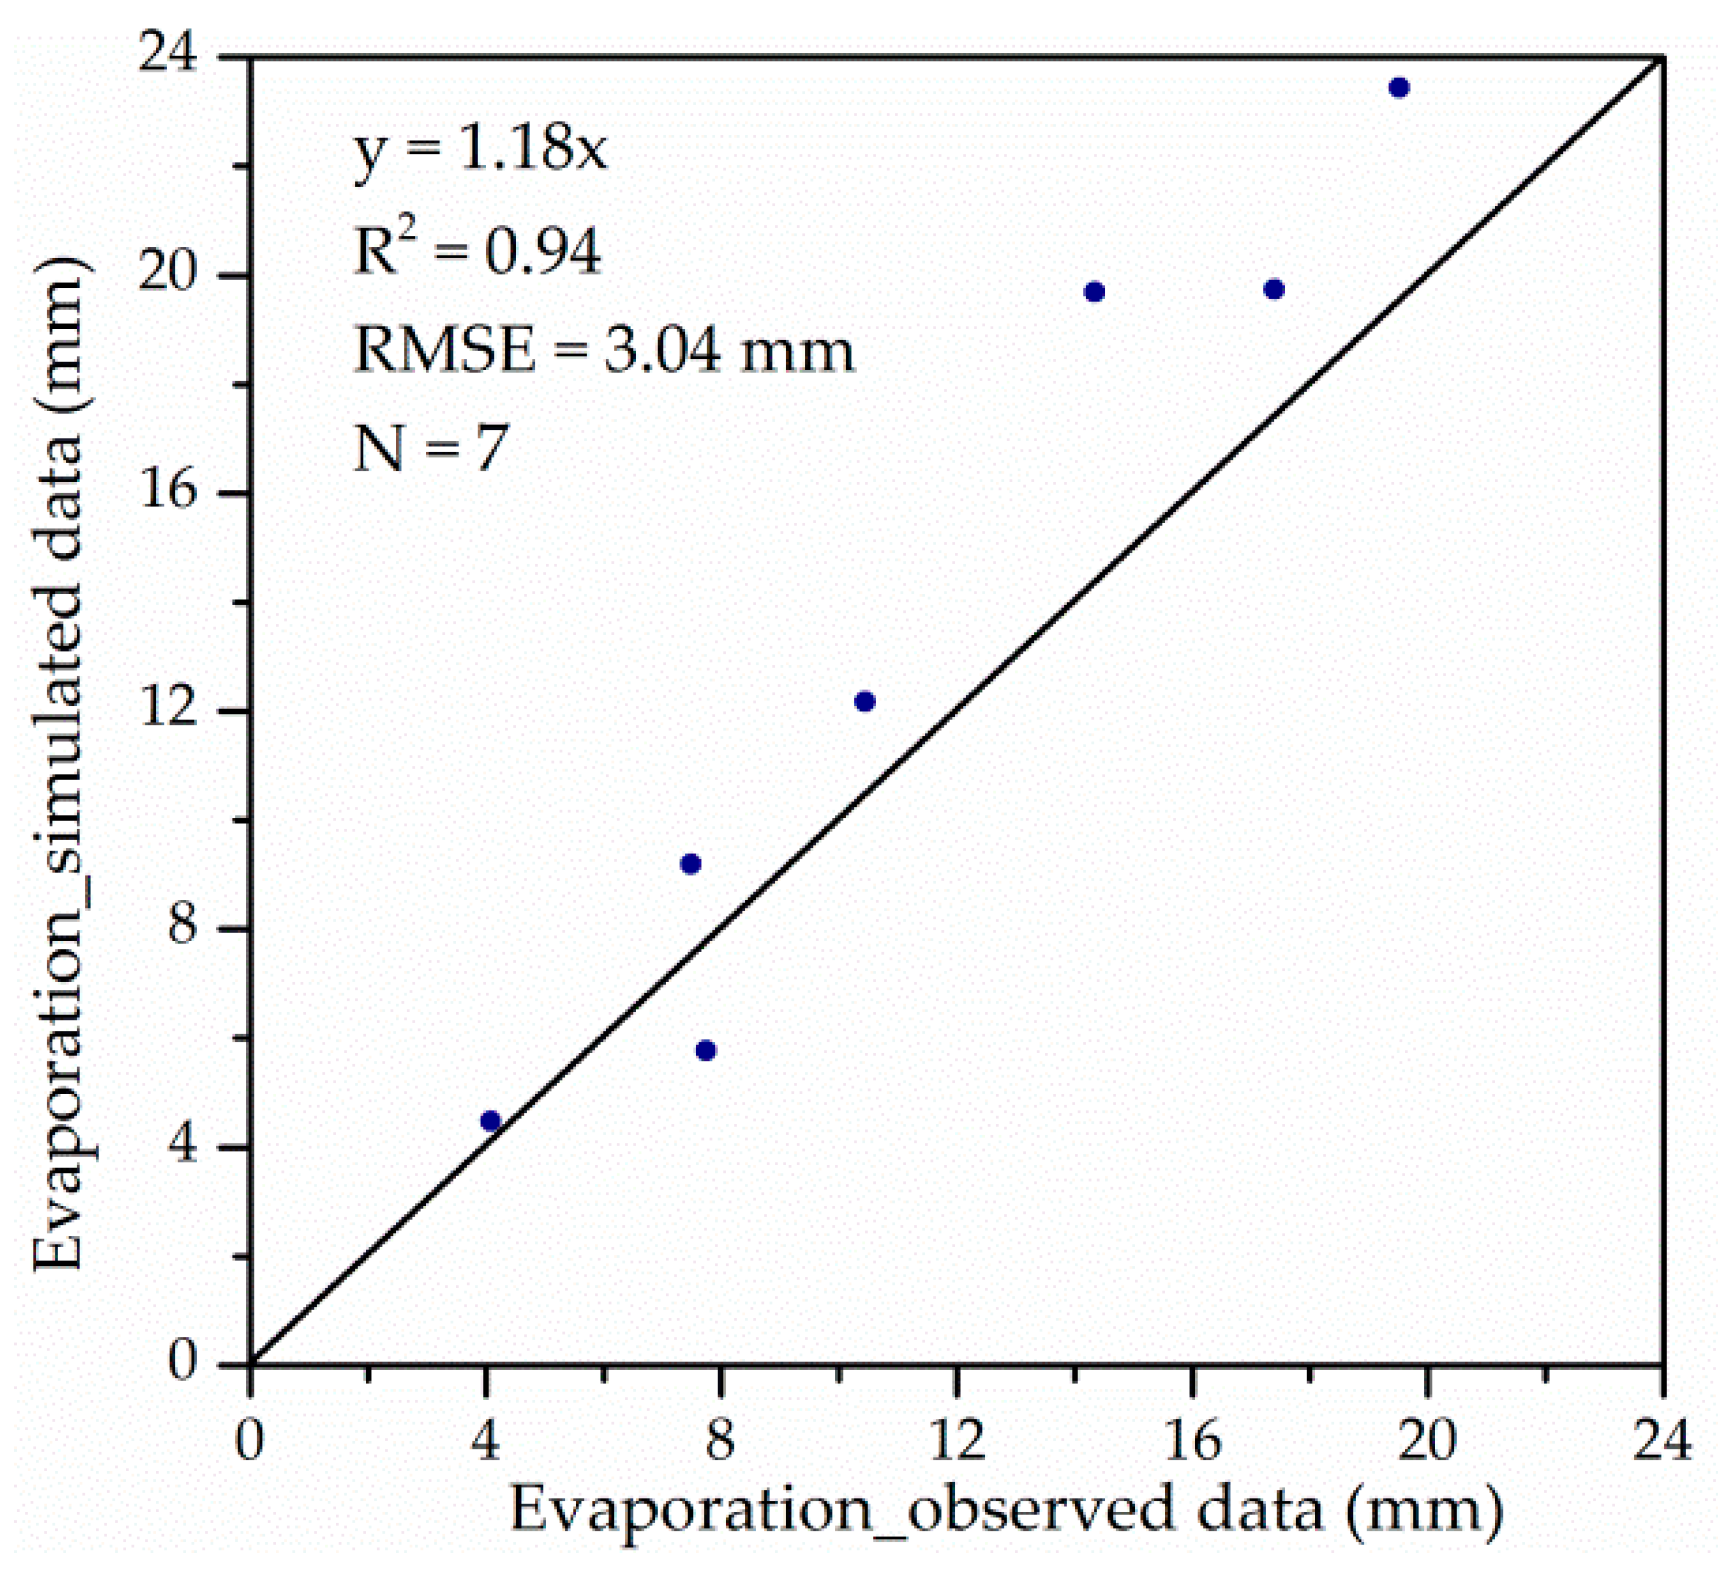
4.1. Reliability of the Extended Data

To check the reliability of the extended values of air temperature, relative humidity, and canal water temperature obtained from the observations made at AWS-SS using regression Equations (9)–(11), the rate of evaporation from the water flowing through the canal was estimated by the DSAL model using both the observations taken at AWS-Canal and the extended data including the wind speed at 2 m (U2) estimated by Equation (8). The latter is called “extended” evaporation rate hereafter. Figure 6 shows the results of evaporation rate for six days in June and July of 2013, from which it is seen that the evaporation rates estimated using the extended data (blue dots) were nearly equal to or slightly larger than that using the observed data (red dots). During the period from 8 to 12 June, the rate of evaporation increased gradually from 8:00 to 15:00 and reached its maximum in the mid-afternoon, and then decreased gradually. As for on 3 July, the evaporation rate progressively decreased from 8:00 to 18:00 because the weather became rainy, and this day exhibited a much smaller evaporation rate than the other five days. What is more, the differences between the two kinds of estimates were generally small. This trend suggests that the main cause of this difference is the poor accuracy of extended water temperature, as shown below.
On clear days (10–12 June), the “extended” evaporation rates were higher than the observed ones during 10:00 to 18:00 by 0.08 mm 10 min−1 on average. These differences were, as a matter of course, attributable to the differences between the extended and the observed relative humidity, air temperature, and canal water temperature. Extended air temperature and relative humidity were in good agreement with observations made at the AWS-Canal, while the extended canal water temperatures were higher than the observed ones during a period of 10:00 to 18:00 BST (Beijing Standard Time, data not shown). In this season, air temperature under clear sky conditions increases more quickly than water temperature in the morning due to the difference in specific heat capacity. As a result, there appears to be a tendency for the extended canal water temperatures to be higher than the actual water temperature, and hence the “extended” evaporation rate becomes slightly larger than the observed one after 10:00. On the other hand, saturated water vapor pressure increases exponentially with water temperature, and hence the inaccuracy of water temperature estimation should amplify the inaccuracy of saturated water vapor pressure at the water surface (ew). This seems to be the main cause of these differences between the two kinds of estimates.
Figure 7 shows a scatter plot of the evaporation rates estimated from the observed data (x-axis) and the extended data (y-axis). The “extended” evaporation rate agreed well with the observed rate for the lower half but the extended values were about 20% too high for the upper half.
Figure 8 illustrates a scatter plot of the cumulative evaporation rates from 8:00 to 18:00 for the days shown in Figure 6, obtained using the observed data and the extended data. They show almost the same trend as the plots for individual observations shown in Figure 7. The results of this study demonstrated that the extended evaporation rates were approximately 1.18 times as large as the observed rates taken at AWS-Canal. Kobayashi et al. [17] reported that the rates of evaporation calculated by Equation (7) would be underestimated by 10% to 20% on average when neglecting the advection effect. Thus, the extended rates seem to give the results in the right order of magnitude for the actual evaporation rate.

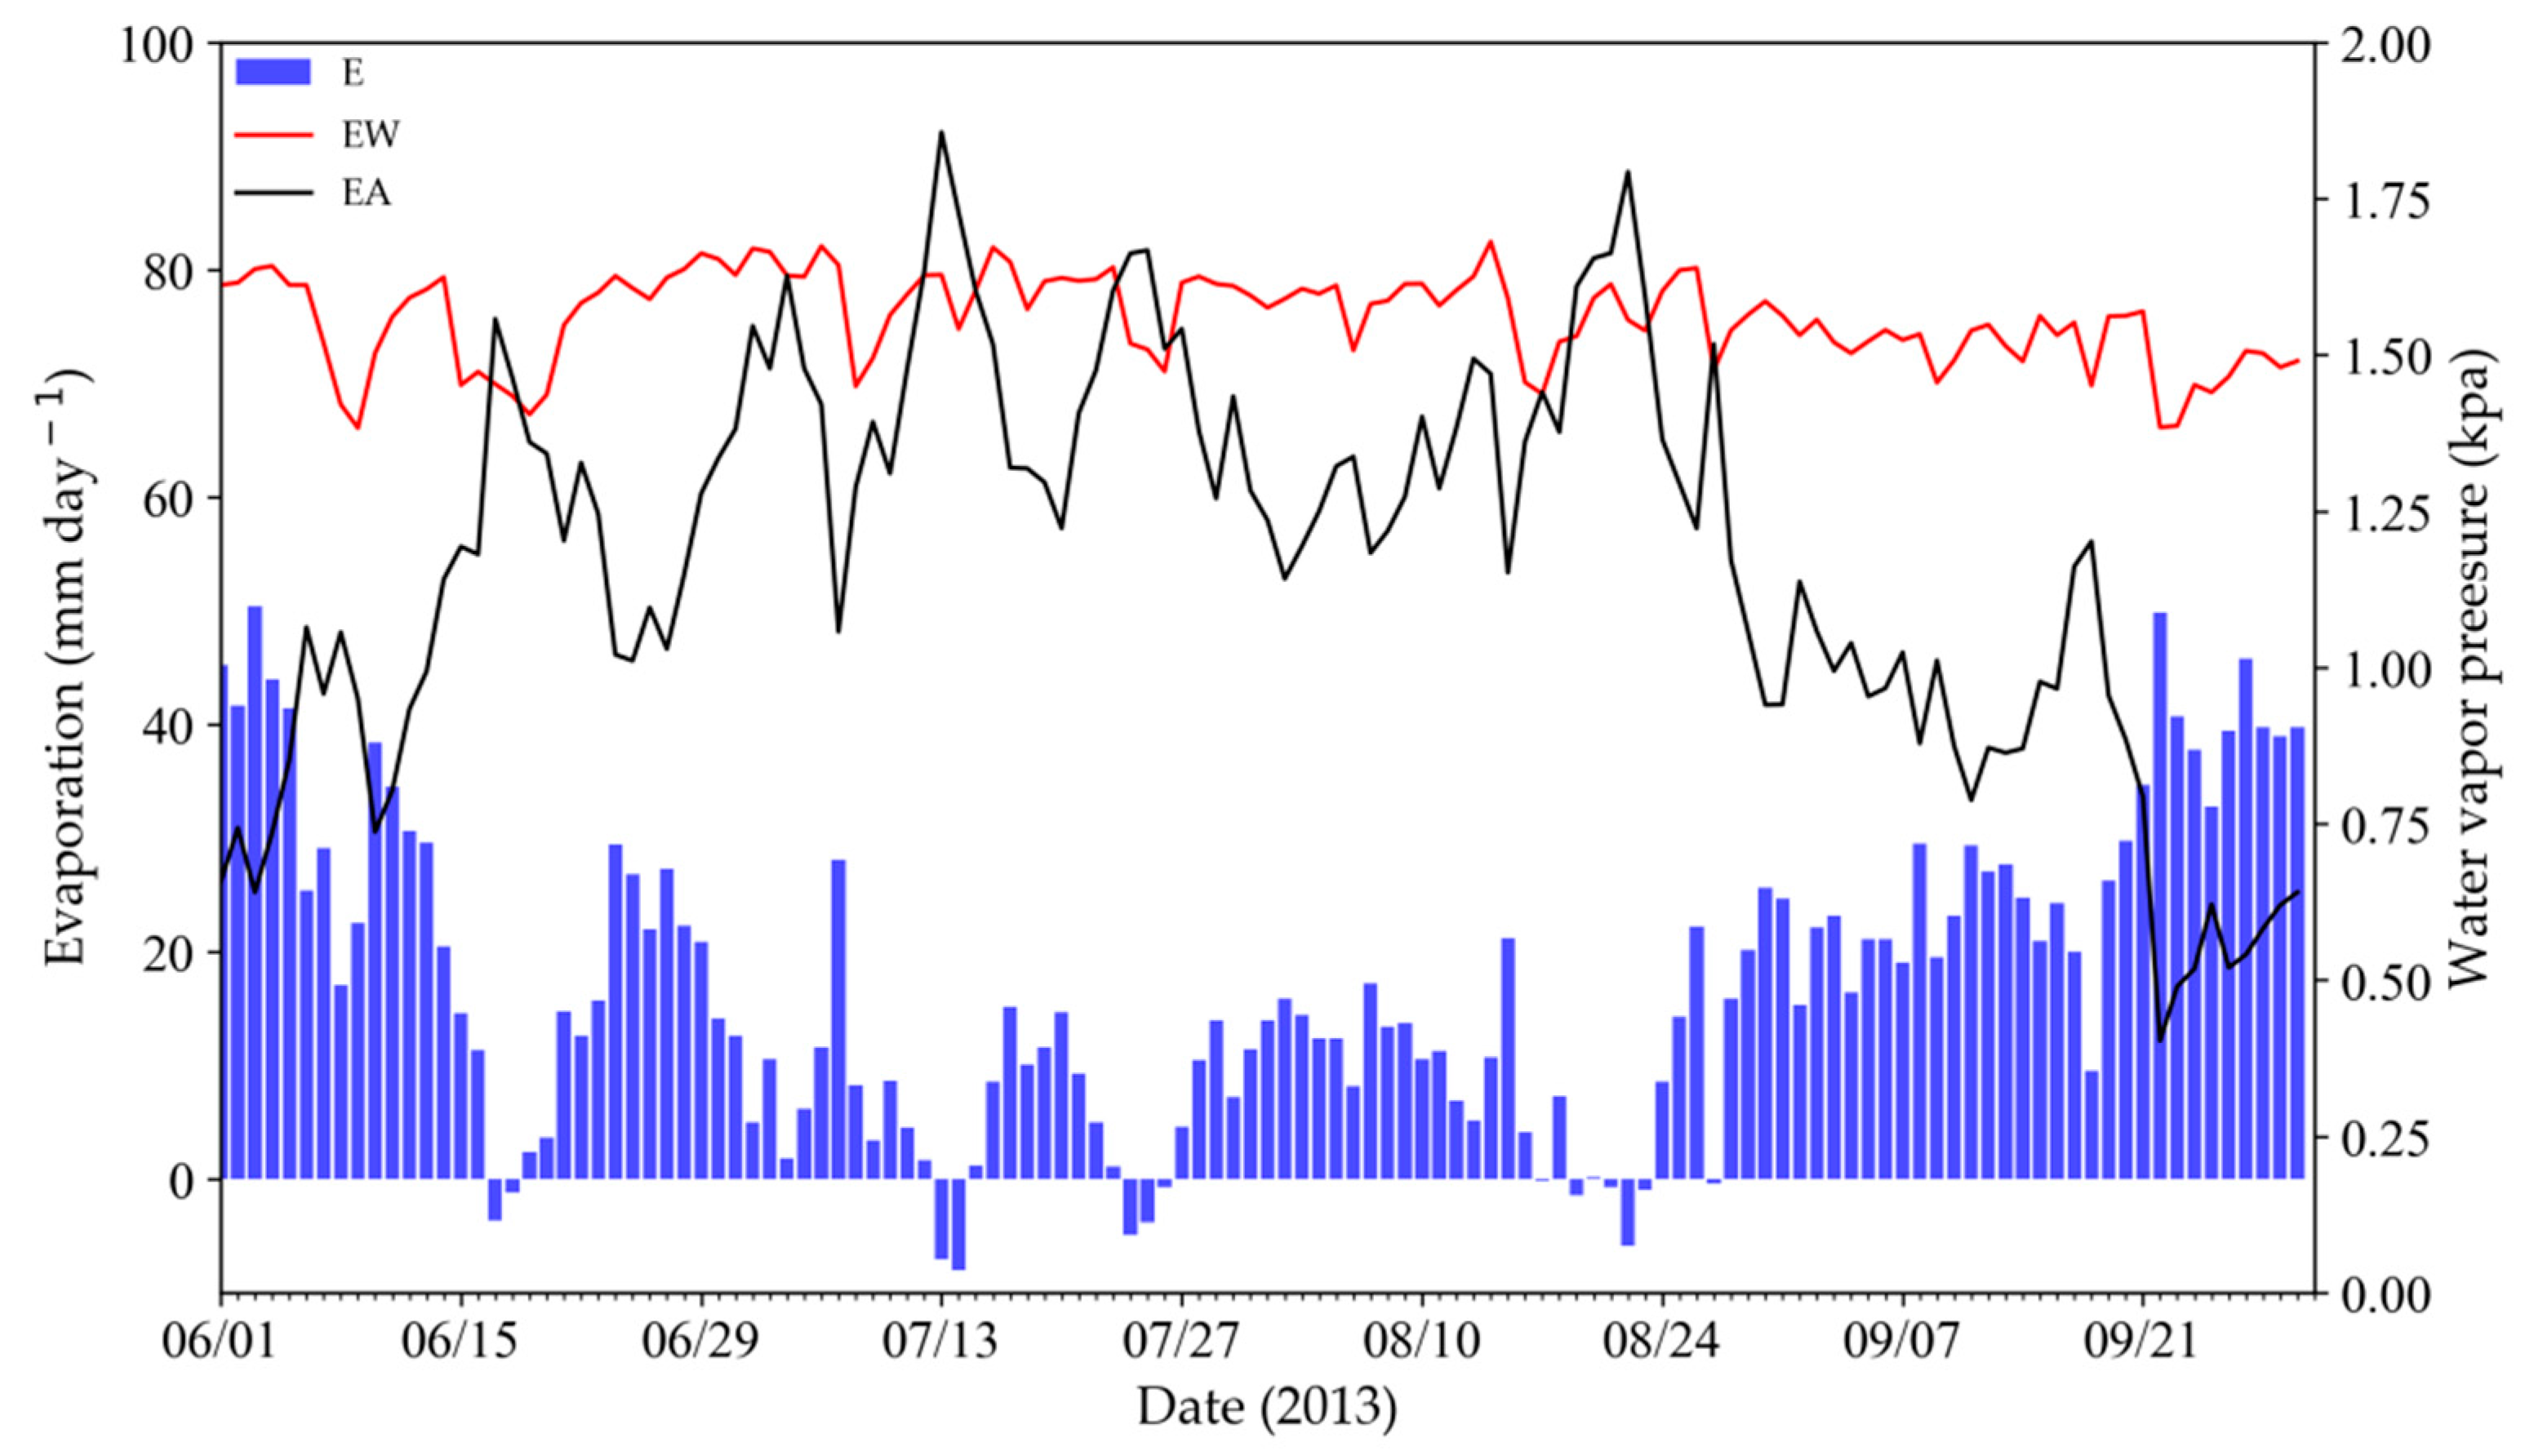
4.2. Seasonal Variation of Daily Evaporation from Irrigation Canals

Meteorological elements taken at AWS-SS at ten-minute intervals were used to get the extended values using the regression Equations (8)–(10). The regression relationship was assumed to be applicable not only at daytime, when the intensive field observation was conducted, but also at night. The daily evaporation from the water flowing in irrigation canals (E) was then estimated by the DASL model. In what follows, the estimates made at AWS-Canal should be regarded as typical ones in the study area, which does not seem to differ much from actual conditions.
Figure 9 shows the seasonal changes of daily evaporation, which is represented by E again but given in mm day−1 here. The seasonal trend of change in E was concave-up in the whole irrigation period; that is, higher in June and September and lower in July and August. This trend may seem to be peculiar, but it is the result of very humid midsummer in this arid region. Daily mean water vapor pressure (EA, black curve) and daily mean saturated water vapor pressure at the water surface (EW, red curve) are also shown in Figure 9. When EA is smaller than EW, evaporation from the water surface occurs, but when the reverse conditions prevail, condensation occurs on the water surface. As is evident in Figure 9, the values of EW minus EA were small positive or even negative in midsummer. The seasonal trend of change in E was largely associated with the differences in values between EA and EW (Figure 9). The E ranged from 20 to 50 mm day−1 in early June and late September, as EW was much larger than EA; while it was about 10 mm day−1 at its highest in July and August largely due to the little differences between EA and EW. In addition, there were several days when E was negative, e.g., −7.7 mm day−1 on 14 July. The water used for field irrigation in the Zhangye Oasis is taken from the Heihe River, the source of which is the snowmelt of the Qilian Mountains. Thus, the water temperature was much lower than the air temperature and remained nearly constant during the season for the whole irrigation period. Therefore, EW is sometimes smaller than EA and E is negative. These findings were consistent with those results obtained by the heat balance method [9].
Monthly mean E ranged from 6.5 mm day−1 in July up to 28.3 mm day−1 in September. Incidentally, they were 10.3 mm day−1 in August and 23.4 mm day−1 in June. These results are comparable to the other findings in the Zhangye Oasis. For example, Liu et al. [9] estimated the daily evaporation using the heat balance method and got a value of 20 mm day−1 in June.

4.3. Evaporation Losses from Irrigation Canals in the Yingke and Daman Irrigation Districts

The estimates of evaporation loss from all irrigation canals in the Yingke and Daman irrigation districts in Zhangye Oasis (Figure 1) during a period from June to September in 2013 are listed in Table 1. The monthly evaporation losses from the Yingke irrigation canal network were about 8.4 × 10⁵ m3 in June, 2.3 × 10⁵ m3 in July, 3.6 × 10⁵ m3 in August, and 9.5 × 10⁵ m3 in September. While at the Daman irrigation district, the evaporation losses during the four months were about 12.8 × 10⁵ m3, 3.5 × 10⁵ m3, 5.6 × 10⁵ m3, and 14.6 × 10⁵ m3, respectively. The total evaporation losses from the Yingke and Daman irrigation canal networks were about 23.9 × 10⁵ m3 and 36.6 × 10⁵ m3, respectively. These results indicated that the water loss from canals due to evaporation at the Daman irrigation district was approximately 1.5 times larger than that at the Yingke irrigation district, which reflects the fact that the former has longer irrigation canals at all levels than the latter, as described in Section 2.1.
The ratio of evaporation loss to the total amount of irrigation water, REL, for the Yingke irrigation district was 4.5% in June, 1.2% in July, 1.9% in August, and 5.2% in September. For the Daman irrigation district; however, REL was 6.8% in June, 1.8% in July, 2.9% in August, and 7.8% in September. During the irrigation period from June to September in 2013, the average REL of the Yingke and Daman irrigation districts were 3.2% and 4.8%, respectively. Chen et al. [7] obtained a ratio of 8%, which was larger than the present estimates made by the DSAL model. This difference seems to arise partly from the definition of evaporation loss. Chen et al. [7] estimated the evaporation by the water balance method, in which the evaporation included that from the end of irrigation system in direct contact with fields, or field ditches. However, in this study, the E includes only the evaporation from irrigation canals of four higher levels (main, branch, lateral, field) other than field ditches.
The water use efficiency of the irrigation canal system in the Zhangye Oasis, in which the main canal, branch canal, lateral canal, and field canal are connected in series, is approximately 0.62 in total. It indicates that 38% of the total amount of water taken from Heihe River into the agricultural irrigation canals disappears before reaching fields, which should be attributed to evaporation, seepage, and improper water management, like private water intake on the way. During the summer irrigation period in 2013, the average REL at the Yingke and Daman irrigation canal networks was approximately 4.0%. The present result revealed that the water losses due to canal seepage and improper water management amount to 34% of the total irrigation water. In the study area, the main canal, branch canal, and lateral canal are all completely paved with concrete and canal seepage can be neglected, while about 30% of the field canal has been paved. The water lost from irrigation canals before reaching fields either due to canal seepage or other than evaporation; however, seems to contribute to form vegetation environments comfortable to local inhabitants.

5. Conclusions

The double-deck surface air layer (DSAL) model is an aerodynamic method for estimating the evaporation from a running water surface in irrigation canals. Its input data are wind speed, air temperature, relative humidity at 2 m height, and the current speed and temperature of the water flowing in the canal. In this study, all the input data were prepared from the meteorological measurements at an automatic weather station (AWS-SS) by regression equations determined using the intensive field observations made on a canal bank (AWS-Canal). The input (extended) data for the DSAL model derived by regression equations can give reliable results of evaporation rate as compared to the observed input data.
The DSAL model was applied to estimate the evaporation from irrigation canals in the midstream areas of the Heihe River Basin (HRB) in northwestern China. The results showed that the daily evaporation during a period from June to September exhibited a concave-up trend, with higher values in June and September (20 to 50 mm) and lower values in July and August (around 10 mm). During the summer irrigation period from June to September, for the Yingke and Daman irrigation districts in the Zhangye Oasis, total water losses from four-level irrigation canals due to evaporation were about 23.9 × 10⁵ m3 and 36.6 × 10⁵ m3, or 3.2% and 4.8% of the total amount of irrigation water, respectively. These results give us an important basis and significant guidance for improving the irrigation water use efficiency and developing sustainable water resource managements in the midstream areas of the HRB.

Author Contributions

W.W. and T.K. contributed to the main idea, designed the methodology, and finished the final version of this paper. S.L. and Y.W. conducted all the field experiments. L.W. and H.W. processed all the data. F.X., J.F., and L.D. drafted the preliminary version of this paper.

Funding

This research was supported by the Strategic Priority Research Program of Chinese Academy of Sciences [grant number XDA19040500]; the National Natural Science Foundation of China [grant numbers 41671373, 41701418], and the Key Laboratory of Land Surface Process and Climate Change in Cold and Arid Regions, Chinese Academy of Sciences (grant number LPCC2019).

Acknowledgments

We thank the editor and three anonymous reviewers for their constructive comments that significantly improved the presentation of this paper. We also appreciate all the scientists, engineers, and students who participated in the HiWATER field campaigns.

Conflicts of Interest

The authors declare no conflicts of interest.

References

  1. Cheng, G.; Li, X.; Zhao, W.; Xu, Z.; Feng, Q.; Xiao, S.; Xiao, H. Integrated study of the water-ecosystem-economy in the heihe river basin. Natl. Sci. Rev. 2014, 1, 413–428. [Google Scholar] [CrossRef]
  2. Li, X.; Cheng, G.; Ge, Y.; Li, H.; Han, F.; Hu, X.; Tian, W.; Tian, Y.; Pan, X.; Nian, Y. Hydrological cycle in the heihe river basin and its implication for water resource management in endorheic basins. J. Geophys. Res. Atmos. 2018, 123, 890–914. [Google Scholar] [CrossRef]
  3. Cheng, G. Study on the sustainable development in heihe river watershed from the view of ecological economics. J. Glaciol. Geocryol. 2002, 24, 335–343. [Google Scholar]
  4. Li, X.; Cheng, G.; Liu, S.; Xiao, Q.; Ma, M.; Jin, R.; Che, T.; Liu, Q.; Wang, W.; Qi, Y.; et al. Heihe watershed allied telemetry experimental research (HiWATER): Scientific objectives and experimental design. Bull. Am. Meteorol. Soc. 2013, 94, 1145–1160. [Google Scholar] [CrossRef]
  5. Moghazi, H.E.M.; Ismail, E.S. A study of losses from field channels under arid region conditions. Irrig. Sci. 1997, 17, 105–110. [Google Scholar] [CrossRef]
  6. Mori, M.; Liu, S.; Wang, W.; Tagawa, K.; Nomiyama, R.; Hisaeda, D.; Kobayashi, T. An observational study of the structure of surface air layer formed over the running water in an irrigation canal in northwestern china. Kyushu J. Agric. Meteorol. Ser. 2013, 2, 46–49. [Google Scholar]
  7. Chen, J.; Jia, Z. Construction and application of water balance model in the irrigation districts of the midstream areas of the heihe river basin. In The Study of Humanities and Environment in the City of Blackwater City: International Symposium on Human Culture and Environment in the Blackwater City; Shen, W., Shi, J., Eds.; China Renmin University Press: Beijing, China, 2007; pp. 150–164. [Google Scholar]
  8. McJannet, D.; Webster, I.; Stenson, M.; Sherman, B. Estimating Open Water Evaporation for the Murray-Darling Basin; CSIRO: Collingwood, Australia, 2008; p. 58. [Google Scholar]
  9. Liu, S.; Wang, W.; Mori, M.; Kobayashi, T. Estimating the evaporation from irrigation canals in northwestern china using the double-deck surface air layer model. Adv. Meteorol. 2016, 2016, 1–9. [Google Scholar] [CrossRef]
  10. Wang, W.; Liu, S.; Kobayashi, T.; Kitano, M. Evaporation from irrigation canals in the middle reaches of the heihe river in the northwest of china—A preliminary study. J. Fac. Agric. Kyushu Univ. 2013, 58, 371–376. [Google Scholar]
  11. Wang, Y. Calcualtion of the evaporation from the flowing channels. Groundwater 1987, 1, 28–30. [Google Scholar]
  12. Burt, C.M. Irrigation water balance fundamentals. In Conference on Benchmarking Irrigation System Performance Using Water Measurement and Water Balances; Irrigation Training and Research Center: San Luis Obispo, CA, USA, 1999; pp. 1–13. [Google Scholar]
  13. Sivapragasam, C.; Vasudevan, G.; Maran, J.; Bose, C.; Kaza, S.; Ganesh, N. Modeling evaporation-seepage losses for reservoir water balance in semi-arid regions. Water Resour. Manag. 2009, 23, 853–867. [Google Scholar] [CrossRef]
  14. Mihara, Y.; Uchijima, Z.; Nakamura, S. A study on heat balance of the water warming channels. Bull. Natl. Inst. Agric. Sci. 1959, 7, 45–68. [Google Scholar]
  15. Jobson, H.E. Thermal Modeling of Flow in the San Diego Aqueduct, California, and Its Relation to Evaporation; U.S. Government Publishing Office: Washington, DC, USA, 1980; pp. 1–24.
  16. Liu, S.; Wang, W.; Kobayashi, T. The evaporation from irrigation channels estimated by energy balance method in the middle reaches of the Heihe river. J. Glaciol. Geocryol. 2014, 36, 80–87. [Google Scholar]
  17. Kobayashi, T.; Mori, M.; Liu, S.; Wang, W. Evaluating the advection effect on the estimates of evaporation from irrigation canals made by a new aerodynamic method. Kyushu J. Agric. Meteorol. Ser. 2014, 2, 7–12. [Google Scholar]
  18. Kobayashi, T.; Liu, S.; Wang, W. Modeling of the evaporation from a running water surface. Kyushu J. Agric. Meteorol. Ser. 2013, 2, 1–14. [Google Scholar]
  19. Wei, L.; Wang, W.; Liu, S.; Wu, Y.; Xu, F. Evaporation estimation from water surface of channels by the double-deck surface model. J. Glaciol. Geocryol. 2019, in press. [Google Scholar]
  20. Zhou, J.; Hou, D.; Mao, T.; Zhao, R. Farmland water problems and countermeasures in Zhangye irrigation districts. Gansu Agric. 2010, 8, 6–7. [Google Scholar]
  21. Hu, X.; Lu, L.; Ma, M.; Liu, X. The irrigation channel system mapping and its structure analysis for the zhangye oasis in the middle heihe river basin. Remote Sens. Technol. Appl. 2008, 23, 208–213. [Google Scholar]
  22. Ma, M.; Hu, X.; Song, Y.; Liu, X.; Xu, G. Development and application on the information system of water conservancy project statues for zhangye city. Remote Sens. Technol. Appl. 2009, 24, 559–566. [Google Scholar]
  23. Liu, S.; Xu, Z.; Wang, W.; Jia, Z.; Zhu, M.; Bai, J.; Wang, J. A comparison of eddy-covariance and large aperture scintillometer measurements with respect to the energy balance closure problem. Hydrol. Earth Syst. Sci. 2011, 15, 1291–1306. [Google Scholar] [CrossRef] [Green Version]
  24. Li, K.; Hao, H.; Zhuang, C.; Pu, L. A new method for predicting water temperature of river by meteorological factors. Adv. Eng. Sci. 2006, 38, 1–4. [Google Scholar]
  25. Sun, D.; Tian, H.; Zhang, H.; Zhou, Z.; Zhou, H. Monitoring of water temperature and changing relationship between the water temperature and air temperature in upper yangtze river. Build. Energy Effic. 2010, 38, 74–77. [Google Scholar]
Figure 1. The distribution of canals in the irrigation districts in the midstream areas of the Heihe River Basin (HRB) and the location of observation stations. (a) Location of Zhangye Oasis in the HRB; (b) spatial distribution of canals and observation sites.
Water 11 01788 g001
Figure 2. Schematic diagram of the double-deck surface air layer (DSAL) model over a running water surface. SAL—usual surface air layer, SAL-W—special surface air layer formed above the running water. δ is the thickness of the SAL-W, za is the measurement height of air temperature, ea is the actual water vapor pressure at height za in the SAL, Ua is the wind speed, Uw is the flow speed of water in the canal. See text for other symbols.
Water 11 01788 g002
Figure 3. Scatter plot of the observed (AWS-Canal) and estimated (AWS-SS) wind speed at a height of 2 m. AWS-Canal indicates the automatic weather station installed on the bank of a lateral canal, AWS-SS represents the superstaion installed at the Daman irrigation district.
Water 11 01788 g003
Figure 4. The relationship of (a) air temperature (Ta) and (b) relative humidity (RH) between 2 m at WAS-Canal and at 3 m at AWS-SS.
Water 11 01788 g004
Figure 5. The relationship between the surface air temperature (Ta) and canal water temperature (Tw).
Water 11 01788 g005
Figure 6. Variations with time of day of the evaporation rate estimated by the DSAL model using the observed data (red dots) and the extended data (blue dots) on (a) 8 June, (b) 9 June, (c) 10 June, (d) 11 June, (e) 12 June , and (f) 3 July in 2013.
Water 11 01788 g006
Figure 7. Scatter plot of evaporation rates estimated from observed data (x-axis) and extended data (y-axis) using the DSAL model.
Water 11 01788 g007
Figure 8. Scatter plot of the cumulative evaporation during daytime (08:00–18:00 Beijing Standard Time) estimated by the DSAL model using the observed data (x-axis) and the extended data (y-axis) for the days shown in Figure 6.
Water 11 01788 g008
Figure 9. Seasonal variations of daily evaporation E from the water flowing through irrigation canals. EA and EW are daily averages of actual water vapor pressure at 2 m and saturated water vapor pressure at the water surface, respectively.
Water 11 01788 g009
Table 1. The evaporation losses from irrigation canals in the Yingke and Daman irrigation districts in 2013. ET is the total evaporation from each level of canals in the district (unit, 103 m3); REL is the ratio of evaporation loss to the total amount of irrigation water (unit, %).
Yingke Irrigation DistrictDaman Irrigation District
MonthIrrigation CanalsETRELETREL
JuneMain canal150.64.5227.96.8
Branch canal223.6351.7
Lateral canal187.2373.4
Field canal277.2331.5
JulyMain canal41.01.262.11.8
Branch canal60.995.8
Lateral canal51.0101.7
Field canal75.590.3
AugustMain canal65.51.999.12.9
Branch canal97.2152.9
Lateral canal81.4162.3
Field canal120.5144.1
SeptemberMain canal171.75.2259.97.8
Branch canal254.9401.0
Lateral canal213.5425.7
Field canal316.1378.0

