Influence of Intermittence and Pressure Differentials in Hydrogen Sulfide Concentration in a Gravity Sewer


CERIS, Civil Engineering Research and Innovation for Sustainability, Instituto Superior Técnico, University of Lisbon, Av. Rovisco Pais 1, 1049-001 Lisbon, Portugal
*
Author to whom correspondence should be addressed.
Water 2019, 11(9), 1780; https://doi.org/10.3390/w11091780
Submission received: 17 July 2019
/
Revised: 22 August 2019
/
Accepted: 23 August 2019
/
Published: 27 August 2019
(This article belongs to the Section Urban Water Management)
Abstract
:The work presented herein was carried out to assess the effect of intermittent pumping events in sewer headspace pressure differentials, as well as their relationship with hydrogen sulfide gas concentration. A full scale gravity sewer in Portugal, located downstream of several pumping stations, was used as the guiding case study. Under normal system operation, pressure difference between the outside atmosphere and the sewer headspace seemed to influence the in and out-gassing of gas pollutants emitted through the venting stack. Wastewater pumping cycles generated maximum pressure differentials of roughly 100 Pa, which in turn originated maximum air velocities of 1.76 m s−1 exiting the venting stack. Each pumping event was followed by a pressure drop of about 50 Pa, quickly attaining null concentrations of H2S at the venting stack. A statistically significant relationship between pressure differentials and air exit velocity was observed, which allowed obtaining an empirical equation for expedite prediction of airflows emitted to the outside atmosphere (R2 = 0.77). Conversely, the same effect was not observed along the length of the sewer pipe, unlike the findings of other studies. The effect of a full flowing pipe at the downstream end of the gravity trunk sewer was also noticeable in downstream sewer pressurization and gas build-up. It was concluded that the magnitude of the gas pollutant emissions may heavily depend on the impacts of hydraulic flows and pumping characteristics in headspace pressure differences, denoting the need for better approaches when designing and installing venting stacks.
1. Introduction
It is well-known that ventilation plays a key role in headspace gas pollutant dynamics in wastewater collection systems [1]. Sewer ventilation is affected by a combination of factors, such as the effect of wastewater drag, turbulence, wind speed, fluctuations in wastewater levels, buoyancy, temperature, and pressure differentials (dP) [2,3,4,5].
These processes are of critical importance when addressing hydrogen sulfide (H2S) related issues, given its well-known impacts in terms of toxicity and odor nuisance, as well as infrastructure corrosion [6,7,8]. The relevance of ventilation, in terms of impacts in H2S dynamics, is related with several significant aspects, such as advective transport, time of contact with sewer walls, relative humidity (R.H.) content, air–water H2S mass transfer, headspace temperature, buoyancy, or the effect of ventilation on H2S headspace oxidation rates. As such, focus in sewer research has been shifting from a mainly hydraulic and liquid phase quality perspective, into a more holistic approach, taking ventilation and headspace dynamics into consideration.
Some of the results of ventilation studies carried out in past decades are quite dependent on site specific characteristics and lead to some contradictory findings. While some authors find that wind speed and temperature differences are more relevant than wastewater drag in the establishment of higher ventilation rates [9], others identify wind speed and wastewater drag as the main factors affecting the air velocity [2,10]. Among all the factors that induce headspace air movement, pressure distribution may arguably be among the most important. Fluids tend to naturally move from locations of high pressure to locations of lower pressure. Therefore, accurate knowledge on air pressure distributions within the sewer network is critical to avoid uncontrolled emissions, as well as to reasonably estimate headspace air flows [11]. However, this is a complex task, given the increased air compressibility (when compared to a Newtonian fluid like water), and the fact that a sewer network comprises several openings, and leaks to the ambient atmosphere, making it a system with poorly defined boundary conditions [5]. More recently, studies have been carried out, on modelling single pipe airflows [4,12] or even simulating air pressure distributions and movement in tall dropshafts [13]. Nonetheless, because of difficulties in measuring all relevant parameters or because of lack of field data, several simplifications had to be made.
Air pressure differences necessary to affect fluid motion are typically small, and the importance of pressure variations in sewer ventilation has already been reported in the literature, to some extent. For example, in Apgar et al. [14] and Ward et al. [1], the authors conducted headspace ventilation studies in several sewer systems across the United States and observed significant differences in terms of pressure differential in the upstream–downstream direction. Some tests evidenced negative dP, meaning a greater static pressure was found upstream and air would flow toward the downstream section, regardless of wastewater drag. The authors attribute the causes to a combination of forces such as liquid drag, wind reduction or buoyancy. Other results showed the opposite, where increased downstream pressures were likely caused by the wastewater drag or headspace blockages. During that study, several ventilation modelling approaches existing in the literature (empirical models, CFD and thermodynamic models) were tested with the obtained data. Results evidenced that all approaches over predict results, especially at lower air flow rates, with factors of over one order in magnitude. Nonetheless, the empirical approach seemed to yield better results, while the thermodynamic model was the least accurate of the three.
Pressure differences between manholes measured by Apgar et al. [14] and Pescod and Price [2] in gravity sewers were in the order of 2 Pa. In another study, Qian et al. [11] observed in a lab-scale reactor, that the typical pressure distribution in a straight pipe (600 mm diameter and 10 m length) varied between −0.60 and 0.10 Pa (upstream to downstream), because of the effect of air drag caused by the gravity wastewater flow. Interestingly, when the downstream end was subject to a mechanically artificially induced high enough pressure gradient (dp/dx = 0.32 Pa m−1 in their case), the airflow rate was negative (thus moving upstream). This may be especially relevant in situations of intermittent turbulent flows, as those typically observed downstream of pumping stations.
In steady state gravity flows, it is generally acceptable to consider air velocity as a function of geometric and hydraulic parameters, such as wastewater velocity [2,12]. However, some sewer infrastructure results in significant headspace pressurization (sudden slope changes, diameter reductions, obstructions, or intermittent pumping), where air/water velocity ratios have been found to vary over one order of magnitude [1], and headspace dynamics are not necessarily explained by hydraulic parameters alone. For instance, Guo et al. [15] found a positive correlation between sewage flow rate and the observed diurnal patterns of air pressure and H2S concentration, in manholes with deep drop structures and a downstream pump station. However, most studies to date often overlook the matter of intermittence and represent pressure variations in terms of mean values or constants, not fully addressing the variations and impacts in terms of in- and out-gassing, horizontal transport, or gas removal rates.
For long pumping durations, it can be assumed that steady state conditions of liquid flow are reached in the downstream gravity pipe, after the initial unsteady flow development. For shorter discharge durations however, such conditions are not met, and as a result, headspace air pressures and velocities may vary greatly over that period. Not only pumping dynamics will influence gas phase dynamics, but systems downstream of pump stations usually present venting stacks, which enhance gas exchanges with the atmosphere. This makes the process of estimating forces capable of inducing airflow harder, given that not only the wastewater drag, but also density differences between headspace and ambient air, temperature and humidity can easily influence the force balance. This has still not been thoroughly understood, and field studies have shown that it is difficult to effectively measure and obtain correlations between air movement and parameters that govern it [5]. The literature is still scarce on complete full scale studies with monitoring of long-term headspace parameters, especially under highly dynamic environments caused by frequent pumping. Therefore, more work and field data are needed to accurately model and relate those parameters with gas pollutant concentrations across the system. This is of special relevance when addressing a noxious sewer gas like H2S, because of its influence in infrastructure deterioration and risks for human health.
Matos et al. [16] assessed the influence of different ventilation and operating conditions on H2S and CH4 horizontal and vertical movement, in a section of a small gravity sewer under intermittent conditions. The results evidenced the effect of headspace temperature and ventilation in R.H. content, in sewer pressurization and gas movement within confined boundaries of the trunk sewer. In fact, in absence of in-gassing, sewer pressurization seemed responsible for a wave pattern of gas travelling upstream and downstream, thus resulting in several gas peaks per pumping event, at the same sections. Following on that, the work herein presented was carried out in a larger full scale gravity sewer, downstream of several pump stations, and intended to evaluate: 1) the effect of pressure differences, induced by pumping, in gas movement and emission; 2) the effect of a constricted downstream boundary in sewer pressurization and gas build-up.
2. Materials and Methods
2.1. Case Study Overview
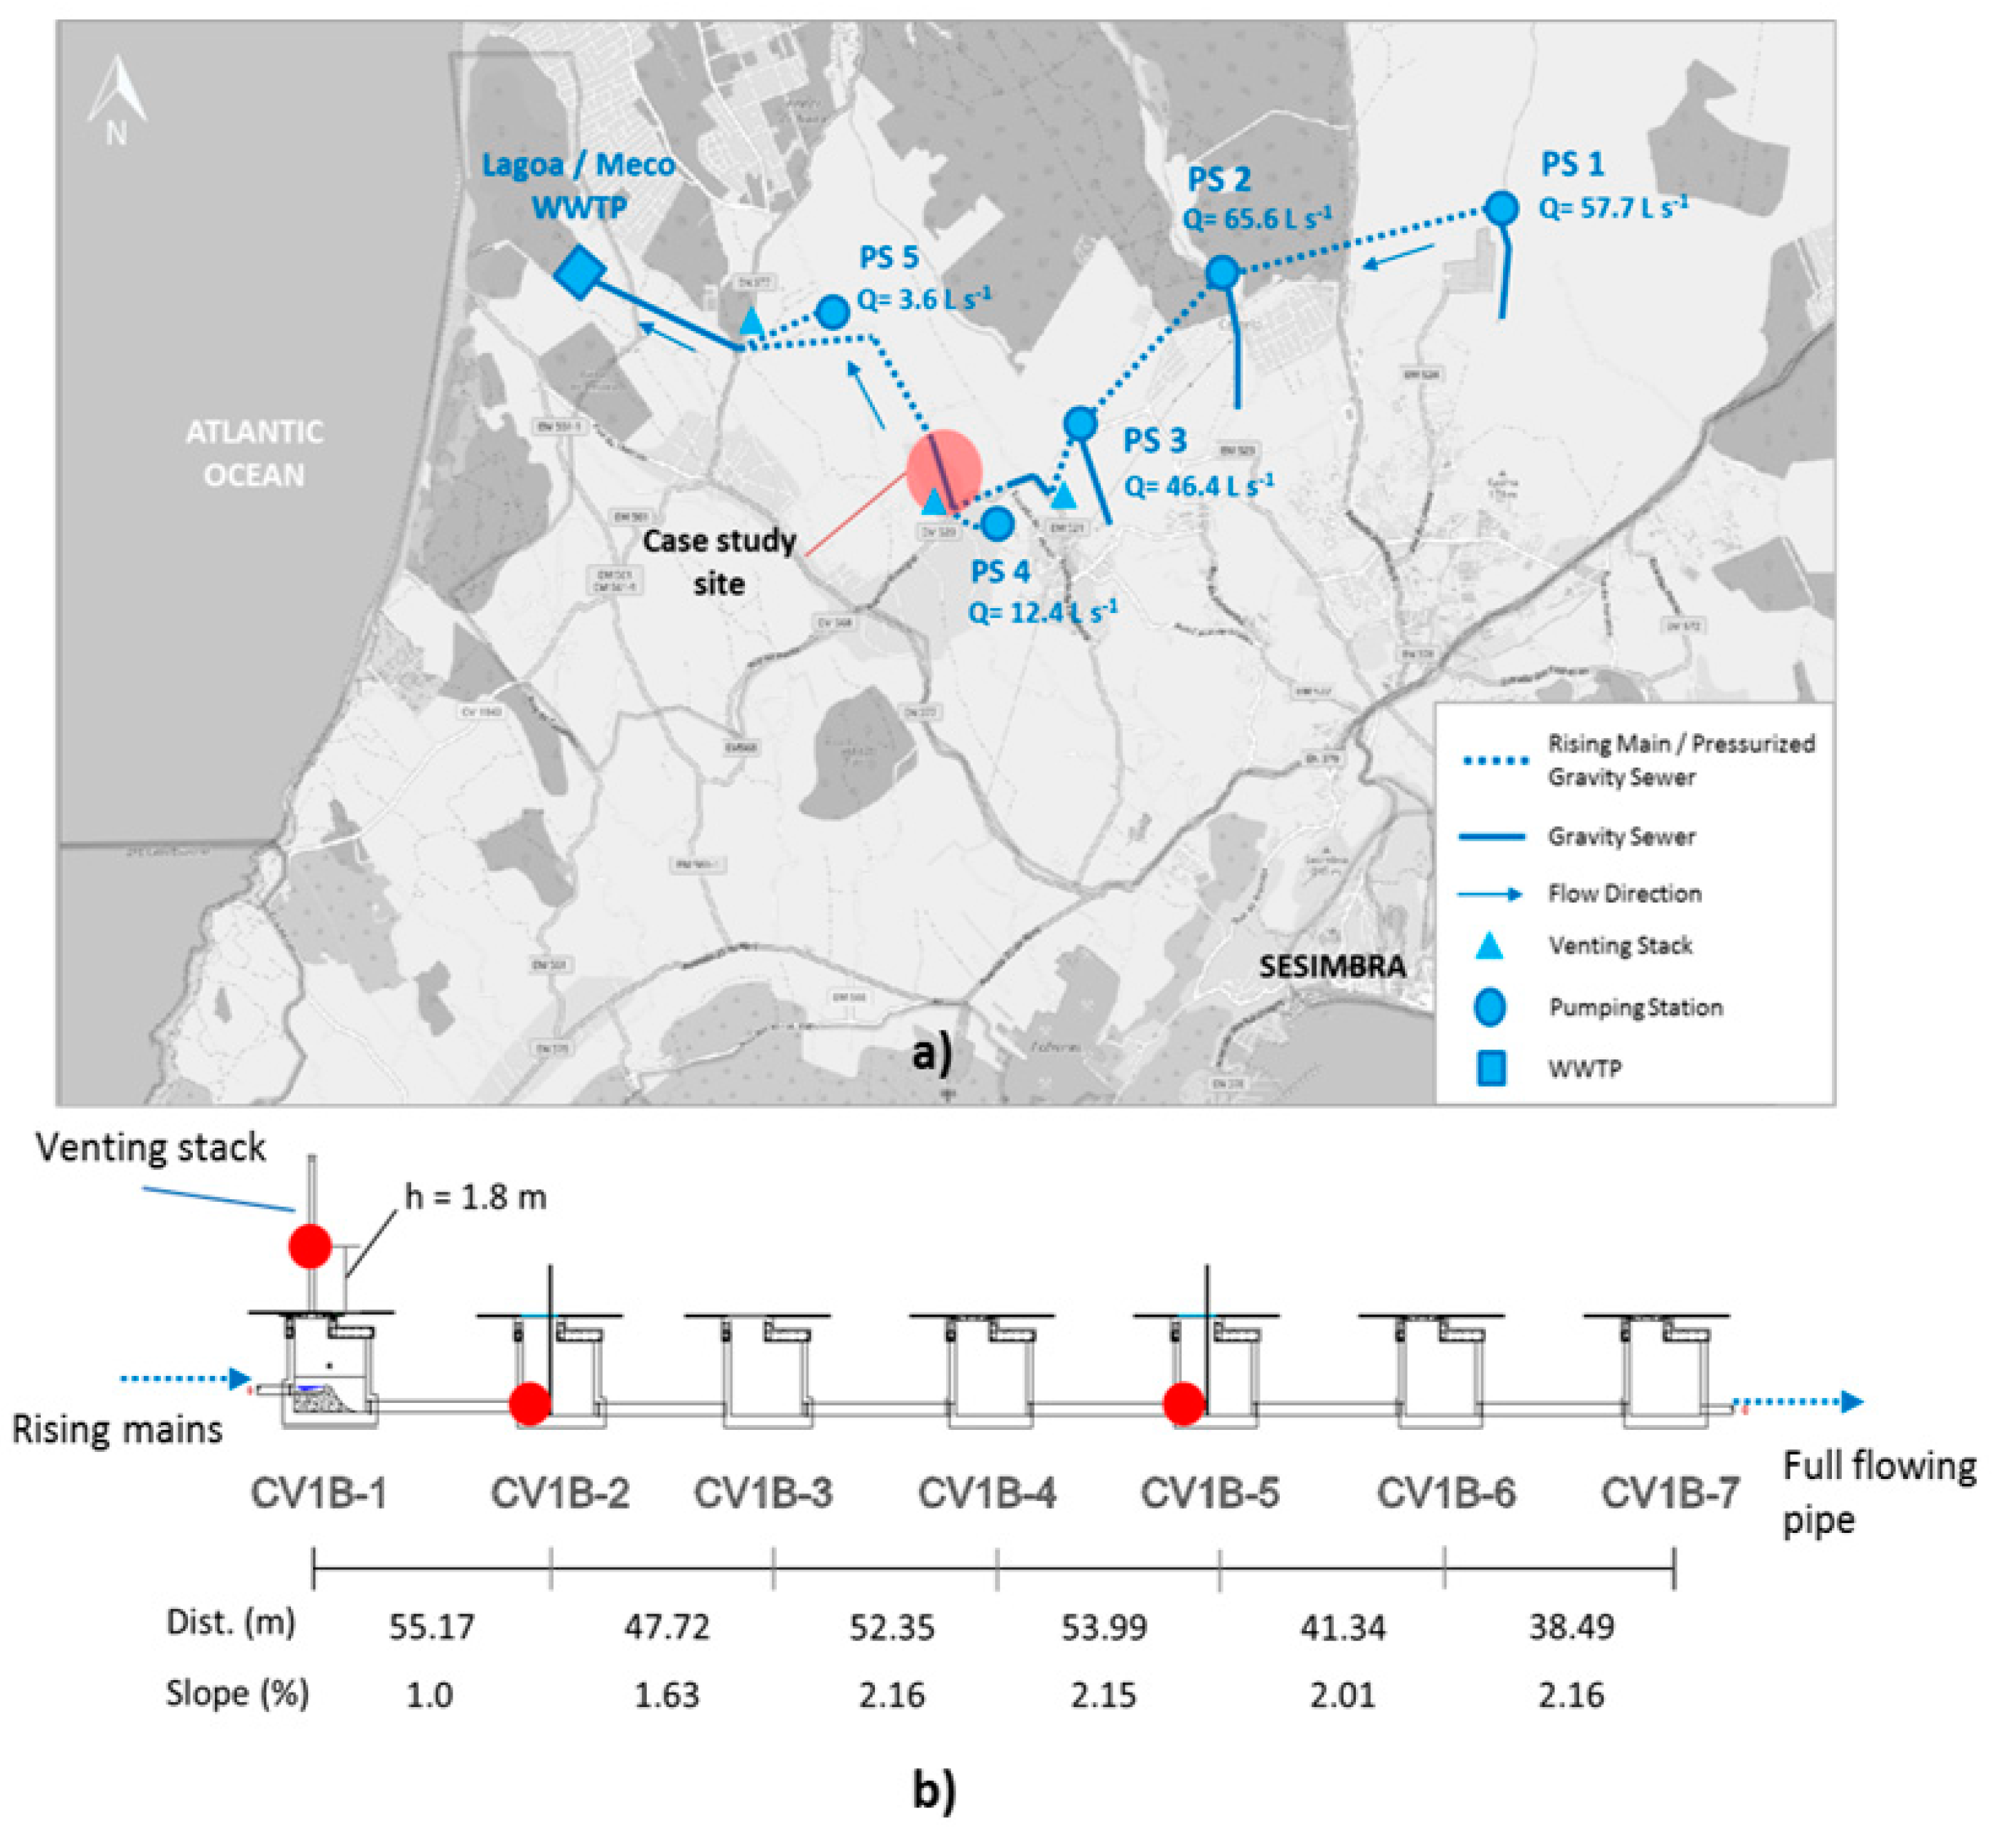
Field work was carried out in a gravity sewer of the Meco wastewater system (Portugal), 35 km south of Lisbon. This wastewater system is located in the vicinity of a bathing area (Meco beach), and the effluent is transported by a sequence of rising mains, gravity sewers, and inverted siphons, which present ideal circumstances for the onset of anaerobic conditions and the release of foul odors onto the atmosphere, namely through ventilation stacks at several locations (Figure 1). Manhole designations in Figure 1b are abbreviated from CV1B-# to C-# throughout the paper for readability.
The studied gravity sewer consists of a 290 m long trunk sewer, with 630 mm outer diameter, and an average slope of 2.2%, receiving intermittent discharges from several pumping stations (PS). There is a 6 m vertical ventilation stack at the upstream manhole, for pressure relieving purposes. The downstream end of the pipe is connected to a full flowing pipe.
2.2. Field Monitoring and Sampling
The experimental apparatus and equipment was followed as described in Matos et al. [16]. It involved continuous monitoring of several gas phase parameters, namely headspace air velocity (±0.03 m s−1)—v_air, air velocity through the venting stack—v_exit, barometric pressure (±0.05 Pa)—P_atm, pressure difference between sewer headspace and outside atmosphere (±0.05 Pa)—dP, temperature (±0.3 °C)—T, relative humidity (±2%)—R.H., H2S (±0.1 ppm), and O2 (±0.01%) concentrations. The parameters were simultaneously measured at the venting stack and at two different manholes at a time (C-2, C-3, and C-5), in a total of 7 days, in May and June 2018. Three sets of multi-parameter probes (Testo 435-4) and multi-gas detectors (Ventis MX4) were used, and data logging intervals were set for 30 s.
To further validate the impact of pressure differences in headspace parameters, an additional analysis was carried out, by the opening of a single manhole cover (at C-2) and two manhole covers at a time (C-1 and C-2, and C-2 and C-3).
Liquid phase quality was monitored during all days of field work. For this effect, acrylic manhole covers were made, with a 10 cm orifice to allow cables to pass through. The orifices were sealed with tape during monitoring. During setups where all covers were closed, samples were collected with an automatic sampler, whereas during setups with open manholes covers they were collected using a bucket. Data collection was always carried out with the assistance of utility workers.
Monitored parameters comprised dissolved oxygen (DO), wastewater temperature (T_ww), pH, total chemical oxygen demand (CODT), and total and dissolved sulfide concentration (ST and SD). DO (±0.2 mg L−1), T_ww (±0.15 °C), and pH (±0.2 units) were measured on site with a multi-parameter probe YSI 556 MPS. COD was determined according to APHA method 5520 D (closed reflux colorimetric method), by using Spectroquant® testing kits with a measuring range of 25–1500 mg O2 L−1. Samples subject to SD determination were left to settle in full 0.5 liter closed bottles, previous to filtration of the clarified fraction using 1 µm pore filters. Sulfide content (expressed in mg HS− L−1) was determined according to Method APHA 4500-S2. Preservation of samples for sulfide analysis was carried out by adding a zinc acetate solution (0.2 mL 2M per 100 mL of sample) to sample bottles.
Wastewater flow (Q_ww) and velocity (v_ww) were monitored, by an ultrasonic flow meter (POA Nivus) placed in the first pipe stretch, upstream of manhole CV1B-2, logging data with 1 min intervals (smallest available time step). The equipment was installed by a specialized company, Contimetra Lda., and setup for continuous flow measurement, during one full week in May 2018, while data collection campaigns were being carried out. However, a malfunction in the data logger caused no flow data to be retrieved during that period, therefore additional data collection was carried out in June, when data logging was fully operational.
Air velocity was measured directly on site and used to calculate airflow rates, taking into account the available pipe headspace (non-wetted cross section) and venting stack cross section. It should be noted that air velocities result from a single point measurement (at pipe centroid). These were assumed to represent the average air velocity within the pipe, even though this constitutes an approximation, given that headspace velocities vary with distance to the wastewater surface and pipe walls [2]. Ideally, pipe traversing can be carried out; however this is often not feasible in underground pipes of difficult access, such as in many sewer networks. Notwithstanding, since for all setups of this study, probe height and location was the same, comparison of results between them holds valid. This methodology was partly adapted from the WERF study [14].
All obtained data were subjected to a preliminary assessment, starting with fault detection, by eliminating errors (no data, error readings and negative values for concentration), visual graph evaluation, and assessment of extreme values for potential outlier detection.
3. Results and Discussion
3.1. Overview of Wastewater Parameters
Liquid phase quality parameters are presented for contextualization purposes. Overall, the conditions were optimal for the release and emission of H2S to the atmosphere, with very low DO concentrations, abundant COD, and neutral to slightly basic pH values. During May, 11 samples were collected and analyzed, and the following mean (± standard error of the mean, SEM) values were obtained: May-CODT: 517.3 ± 80.7 mg O2 L−1, ST: 4.6 ± 0.7 mg HS− L−1, SD: 3.7 ± 1.0 mg HS− L−1, pH: 8.2 ± 0.05, T_ww: 22.3 ± 0.6 °C, and DO: 0.4 ± 0.04 mg O2 L−1.
Diurnal wastewater flowrates in the two monitoring periods of June ranged from 1.3 to 89.1 L s−1 (averaging 29.2 L s−1 ± 1.1, SEM). During this time, two samples were collected on the onset and end of each day, with the following results: June-CODT: 567.4 mg O2 L−1, ST: 4.0 ± 1.0 mg HS− L−1, pH: 7.4 ± 0.3, T_ww: 20.1 ± 0.4 °C, and DO: 0.6 ± 0.09 mg O2 L−1.
3.2. Relationship between Pressure Differences and Air Velocity through the Venting Stack
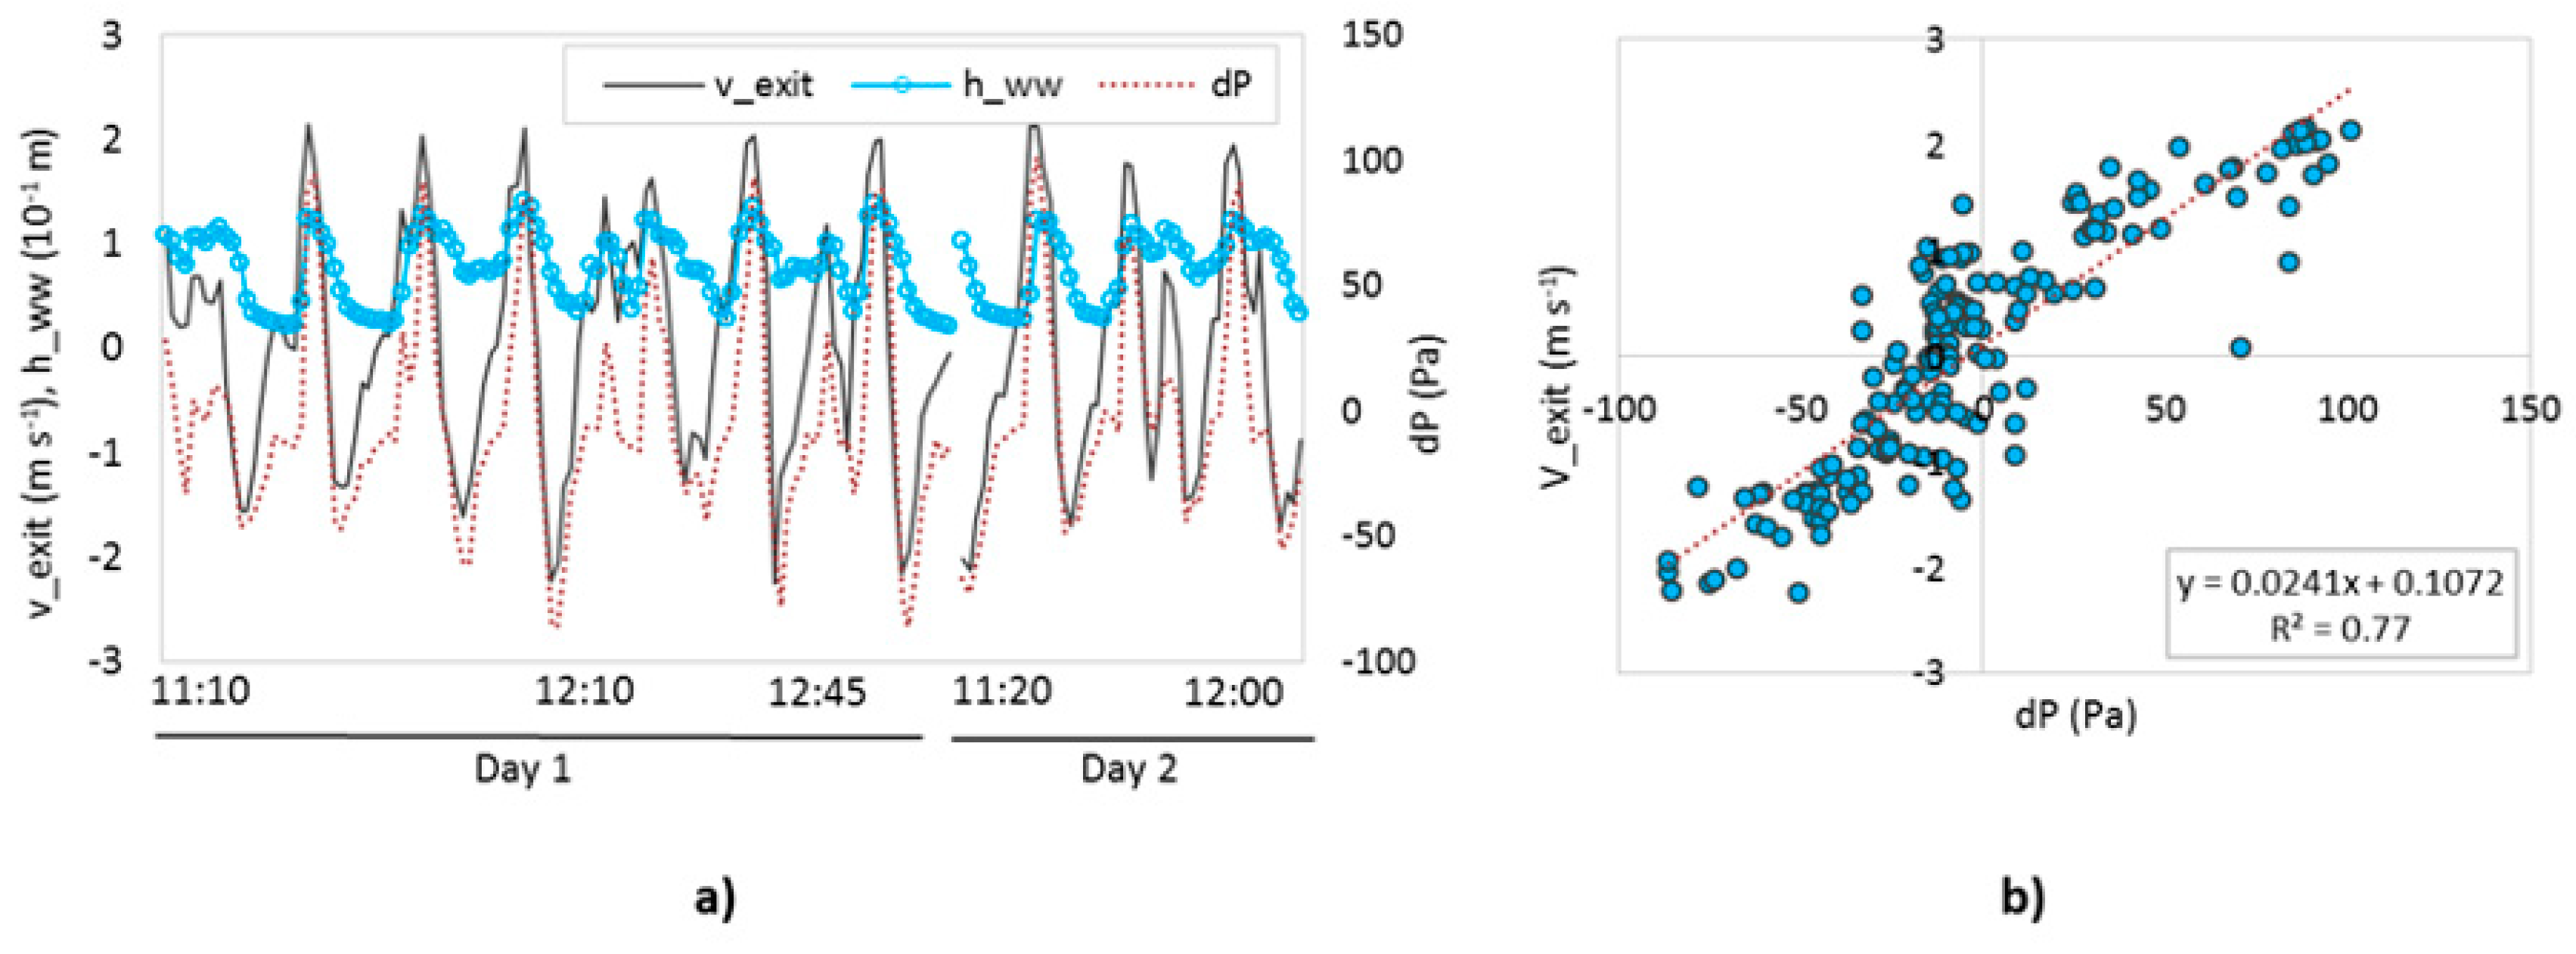
Under normal system operation (baseline), pressure differences between the outside atmosphere and the sewer headspace seem to influence the in and out-gassing of gaseous pollutants emitted at the gravity trunk sewer. Figure 2 depicts v_exit, h_ww, and pressure difference between sewer air and the outside atmosphere (dP) measured at the upstream manhole (C-2) for a period of a few hours during both monitoring days in June.
Pumping events resulted in maximum average liquid depths of 0.11 m and pressurization peaks of roughly 100 Pa, with air exiting the vent stack at maximum average velocities of 1.76 m s−1, with peaks of H2S reaching 90 ppm during that period. Conversely, once the wastewater wave had passed, maximum negative pressure values of over −50 Pa were observed, attaining null concentrations of H2S at the venting stack.
Since the used hotwire anemometers do not provide information regarding direction, v_exit was analyzed for the period where hydraulic flow was measured. Each pumping event resulted in a dP pattern of positive and negative peaks, accompanied by two positive v_exit peaks. The second v_exit peak clearly corresponded to an accentuated pressure drop inside the sewer, thus indicating air being sucked into the system, as it had already been observed in other studies [13]. Therefore, the variable v_exit was then transformed to account for direction (Figure 2a). While similar variations of dP and v_exit were observed for all the baseline monitoring periods, a third variable (wastewater depth, h_ww) was added to further validate (visually) that such behavior most likely corresponds to pumping events, and was induced by them. However, since the hydraulic flow meter data logger did not record data during May, the presented analysis refers to June data only.
A preliminary analysis was carried out to evaluate the possible effect of non-random variables (patterns like trends or seasonality) that could mean those time series are non-stationary. Visibly, there are no clear patterns that could indicate a (upward or downward) trend. The continuously observed peaks result from pumping events, which vary in duration and frequency throughout the day, therefore not appearing to constitute a truly seasonal pattern. Nonetheless, additional procedures were carried out. First, the non-parametric method of first differences was carried out, and the resulting chart did not evidence any clear trends (data not shown). Second, data was divided into two periods to evaluate whether its statistic properties (mean and variance) changed over time. This indicated no statistical significance between those properties (two tailed t-test, p-value > 0.05). An additional augmented Dickey–Fuller (ADF) test was carried out indicating the stationarity of the data.
Normality of the data was verified by skewness and kurtosis values inside the ranges of the general guidelines referred in Hair et al. [17], namely −1 to +1. As such, the Pearson correlation coefficient (r) was applied, as a measure of strength of the relationship between dP and v_exit, for a significance level (α) of 0.05, for a two-tailed test. This indicated there was a statistically significant relationship between those variables, r (166) = 0.87, p < 0.05.
The theoretical framework, namely fluid mechanics theory and other studies [13,14,16], establishes that dP and air movement are related, therefore it was considered that, under these circumstances, the correlation holds valid for this data set. This allowed obtaining a simple empirical correlation (through ordinary least squares—OLS regression) between those variables (Figure 2b), which allows for an expedite prediction of airflows emitted to the outside atmosphere (Equation (1)), with a coefficient of determination of 0.77:
where v_exit (m s−1) refers to air velocity exiting the venting stack and dP to the pressure differential between sewer and exterior atmosphere (Pa).
v_exit = 0.0241 × dP + 0.1072
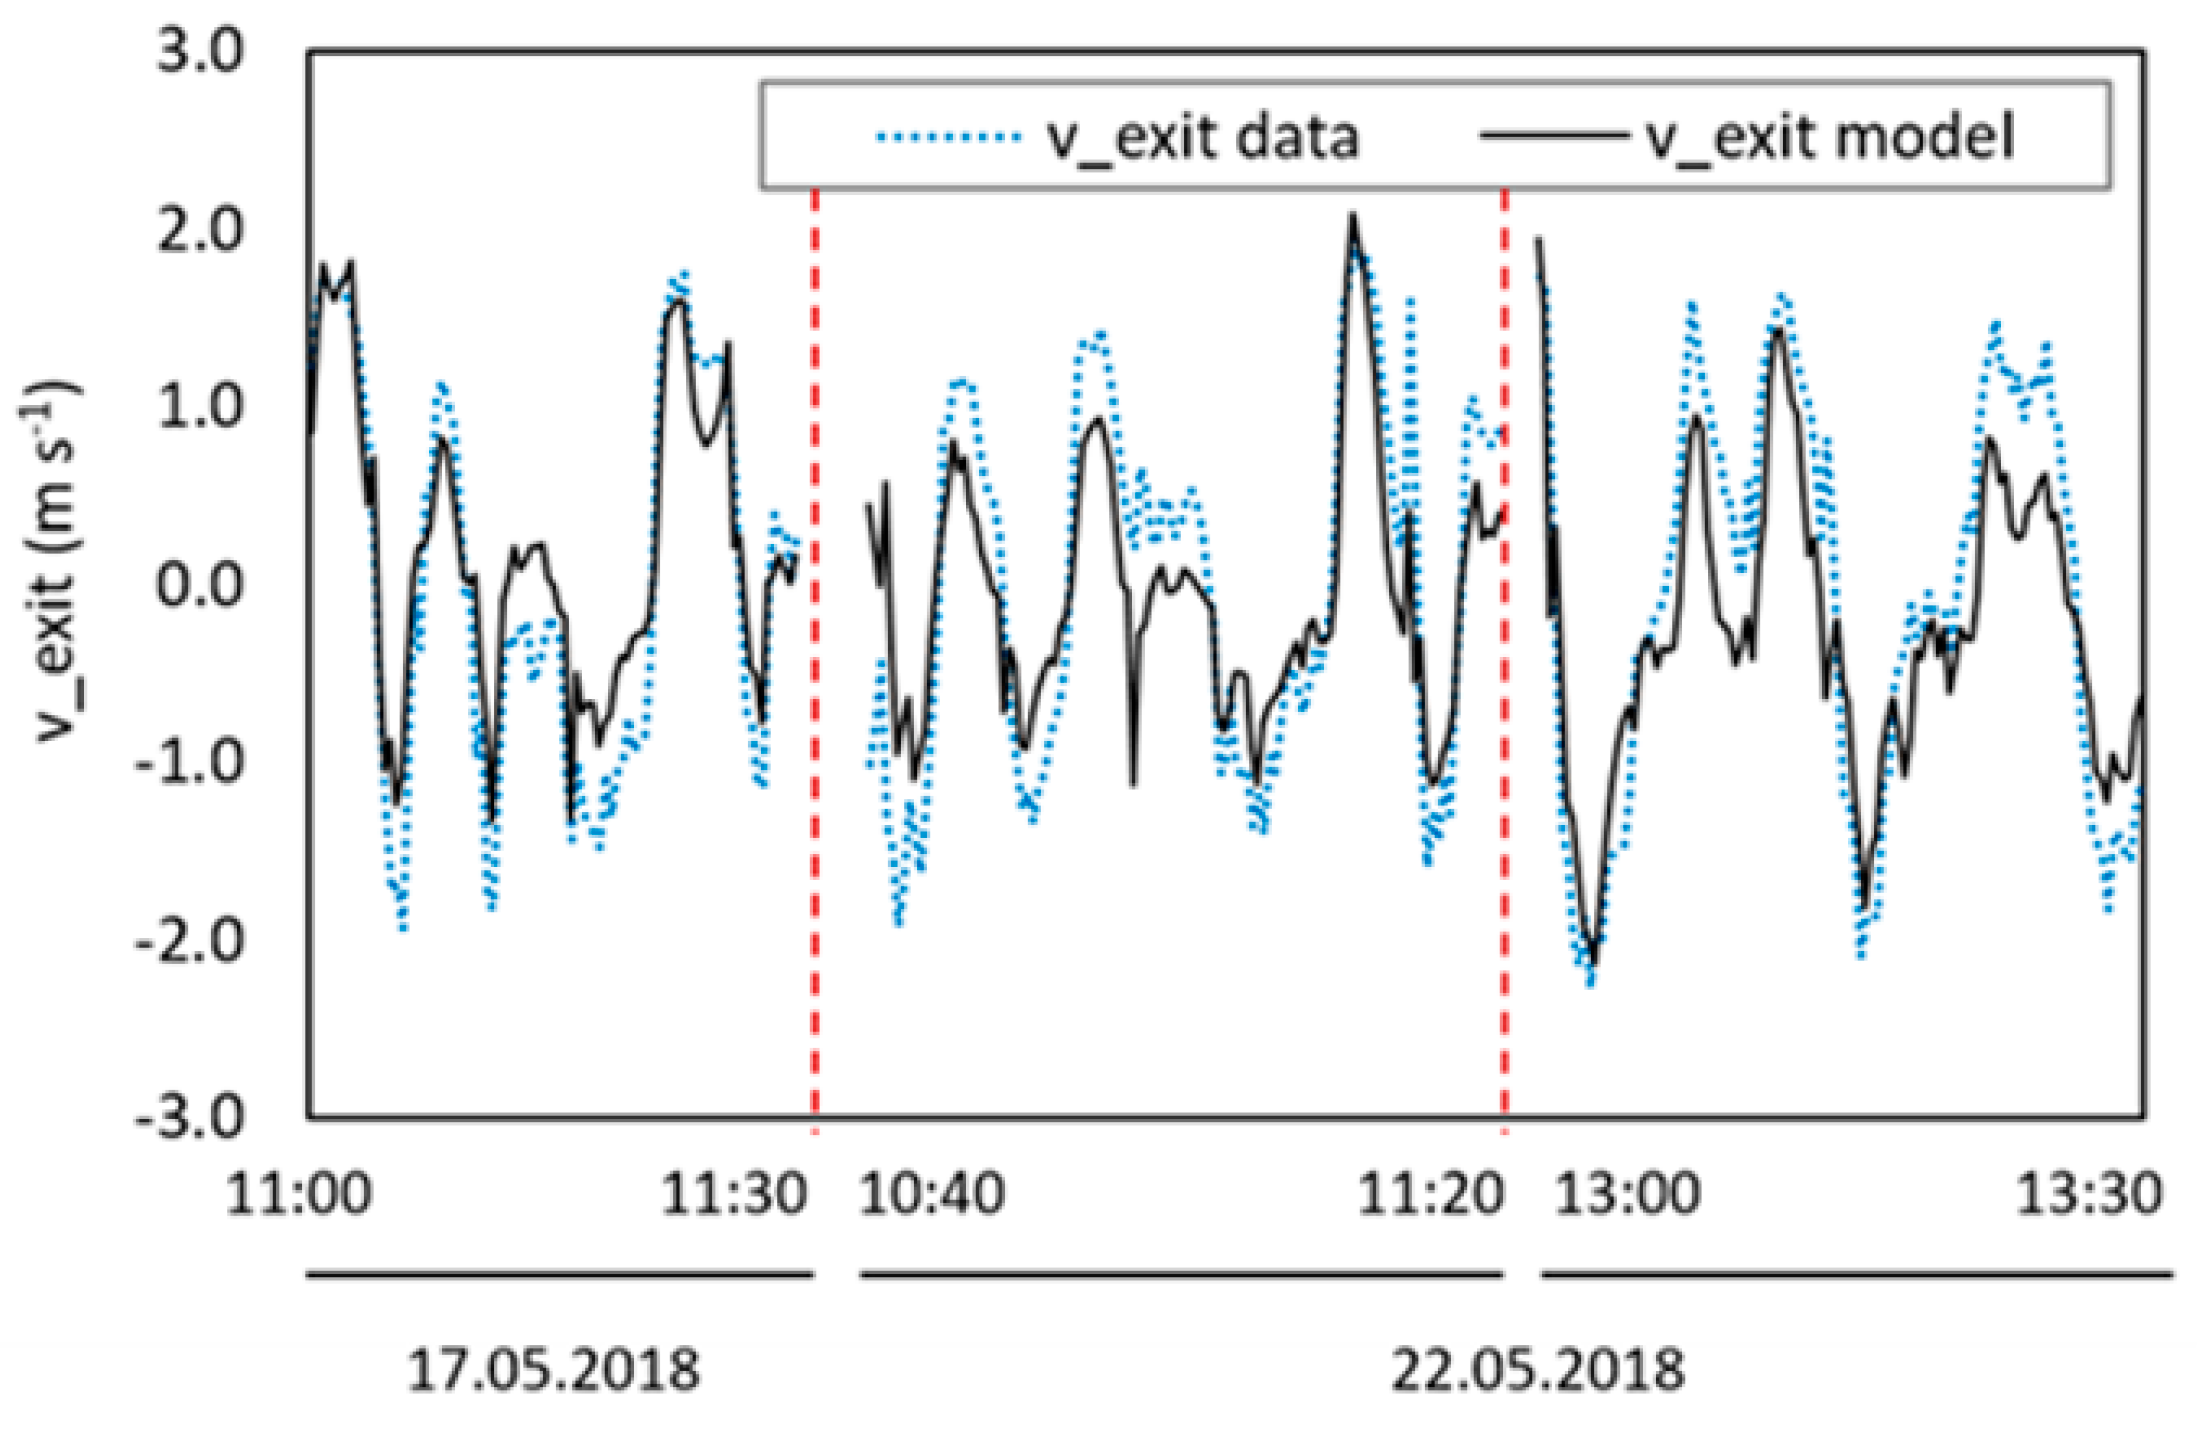
For validation purposes, the proposed equation was compared with monitoring data from three distinct periods of May, not used in model formulation. A plot of the agreement between measured (v_exit data) and predicted air velocity exiting the venting stack (v_exit model) is depicted in Figure 3, evidencing a good fit between both variables.
This measured velocity can be translated into an airflow (provided the venting stack cross section is known) and multiplied by emission factors, such as those proposed by the USEPA [18] to estimate gaseous emissions of H2S or any given pollutant. This way, the drawback of using steady state sulfide predictions models, incapable of accurately representing such phenomena, can be overcome in an expedite manner. This is important, not only because of the potential negative environmental impacts, but also in terms of odor nuisance to the nearby population.
In addition, the relationship between pressure distributions induced by pumping and emitted air velocities may be useful when designing venting stacks located downstream of rising mains. Notwithstanding, it should be kept in mind that these values were obtained for a specific venting configuration. Even though most venting stacks follow a few commercially available options, it should be expected that different stacks will present different minor losses that will influence v_exit, and equation (1) parameters may require local calibration.
3.3. Airflow Dynamics within the Sewer Headspace
During normal operation (i.e., closed manhole covers) H2S concentration peaks in air exiting the vent stack were always higher than those measured inside the pipe at both manholes. The same holds true for air velocities, which may also be explained by the proximity of the venting stack to the most upstream manhole of the gravity pipe.
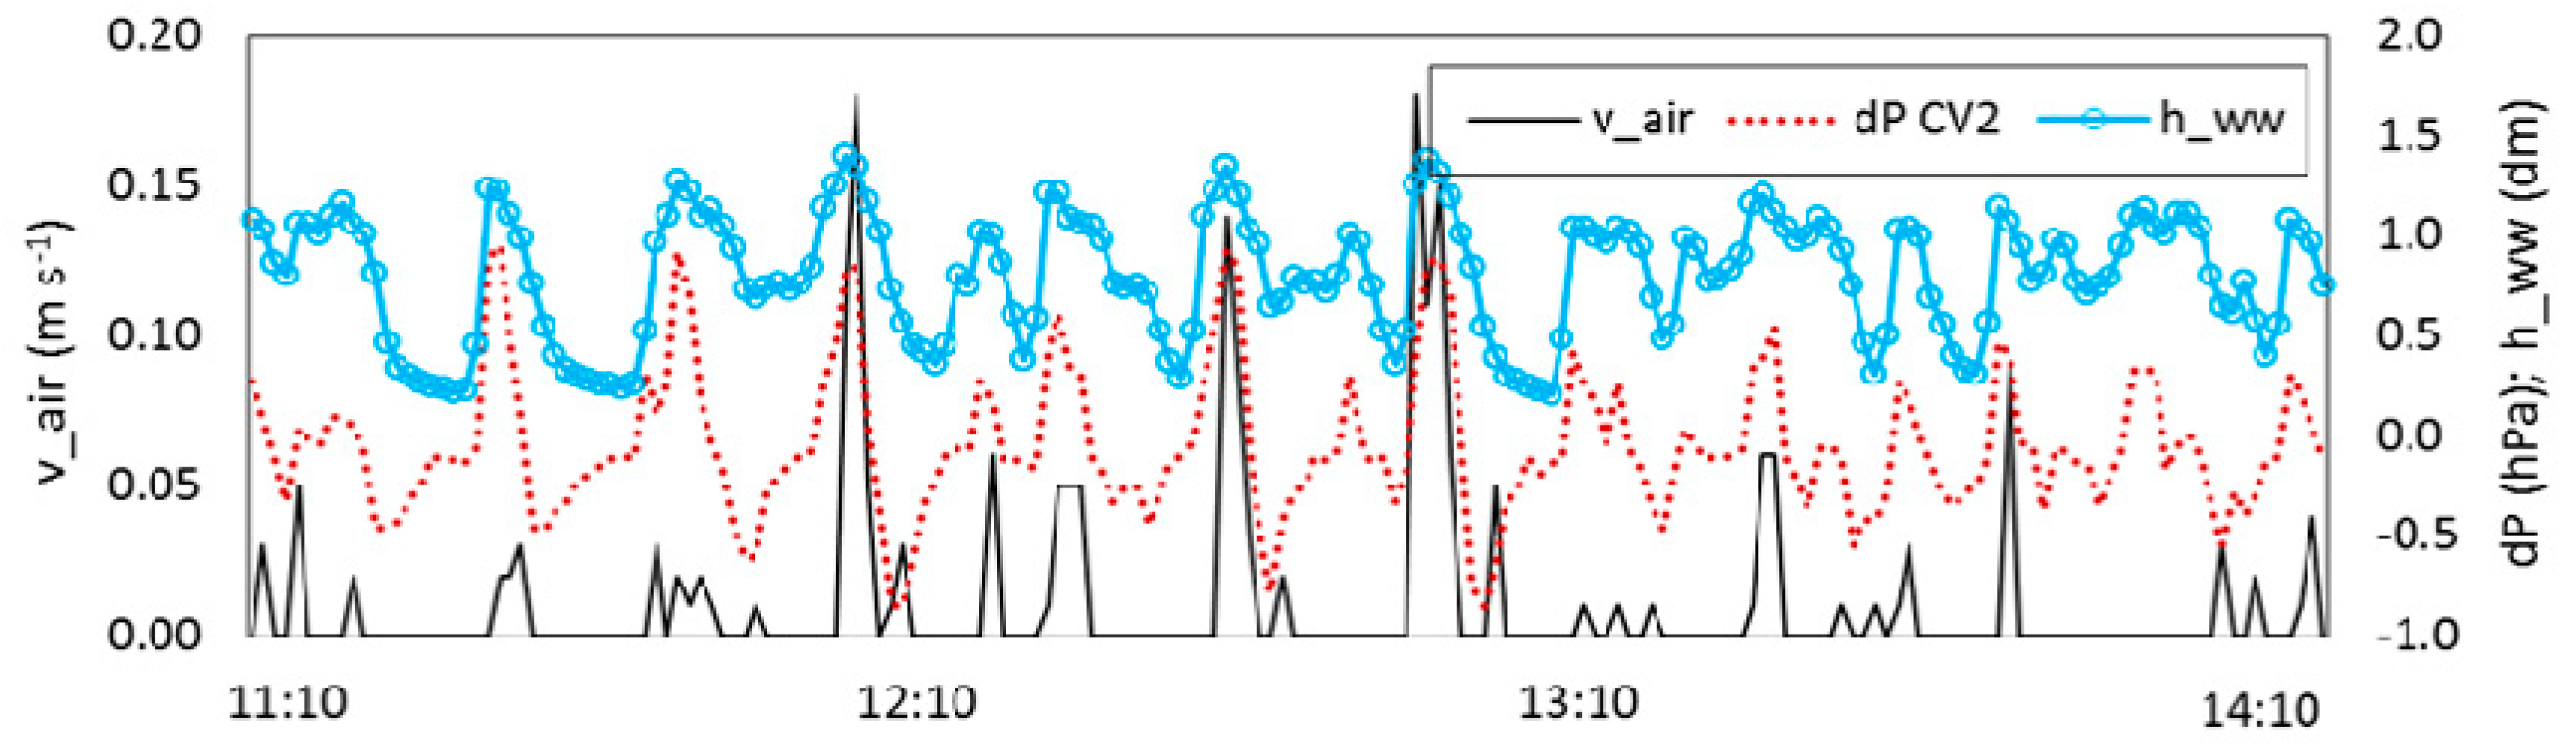
Unlike with what happens at the venting stack, and the findings of Guo et al. [15], there appeared to be no visible correlation between air velocity and pressure differentials at the pipe, nor between those and the observed gas concentrations. An exploratory analysis was carried out to assess whether the observed dynamic variations in gas concentration inside the sewer could also be easily explained, through an empirical formulation, similarly to what was verified for v_exit. A series of regressions were carried out (data not shown), using the parameters H2Sg, v_air, Q, h_ww, dP, T, and R.H. However, no significant correlations were obtained. Even though dP and air velocity peaks visibly coincide with gas concentration (especially for H2S) and liquid depth peaks at each pumping event (Figure 4), for relatively similar curves, the magnitude of those parameters often varies considerably from one event to the other. This illustrates the complexity of headspace flow rates and gas concentration transport and removal mechanisms, and is most likely due to a combination of factors namely:
- Time lag between the measured responses, resulting from the non-simultaneity of processes (for example an air wave moving upstream when the wastewater flow is null or still moving downstream).
- Different liquid phase sulfide concentrations, resulting in different H2S fluxes to the sewer headspace.
- The headspace pressurization, induced by direct discharge from the rising main or the full flowing pipe, may differ (thus contributing to different measured pressure differences). This was confirmed visually on site, seeing as some of the pumping events caused the adapted manhole covers to oscillate during wastewater flow, while for other events there was no visible disturbance.
- The effect of the downstream full flowing pipe, as well as the distinct uncontrollable environmental conditions.
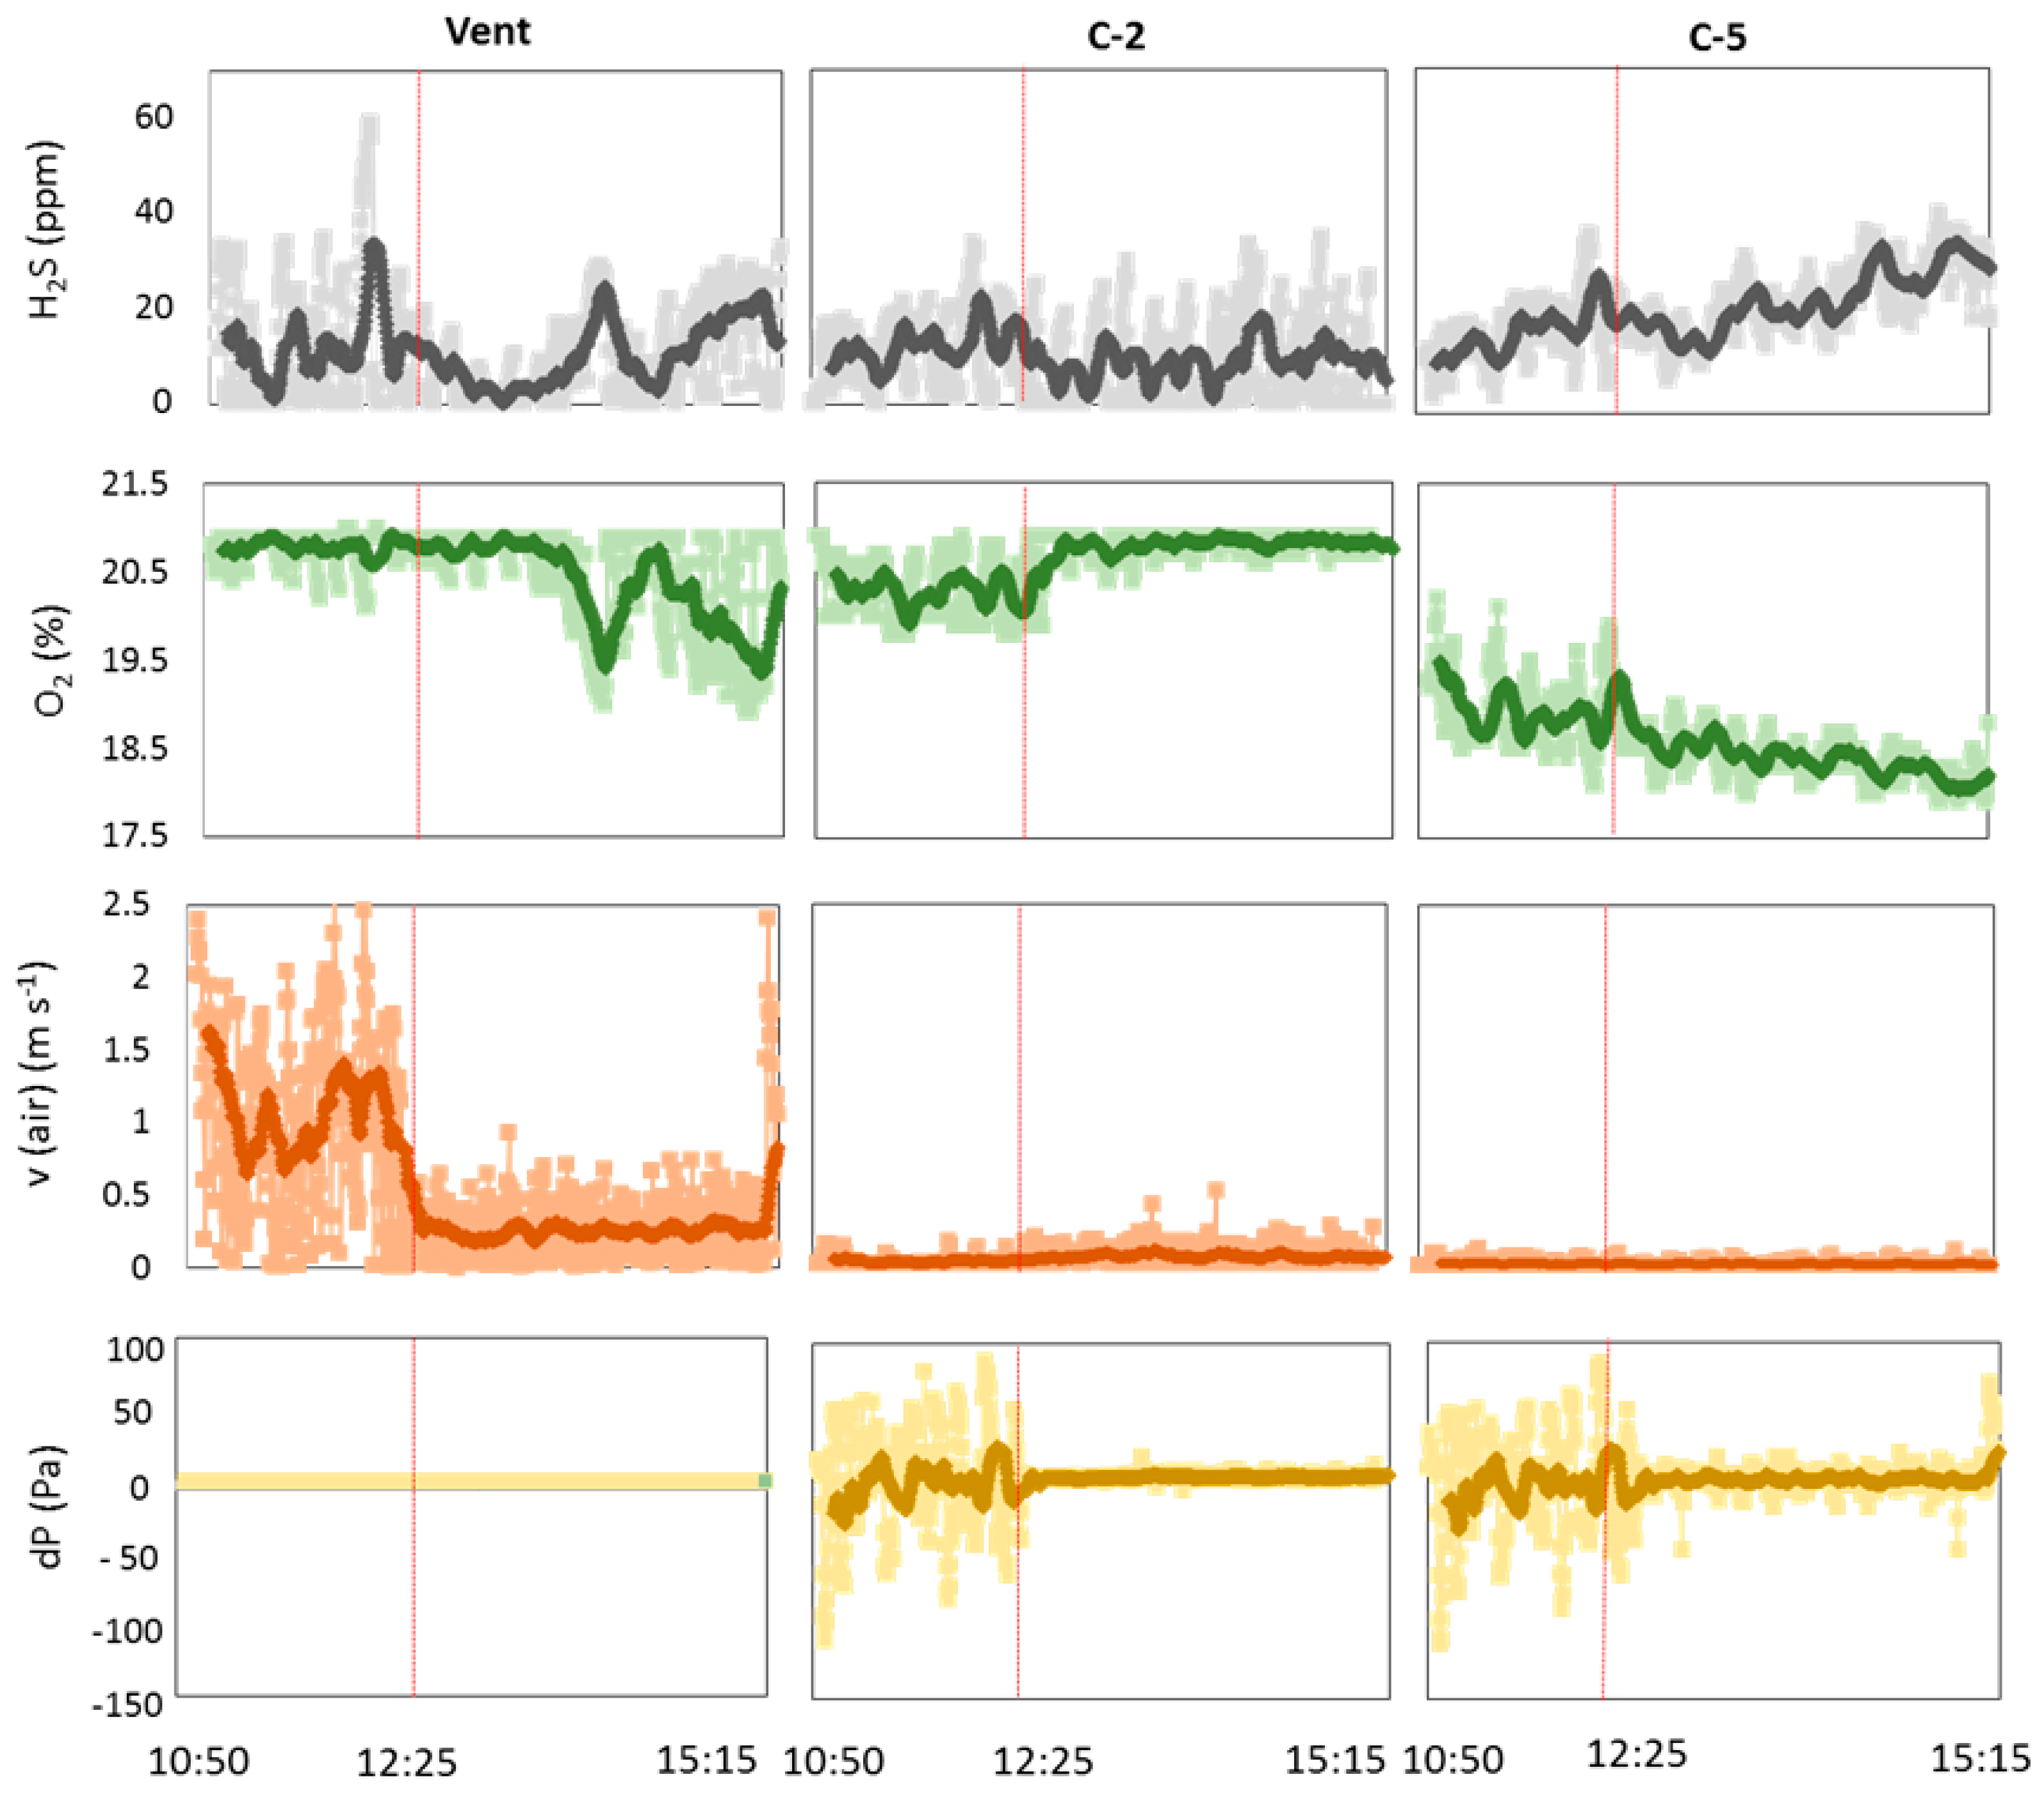
Figure 5 depicts the variation of headspace parameters over time at three monitored locations (venting stack, C-2, and C-5) during a period of roughly 4.5 h. Passage from baseline conditions to one open manhole at C-2 at 12:25 pm is indicated with a dashed red line. For a clearer visualization of longer term trends, a 10 min moving average (darker shading line) was calculated and added to each chart over the monitored data (lighter shading line).
In terms of gas phase parameters, the opening of one manhole cover resulted in a slight reduction in the average concentration of H2S emitted through the venting stack and present at C-2, while there is an ascending trend of H2S accumulation at C-5. This is thought to be due to the effect of the full flowing pipe downstream of C-7, which might inhibit air entering the system at C-2 from moving upstream. When looking at the behavior of O2, it can be seen that it follows the opposite trend of H2S, at the venting stack and at both manholes.
The observed pressure gradients induced by pumping events (peaking at approximately 100 Pa) were significantly higher than those measured in other systems, for much smaller inflows. As an example, in the Ericeira (Portugal) gravity sewer, described in Matos et al. [16], the pumping of 6 L s−1 of wastewater originated pressure differentials of 9 Pa, roughly 10 times lower than those measured at the Meco pipe. This indicates that the magnitude of gas pollutant emissions may rely heavily on the headspace impacts of hydraulic flows and pumping characteristics.
With the opening of one manhole cover (C-2), the pressure difference between sewer headspace and outside atmosphere is drastically reduced. Instead, airflow rates in the pipe increase to about 1.5 times that of normal operation. The opening of two manhole covers (not shown) induces different rates through the pipe. It seems the simultaneous opening of C-1 and C-2 originates lower airflow rates at C-2 (than when opening C-2 and C-3), likely because of air emissions at C-1. Also, the lag time between pumping and measured headspace effects increases toward downstream. These results indicate that not only ventilation rates, but also distance to manhole and rising main, will influence transport and emission (to the exterior) of pollutants within the sewer.
Certainly the analysis can become more complex if it is kept in mind that air is compressible, exterior weather conditions are uncontrollable and may influence density and pressure gradients, which affect gas movement and emission.
3.4. Effect of Downstream Pressurization (Full Flowing Pipe)
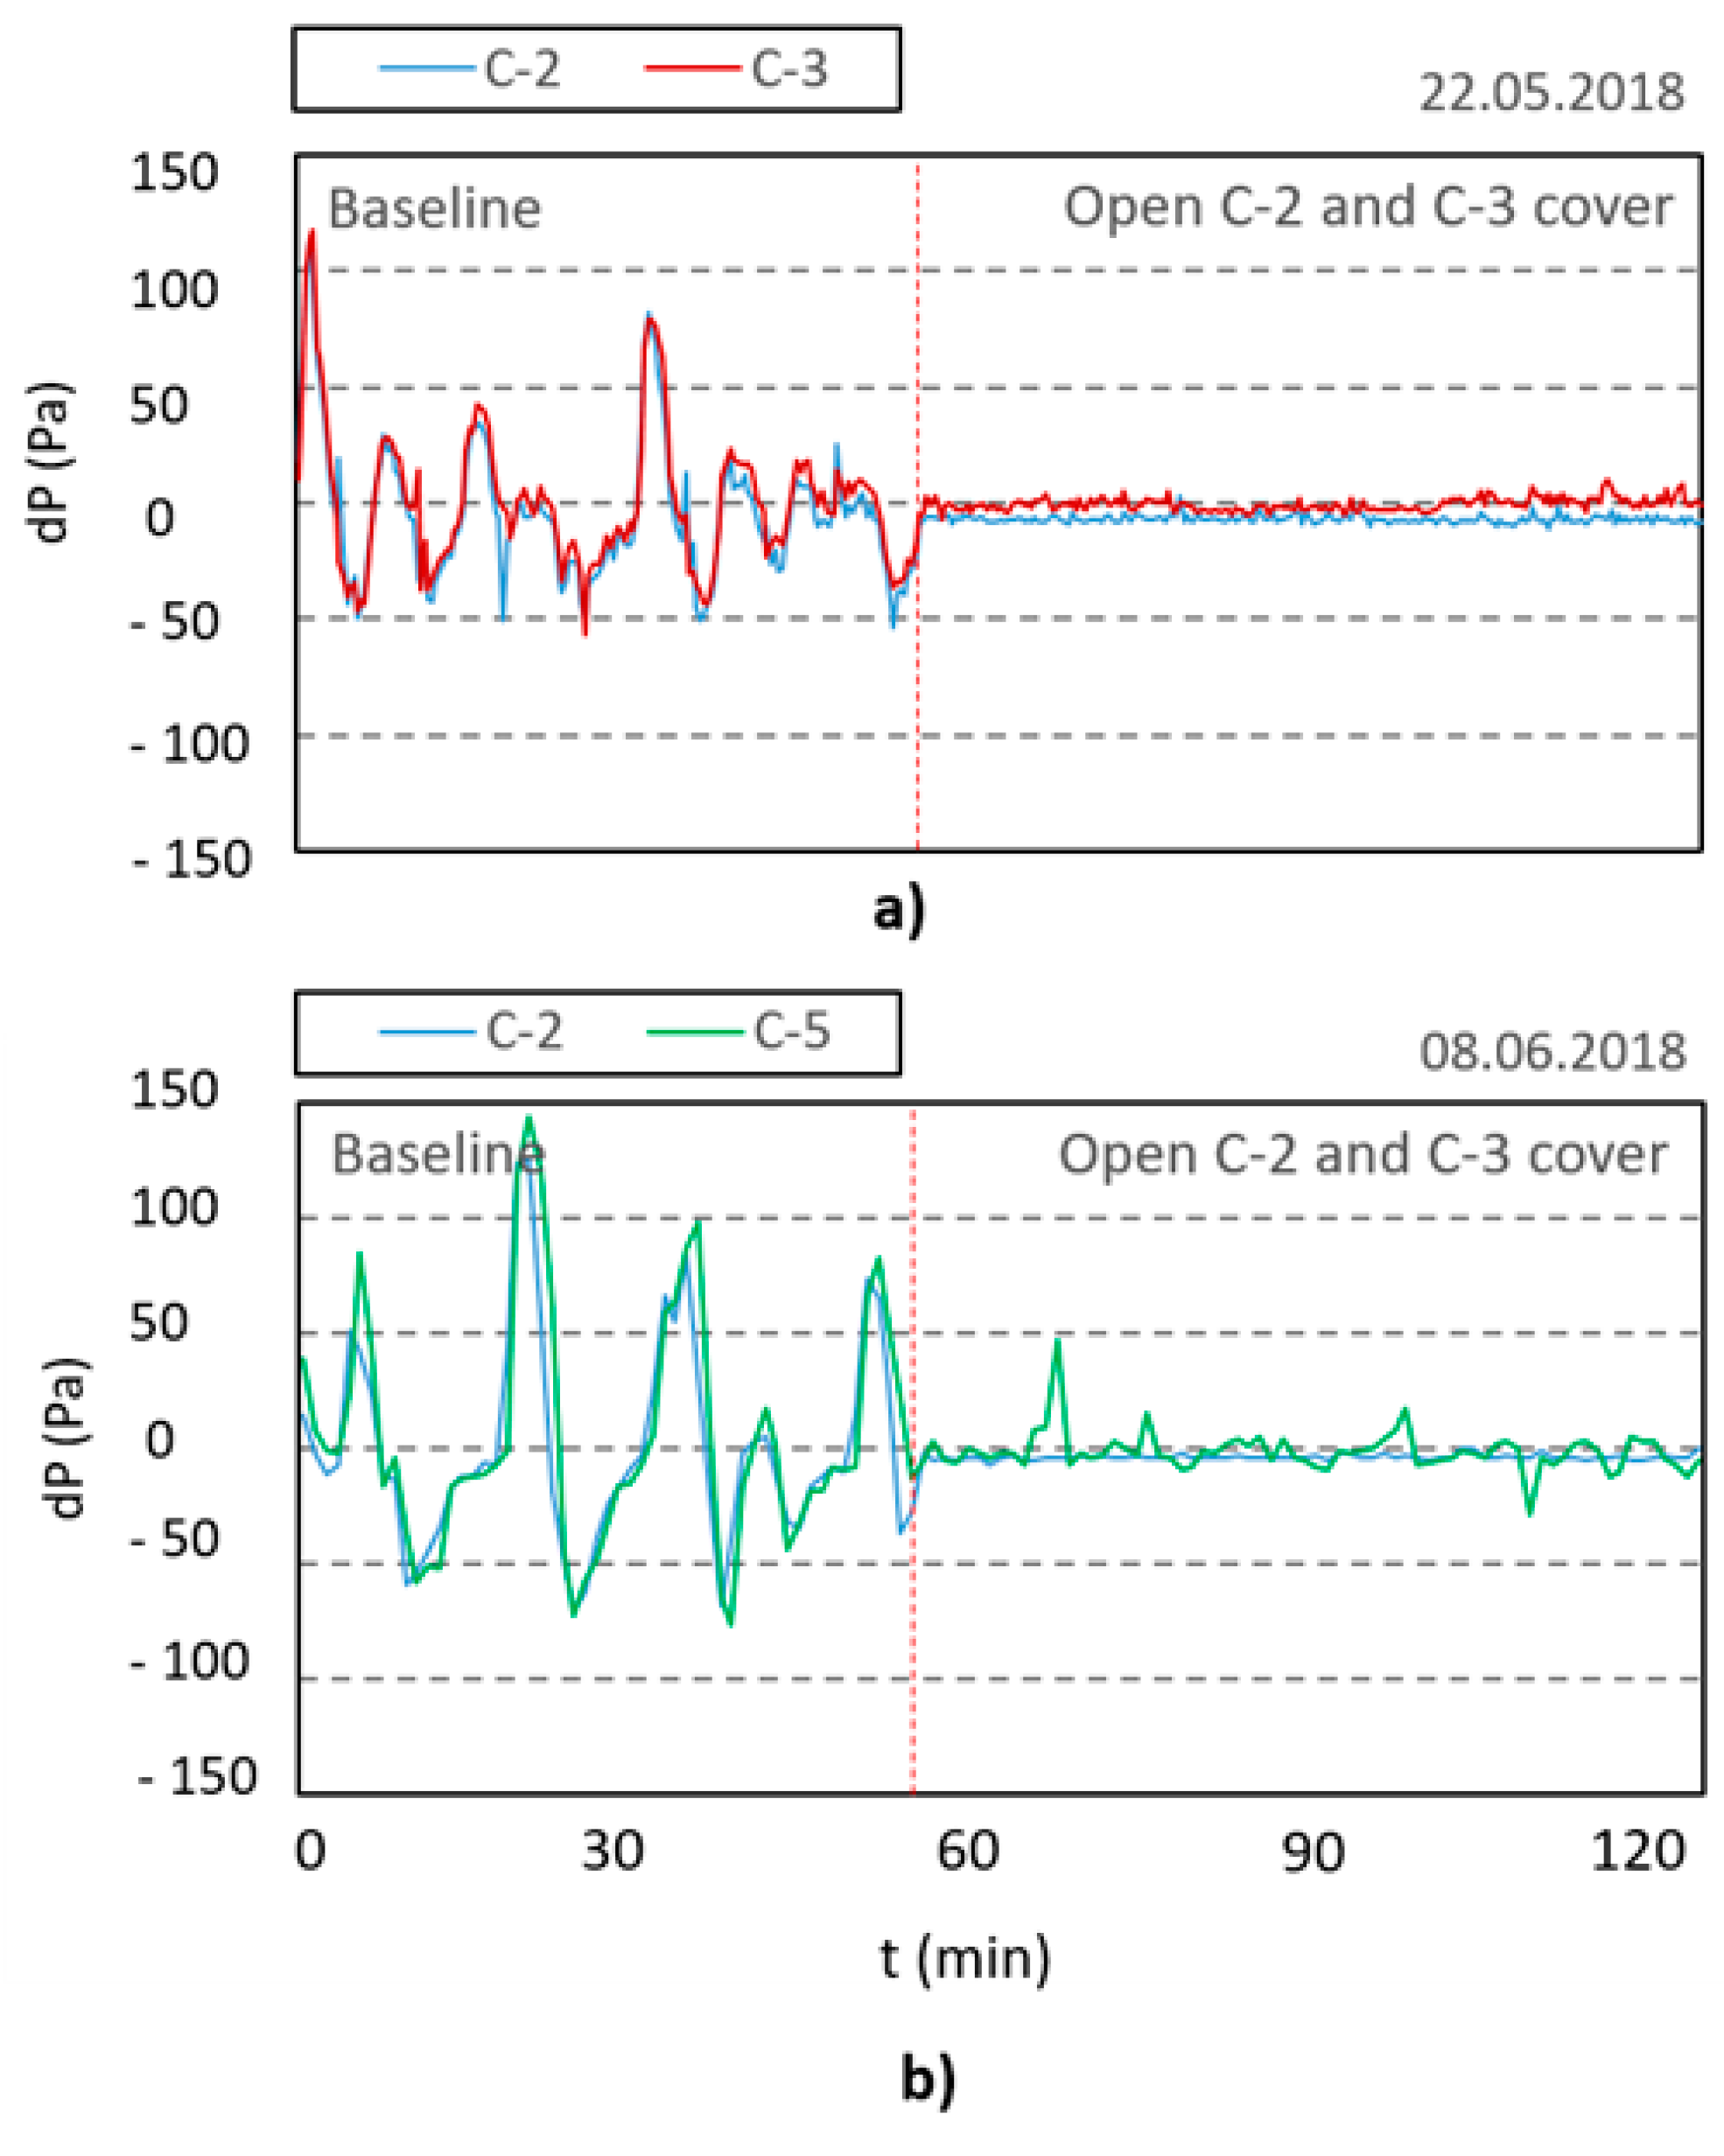
Another aspect worth mentioning is the effect of downstream pressurization in H2S concentration within the pipe. During normal operation, larger peak pressure differences are observed between manholes C-2 and C-3 than between C-2 and C-5. This may be due to an increased headspace pressure toward the downstream end of the pipe caused by the full flowing pipe (inverted siphon) at C-7. It is interesting to note that when both C-2 and C-3 manholes are open (Figure 6a), pressure differences between them are still visible, even though the effect of pumping events is no longer as noticeable. That is not the case at C-5, where pressure peaks, of up to 50 Pa, induced by pumping events are observable (Figure 6b).
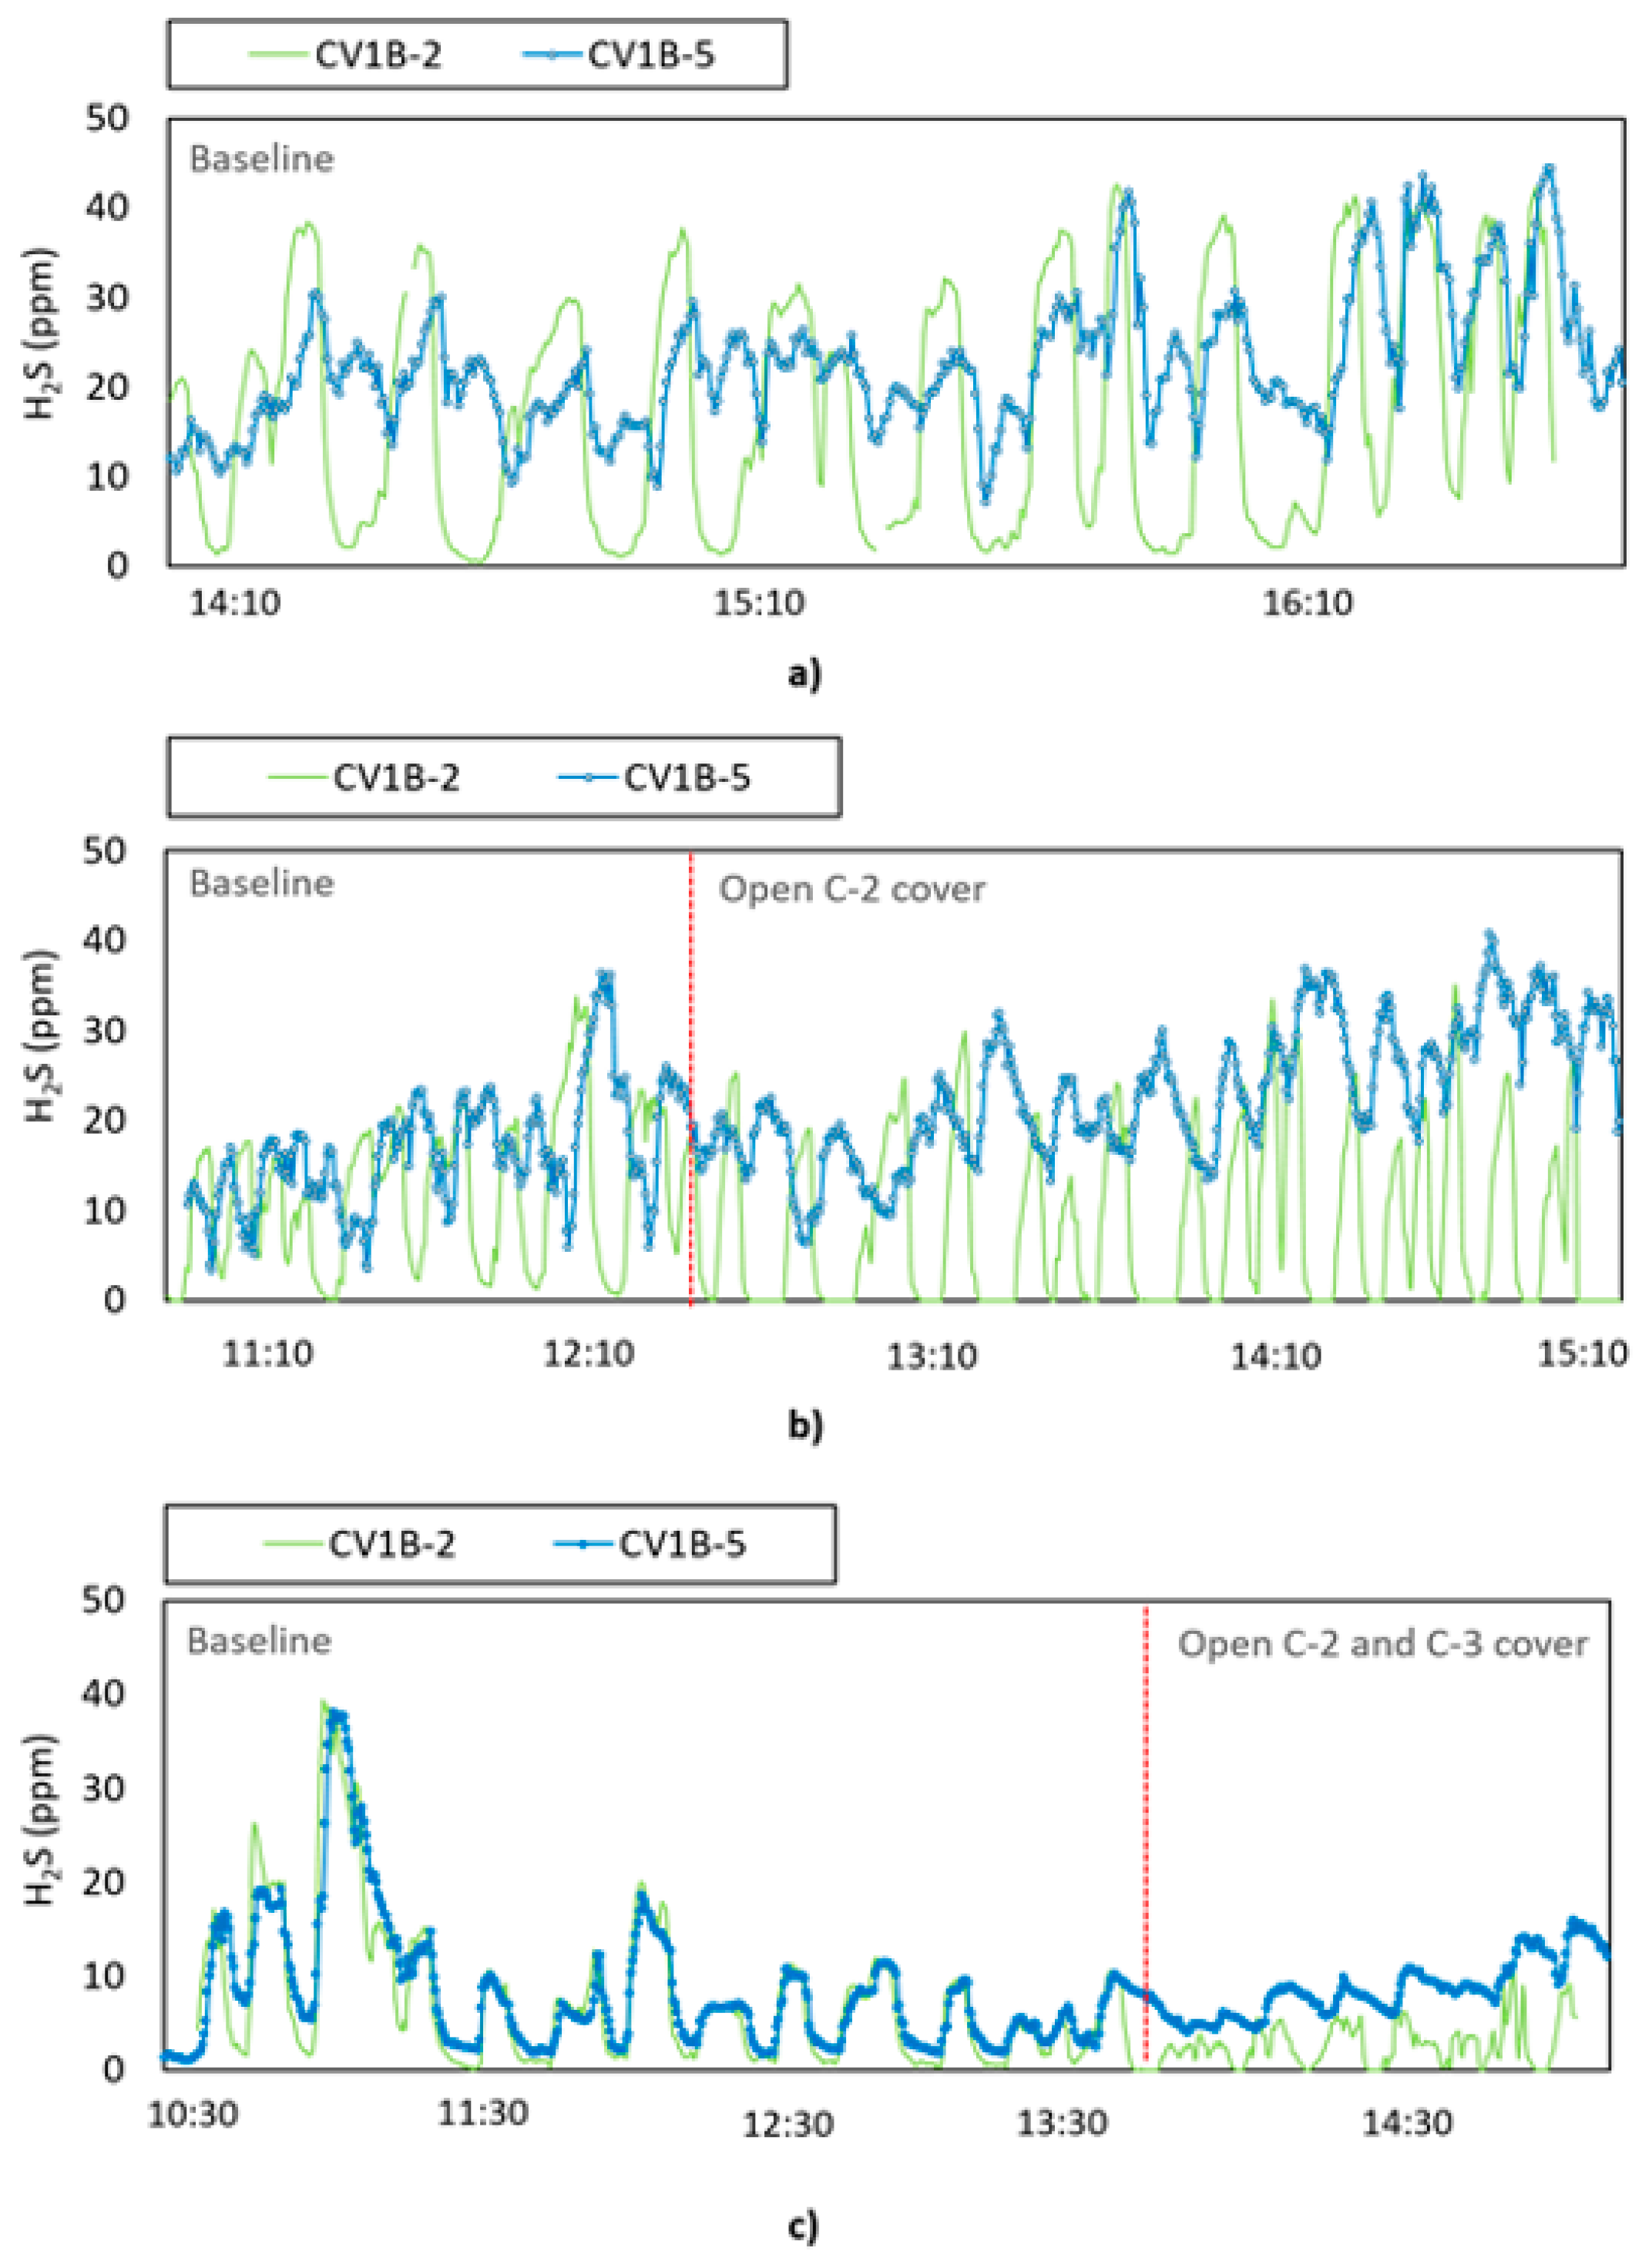
Differences in H2S concentration between C-2 and C-5 at different setups are also visible. During baseline (Figure 7a) each pumping event generates one distinct H2S curve at C-2, while at C-5 two curves per pumping event are often observable. This is also visible when C-2 MH cover is open (Figure 7b). This effect is most likely due to the constricted downstream boundary, which causes sewer pressurization and air movement toward the upstream end, as observed in Matos et al. [16]. While this is sometimes visible in the measured velocity oscillations, the low air velocities, the somewhat limited anemometer sensitivity and the fact that the anemometer does not retrieve direction, may mask this effect. These multiple curves are no longer visible at C-2 because potential air leaks at MH covers and lateral connections provide opportunity for gas to be released elsewhere. Manhole opening (either 1 or 2) results in H2S build-up at C-5 (ascending trend in H2S concentration visible in Figure 7b,c). It seems air exchange with the outside atmosphere is more relevant upstream near the openings, and that the additional in-gassing, coupled with wastewater air drag, results in gas transport and accumulation downstream.
4. Conclusions
This study allowed perceiving the impact of pressure differences, induced by intermittent pumping, in airflow rates at a sewer venting stack, causing gaseous exchanges between the sewer headspace and the outside atmosphere, by out-gassing of H2S and other pollutants, and in-gassing of fresh clean air. Data lacking in the literature were obtained, which are essential not only for a more thorough process understanding, but also for model testing and development.
A statistical significant correlation was found between the variables dP and v_exit, enabling obtaining an empirical model for quick prediction of airflows emitted from the system, enabling the estimation of gas pollutant emissions to the outside atmosphere under intermittent conditions. This is especially relevant in terms of odor control and process modelling.
In contrast, even though the same fundamental mechanisms of air movement induced by pressure differences are expected to influence horizontal air movement within the sewer pipe, this was not observed in practice. The difficulties in identifying that relationship were likely due to a combination of factors like the non-simultaneity of responses along the length of the pipe, the effect of the constricted downstream end, or operational issues. This illustrates the complexity not only of the mechanisms involved in sewer ventilation and advective transport, but also of measuring certain parameters and obtaining theoretical correlations in full scale systems.
It was observed that the magnitude of gas pollutant emissions may heavily depend on the impacts of hydraulic flows and pumping characteristics in headspace pressure differences, denoting the need for better approaches when designing and installing venting stacks, seeing as usual “rules-of-thumb” may fail to provide adequate odor control.
The existence of a full flowing pipe at the downstream end of the gravity trunk sewer had in practice two observable distinct effects, in terms of sewer ventilation and gas movement. In case of standard system operation (baseline) downstream sewer pressurization was observed (dP between manholes C-2 and C-3 higher than that between manholes C-2 and C-5), thus forcing air to move upstream (two visible H2S curves per pumping event at manhole C-5). The opening of manhole covers, evidenced an increase in pipe ventilation and gas build-up toward the downstream end of the pipe (visible at C-5), which suggests the effect of in-gassing at the upstream open manholes results in a combination of forces that surpasses the downstream pressurization effect that originates air movement toward the upstream section of the sewer.
The work carried out was based in a semi-experimental field setting case study, because some parameters are very difficult to accurately reproduce in a laboratory-based settings (for example A/V pipe ratios, biofilm thickness or pumping turbulence). Comprehensive field studies such as this one, while adding great value by providing full scale real data, are more limited in time and resources, thus originating smaller data sets. Unlike laboratory-based research, it was still subjected to certain local uncontrollable parameters, for example pumping duration, wastewater quality, or atmospheric conditions. In order to minimize this influence, some control over variables was exercised, and data was collected under different seasons and weather conditions. Nonetheless, the relatively short length of the full scale gravity pipe, and restrictions in terms of number of open manholes, because of some covers being sealed, as well as in ventilation control because of the height of the stack, caused some limitations in the extent of the possible setups under analysis. Further design options should be explored in terms of increased number of open manholes and durations of each opening, as a further step in evaluating exposure risks, ventilation needs, and odor release potential.
Author Contributions
Conceptualization, R.V.M. and J.S.M.; investigation, R.V.M.; supervision, F.F. and J.S.M.; writing–original draft, R.V.M.; writing–review and editing, F.F. and J.S.M.
Funding
This research was funded by Universidade de Lisboa, through a PhD grant assigned to the first author.
Acknowledgments
The authors acknowledge SIMARSUL, S.A. for all the support during field work and data acquisition
Conflicts of Interest
The authors declare no conflict of interest.
References
- Ward, M.; Corsi, R.; Morton, R.; Knapp, T.; Apgar, D.; Quigley, C.; Easter, C.; Witherspoon, J.; Pramanik, A.; Parker, W. Characterization of natural ventilation in wastewater collection systems. Water Environ. Res. 2011, 83, 265–273. [Google Scholar] [CrossRef] [PubMed]
- Pescod, M.; Price, A. Major Factors in sewer ventilation. J. Water Pollut. Control Fed. 1982, 54, 385–397. [Google Scholar]
- Tata, P.; Witherspoon, J.; Lue-Hing, C. VOC Emissions from Wastewater Treatment Plants: Characterization, Control, and Compliance; Lewis Publishers: Boca Raton, FL, USA, 2003. [Google Scholar]
- Ward, M.; Hamer, G.; McDonald, A.; Witherspoon, J.; Loh, E.; Parker, W. A sewer ventilation model applying conservation of momentum. Water Sci. Technol. 2011, 64, 1374–1382. [Google Scholar] [CrossRef] [PubMed]
- Lowe, S.A. Sewer Ventilation: Factors Affecting Airflow and Modeling Approaches. J. Water Manag. Model. 2016, C395. [Google Scholar] [CrossRef]
- Hvitved-Jacobsen, T.; Vollertsen, J.; Nielsen, A.H. Sewer Processes—Microbial and Chemical Process Engineering of Sewer Networks, 2nd ed.; CRC Press: Boca Raton, FL, USA, 2013. [Google Scholar]
- Chen, Y.; Wang, X.; He, S.; Zhu, S.; Shen, S. The performance of a two-layer biotrickling filter filled with new mixed packing materials for the removal of H 2 S from air. J. Environ. Manag. 2016, 165, 11–16. [Google Scholar] [CrossRef] [PubMed]
- Talaiekhozani, A.; Bagheri, M.; Goli, A.; Khoozani, M.R.T. An overview of principles of odor production, emission, and control methods in wastewater collection and treatment systems. J. Environ. Manag. 2016, 170, 186–206. [Google Scholar] [CrossRef] [PubMed]
- Olson, D.; Rajagopalan, S.; Corsi, R.L. Ventilation of Industrial Process Drains: Mechanisms and Effects on VOC Emissions. J. Environ. Eng. 1997, 123, 939–947. [Google Scholar] [CrossRef]
- Monteith, H.; Bell, J.; Harvey, T. Assessment of factors controlling sewer ventilation rates. In Proceedings of the Water Environment Federation (WEF) Specialty Conference on Control of Odors and VOC Emissions, Houston, TX, USA, 20–23 April 1997. [Google Scholar]
- Zhang, W.; Edwini-Bonsu, S.; Qian, Y.; Zhu, D.Z.; Rajaratnam, N.; Steffler, P. Air Movement Induced by Water Flow with a Hydraulic Jump in Changing Slope Pipes. J. Hydraul. Eng. 2017, 143, 4016092. [Google Scholar]
- Edwini-Bonsu, S.; Steffler, P.M. Modeling Ventilation Phenomenon in Sanitary Sewer Systems: A System Theoretic Approach. J. Hydraul. Eng. 2006, 132, 778–790. [Google Scholar] [CrossRef]
- Qian, Y.; Zhu, D.Z.; Edwini-Bonsu, S. Air Flow Modeling in a Prototype Sanitary Sewer System. J. Environ. Eng. 2018, 144, 4018008. [Google Scholar] [CrossRef]
- Apgar, D.; Witherspoon, J.; Ward, M. Minimization of Odors and Corrosion in Wastewater Collection Systems, Phase II Collection System Ventilation Research; Report 04-CTS-La; Water Environment Research Foundation: Alexandria, VA, USA, 2009. [Google Scholar]
- Guo, S.; Qian, Y.; Zhu, D.; Zhang, W.; Edwini-Bonsu, S. Effects of Drop Structures and Pump Station on Sewer Air Pressure and Hydrogen Sulfide: Field Investigation. J. Environ. Eng. 2018, 144. [Google Scholar] [CrossRef]
- Matos, R.V.; Ferreira, F.; Gil, C.; Matos, J.S. Understanding the effect of ventilation, intermittent pumping and seasonality in hydrogen sulfide and methane concentrations in a coastal sewerage system. Environ. Sci. Pollut. Res. 2019, 26, 3404–3414. [Google Scholar] [CrossRef] [PubMed]
- Hair, J.F.; Hult, G.T.M.; Ringle, C.M.; Sarstedt, M. A Primer on Partial Least Squares Structural Equation Modeling (PLS-SEM), 2nd ed.; Sage: Thousand Oaks, CA, USA, 2017. [Google Scholar]
- US Environmental Protection Agency. Air Emission Models for Waste and Wastewater (EPA-453/R-94-080A); Office of Air Quality Planning and Standards: Research Triangle Park, NC, USA, 1994.
Figure 1.
Location of Meco wastewater system (a); and schematization of experimental apparatus at Rua das Flores trunk sewer (red circles indicate probe placement) (b).
Figure 1.
Location of Meco wastewater system (a); and schematization of experimental apparatus at Rua das Flores trunk sewer (red circles indicate probe placement) (b).

Figure 2.
Variation of pressure differences between manhole invert and ambient atmosphere and air velocity at the venting stack: (a) over time during two consecutive days, and (b) ordinary least squares (OLS) regression between both variables.
Figure 2.
Variation of pressure differences between manhole invert and ambient atmosphere and air velocity at the venting stack: (a) over time during two consecutive days, and (b) ordinary least squares (OLS) regression between both variables.

Figure 3.
Plot of measured and modelled v_exit at the R das Flores venting stack for three monitoring periods (17.05.2018 and 22.05.2018).
Figure 3.
Plot of measured and modelled v_exit at the R das Flores venting stack for three monitoring periods (17.05.2018 and 22.05.2018).

Figure 4.
Variation of pressure differences between manhole invert and ambient atmosphere, air velocity and wastewater depth at pipe invert at C-2, during 07.06.2018 (M2 setup).
Figure 4.
Variation of pressure differences between manhole invert and ambient atmosphere, air velocity and wastewater depth at pipe invert at C-2, during 07.06.2018 (M2 setup).

Figure 5.
Variation of headspace parameters over time at the three monitored locations of the R. das Flores gravity sewer, during 17 May 2018. For each chart, lighter tone lines indicate all measured data and the darker overlying lines refer to a 10 min moving average. Red dashed lines indicate the opening of 1 MH cover (at C-2).

Figure 6.
Comparison of pressure differences between manholes and outside atmosphere with closed and open covers: (a) C-2 and C-3 and (b) C-2 and C-5, at R. das Flores trunk sewer for a 2 h period.
Figure 6.
Comparison of pressure differences between manholes and outside atmosphere with closed and open covers: (a) C-2 and C-3 and (b) C-2 and C-5, at R. das Flores trunk sewer for a 2 h period.

Figure 7.
Concentration of H2S over time: (a) at baseline (16 May 2018), (b) with 1 open MH cover (17 May 2018) and (c) 2 open MH covers (8 June 2018).
Figure 7.
Concentration of H2S over time: (a) at baseline (16 May 2018), (b) with 1 open MH cover (17 May 2018) and (c) 2 open MH covers (8 June 2018).

© 2019 by the authors. Licensee MDPI, Basel, Switzerland. This article is an open access article distributed under the terms and conditions of the Creative Commons Attribution (CC BY) license (http://creativecommons.org/licenses/by/4.0/).
Share and Cite
MDPI and ACS Style
Ventura Matos, R.; Ferreira, F.; Saldanha Matos, J. Influence of Intermittence and Pressure Differentials in Hydrogen Sulfide Concentration in a Gravity Sewer. Water 2019, 11, 1780. https://doi.org/10.3390/w11091780
AMA Style
Ventura Matos R, Ferreira F, Saldanha Matos J. Influence of Intermittence and Pressure Differentials in Hydrogen Sulfide Concentration in a Gravity Sewer. Water. 2019; 11(9):1780. https://doi.org/10.3390/w11091780
Chicago/Turabian StyleVentura Matos, Rita, Filipa Ferreira, and José Saldanha Matos. 2019. "Influence of Intermittence and Pressure Differentials in Hydrogen Sulfide Concentration in a Gravity Sewer" Water 11, no. 9: 1780. https://doi.org/10.3390/w11091780
Note that from the first issue of 2016, this journal uses article numbers instead of page numbers. See further details here.