Geochemical and Isotopic Compositions and Geothermometry of Thermal Waters in the Magumsan Area, South Korea

Abstract
:1. Introduction
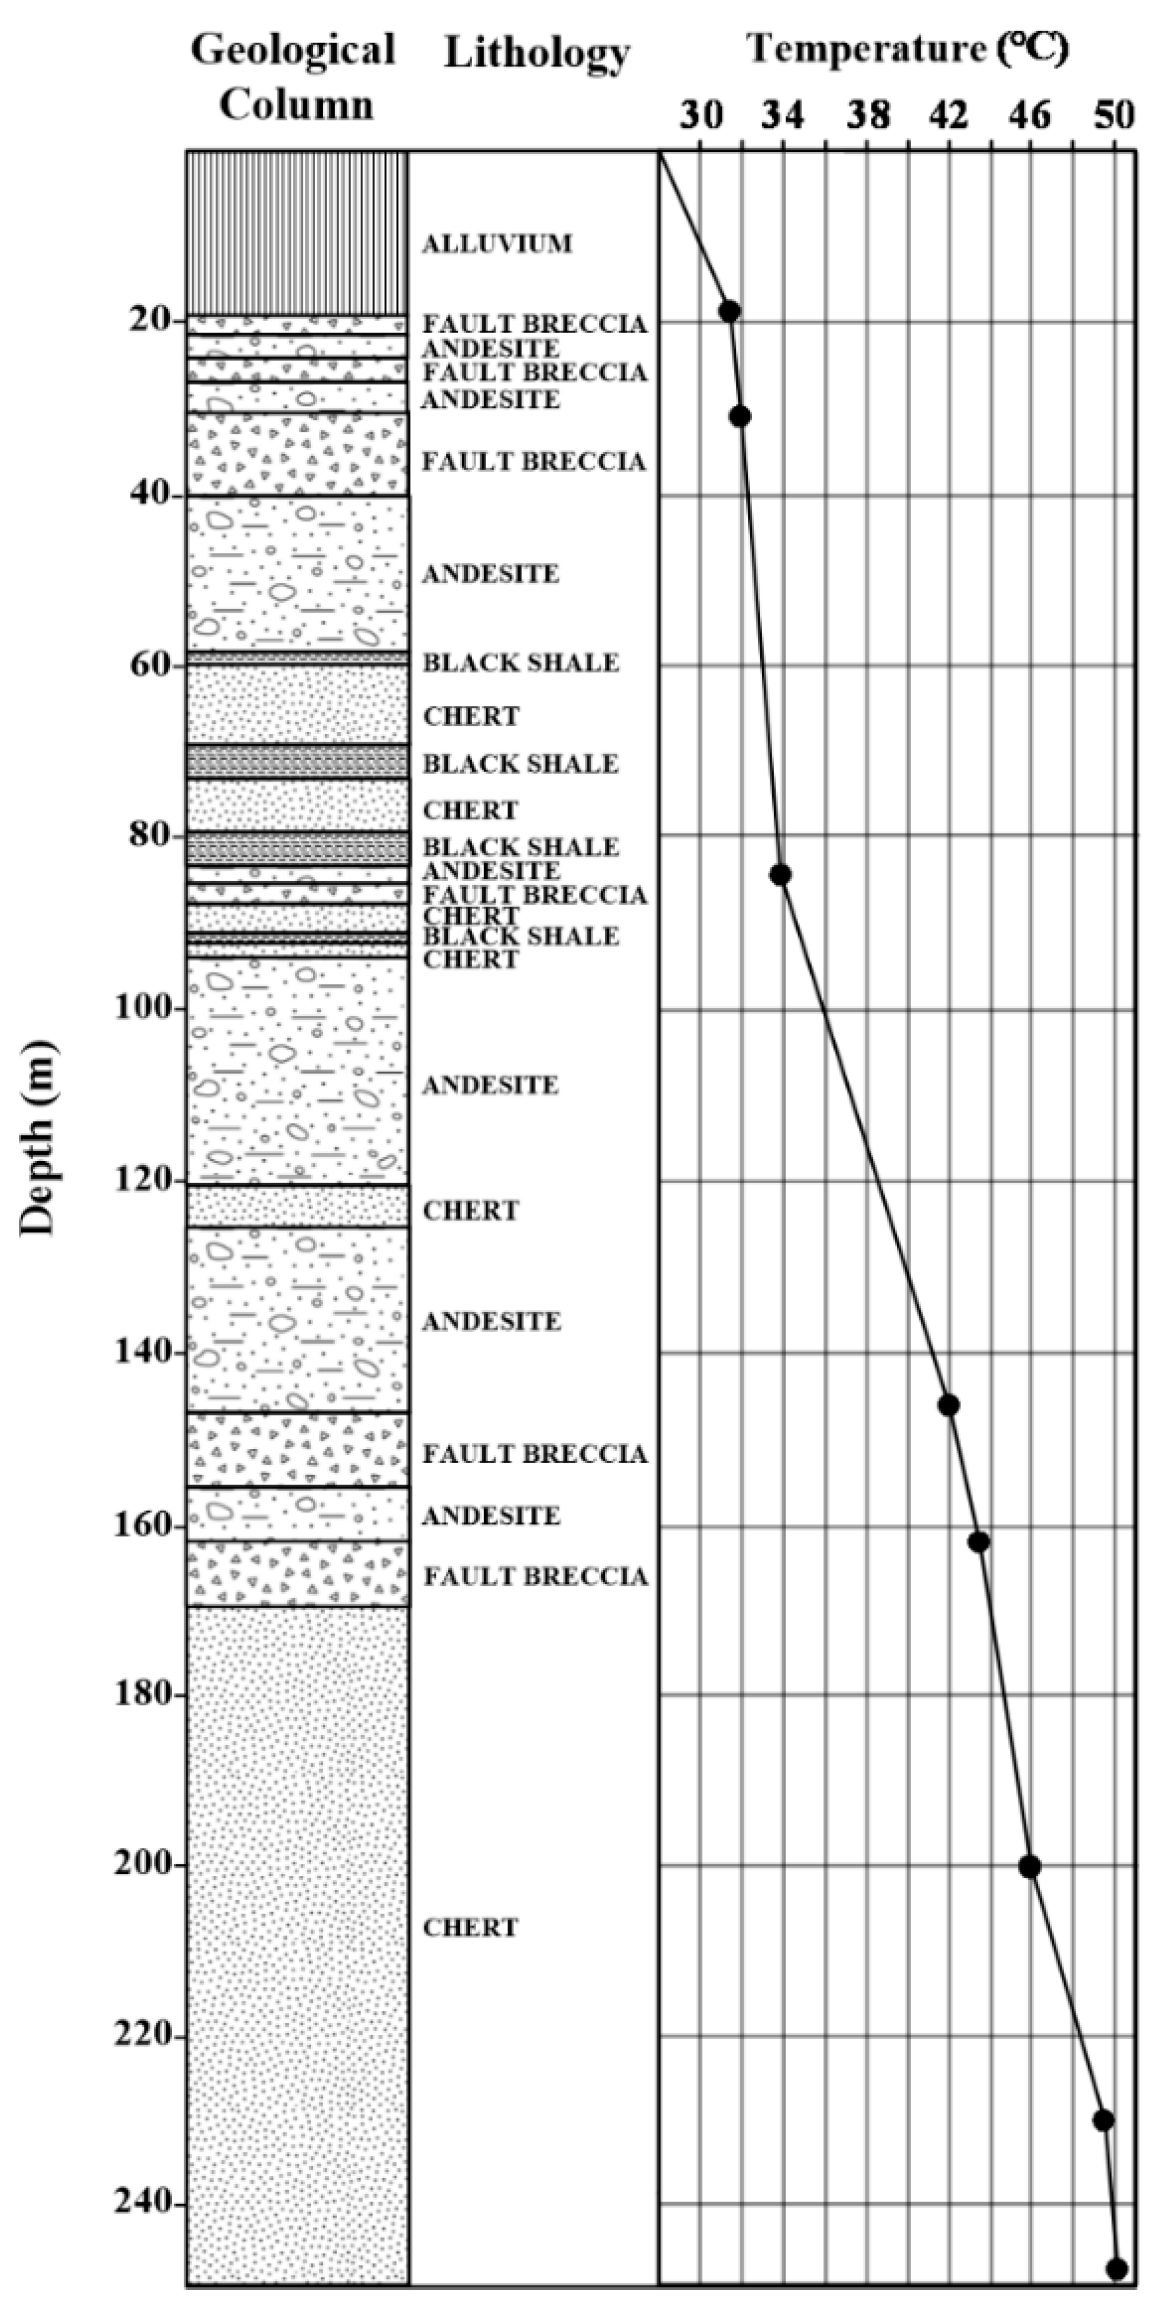
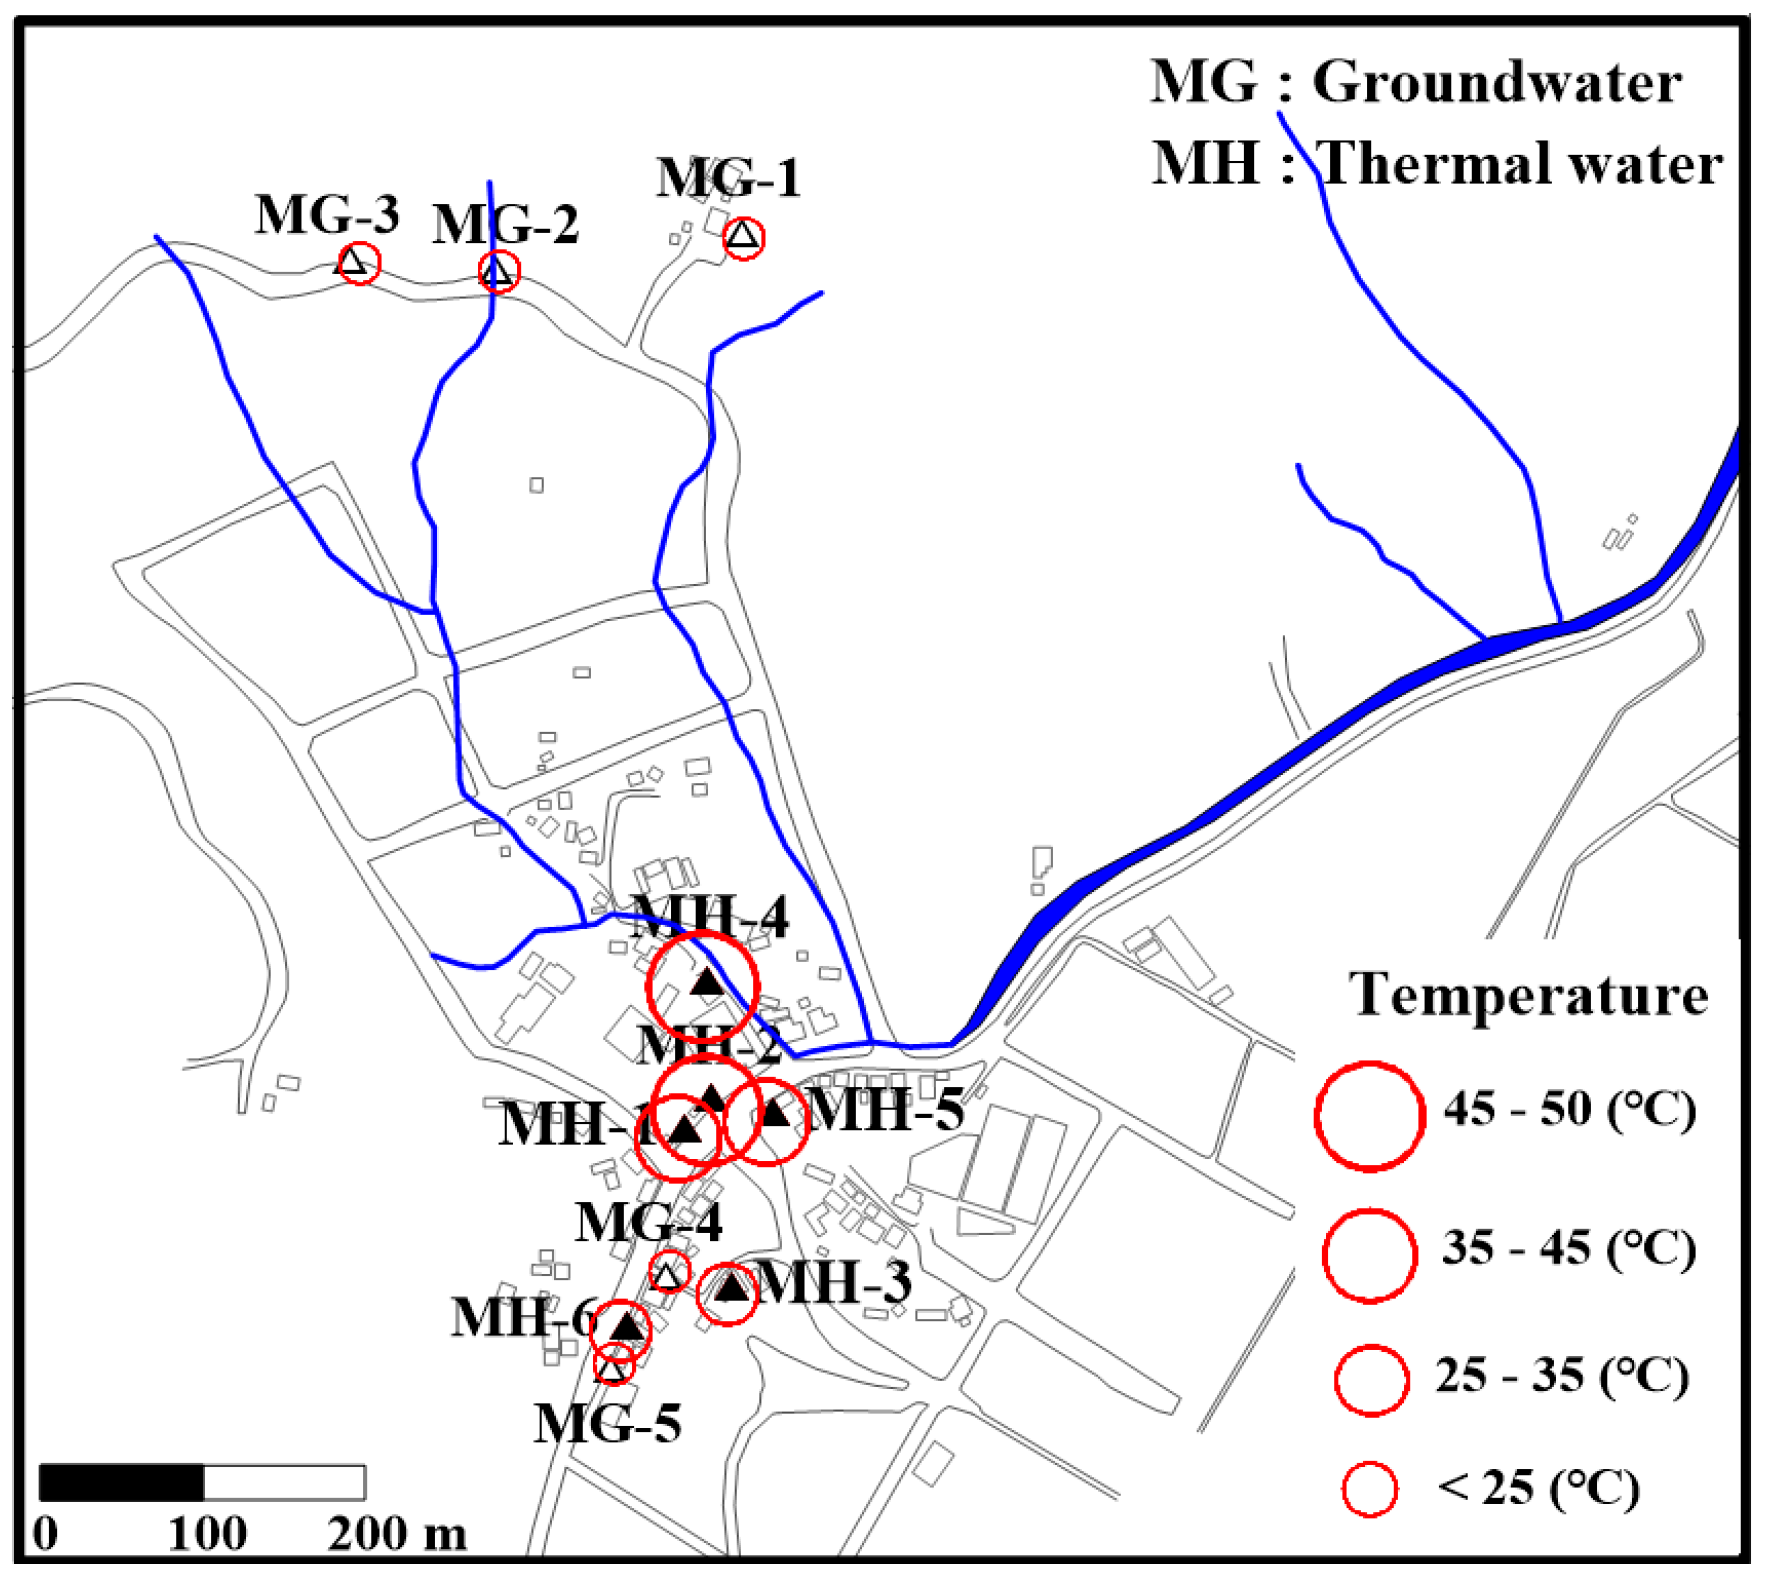
2. Study Area
3. Analytical Methods
3.1. Sample Collection and in Situ Measurements
3.2. Chemical and Stable-Isotope Analyses
3.3. Noble-Gas Analysis
4. Results and Discussion
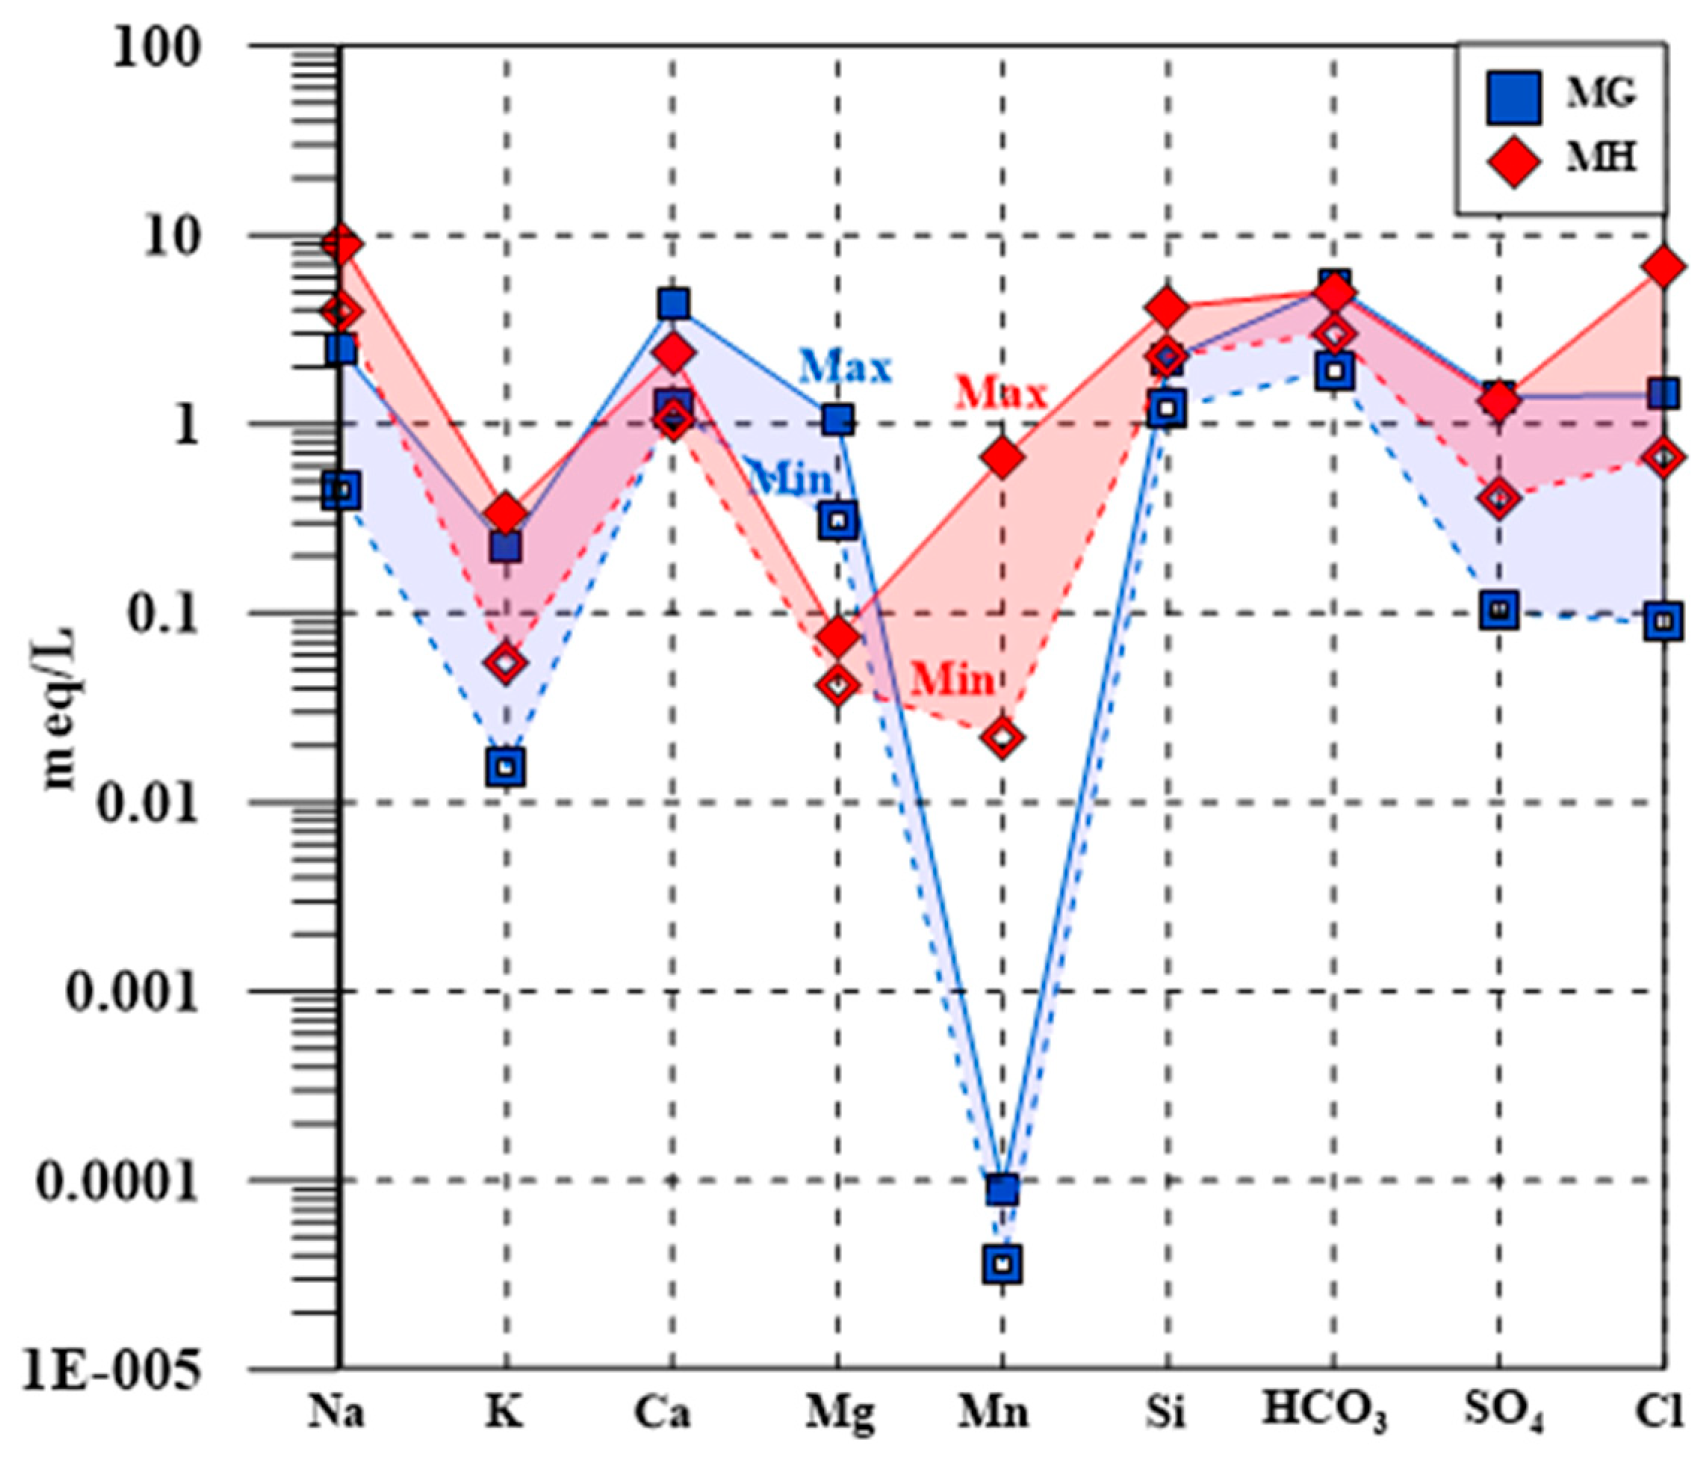
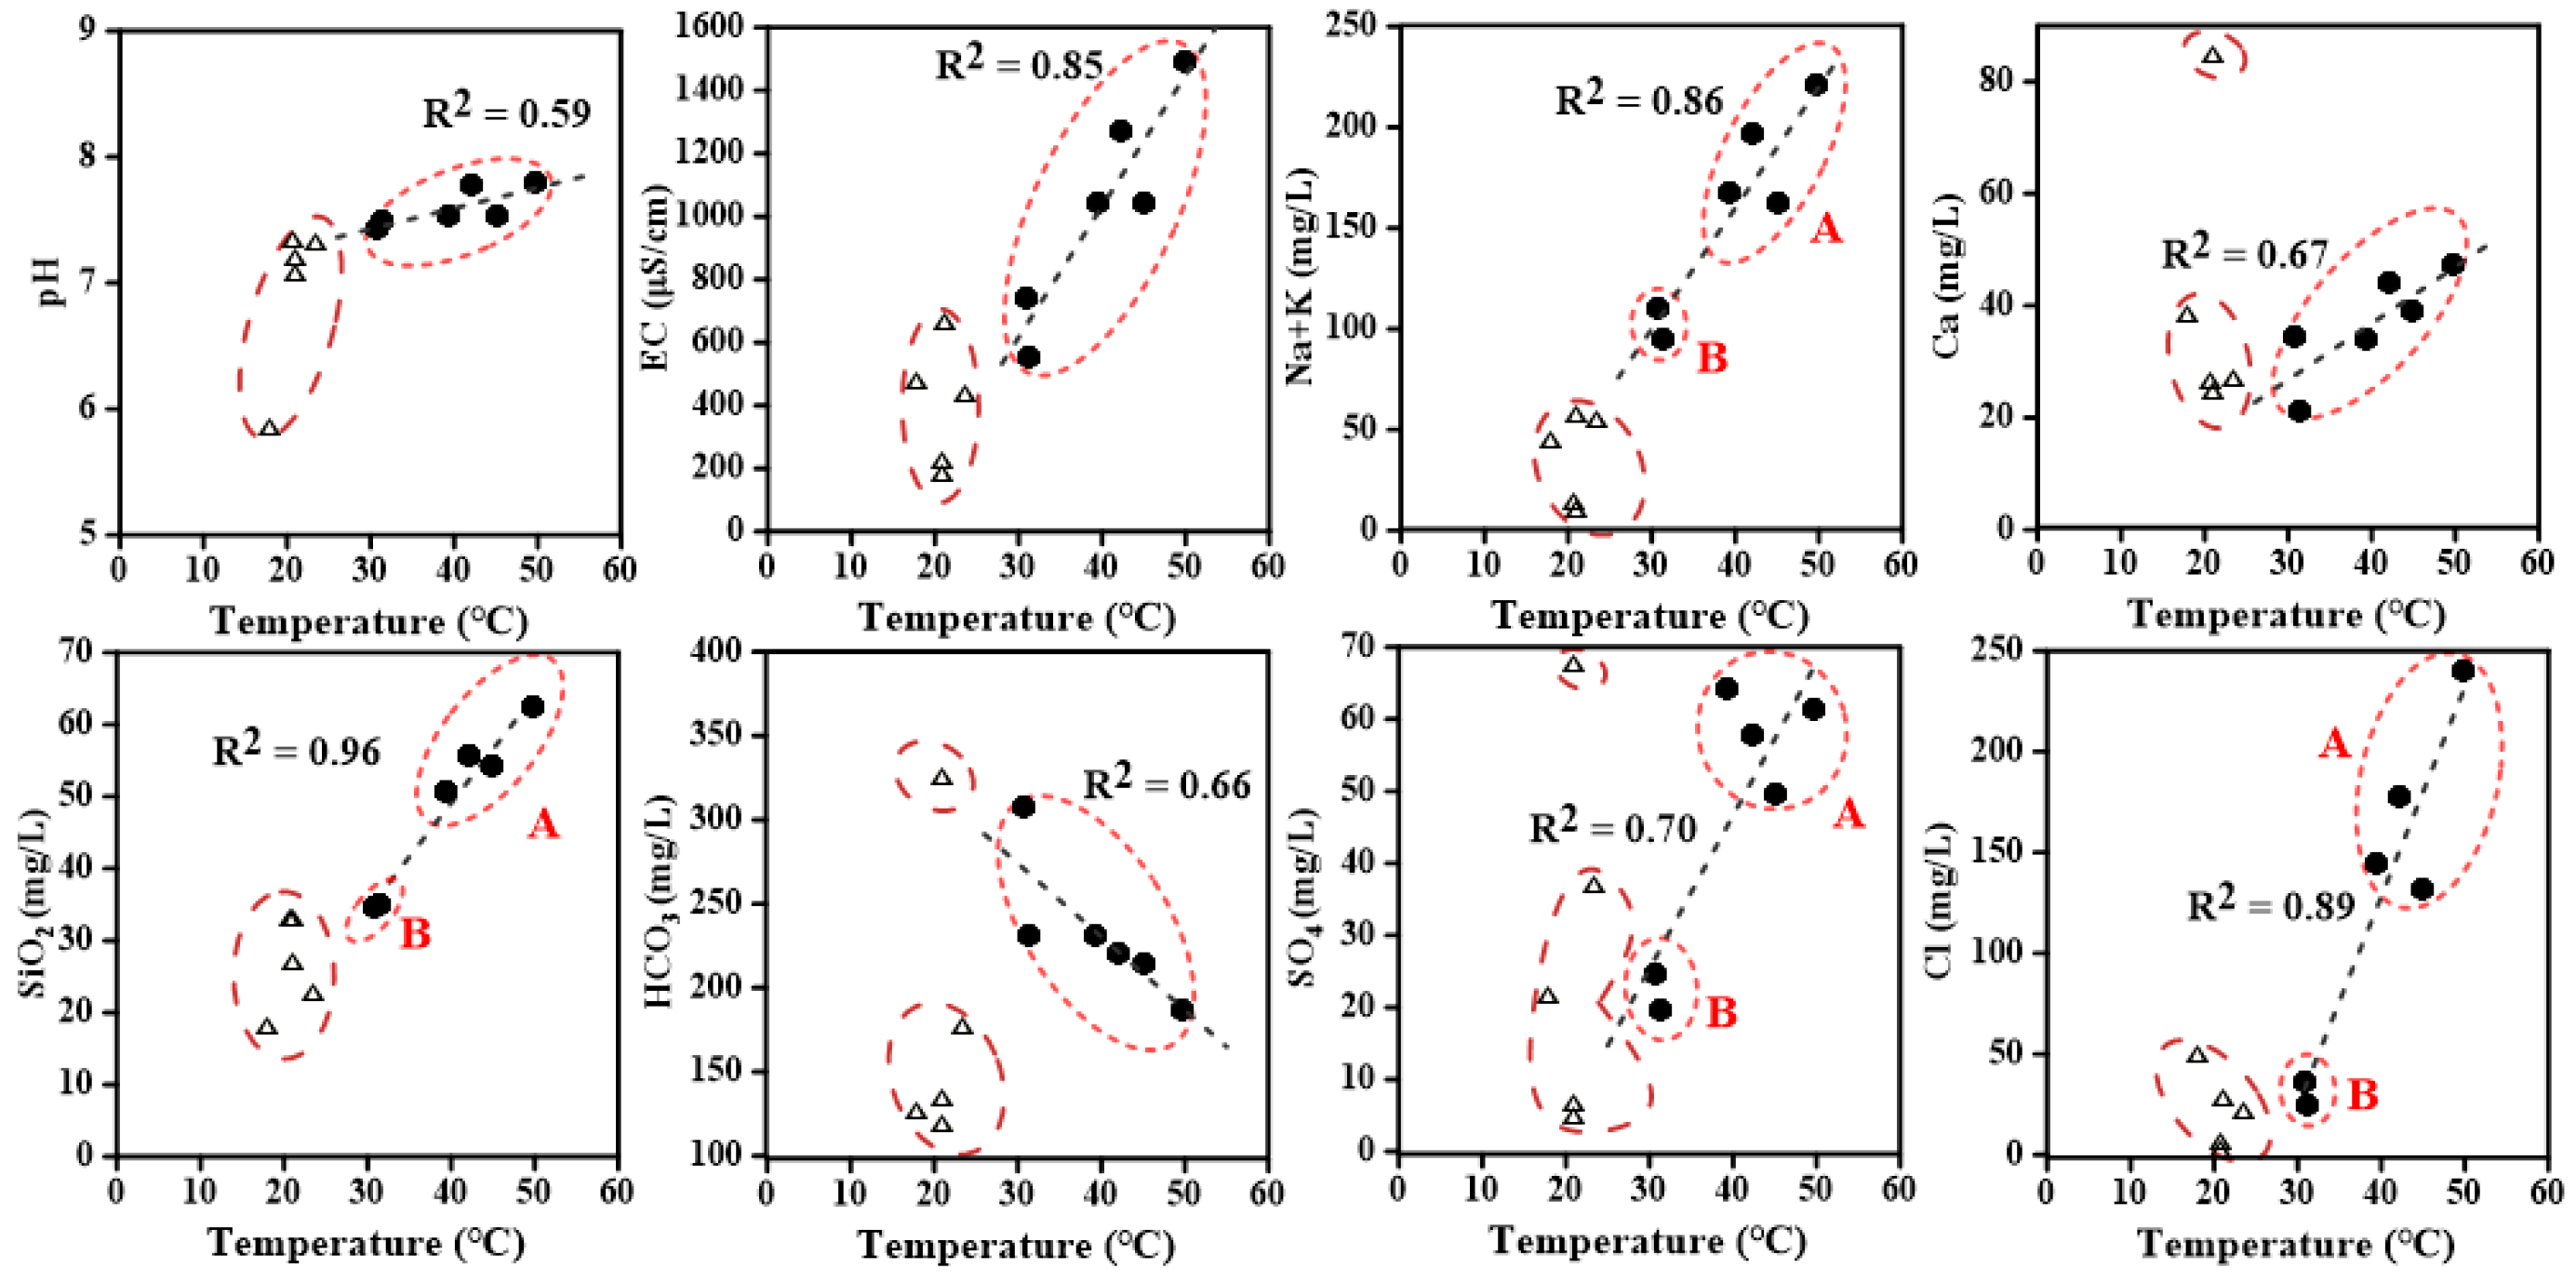
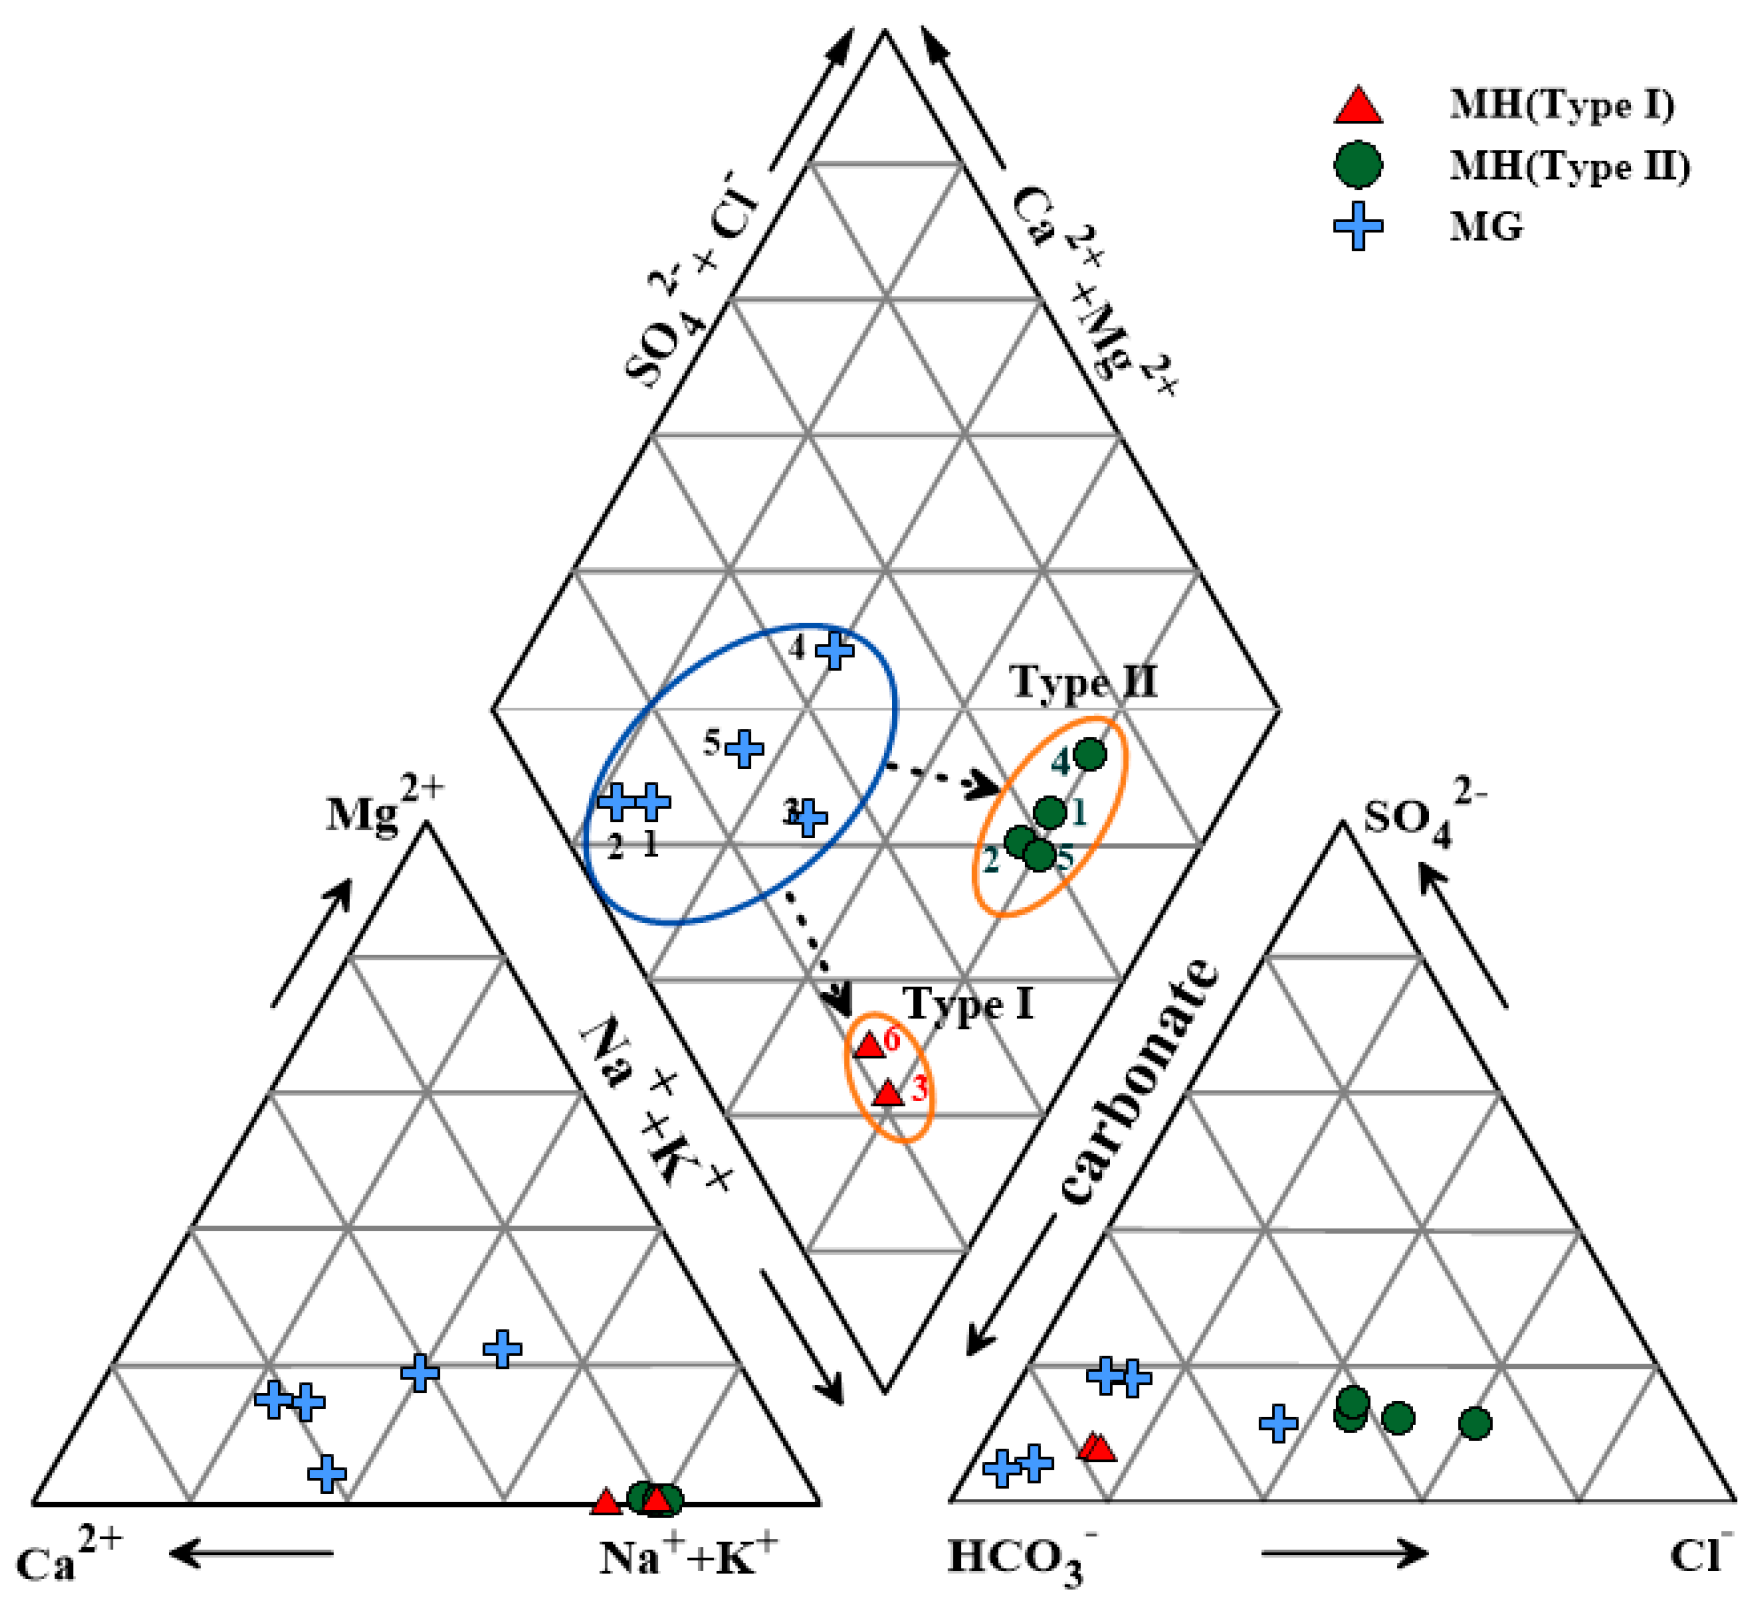
4.1. Geochemical Compositions
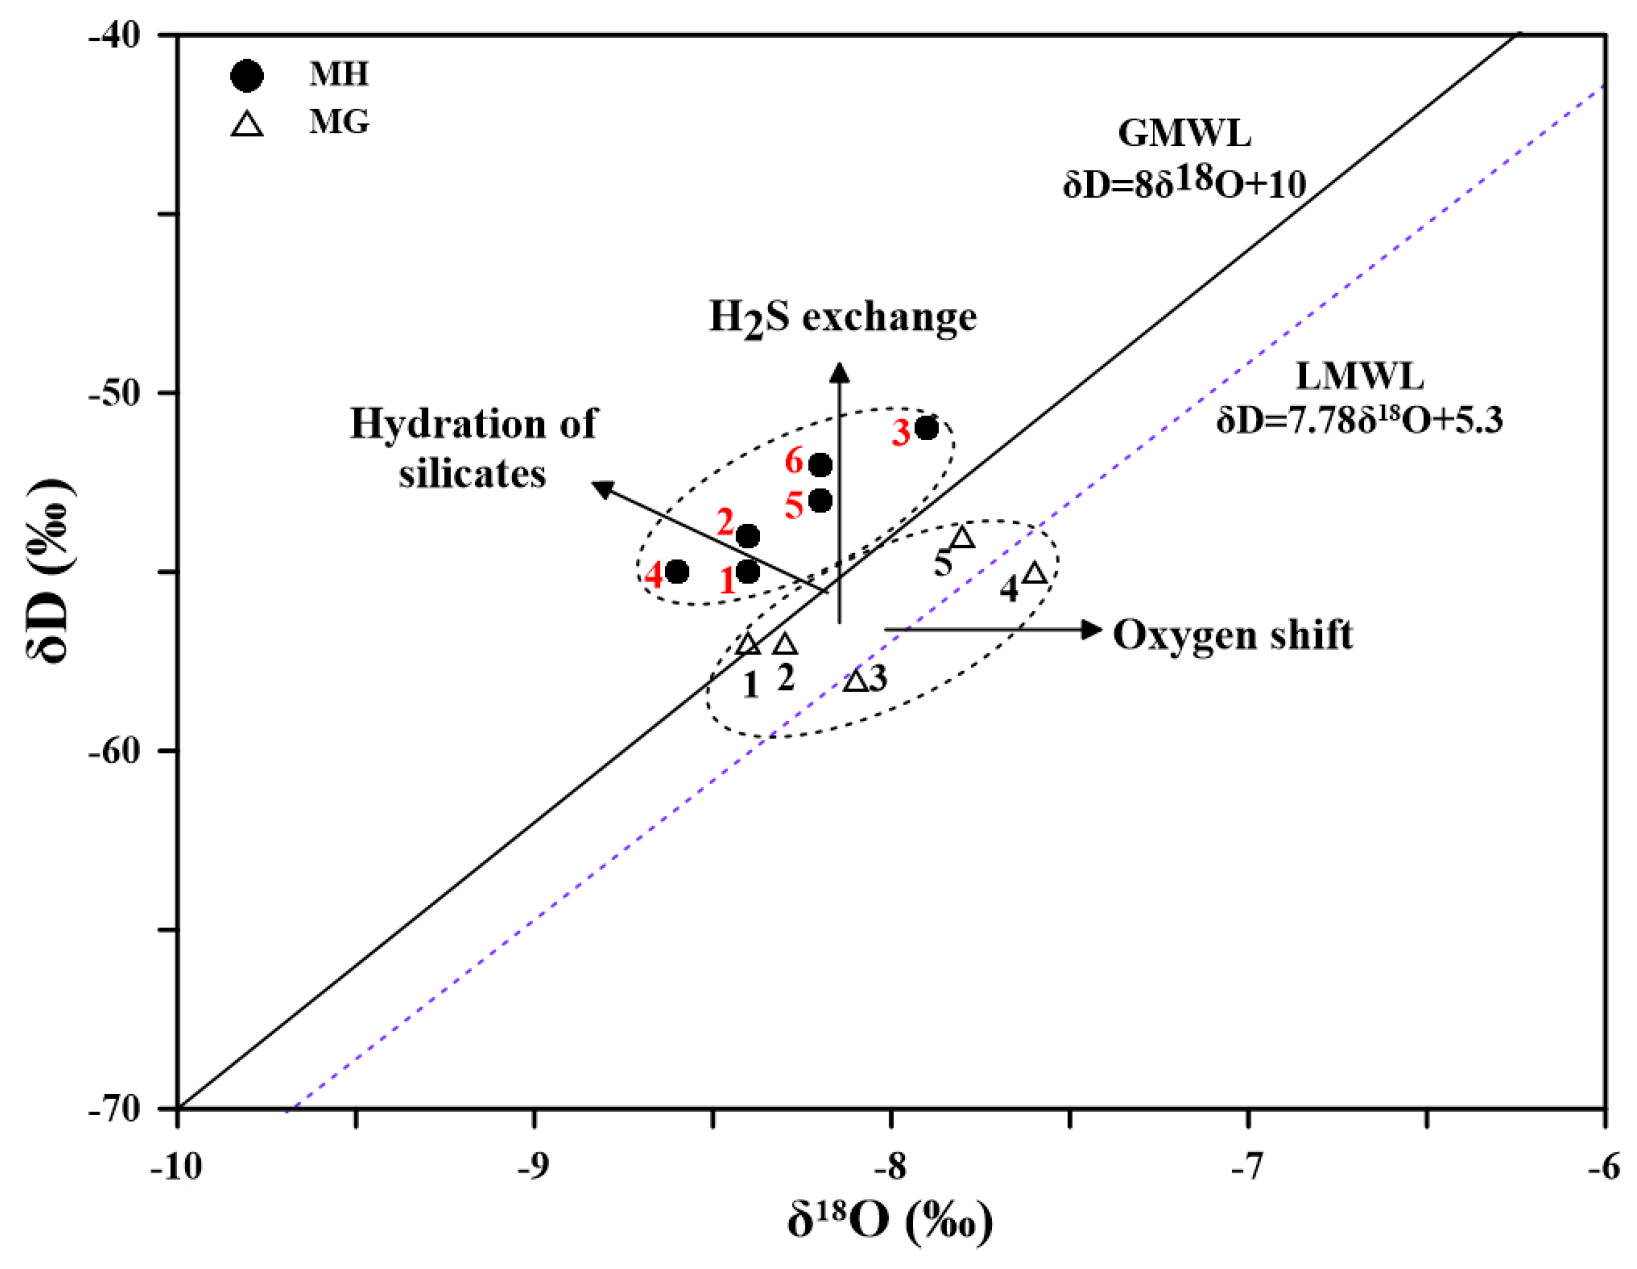
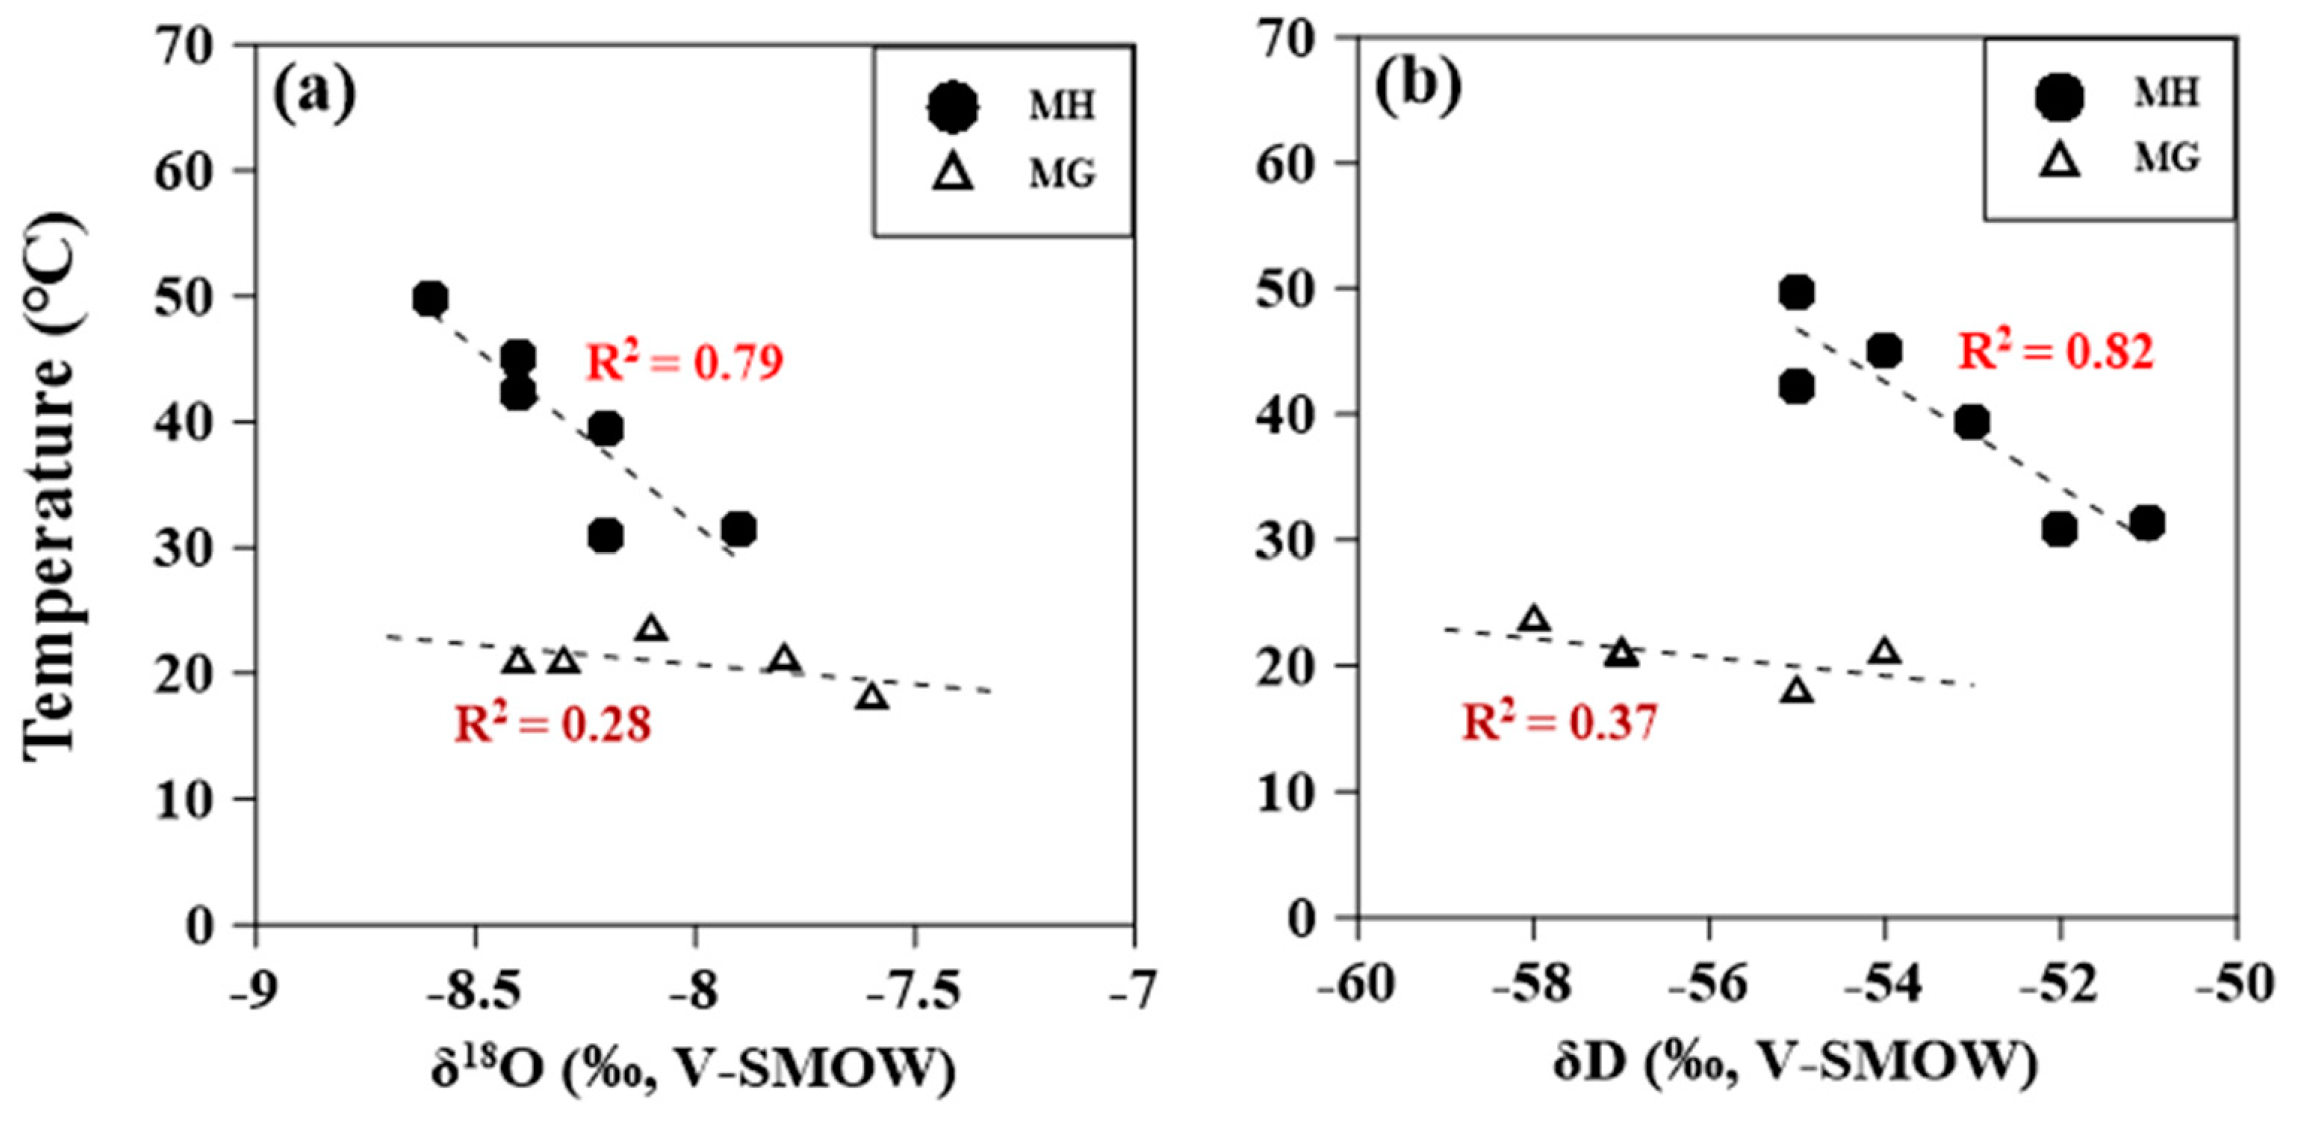
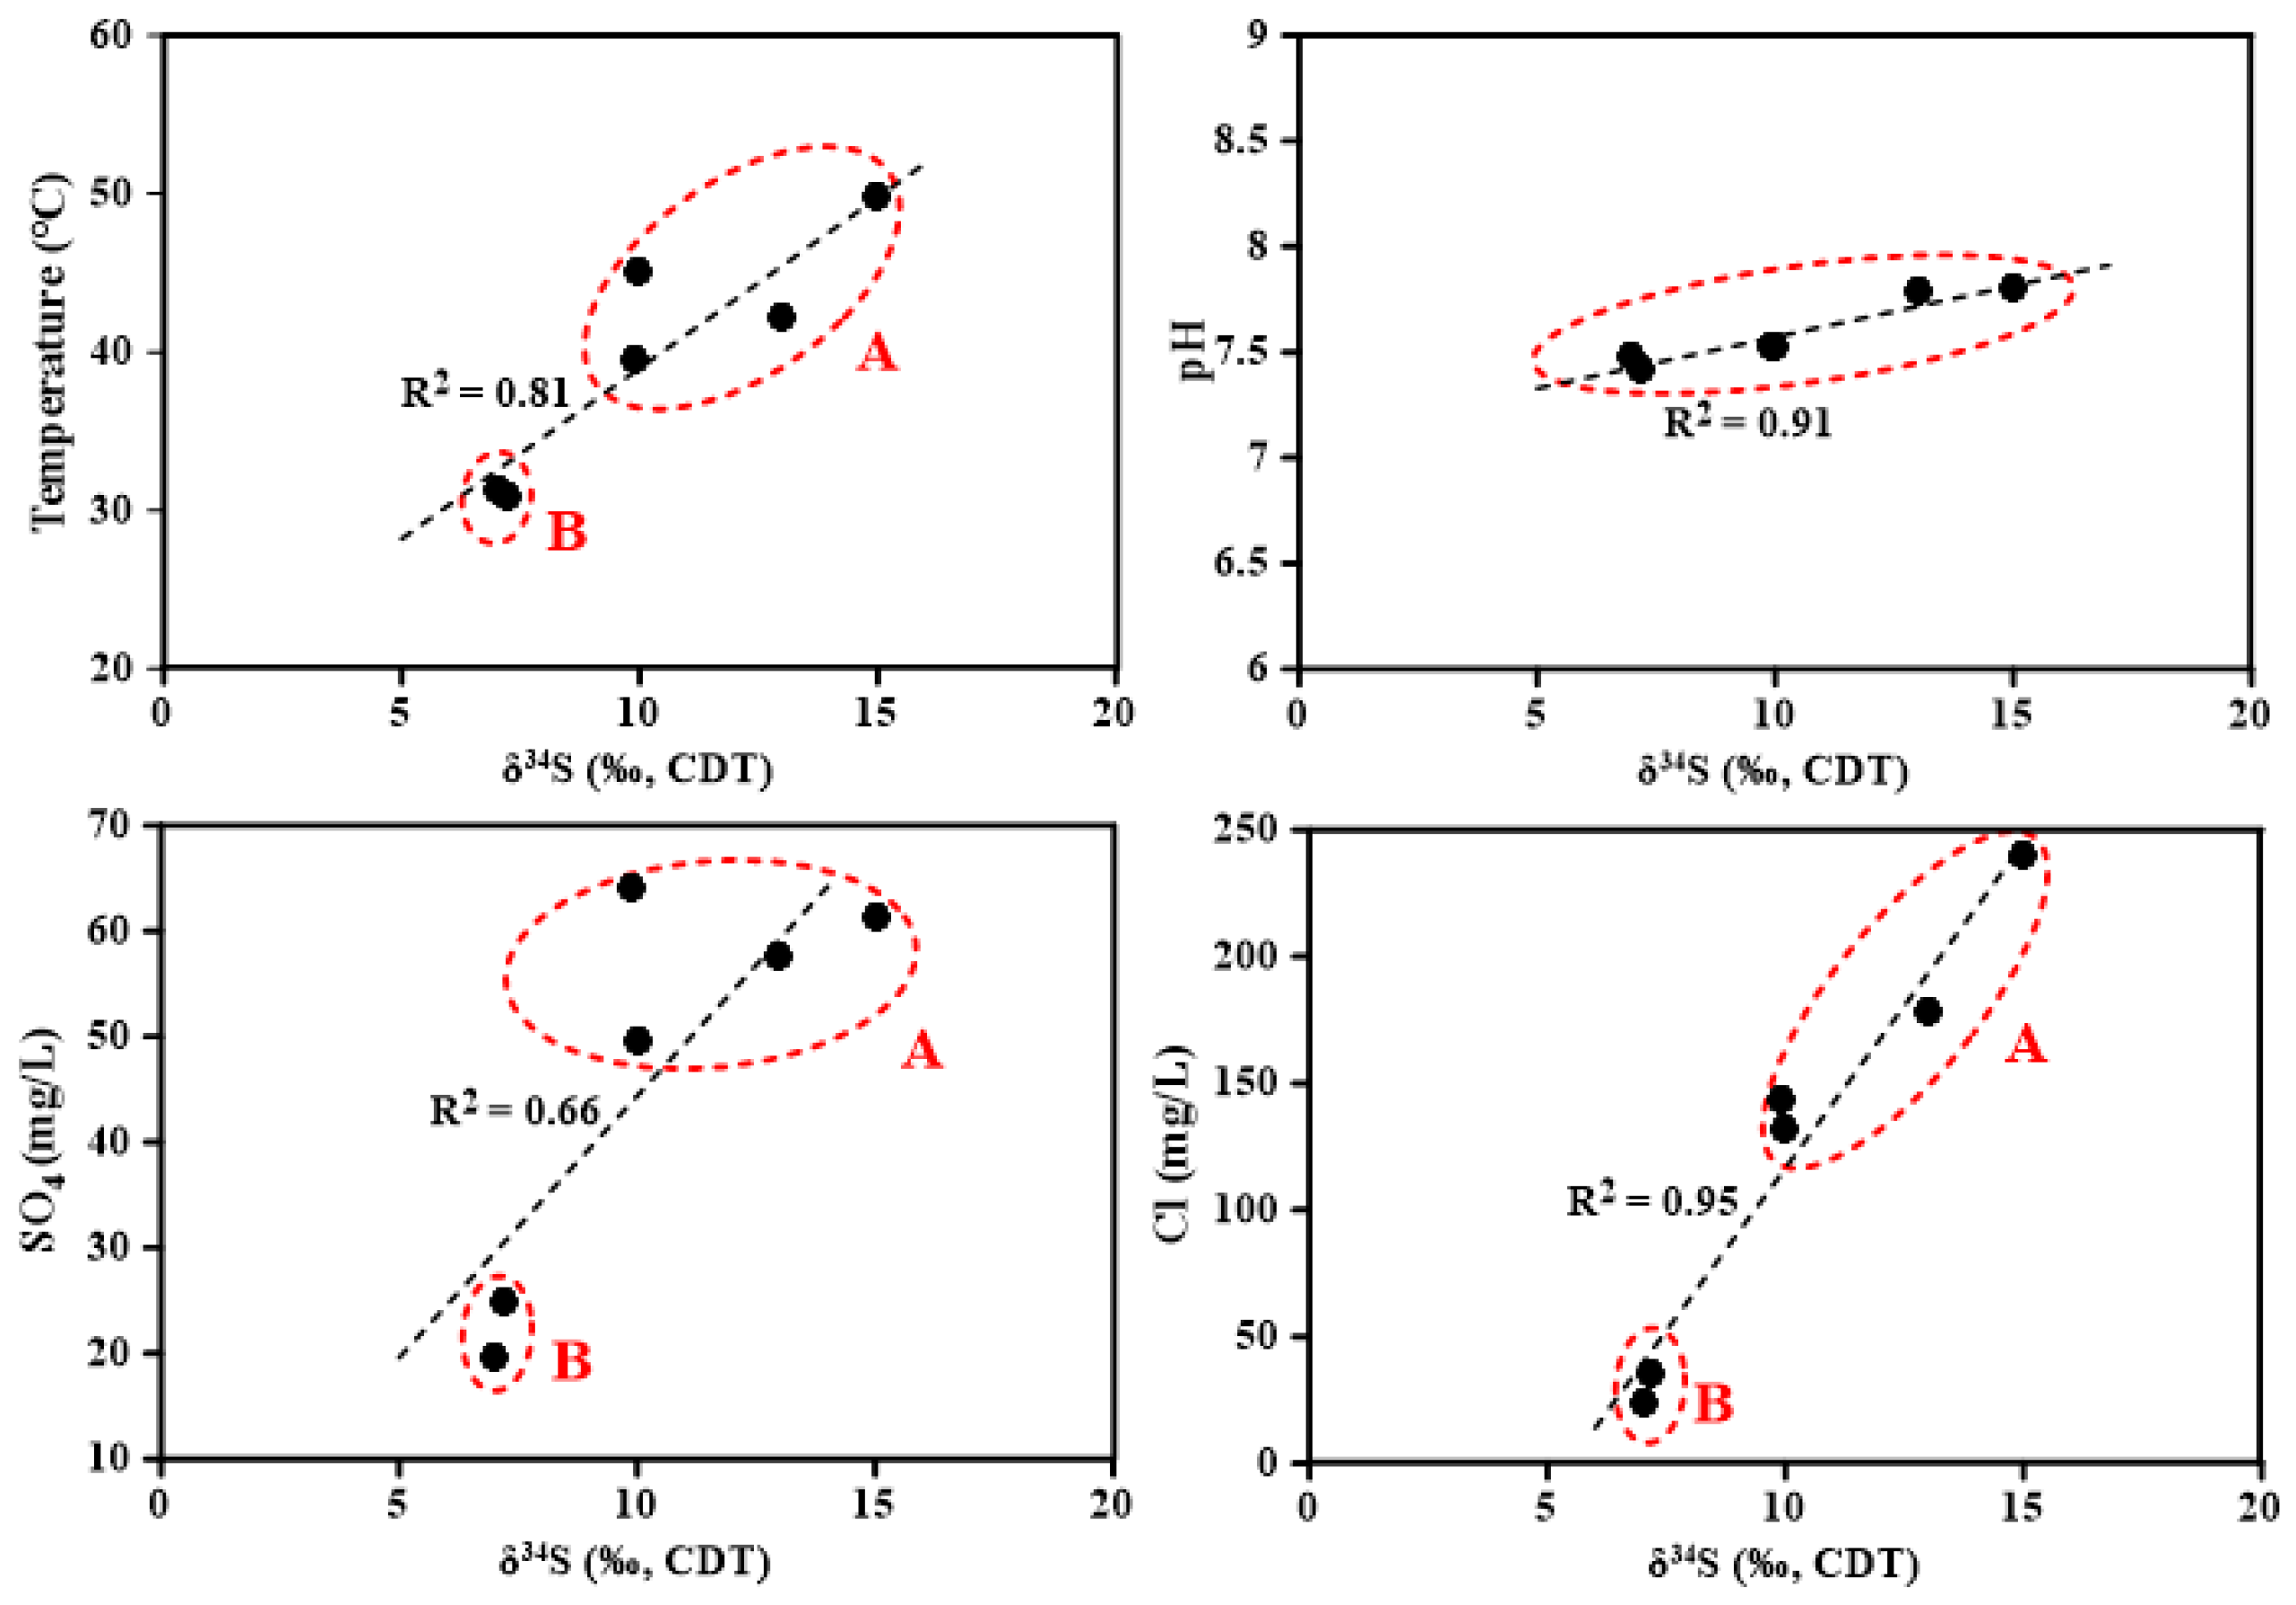
4.2. O, H, and S Isotopic Compositions
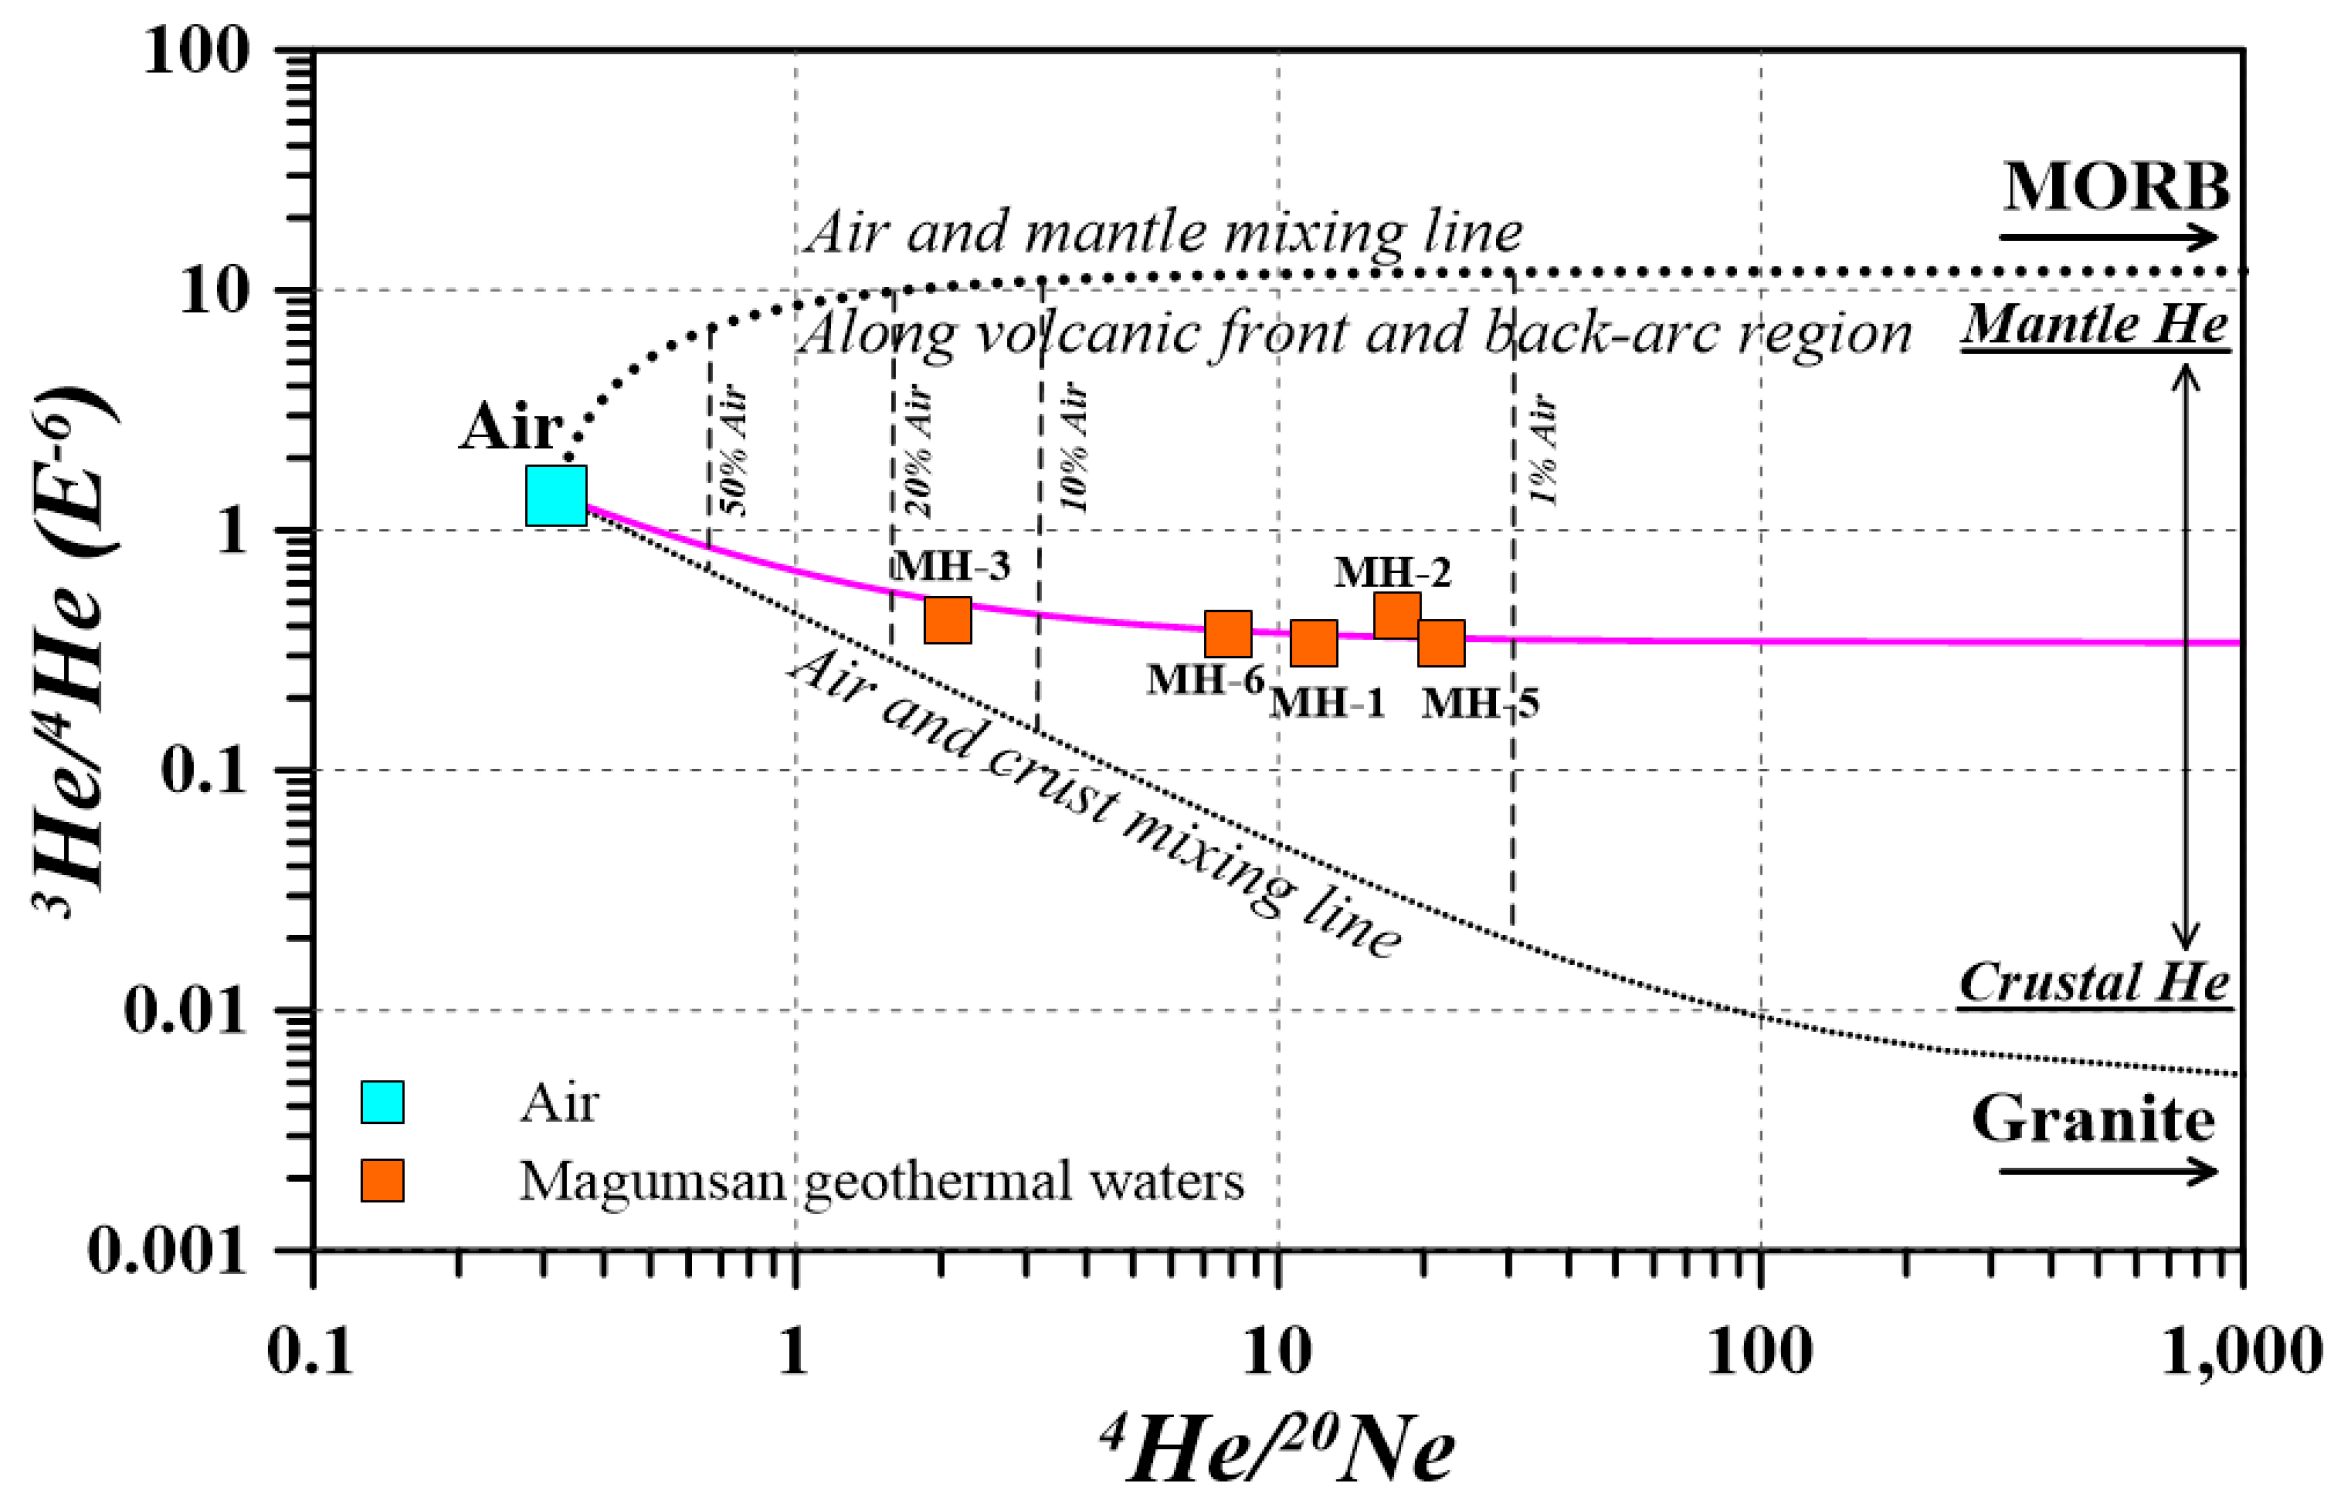
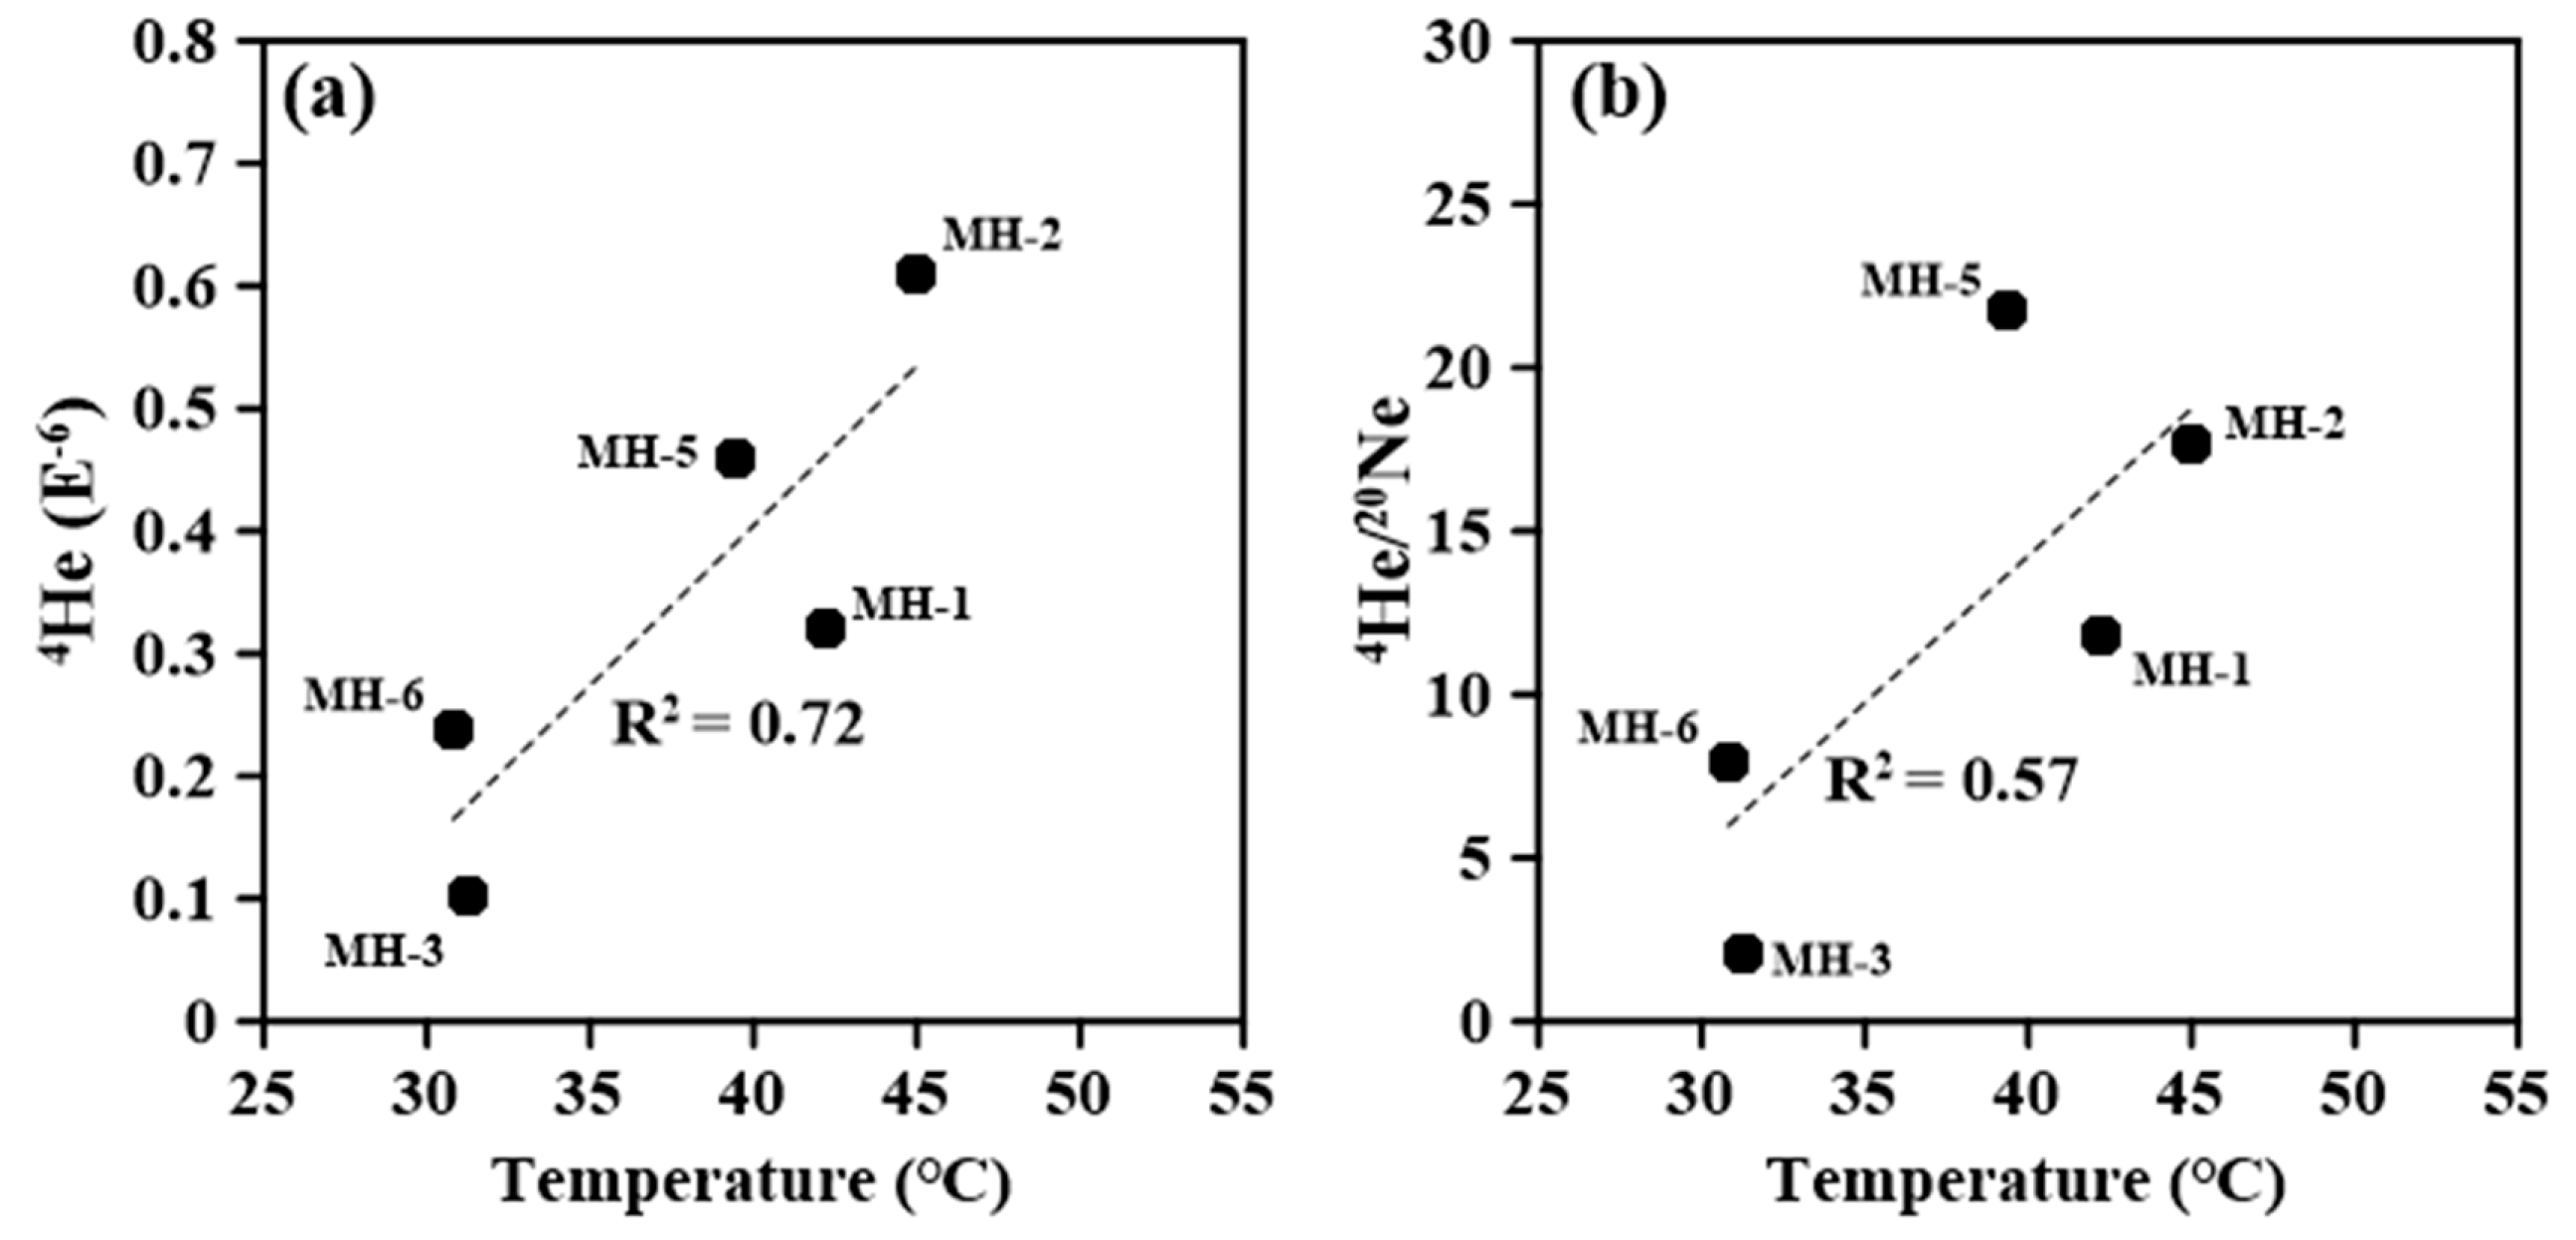
4.3. Helium Analysis
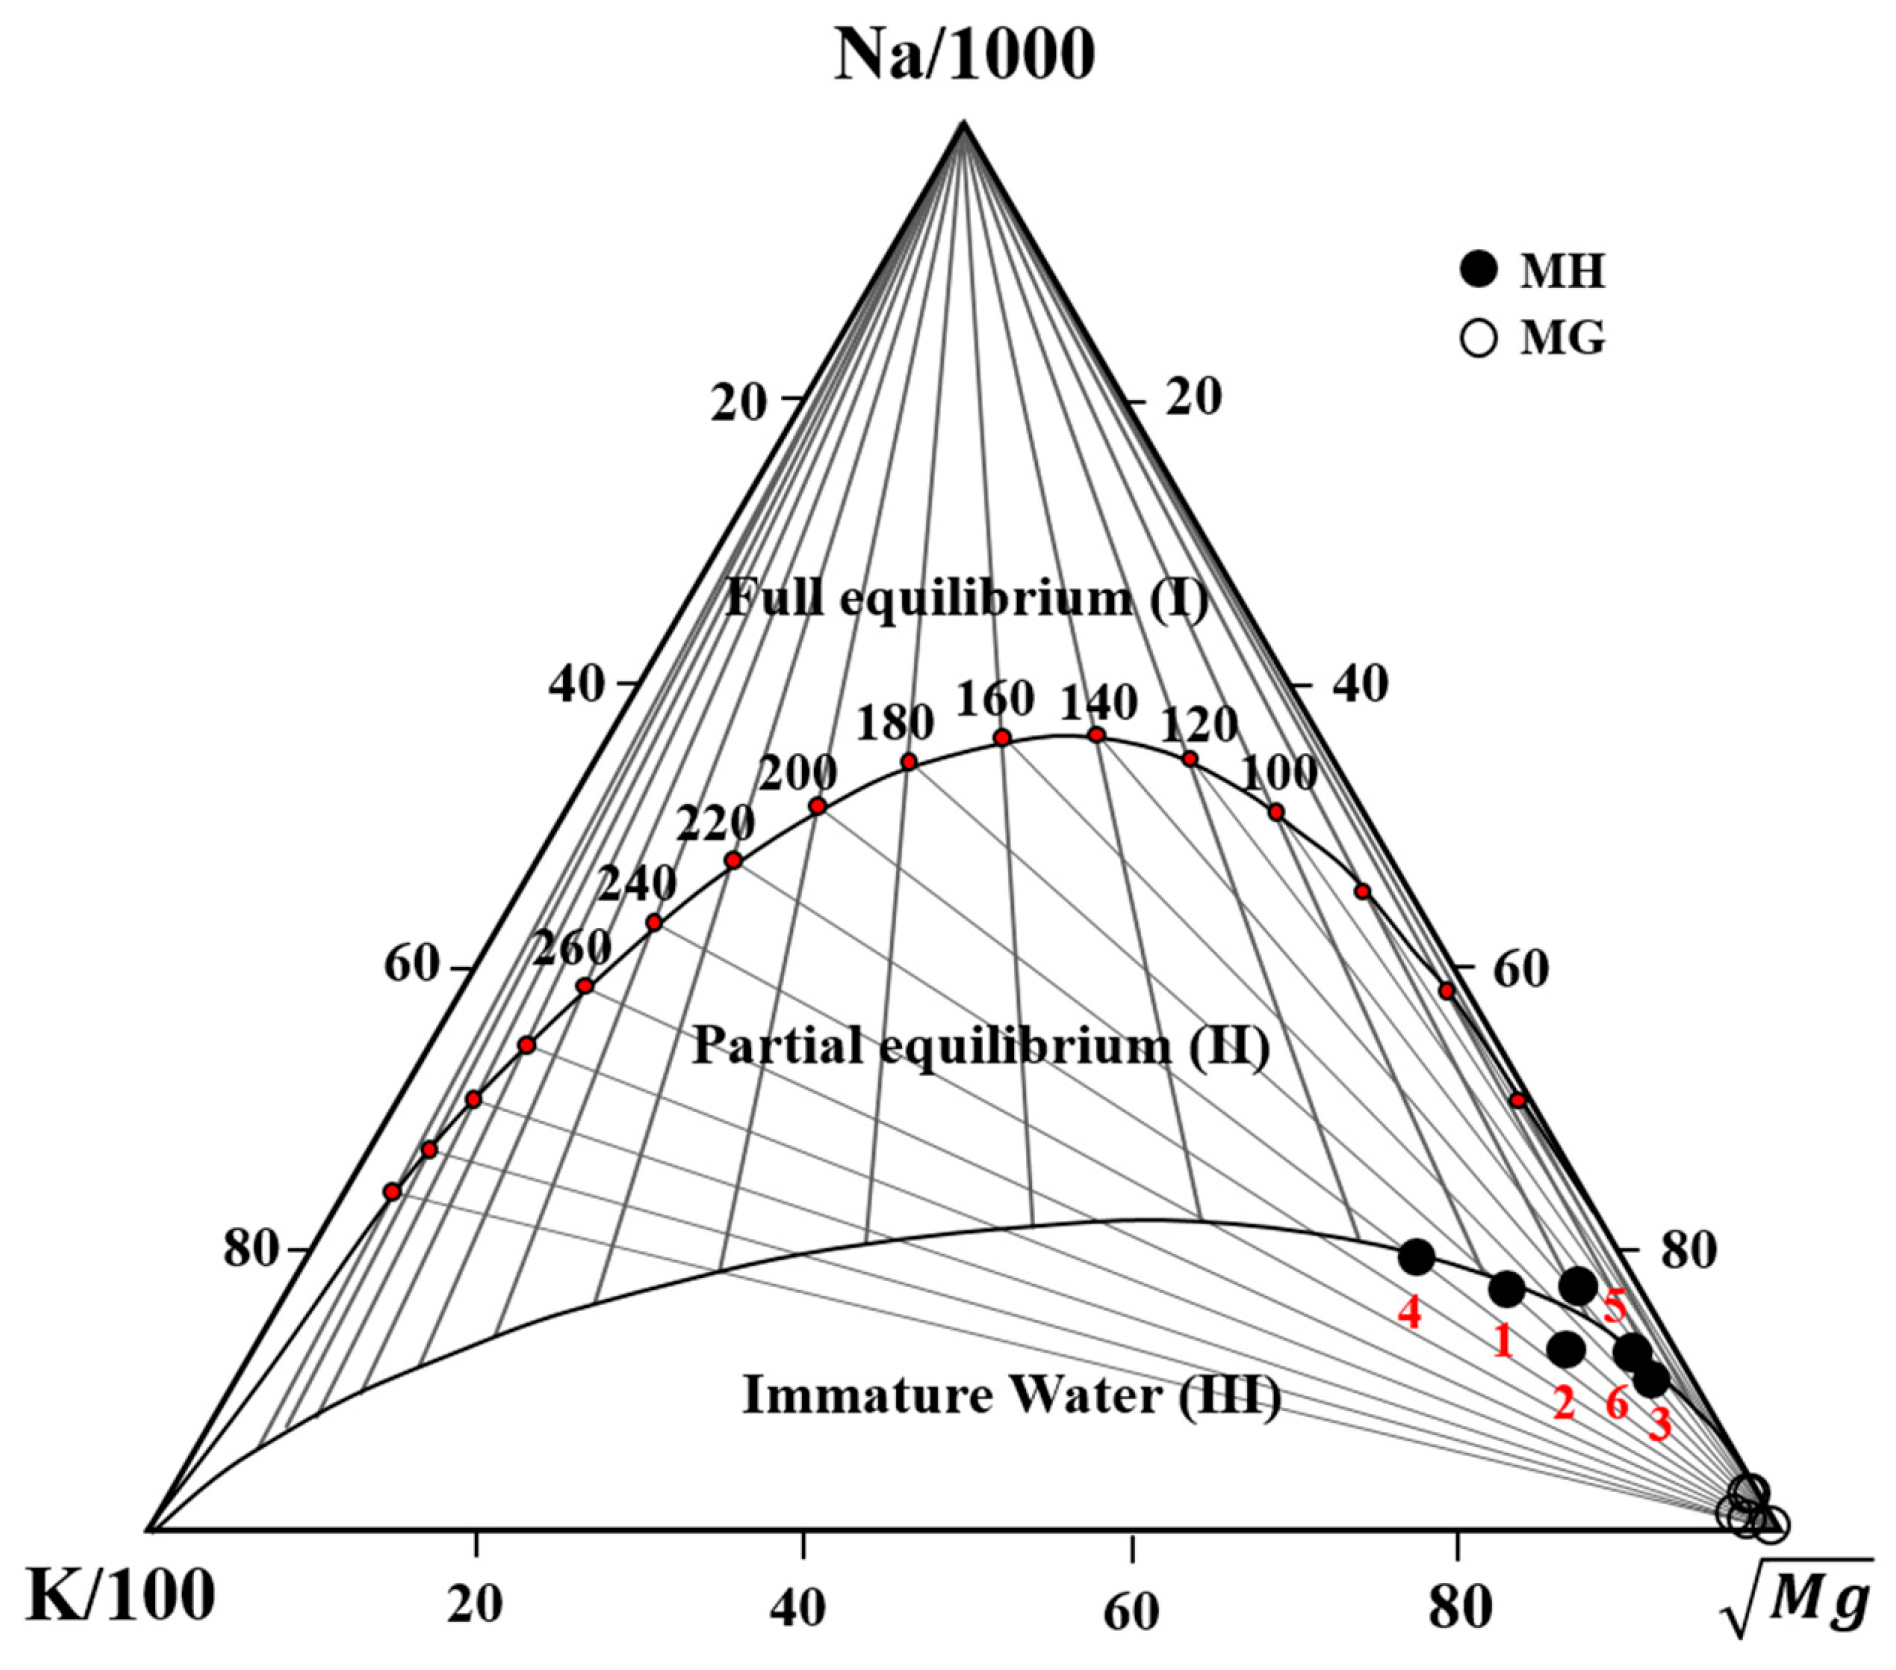
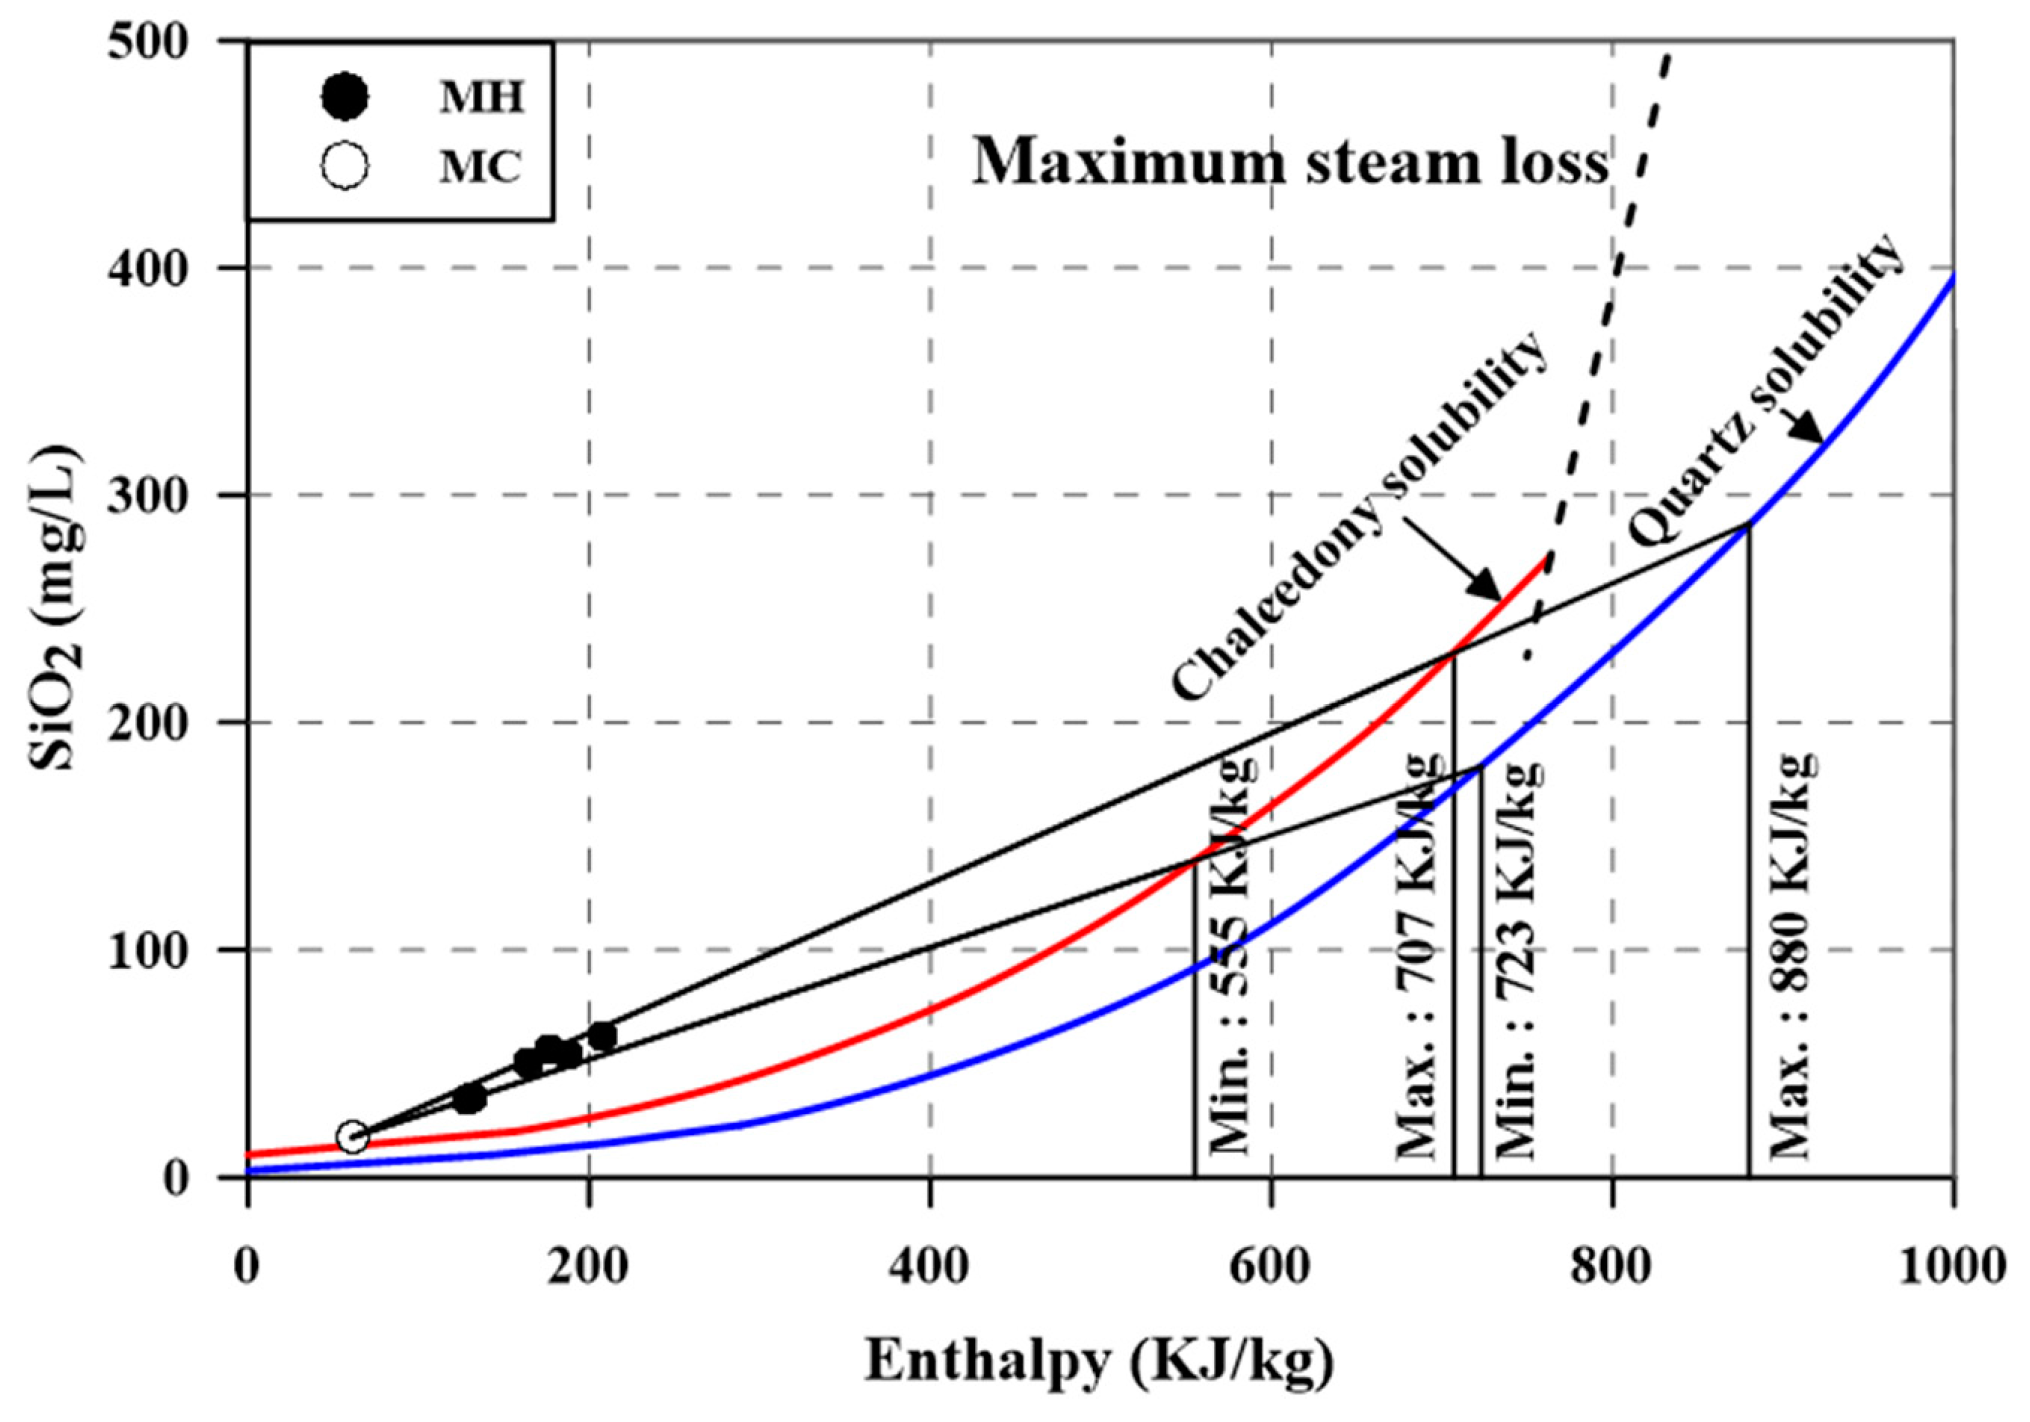
4.4. Geothermometry and a Mixing Model for the Thermal Reservoir
5. Conclusions
Author Contributions
Funding
Conflicts of Interest
References
- Choi, C.I.; Kim, H.C. Geological Survey of Korea Bulletin No. 11: The Hot Spring of Makeumsan Area; Korea Institute of Geoscience and Mineral Resources: Daejeon, Korea, 1969; pp. 207–226. [Google Scholar]
- Kim, K.H.; Nakai, N. A study on hydrogen, oxygen and sulfur isotopic ratios of the hot spring waters in South Korea. Geochemistry 1981, 15, 6–16. [Google Scholar]
- Park, S.S. Hydrogeochemical Studies on the Origin and Geochemical Environments of Thermal Groundwaters in Bugok and Magumsan Areas, Southern Korea. Ph.D. Thesis, Korea University, Seoul, Korea, 2005. [Google Scholar]
- Karakuş, H. Helium and carbon isotope composition of gas discharges in the Simav Geothermal Field, Turkey: Implications for the heat source. Geochemistry 2013, 57, 213–223. [Google Scholar] [CrossRef]
- Wang, X.; Zhao, L.; Liu, X.; Lili, A.; Zhang, Y. Temperature effect on the transport of nitrate and ammonium ions on a loose-pore geothermal reservoir. J. Geochem. Exp. 2013, 124, 59–66. [Google Scholar] [CrossRef]
- Jeong, C.H.; Hur, H.S.; Nagao, K.; Kim, K.H. Hydrochemical and isotopic characteristics, and origin of noble gas for low-temperature hot spring waters in the Honam area. Econ. Environ. Geol. 2007, 40, 635–649. [Google Scholar]
- Jeong, C.H.; Nagao, K.; Kim, K.H.; Choi, H.K.; Sumino, H.; Park, J.S.; Park, C.H.; Lee, J.I.; Hur, S.D. Hydrochemistry and noble gas origin of various hot spring waters from the eastern area in South Korea. J. Soil Groundw. Environ. 2008, 13, 1–12. [Google Scholar]
- Jeong, C.H.; Koh, Y.K.; Shin, S.H.; Nagao, K.; Kim, K.H.; Kim, G.Y. Hydrochemistry and noble gas origin of hot spring waters of Icheon and Pocheon area in Korea. J. Eng. Geol. 2009, 19, 529–541. [Google Scholar]
- Park, J.; Jeong, C.H.; Nagao, K.; Yang, J.H.; Sumino, H.; Kim, K.H.; Kim, M.S.; Lee, J.I.; Park, C.H.; Koh, Y.K.; et al. Hydrochemistry and noble gas geochemistry of geothermal waters in Chungcheong Province, South Korea. Geochem. J. 2016, 50, 89–103. [Google Scholar] [CrossRef]
- Shestakova, A.; Gusva, N.; Kopylova, Y.; Khvaschevskaya, A.; Polya, D.A.; Tokarev, I. Geothermometry and isotope geochemistry of CO2-rich thermal waters in Choygan, East Tuva, Russia. Water 2018, 10, 729. [Google Scholar] [CrossRef]
- Giggenbach, W.F.; Werner, F. Geothermal solute equilibria. Deviation of Na-K-Mg-Ca geoindicators. Geochim. Cosmochim. 1988, 52, 2749–2765. [Google Scholar] [CrossRef]
- Ozler, H. Hydrogeology and geochemistry in the Curuksu (Denizli) hydrothermal field, western Turkey. Environ. Geol. 2000, 39, 1169–1180. [Google Scholar]
- Yuce, G.; Taşkıran, L. Isotope and chemical composition of thermal fluids at Tekman geothermal area (Eastern Turkey). Geochem. J. 2013, 47, 423–435. [Google Scholar] [CrossRef]
- Chough, S.K.; Kwon, S.T.; Ree, J.H.; Choi, D.K. Tectonic and sedimentary evolution of the Korean peninsula: A review and new view. Earth Sci. Rev. 2000, 52, 175–235. [Google Scholar] [CrossRef]
- Kim, H.C.; Lee, Y. Heat flow in the Republic of Korea. J. Geophys. Res. 2007, 112, B05413. [Google Scholar] [CrossRef]
- Kim, N.J.; Lee, H.K. Explanatory text of the geological map of Yongsan sheet (1:50,000); Korea Institute of Geoscience and Mineral Reosources: Daejeon, Korea, 1964; pp. 1–31. [Google Scholar]
- Aka, F.T.; Kusakabe, M.; Nagao, K.; Tanyileke, G. Noble gas isotopic compositions and water/gas chemistry of soda springs from the islands of Bioko, Sao Tome and Annobon, along with Cameroon Volcanic Line, West Africa. Appl. Geochem. 2001, 16, 323–338. [Google Scholar] [CrossRef]
- Ongay, E. Hydrogeological and Hydrochemical Investigation of Balıkesir-Pamukçu Geothermal Area and its Vicinity. Master’s Thesis, Dokuz Eylul University, İzmir, Turkey, 2004. [Google Scholar]
- Jeong, C.H.; Kim, C.S.; Kim, T.K.; Kim, S.J. Reaction path modeling on geochemical evolution of groundwater and formation of secondary minerals in water-gneiss reaction system. J. Miner. Soc. Korea 2007, 10, 33–44. [Google Scholar]
- Craig, H. Isotopic variations in meteoric water. Science 1961, 133, 1702–1703. [Google Scholar] [CrossRef]
- Koh, Y.K.; Bae, D.S.; Kim, C.S.; Kim, K.S.; Chung, H.J.; Kim, S.Y. Consideration of the groundwater recharge based on environmental isotopic characteristics of the small basin in the Yeosu Area. J. Soil Groundw. Environ. 2001, 6, 93–106. [Google Scholar]
- Geyh, M. Groundwater Saturated and Unsaturated Zone. In Environmental Isotopes in the Hydrological Cycle Principles and Applications, Technical Document in Hydrology; UNESCO: Paris, France, 2000; Volume 4, pp. 1–196. [Google Scholar]
- D’amore, F.; Panichi, C. Geochemistry in geothermal exploration. Energy Res. 1985, 9, 277–298. [Google Scholar] [CrossRef]
- Matsubaya, O.; Sakai, H.; Kusachi, I.; Setake, H. Hydrogen and oxygen isotopic ratios and major element chemistry of Japanese thermal water system. Geochem. J. 1973, 7, 123–151. [Google Scholar] [CrossRef]
- Allegre, C.J. Isotope Geology; Cambridge University Press: Cambridge, UK, 2008; 534p. [Google Scholar]
- Yoo, B.C. Genesis of the Ogcheon gold-silver deposit in Republic of Korea: Ore minerals, fluidinclusion and stable isotope studies. Econ. Environ. Geol. 2013, 46, 153–163. [Google Scholar] [CrossRef]
- Yu, H.M.; Shin, D.B. Mineralization and genetic environments of the central and main orebodies in the Manjang deposit, Geosan. J. Miner. Soc. Korea 2018, 31, 87–101. [Google Scholar] [CrossRef]
- Yoo, B.C.; You, B.W. Geopung copper deposit in Ogcheon, Chungcheongbuk-do: Mineralogy, fluid inclusion and stable isotope studies. Econ. Environ. Geol. 2001, 44, 193–201. [Google Scholar] [CrossRef]
- Koh, Y.K.; Yun, S.T.; Kim, C.S.; Bae, D.S.; Park, S.S. Geothermal evolution and deep environment of the Geothermal waters in the Bugok area: Reconsideration on the origin of sulfate-type geothermal water. Econ. Environ. Geol. 2001, 34, 329–343. [Google Scholar]
- Harrison, A.G.; Thode, H.G. The kinetic isotope effect in the chemical reduction of sulphate. Trans. Faraday Soc. 1957, 53, 1648–1651. [Google Scholar] [CrossRef]
- Ohmoto, H.; Rye, R.O. Isotopes of Sulfur and Carbon. In Geochemistry of Hydrothermal Ore Deposits, 2nd ed.; Barnes, H.L., Ed.; Join Wiley and Sons, Inc.: New York, NY, USA, 1979; pp. 509–567. [Google Scholar]
- Torgersen, T.; Jenkins, W.J. Helium isotopes in geothermal system: Iceland, the geysers, raft river and steamboat springs. Geochim. Cosmochim. Acta 1982, 46, 739–748. [Google Scholar] [CrossRef]
- Yokoyama, T.; Nakai, S.I.; Wakita, H. Helium and carbon isotopic compositions of hot spring gases in the Tibetan Plateau. J. Volcanol. Geotherm. Res. 1999, 88, 99–107. [Google Scholar] [CrossRef]
- Hulston, J.R.; Lupton, J.E. Helium isotope studies of geothermal fluids in the Taupo Volcanic Zone, New Zealand. J. Volcanol. Gemtherm. Res. 1996, 74, 297–321. [Google Scholar] [CrossRef]
- Graham, D.W. Noble gas isotope geochemistry of mid-ocean ridge and ocean island basalts: Characterization of mantle source reservoirs. Rev. Miner. Geochem. 2002, 47, 247–317. [Google Scholar] [CrossRef]
- Ballentine, C.J.; Burnard, P.G. Production, release and transport of noble gases in continental crust. Rev. Miner. Geochem. 2002, 47, 481–538. [Google Scholar] [CrossRef]
- Ozima, M.; Podosek, F.A. Noble Gases in the Earth. In Noble Gas Geochemistry, 2nd ed.; Cambridge University Press: Cambridge, UK, 2002; pp. 217–249. [Google Scholar]
- Sano, Y.; Wakita, H. Geographical distribution of 3He/4He ratios in Japan: Implications for arc tectonics and incipient magmatism. J. Geophys. Res. Solid Earth 1985, 90, 8729–8741. [Google Scholar] [CrossRef]
- Kotaba, M.J.; Nagao, K. Composition and origin of natural gases accumulated in the Polish and Ukrainian parts of the Carpathian region: Gaseous hydrocarbons, noble gases, carbon dioxide and nitrogen. Chem. Geol. 2008, 255, 426–438. [Google Scholar] [CrossRef]
- Arnórsson, S.; Gunnlaugsson, E. New gas geothermometers for geothermal exploration-calibration and application. Geochim. Cosmochim. 1985, 49, 1307–1325. [Google Scholar] [CrossRef]
- Henley, R.W.; Truesdell, A.H.; Barton, P.B., Jr.; Whitney, J.A. Fluid-Mineral Equilibria in Hydrothermal Systems; Society of Economic Geologist, Inc.: Littleton, CO, USA, 1984; pp. 1–267. [Google Scholar]
- Fournier, R.O. Chemical geothermometers and mixing models for geothermal systems. J. Geotherm. 1977, 5, 41–50. [Google Scholar] [CrossRef]
- Gu, X.; Zhang, Q.; Cui, Y.; Shao, J.; Xiao, Y.; Zhang, P.; Liu, J. Hydrogeochemistry and Genesis Analysis of Thermal and Mineral Springs in Arxan, Northeastern China. Water 2017, 9, 61. [Google Scholar] [CrossRef]
- Dulanya, Z.; Morales-Simfors, N.; Sivertun, Å. Comparative study of the silica and cation geothermometry of the Malawi hot springs: Potential alternative energy source. J. Afr. Earth Sci. 2010, 57, 321–327. [Google Scholar] [CrossRef]
- Pope, L.A.; Hajash, A.; Popp, R.K. An experimental investigation of the quartz, Na-K, Na-K-Ca geothermometers and the effects of fluid composition. J. Volcanol. Geotherm. Res. 1987, 31, 151–161. [Google Scholar] [CrossRef]
- Tarcan, G. Geothermal Water Chemistry, Centre of Geothermal Energy. Res. Appl. (Jenarum) Summer Sch. Publ. 2002, 87–113. [Google Scholar]
- Trusdell, A.H.; Fournier, R.O. Procedure for estimating the temperature of a hot-water component in a mixed water by using a plot of dissolved silica versus enthalpy. J. Res. USGS 1977, 5, 49–52. [Google Scholar]
- Fournier, R.O.; Truesdell, A.H. An empirical N-K-Ca chemical geothermometer for natural waters. Geochem. Cosmochim. Acta 1973, 37, 1255–1275. [Google Scholar] [CrossRef]
- Truesdell, A.H. Summary of Section III: Geochemical Techniques in Exploration; Lawrence Berkeley Labortory: Berkeley, CA, USA, 1976; pp. 54–80. [Google Scholar]
- Fournier, R.O. A revised equation for the Na/K geothermometer. Geotherm. Resour. Counc. Trans. 1979, 3, 221–224. [Google Scholar]
- Arnórsson, S. Chemical equilibria in icelandic geothermal systems: Implications of chemical geothermometry investigations. Geothermics 1983, 12, 119–128. [Google Scholar] [CrossRef]
- Heat Exchanger Design Handbook. Available online: http://hedhme.com/content_map/?link_id=22140&article_id=526 (accessed on 19 June 2019).
- PHREEQC. (Computer File) Water Chemistry, Computer Programs Geochemistry; Version 3.0; US Geological Survey: Denver, CO, USA, 1999.
- Parkhurst, D.L. User’s Guide to PHREEQC–A Computer Program for Speciation, Reaction-Path, Advective-Transport, and Inverse Geochemical Calculations; US Geological Survey: Denver, CO, USA, 1995.
- Tole, P.M.; Ármannsson, H.; He, P.Z.; Arnórsson, S. Fluid/mineral equilibrium calculations for geothermal chemical geothermometry. Geothermics 1993, 22, 17–37. [Google Scholar] [CrossRef]


| (Unit: mg L−1) | |||||||||||
|---|---|---|---|---|---|---|---|---|---|---|---|
| Sample ID | Temp (°C) | pH | ORP (mV) | EC (μS cm−1) | DO | Na+ | K+ | Ca2+ | Mg2+ | Sr2+ | Fe |
| MH-1 | 42.2 | 7.78 | −104 | 1272 | 3.40 | 188 | 8.96 | 44.2 | 0.67 | 0.83 | 0.008 |
| MH-2 | 45.0 | 7.52 | −71 | 1044 | 1.30 | 154 | 7.84 | 39.0 | 0.91 | 0.65 | 0.003 |
| MH-3 | 31.3 | 7.48 | −88 | 551 | 1.60 | 92.1 | 2.16 | 20.9 | 0.55 | 0.32 | 0.01 |
| MH-4 | 49.8 | 7.8 | −82 | 1489 | 6.40 | 207 | 13.3 | 47.1 | 0.52 | 1.07 | 0.013 |
| MH-5 | 39.4 | 7.53 | −75 | 1038 | 0.50 | 163 | 6.69 | 33.9 | 0.56 | 0.60 | 0.004 |
| MH-6 | 30.8 | 7.42 | −108 | 740 | 0.10 | 107 | 2.30 | 34.6 | 0.51 | 0.68 | 0.006 |
| MG-1 | 20.8 | 7.35 | +190 | 222 | 4.00 | 14.1 | 0.60 | 26.6 | 4.13 | 0.13 | 0.002 |
| MG-2 | 20.9 | 7.09 | +228 | 188 | 4.90 | 10.1 | 0.61 | 24.6 | 3.66 | 0.90 | 0.117 |
| MG-3 | 23.5 | 7.33 | +402 | 436 | 4.80 | 47.2 | 8.57 | 27.2 | 12.9 | 0.26 | 0.002 |
| MG-4 | 17.9 | 5.86 | +150 | 480 | 1.90 | 39.5 | 5.09 | 38.6 | 11.0 | 0.34 | 0.002 |
| MG-5 | 21.0 | 7.20 | +161 | 664 | 3.10 | 56.4 | 0.93 | 85.1 | 3.78 | 1.85 | 0.002 |
| Sample ID | Mn | SiO2 | HCO3− | F2212 | Cl− | SO42− | E (%) | δ18O (%) | δ2H (%) | δ34S (%) | |
| MH-1 | 0.61 | 55.8 | 219 | 1.92 | 177 | 57.6 | 3.82 | −8.4 | −55 | 13.0 | |
| MH-2 | 10.2 | 54.1 | 214 | 0.17 | 131 | 49.6 | 3.94 | −8.4 | −54 | 10.0 | |
| MH-3 | 4.01 | 35.1 | 230 | 0.38 | 24.0 | 19.5 | 2.76 | −7.9 | −51 | 7.0 | |
| MH-4 | 8.85 | 62.5 | 186 | 0.48 | 240 | 61.3 | 2.70 | −8.6 | −55 | 15.0 | |
| MH-5 | 2.49 | 50.5 | 230 | 0.26 | 143 | 64.0 | −1.26 | −8.2 | −53 | 9.9 | |
| MH-6 | 18.4 | 34.4 | 307 | 0.36 | 35.5 | 24.7 | −0.65 | −8.2 | −52 | 7.2 | |
| MG-1 | 0.002 | 33.2 | 134 | <0.05 | 7.05 | 6.88 | −5.81 | −8.4 | −57 | ||
| MG-2 | 0.002 | 33.2 | 118 | <0.05 | 3.13 | 4.89 | −5.18 | −8.3 | −57 | ||
| MG-3 | 0.002 | 22.9 | 177 | <0.05 | 21.6 | 37.2 | 4.08 | −8.1 | −58 | ||
| MG-4 | 0.002 | 18.0 | 126 | <0.05 | 50.6 | 21.8 | −3.58 | −7.6 | −55 | ||
| MG-5 | 0.005 | 26.9 | 328 | <0.05 | 28.7 | 67.8 | −4.54 | −7.8 | −54 | ||
| Sample ID | 4He (×10−7 cm3 g−1) | 20Ne (×10−9 cm3 g−1) | 3He/4He (×10−6) | 4He/20Ne |
|---|---|---|---|---|
| MH-1 | 0.320 | 271 | 0.335 | 11.8 |
| MH-2 | 0.608 | 344 | 0.442 | 17.6 |
| MH-3 | 0.102 | 491 | 0.420 | 2.08 |
| MH-5 | 0.460 | 212 | 0.340 | 21.7 |
| MH-6 | 0.238 | 301 | 0.366 | 7.89 |
| Sample No. | 4He | 3He | ||||
|---|---|---|---|---|---|---|
| Air (%) | Mantle (%) | Crust (%) | Air (%) | Mantle (%) | Crust (%) | |
| MH-1 | 2.7 | 2.4 | 94.9 | 11.3 | 85.9 | 2.8 |
| MH-2 | 1.8 | 3.4 | 94.8 | 5.7 | 92.2 | 2.1 |
| MH-3 | 15.3 | 1.6 | 83.0 | 51.0 | 47.0 | 2.0 |
| MH-5 | 1.5 | 2.6 | 96.0 | 6.0 | 91.1 | 2.8 |
| MH-6 | 4.0 | 2.5 | 93.5 | 15.4 | 82.1 | 2.6 |
| Geothermometers | Equations | Source |
|---|---|---|
| Qtz a (°C) | [42] | |
| Qtz b (°C) | [42] | |
| Chal a (°C) | [42] | |
| Chal b (°C) | [42] | |
| Na–K–Ca (°C) | [48] | |
| Na–K1 (°C) | [49] | |
| Na–K2 (°C) | [50] | |
| Na–K3 (°C) | [51] | |
| K–Mg (°C) | [11] |
| Sample ID. | Estimated Reservoir Temperature and Mixing Ratio | |||||||||||
|---|---|---|---|---|---|---|---|---|---|---|---|---|
| Outflow (°C) | Qtz a (°C) | Qtz b (°C) | Mix q (%) | Chal a (°C) | Chal b (°C) | Mix ch (%) | Na–K–Ca (°C) | Na–K1 (°C) | Na–K2 (°C) | Na–K3 (°C) | K–Mg (°C) | |
| MH-1 | 42.2 | 107 | 107 | 0.75 | 77.5 | 80.4 | 0.64 | 63.3 | 82.1 | 127.8 | 102.3 | 48.1 |
| MH-2 | 45.0 | 106 | 106 | 0.72 | 75.9 | 79.0 | 0.58 | 59.9 | 86.4 | 131.6 | 106.6 | 42.4 |
| MH-3 | 31.3 | 86.0 | 88.8 | 0.85 | 55.0 | 60.3 | 0.73 | 31.9 | 41.9 | 90.9 | 60.9 | 23.3 |
| MH-4 | 49.8 | 113 | 112 | 0.68 | 83.4 | 85.7 | 0.55 | 75.2 | 102.4 | 145.7 | 122.9 | 59.1 |
| MH-5 | 39.4 | 102.3 | 103 | 0.77 | 72.4 | 75.9 | 0.66 | 42.1 | 40.1 | 89.2 | 59.0 | 32.7 |
| MH-6 | 30.8 | 85.1 | 88.1 | 0.85 | 54.1 | 59.5 | 0.74 | 26.5 | 37.5 | 86.8 | 56.4 | 25.1 |
| Sample ID. | Enthalpy (KJ kg−1) | Mixing Ratio (%) | SiO2 (mg L−1) | Mixing Ratio (%) | ||||
|---|---|---|---|---|---|---|---|---|
| Outflow | Reservoir | Cold Water | Outflow | Reservoir | Cold Water | |||
| MH-1 | 177 | 880 | 62.5 | 0.86 | 55.8 | 279 | 26.8 | 0.89 |
| MH-2 | 188 | 795 | 62.5 | 0.83 | 54.1 | 213 | 26.8 | 0.85 |
| MH-3 | 133 | 726 | 62.5 | 0.89 | 35.1 | 131 | 26.8 | 0.92 |
| MH-4 | 208 | 830 | 62.5 | 0.81 | 62.5 | 241 | 26.8 | 0.83 |
| MH-5 | 165 | 855 | 62.5 | 0.87 | 50.5 | 254 | 26.8 | 0.90 |
| MH-6 | 129 | 723 | 62.5 | 0.90 | 34.4 | 125 | 26.8 | 0.92 |
© 2019 by the authors. Licensee MDPI, Basel, Switzerland. This article is an open access article distributed under the terms and conditions of the Creative Commons Attribution (CC BY) license (http://creativecommons.org/licenses/by/4.0/).
Share and Cite
Jeong, C.-H.; Lee, B.-D.; Yang, J.-H.; Nagao, K.; Kim, K.-H.; Ahn, S.-W.; Lee, Y.-C.; Lee, Y.-J.; Jang, H.-W. Geochemical and Isotopic Compositions and Geothermometry of Thermal Waters in the Magumsan Area, South Korea. Water 2019, 11, 1774. https://doi.org/10.3390/w11091774
Jeong C-H, Lee B-D, Yang J-H, Nagao K, Kim K-H, Ahn S-W, Lee Y-C, Lee Y-J, Jang H-W. Geochemical and Isotopic Compositions and Geothermometry of Thermal Waters in the Magumsan Area, South Korea. Water. 2019; 11(9):1774. https://doi.org/10.3390/w11091774
Chicago/Turabian StyleJeong, Chan-Ho, Byeong-Dae Lee, Jae-Ha Yang, Keisuke Nagao, Kyu-Han Kim, Sang-Won Ahn, Yong-Cheon Lee, Yu-Jin Lee, and Hyeon-Woo Jang. 2019. "Geochemical and Isotopic Compositions and Geothermometry of Thermal Waters in the Magumsan Area, South Korea" Water 11, no. 9: 1774. https://doi.org/10.3390/w11091774