Article

Research on the Allocation of Flood Drainage Rights of the Sunan Canal Based on a Bi-level Multi-Objective Programming Model

1
Business School, Hohai University, Nanjing 211100, China
2
College of Agricultural Engineering, Hohai University, Nanjing 210098, China
3
Ginling College, Nanjing Normal University, Nanjing 210000, China
*
Author to whom correspondence should be addressed.
Water 2019, 11(9), 1769; https://doi.org/10.3390/w11091769
Submission received: 11 June 2019 / Revised: 9 August 2019 / Accepted: 22 August 2019 / Published: 25 August 2019
(This article belongs to the Section Water Resources Management, Policy and Governance)

Abstract

:
To reduce flood disasters and optimize of the comprehensive benefit of the water basin, the allocation of regional flood drainage rights is of great significance. Using the “top-down” allocation mode, we consider the influence of the social, economic, and ecological environments, flood drainage demand and efficiency, and other factors on the allocation of flood drainage rights. A bi-level multi-objective programming model from the perspective of fairness and efficiency is established for the allocation. The Sunan Canal is taken as a typical case study. The model is solved by the multi-objective optimal allocation method and the master–slave hierarchical interactive iteration algorithm. After three iterations of the initial solution, the allocation of flood drainage rights in six flood control regions finally reach an effective state. The results of the model were compared with results based on historical allocation principles, showing that the bi-level multi-objective programming model, based on the principles of fairness and efficiency, is more in line with the current social and economic development of the canal. In view of the institutional background of water resources management in China and the flood drainage pressure faced by various regions, the allocation of flood drainage rights should be comprehensively considered in combination with various factors, and the market mechanism should be utilized to optimize the allocation.

1. Introduction

Water resources are basic and necessary to national economies and people’s livelihoods. The characteristics of water resources include reproducibility, finiteness, uneven spatial-temporal distribution, and social versatility [1,2]. Also, water resources and their interdependent natural environments are fragile and vulnerable [3,4]. Flooding is a problem in many parts of the world where water is relatively abundant. In 2011, climate change caused major flooding in Bangkok, Thailand. To prevent flooding from affecting the city center, the local government clashed with the public over whether to open the upstream sluice. In China, the amounts of water in different regions vary greatly as a result of the differences in climate and geographical conditions. This variation has resulted in a greater quantity of available water resources in the southern part of the country [5]. This uneven distribution has caused great difficulties for water resources protection and allocation [6]. Because of increased human activity and drastic climate change, water resources in many regions of China are facing severe challenges, especially in the middle and lower reaches of the Yangtze River, where there are many different types and degrees of flood risk [7]. The high frequency and wide range of floods seriously threaten the safety of people and property [8,9].
When a flood disaster occurs, the water resources management departments of the water basin and the region conduct joint dispatching in combination with flood control dispatch planning [10]. This joint operation can greatly reduce flood damage [11]. Because of the limited amount of flood drainage, each region has tried to discharge more flood water to reduce the pressure of drainage, but doing so has led to water conflicts about flood drainage between the upper and lower reaches of the basin, as well as between the left and right banks [12,13,14,15]. China is one of the countries in the world with the severe flood disasters, which have serious socio-economic and ecological effects. The sustainable development of both the economy and society is bound to be impeded if the issue of flood discharge among different regions cannot be coordinated [16]. Therefore, the allocation of regional flood drainage rights is of practical significance.
The generalized concept of drainage rights is the right to drain water flows or deposits on or under the surface by artificial means, which are liable to be hazardous or recyclable [17,18]. The adjacent drainage right and the sewage drainage right, after the use of water resources, belong to this category. Because rain water is the main factor affecting the scale of drainage projects, the flood drainage right proposed in this paper is different from the existing concept of drainage rights. A flood drainage right is defined as the right to discharge the floodwater generated by a rainstorm and is the main means of controlling the drainage of various regions when it exceeds the flood discharge capacities of the regions [19]. The concept of flood drainage rights is often confused with the concept of sewage drainage rights. The sewage drainage right refers to the right of polluters to discharge pollutants into the environment within the quota allocated by the environmental protection supervision and administration department in order to control water pollution. Pollutants come from domestic sewage, industrial point source pollution, and agricultural non-point source pollution. The discharge of pollutants is closely related to the degree of social and economic development and natural endowment. According to the requirement of control, the total amount of pollutants, the water environmental capacity of each administrative region, is one of the key factors affecting the allocation of emission rights [20,21]. Although sewage discharge is also involved in flood drainage rights, the main consideration of the flood drainage allocation is rainfall, which is the main factor affecting drainage scales [22]. While the drainage households are allocated the flood drainage quota, they bear the responsibility of sewage treatment.
The flood drainage right is non-exclusive and competitive, it needs to be configured to avoid conflicts. The allocation of flood drainage rights is based on the flood control dispatching scheme issued by the state flood control headquarters and the requirements of flood control dispatching plans at the basin or administrative level. Taking the security of the river basin as the goal, the government comprehensively considers the drainage capacity of water conservancy projects in the river basin, the rainfall distribution, and the drainage demand in each region, and allocates the right of flood drainage to water conservancy projects in each region in combination with the region’s social, economic, ecological, and other, factors. The safe flow of a water conservancy project can be regarded as the total amount of flood drainage that can be distributed [23].
In the “top-down” distribution mode, the government should not only consider the degree of economic development and historical flood drainage situations of the region but also allocation efficiency to ensure the feasibility of implementing flood drainage rights distribution schemes. Utilizing the concept of risk balance, this study constructed a bi-level programming model of flood drainage rights allocation from the perspective of fairness and efficiency, then applied the master–slave interactive iterative algorithm based on satisfaction to solve the model for flood drainage rights allocation so as to further verify the validity of the model and the feasibility of the algorithm.

2. Literature Review

With the acceleration of urbanization and the frequent occurrence of flood disasters, the research scope of flood control operation has gradually changed from single reservoir operation [24,25] to cascade reservoir operation [26,27] and basin operation [28,29]. The joint operation of units in a river basin is the current focus of research on flood control operation research. The research has involved the forecast of rainfall and runoff [30,31], the identification and evaluation of flood control risk [32,33,34], and the decision of optimal flood control operation [35,36]. As the flood forecast changes with the weather system, regional system, and underlying surface conditions, the production and confluence conditions must also change. Different prediction models and calculation methods should be selected for different prediction objectives. On the basis of the establishment of a short-term rainfall prediction model and a reservoir release operation model, Che, D. realized real-time reservoir flood control by using the U.S. Army Corps of Engineers (USACE) Hydrologic Engineering Center–Hydrologic Modeling System (HEC-HMS) [37]. Valeriano, O.C.S. proposed a physics-based distributed hydrological model to reduce downstream flood peaks through joint scheduling. The observed meteorological radar products were input into a hydrological model to simulate the flow in a river network and the river flow was evaluated at the control points [38]. In order to mitigate the hydrological impact of climate change on water resources systems, Lee, S. adopted a daily time-step simulation model instead of a monthly time step one to prepare an optimized flood control curve [39].
In terms of a flood control dispatching algorithm, a simulation-based optimization algorithm has been increasingly adopted by researchers in the field of flood control dispatching to deal with uncertain, nonlinear, discrete, complex, constrained, and conflicting optimization objectives in reservoir systems [40]. Che, D. established a real-time river–reservoir flood simulation and control optimization model, which was applied to the Cumberland River at Nashville, Tennessee, and was able to reduce the flood level below the 100-year flood stage by simulating the flood discharge scheduling [41]. Prakash, O. proposed an adaptive simulation–optimization (S–O) framework to simulate flood dispatching decisions at different stages by combining multi-objective optimization models [42].
At present, flood control dispatching is mainly considered from the perspective of hydrology, without considering the impact of flood control on economy, society, and environment [43,44,45]. From the perspective of management, a decision support system based on watersheds can be combined with a socio-economic analysis to conduct flood control operation [46]. This system can reflect the social and economic differences among different regions and comprehensively consider the impact of social and economic factors on flood control dispatching.

3. Materials and Methods
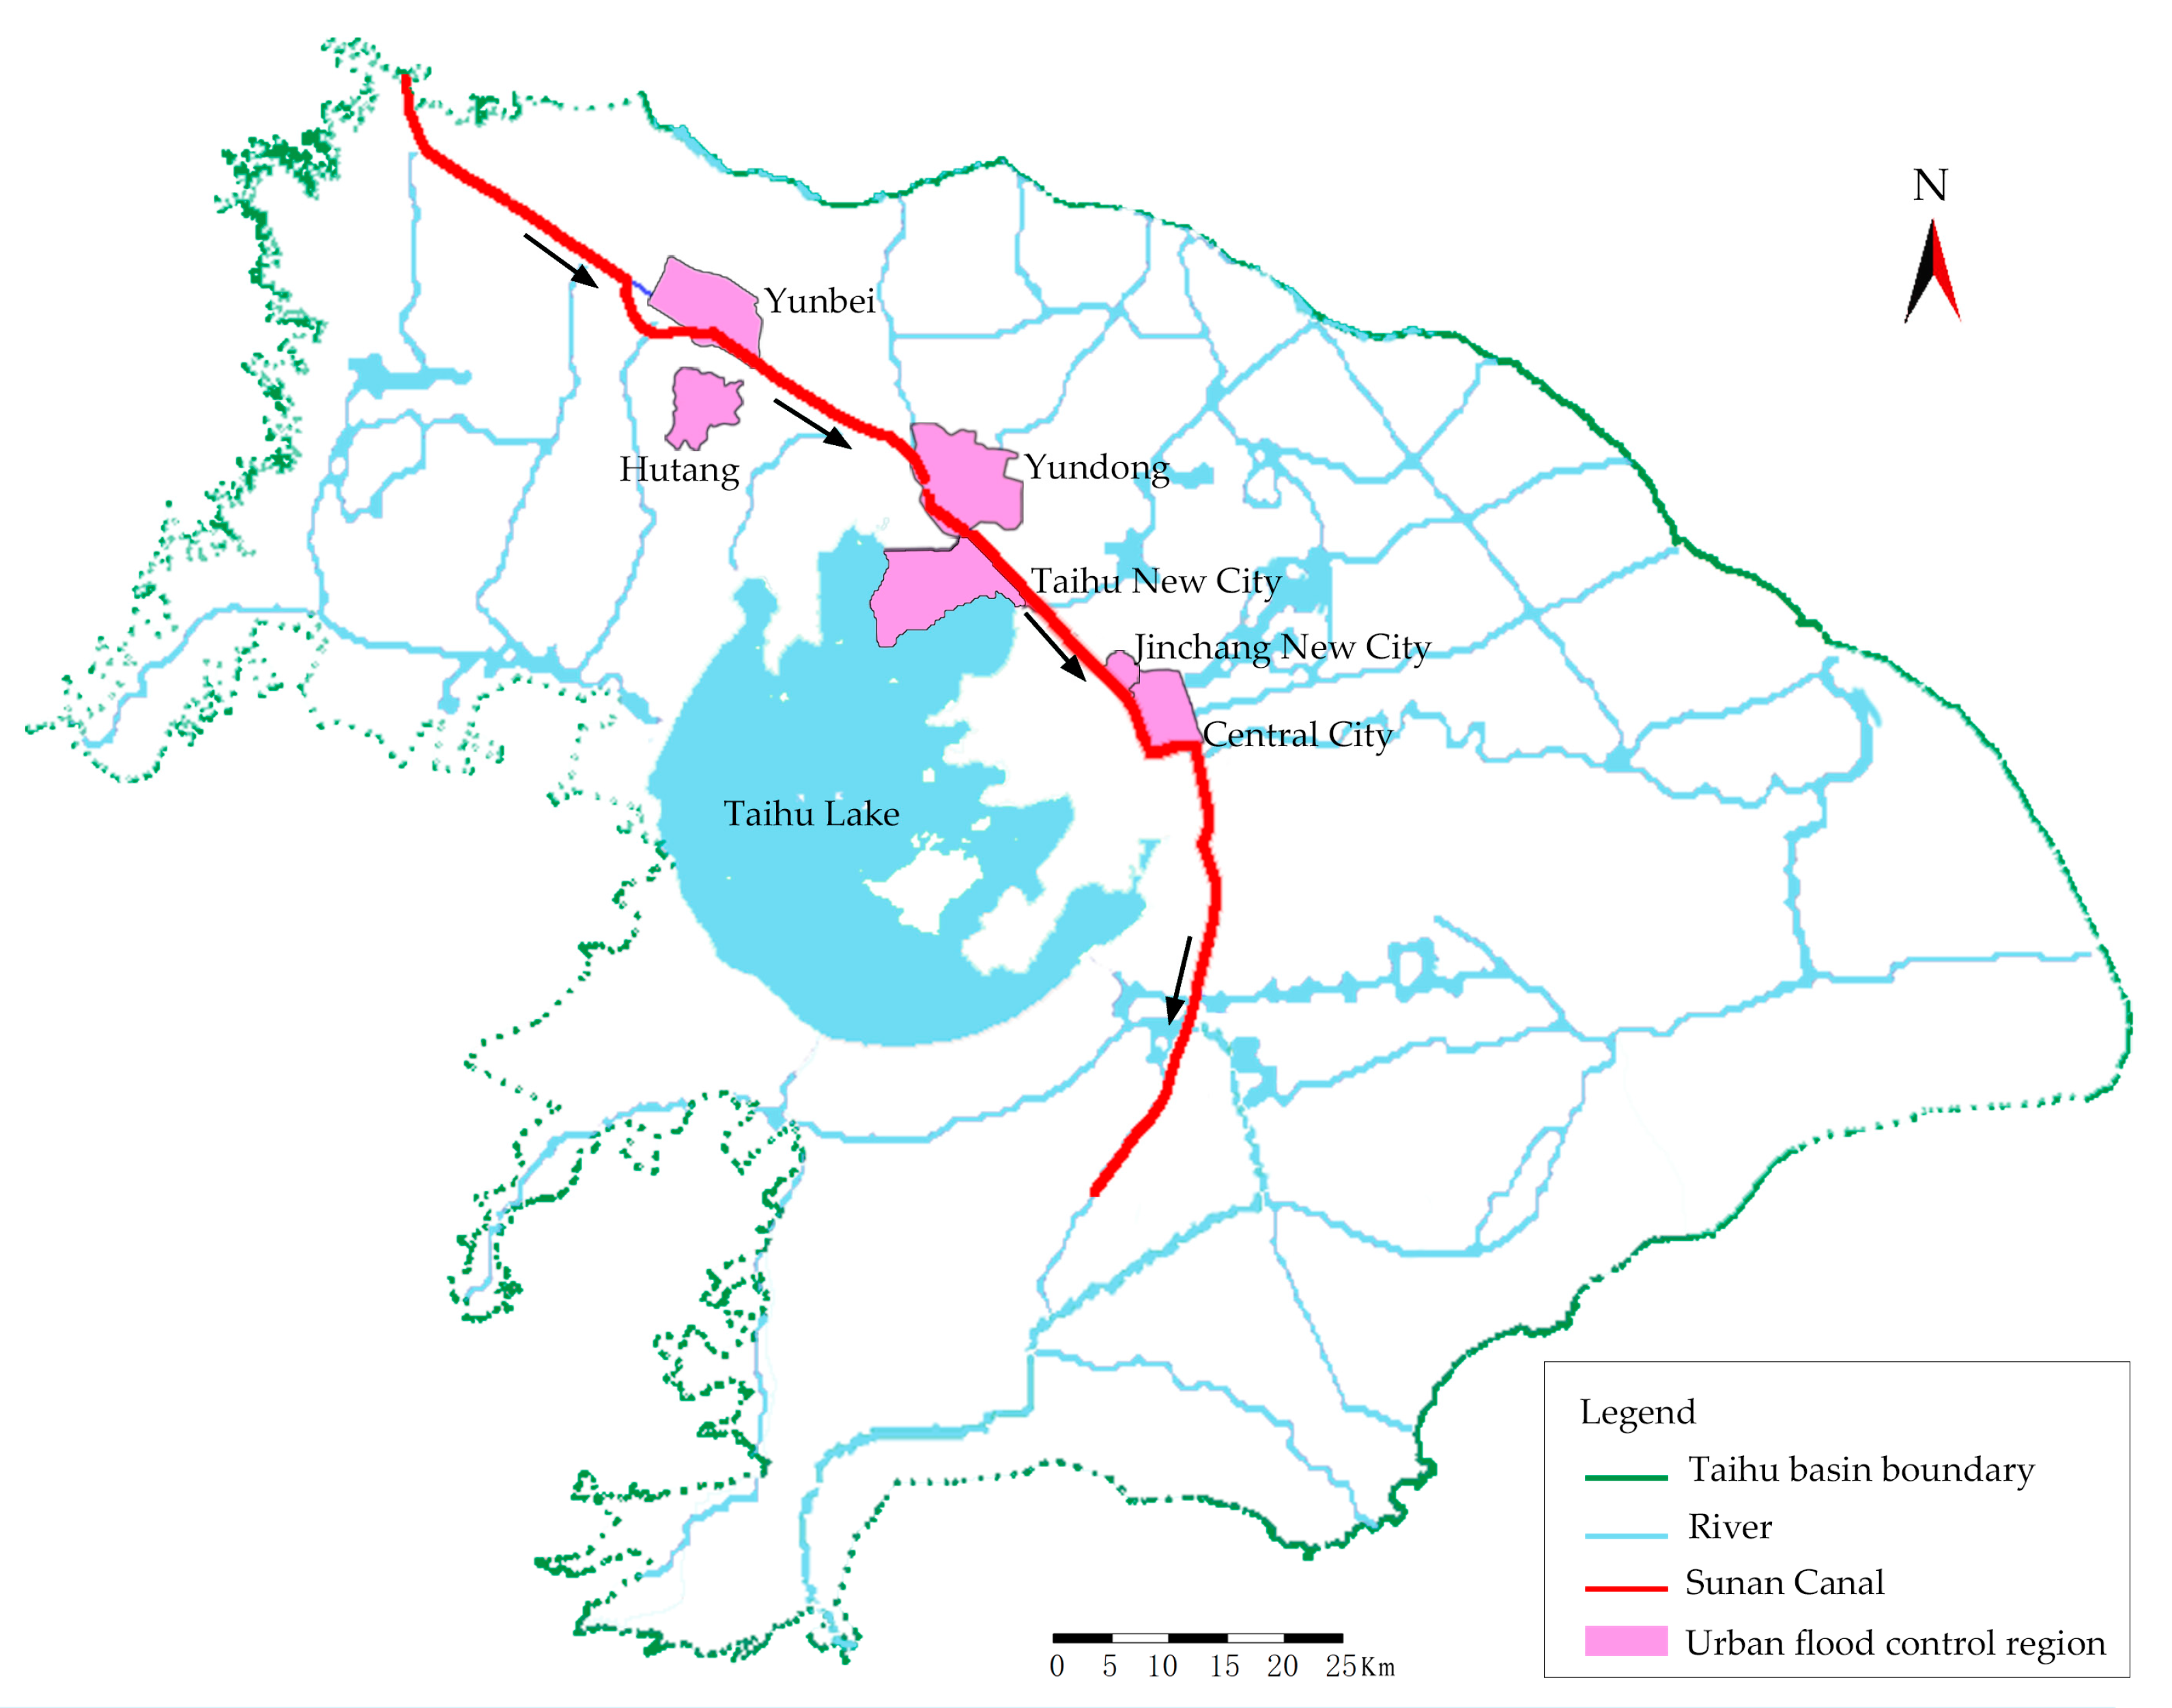
3.1. Research Area

The region along the Sunan Canal is located in the Yangtze River Delta at 30°54′59″–32°15′36″ N by 119°13′45″–121°23′5″ E and belongs to the Taihu River System with the Huangpu River to the east, Yangtze River to the north, and Taihu Lake embankment to the south. A total area of 19,600 km2 covers Zhenjiang, Changzhou, Wuxi, and Suzhou of the Jiangsu Province, Shanghai, and parts of the Zhejiang Province. Because of the geographical and climatic conditions, the basin has a long, rainy summer and is prone to disastrous rainstorms of short duration and high intensity. About 70% of the annual rainfall is concentrated during the flood season from May to September. After years of governance, the flood control capacity of areas along the Sunan Canal has been greatly improved. However, with the rapid development of the Chinese economy, the water regime has changed significantly and the contradiction of flood drainage has become prominent.
According to the scope of six urban flood control projects that have been put into operation, this paper takes Yunbei, Hutang, Yundong, Taihu New City, Central City, and Jinchang New City as research areas (Figure 1). With the operation of urban flood control projects along the Sunan Canal in Suzhou, Wuxi, and Changzhou, the capacity of flood control in the low-lying areas has been improved. Meanwhile, the river has been cut off from the canal and the nature of the river’s water exchange with the canal has changed. The canal has become the main drainage channel for the flood control region. The six flood control systems in these three cities have a total drainage of 729 m3/s, while the discharge volume under the current safe condition of the Sunan Canal is 400 m3/s. The historical data of the flood drainage were well above the current safe discharge of the canal.
When the centralized drainage of the cities changes the canal’s confluence characteristics, the canal becomes a sectional regulation and storage “reservoir”. The water level in the canal rises rapidly and flood control pressure increases. During the flood season of 2015–2017, the main representative stations of the Sunan Canal experienced an atypically high water level and some areas along the canal were seriously affected. The water level has become a major concern for society and the media.

3.2. Allocation Principles

The allocation of flood drainage rights is restricted by the drainage capacities of water conservancy projects, the rainfall distribution, and drainage demand, and the social, economic, ecological, and other factors of a region. Hence, such allocation has a certain degree of sensitivity and complexity. As the allocation of flood drainage rights is a policy-oriented government action, certain principles should be followed [19]. The allocation principles formulated in this paper include:
  • Sustainability. The principle of sustainable development requires human beings to take into account the constraints of the environment and ecosystems while developing economically, and realize the coordinated development of economy, society, and resources on the premise of protecting the environment and maintaining the sustainable use of resources. The current way of flood drainage has affected the lives of people in surrounding areas, which is contrary to the principle of sustainability. As a public resource, flood drainage rights have a certain public welfare nature, which requires the government to pay attention to the coexistence of humans and natural environment on the basis of respecting reality. Through a series of measures, the government should rationally allocate flood drainage rights, and formulate short-term and long-term ways of flood control regulation, so as to provide higher-quality public products for society [47,48].
  • Fairness. Competition for flood drainage exists among the different basin regions, as well as between upstream and downstream. The principle of fairness is mainly embodied in the coordination of promoting the social and economic development of the drainage basin. According to the theory of physical geographic economics, a watershed is a complex system that includes subsystems of society, economy, resources, environment, and ecology [49]. The degree of coordination among the subsystems is the criterion for judging if the social economy, natural resources, and environment are developing harmoniously. The allocation of flood drainage rights is actually the allocation of development resource and right. The government should appropriately deal with the drainage competition in different regions, fully consider the influencing factors such as population size, land area, economic development level, and environmental carrying capacity in order to reduce risks and uncertainties, and ensure the rational allocation of the drainage rights in the whole basin.
  • Efficiency. The fundamental purpose of flood drainage rights allocation is to maximize the comprehensive benefit of the drainage basin. The only way to achieve this goal is to improve the efficiency of flood drainage rights allocation so as to reduce flood disasters and promote the balanced development of the regions. By considering the distinctive needs of the upstream and downstream of the river basin, as well as the different administrative regions, the government carries out macro-control. The government should not take economic benefit as the sole goal, but also take into account social and ecological benefits. On the basis of ensuring the safety of the river basin, the share of flood drainage between different regions should be reasonably adjusted, so that the drainage rights can be allocated to the areas that produce greater benefits when the total amount of flood drainage is fixed.

3.3. Methods

On the basis of the analysis of allocation principles, this paper regards the principle of fairness as the main principle and the principle of efficiency as the auxiliary principle. This master–slave relationship conforms to the characteristics of the bi-level programming model and can better describe the relationship between the upper and lower models [50,51,52]. The bi-level programming model based on the perspective of fairness and efficiency must consider the comprehensive benefits of the economy, society, and ecological environment of each allocation region, i.e., to achieve the maximum allocation benefit from the perspective of fairness, and consider the efficiency of the allocation of drainage right to achieve the optimal allocation efficiency.

3.3.1. Upper-level Programming Model Based on Fairness Perspective

Assume that there are n regions to allocate flood drainage right, the GDP of the region i is X i G D P , the comprehensive index of social development is Z i , and the demand for flood drainage is D W i . The allocation of flood drainage right in region i is W i , and the allocation efficiency is θ i .
From the perspective of fairness, the differences in the regional economies, societies, and ecological environments should be taken into account. The optimal allocation scheme should be determined by taking the optimal comprehensive benefits of the regional economy, society, and ecological environment as the objective function, which can be expressed as
{ F ( W i ) = { F 1 ( W i ) , F 2 ( W i ) , F 3 ( W i ) } F 1 ( W i ) = max i = 1 n W i θ i X i G D P F 2 ( W i ) = min i = 1 n k = 1 n ( W i W k Z i Z k ) 2 F 3 ( W i ) = min i = 1 n ( W i D W i 1 n i = 1 n W i D W i ) 2
where F ( W i ) represents the objective function of the upper-level programming model of flood drainage right allocation from the perspective of fairness. F 1 ( W i ) reflects the economic benefit of the total load allocation of flood drainage rights. The GDP of the region and the allocation efficiency are selected to reflect the economic benefits under the total load allocation. F 2 ( W i ) represents the social benefit of the total load allocation of flood drainage rights. The social benefit is reflected by the coordination degree of flood drainage right allocation, that is, the matching degree between the proportional relation of the flood drainage rights obtained in different regions and the proportional relation of the comprehensive index of regional social development ( Z i ). The closer the two proportional relations, the better the match and coordination. Population, GDP, and land area are selected as the reference index to reflect the comprehensive index of regional social development [53,54]. F 3 ( W i ) represents the ecological and environmental benefit of the total load allocation of flood drainage rights. Historical flood drainage before the total load allocation is taken as the drainage demand of each region and the degree of match between the regional allocation and the drainage demand under the total load allocation is calculated to reflect the impact on the ecological environment.
The constraints of the upper-level programming model are as follows:
(1) In the process of optimizing the composite system of flood drainage right allocation, the sum of the flood drainage of each region must be controlled within the constraint range of the target total amount:
i = 1 n W i = W
where W represents the total load of flood drainage rights allocation and W i represents the allocation amount of drainage rights in the region i .
(2) The matching relationship between the proportion of flood drainage rights allocation in each region and its comprehensive index of social development should be guaranteed to reflect the fairness of the allocation among the regions. The constraint is
Z i Z k 1 W i W k 1
The comprehensive index of social development is
Z i = j = 1 m w j P i j
Z i and Z k represent the comprehensive indexes of the social development while W i and W k represent the quantities of the allocated flood drainage rights of regions i and k , respectively. This formula indicates that the ratio of the comprehensive index value of the two regions is consistent with the change direction of the ratio of the flood drainage rights allocation. j is the index number of the three comprehensive indicators of social development, j = 1 , 2 , 3 represent population, GDP, and land area, respectively. P i j is the dimensionless value of the j-th index in the region i , and w j is the weight of the j-th index.
To solve the problem of the weight being affected by the correlation between three comprehensive indicators of social development, this study takes the possible correlation into consideration by eliminating the influence of duplicate information on the weight as much as possible. The specific operations are as follows:
① Standardize the indicators to eliminate the influence of dimensionality.
For positive indicators:
X i j = X i j min ( X 1 j , X 2 j , , X n j ) max ( X 1 j , X 2 j , , X n j ) min ( X 1 j , X 2 j , , X n j ) + 1 ,   i = 1 , 2 , , n ;   j = 1 , 2 , 3
For negative indicators:
X i j = max ( X 1 j , X 2 j , , X n j ) X i j max ( X 1 j , X 2 j , , X n j ) min ( X 1 j , X 2 j , , X n j ) + 1 ,   i = 1 , 2 , , n ;   j = 1 , 2 , 3
② Calculate the coefficient of difference ( d j ).
This coefficient reflects the difference between different evaluation objects under the same index. The larger the coefficient, the more useful the information that can be provided by the index is.
d j = 1 + 1 ln n i = 1 n P i j ln P i j
where P i j = X i j i = 1 n X i j represents the proportion of the i-th scheme in index j.
③ Calculate the coefficient of conflict ( R j ).
This conflict is introduced to reflect the degree of the difference in the information represented by different indicators. The lower the correlation ( r j k ) between one indicator and the other, the higher the degree of conflict with the others is, and the more useful the information that can be provided by the indicator is.
R j = k = 1 m ( 1 | r j k | )
④ Calculate the useful information of the indicator ( C j ).
The information contained in item j can be expressed by multiplying the coefficients of difference and conflict:
C j = d j × R j = ( 1 + 1 ln n i = 1 n P i j ln P i j ) × k = 1 m ( 1 | r j k | )
⑤ Determine the index weight ( w j ).
The greater the amount of information contained in item j , the more important the information is to the decision-making process. The corresponding weight can be expressed as:
w j = C j j = 1 m C j
(3) The flood drainage of each region should not exceed its drainage demand ( D W i ):
W i D W i

3.3.2. Lower-level Programming Model Based on Efficiency Perspective

Data envelopment analysis (DEA) is a tool for analyzing the relative effectiveness of evaluation objects according to a non-parametric frontier [55,56]. The traditional DEA model assumes that the inputs and outputs of each decision-making unit (DMU) are independent of each other. In reality, there is always a total limit for some inputs or outputs. Hence, a zero-sum gains DEA (ZSG–DEA) model, in which the income (or loss) of a particular DMU in a certain input or output is necessarily the loss (or income) of other DMUs for the same input or output, is proposed [57]. Through finite iterations, the efficiency of all DMUs can reach complete efficiency, thereby forming a new effective frontier [58]. Therefore, in the construction process of the constraints of the lower-level programming model, this study constructed a ZSG–DEA model from the perspective of efficiency and obtained an efficient allocation of flood drainage rights after a finite number of iterations.
In the input-oriented model, the population and GDP of each region are taken as output variables and the allocation quota of each region solved by the upper-level programming model is taken as the input variable to calculate the allocation efficiency. Lins et al. provided two simple strategies of average and proportional increase to simulate the interaction process between variables [57]. Of the two strategies, the proportional increase strategy is relatively more equitable and avoids the negative indicators that are caused by the average increase strategy. If the efficiency value of an inefficient D M U 0 is θ Z 0 , then, to improve the allocation efficiency, the D M U 0 must reduce the flood drainage by Δ W 0 = W 0 ( 1 θ Z 0 ) . The other ( n 1 ) D M U i ( i 0 ) increases the input of W i in equal proportions according to the initial input proportion of W i , i.e., the increased amount of input obtained by D M U i from D M U 0 is W i i 0 W i W 0 ( 1 θ Z 0 ) .
The allocation of flood drainage rights should not exceed the drainage demand of the region, as they do now. According to the proportional increase strategy, if the flood drainage right of the decision-making unit with an efficiency of 1 is exactly equal to the drainage demand, the redistribution based on the proportional increase strategy will definitely exceed the upper limit of the flood drainage rights in the region. Therefore, the traditional ZSG–DEA BCC model must be improved for such decision-making units, which are no longer involved in the adjustment. After the adjustment, the redistribution of input W i to D M U i is as follows:
W i = i 0 , i ω [ W i i 0 , i ω W i × W 0 ( 1 θ Z 0 ) ] W i ( 1 θ Z i )
where ω is a high-efficiency set, the DMU efficiency in ω is 1, and the input reaches the upper limit. The DMUs in ω can set up a group. There is no redundant input in the DMUs belonging to ω and the DMUs in ω cannot be allocated to any redundant input of another DMU.
According to the improved proportional increase strategy, the relative efficiency of flood drainage right allocation in D M U 0 is evaluated according to the improved ZSG–DEA BCC model. A lower-level programming model based on an efficiency perspective is established as follows:
min θ Z 0 s . t . { i = 1 n λ i W i [ 1 + W 0 ( 1 θ Z 0 ) i 0 , i ω n W i ] θ Z 0 W 0 i = 1 n λ i B i B 0 i = 1 n λ i = 1 λ i 0 , i = 1 , 2 , , n
where W i and B i are the index values of the input and output, respectively. θ 0 is the relative efficiency of D M U 0 . The greater the value of θ 0 , the more reasonable is the allocation of the flood drainage right. λ i is the weight coefficient.

3.3.3. Master–Slave Hierarchical Interactive Iteration

The bi-level programming model of flood drainage rights allocation is restricted by fairness and efficiency. The objective function and constraints of upper-level decision-making are interrelated and constrained by those of lower-level decision-making. The objective function and constraints of upper-level decision-making problems depend not only on upper-level decision variables but also on the optimal solution of lower-level decision variables. At the same time, the upper-level decision variables will affect the optimal solution of lower-level decision-making problems. In this study, a master–slave interactive iterative algorithm was used to obtain the relative optimal solution on the basis of satisfying the bi-level objectives. The specific steps are as follows:
Step 1: Set t = 1 , which is the number of iteration round for the allocation of flood drainage right.
Step 2: Under the condition that the total load of flood drainage right is fixed, randomly determine the initial allocation scheme W i t of flood drainage right allocation according to the constraint of the upper model.
Step 3: Substitute the initial allocation result W i t into the lower-level programming model on the basis of the efficiency perspective and calculate the efficiency value θ i t . If the effective frontier is reached, then go to Step 5. If the allocation scheme is not DEA effective in a certain region, then use an improved proportional increase strategy to redistribute the initial allocation and obtain the decision variable W i t . The allocation should not exceed the drainage demand of each region.
Step 4: Substitute the decision variables W i t and θ i t of the lower-level model into the objective function of the upper-level model to determine the economic benefit F 1 ( W i ) , social benefit F 2 ( W i ) , and ecological benefit F 3 ( W i ) .
Step 5: Establish the satisfaction function of the comprehensive benefit of flood drainage right allocation according to the benefit that corresponds to the determined allocation amount:
μ t ( F ( W i ) ) = ω 1 F 1 ( W i ) F 1 * ( W ) + ω 2 F 2 * ( W ) F 2 ( W i ) + ω 3 F 3 * ( W ) F 3 ( W i )
where μ t ( F ( W i ) ) represents the satisfaction degree of the comprehensive benefit of the allocation in round t. ω 1 , ω 2 , and ω 3 represent the weights of the three sub-objective satisfaction functions. These three aspects jointly affect the allocation of flood drainage rights, and the impact is the same, so this study sets ω 1 = ω 2 = ω 3 = 1 3 . F 1 * ( W ) , F 2 * ( W ) , and F 3 * ( W ) represent the expected level values of the sub-objectives, which can be determined according to the Sunan Canal Regional Joint Dispatching Scheme.
Step 6: Evaluate the satisfaction degree of the comprehensive benefit. If they reach a satisfactory state, the adjustment of the scheme is stopped. The result of the allocation would be the final satisfactory solution of the allocation model. If the distribution of the comprehensive benefit fails to reach a satisfactory state, then t = t + 1 and go to Step 7.
Step 7: Add the constraints to ensure that the comprehensive benefit of the flood drainage right allocation is always on the optimal path. Go to Step 2 and adjust the allocation amounts in different regions according to the constraints of the upper-level model.

3.4. Data Sources

The flood drainage of the six urban flood control systems has reached 729 m³/s while the discharge volume under the current safe condition of the Sunan Canal is only about 400 m³/s. Therefore, this study took 400 m³/s as the total control target of flood drainage rights (regardless of the discharge into the canal in the polder area). The historical flood drainage of each region is taken as its drainage demand and the data were derived from the Sunan Canal Regional Joint Dispatching Scheme (Table 1).
The data on the population, GDP, and land area of each region are derived from the statistical yearbook and network resources of each city in 2017, as shown in Table 2.

4. Results and Discussions

4.1. Social Development Index

Before the allocation of flood drainage rights, the social development index of six flood control regions were calculated according to Formulas (5)–(11). In combination with the improved entropy weight method, the weight of land area was the largest ( w 3 = 0.3964 ), followed by the weight of population ( w 1 = 0.3020 ), and the weight of GDP ( w 2 = 0.3027 ).
Thus, the comprehensive index of social development in different regions was determined, as shown in Table 3. The comprehensive index of social development in Yundong was the highest, which was 0.2151. Although the land area of Yundong is lower than that of Yunbei, Yundong has a higher population and GDP, so the social development index is the highest. The comprehensive index of social development is ranked from high to low, which is Yunbei, Taihu New City, Central City, Hutang and Jinchang New City.

4.2. Allocation Result of Flood Drainage Rights

4.2.1. Initial Solution

In accordance with Table 3, the bi-level multi-objective programming model was used to carry out flood drainage rights allocation under total load control and the initial solution scheme of each region was obtained (Table 4).
In the case of initial solution, the allocation efficiency of flood drainage rights in six regions was calculated. The allocation efficiencies of Yundong and Jinchang New City were 1, whereas the allocation efficiencies of the other four flood control regions were non-effective. Among them, the allocation efficiencies of Hutang and Taihu New City were 0.7720 and 0.6473, respectively, i.e., less than 0.8. The average efficiency of the initial solution was 0.8717. The overall efficiency was relatively high and close to the frontier. As long as the input is adjusted appropriately, the frontier can be reached.
Combined with the initial solution scheme in Table 4 and the corresponding efficiency value, the initial solution satisfied Formulas (8)–(11) and the economic, social, and ecological benefits of the flood drainage right were F 1 ( W ) = 36.3697 × 10 4 , F 2 ( W ) = 13.1881 , and F 3 ( W ) = 0.4390 , respectively. On this basis, the satisfaction degree of the comprehensive benefit was μ t ( F ( W ) ) = 0.8639 .

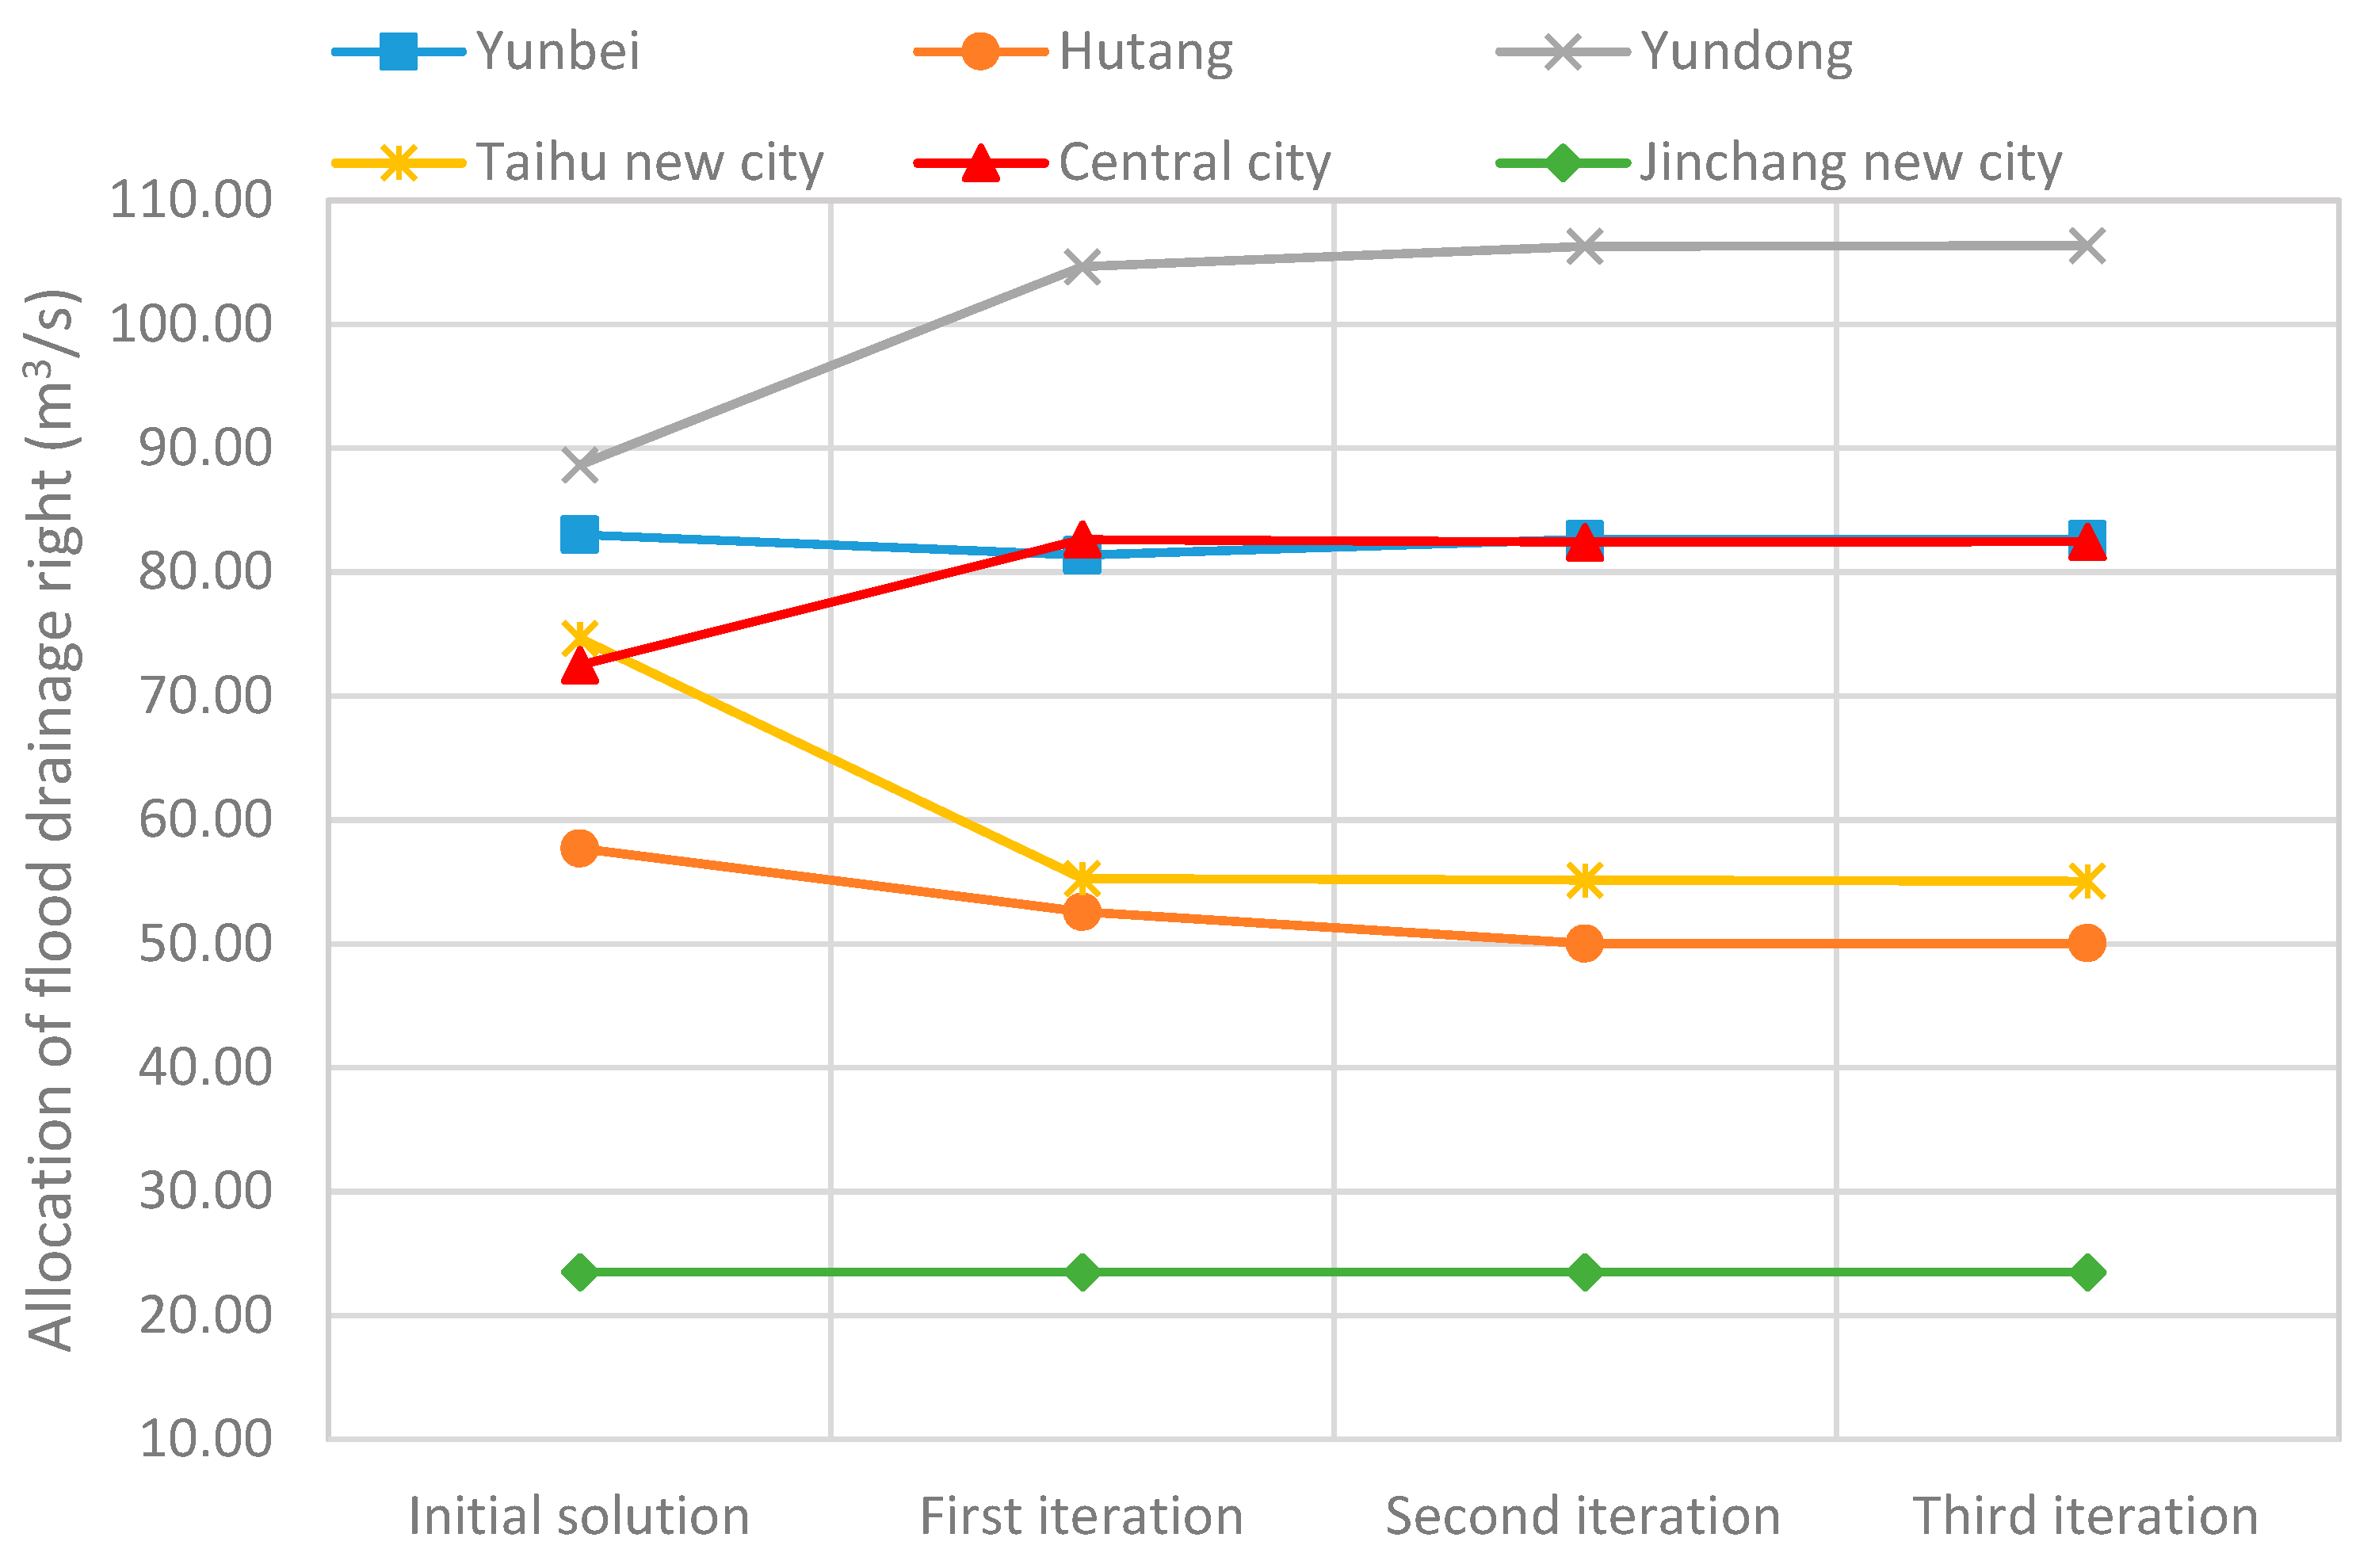
4.2.2. Iterative Process

Since the initial allocation scheme failed to reach the effective frontier, the master–slave hierarchical interactive iteration algorithm was used to allocate the flood drainage rights under total load. The drainage of those DMUs with efficiency values of less than 1 was redistributed.
In the first iteration, the proportion of flood drainage rights in Yunbei, Hutang, Taihu New City, and Central City was reduced according to the improved proportional increase strategy, and allocated to other regions according to Formula (12). The results of the first iteration showed that the allocation efficiency in each region was significantly improved and the number of regions reaching the frontier increased to 3. Compared with the initial solution, the allocation amount of Yunbei decreased and reached DEA efficiency. The allocation amounts of Hutang and Taihu New City decreased and their allocation efficiencies improved but not to the extent of DEA efficiency. The allocation amount of Central City increased and the allocation efficiency improved but failed to reach DEA efficiency. The efficiencies of Yundong and Jinchang New City remained at 1. After the first iteration, there were three regions that still had not reached the DEA effective state.
In the second iteration, the proportion of flood drainage rights in Hutang, Taihu New City, and Central City was reduced according to the improved proportional increase strategy, and allocated to other regions according to Formula (12). The results of the second iteration show that, the allocation quotas of Hutang and Central City decreased and reached DEA efficiency. The allocation efficiency of Taihu New City was close to the frontier while the allocation efficiency of Yunbei changed from DEA efficiency to non-DEA efficiency.
In the third iteration, the proportion of flood drainage rights in Yunbei and Taihu New City was reduced. After three iterations, the allocation efficiency reached DEA efficiency and the allocation scheme satisfied Formulas (8)–(11). The economic, social, and ecological benefits were F 1 ( W ) = 43.0368 × 10 4 , F 2 ( W ) = 17.2678 , and F 3 ( W ) = 0.3569 , respectively. The satisfaction degree of the comprehensive benefit was μ t ( F ( W ) ) = 0.9787 , which was greater than the satisfaction degree in the initial solution scheme (the satisfaction degree in the initial solution scheme was 0.8639). After the third iteration, all six regions reached an effective state (Figure 2).
The average allocation efficiencies of the six regions gradually increased from 0.8717 to 1 (Figure 3). After the first iteration, the average allocation efficiency of drainage right in six regions was significantly improved, with an increase of 11.40%.

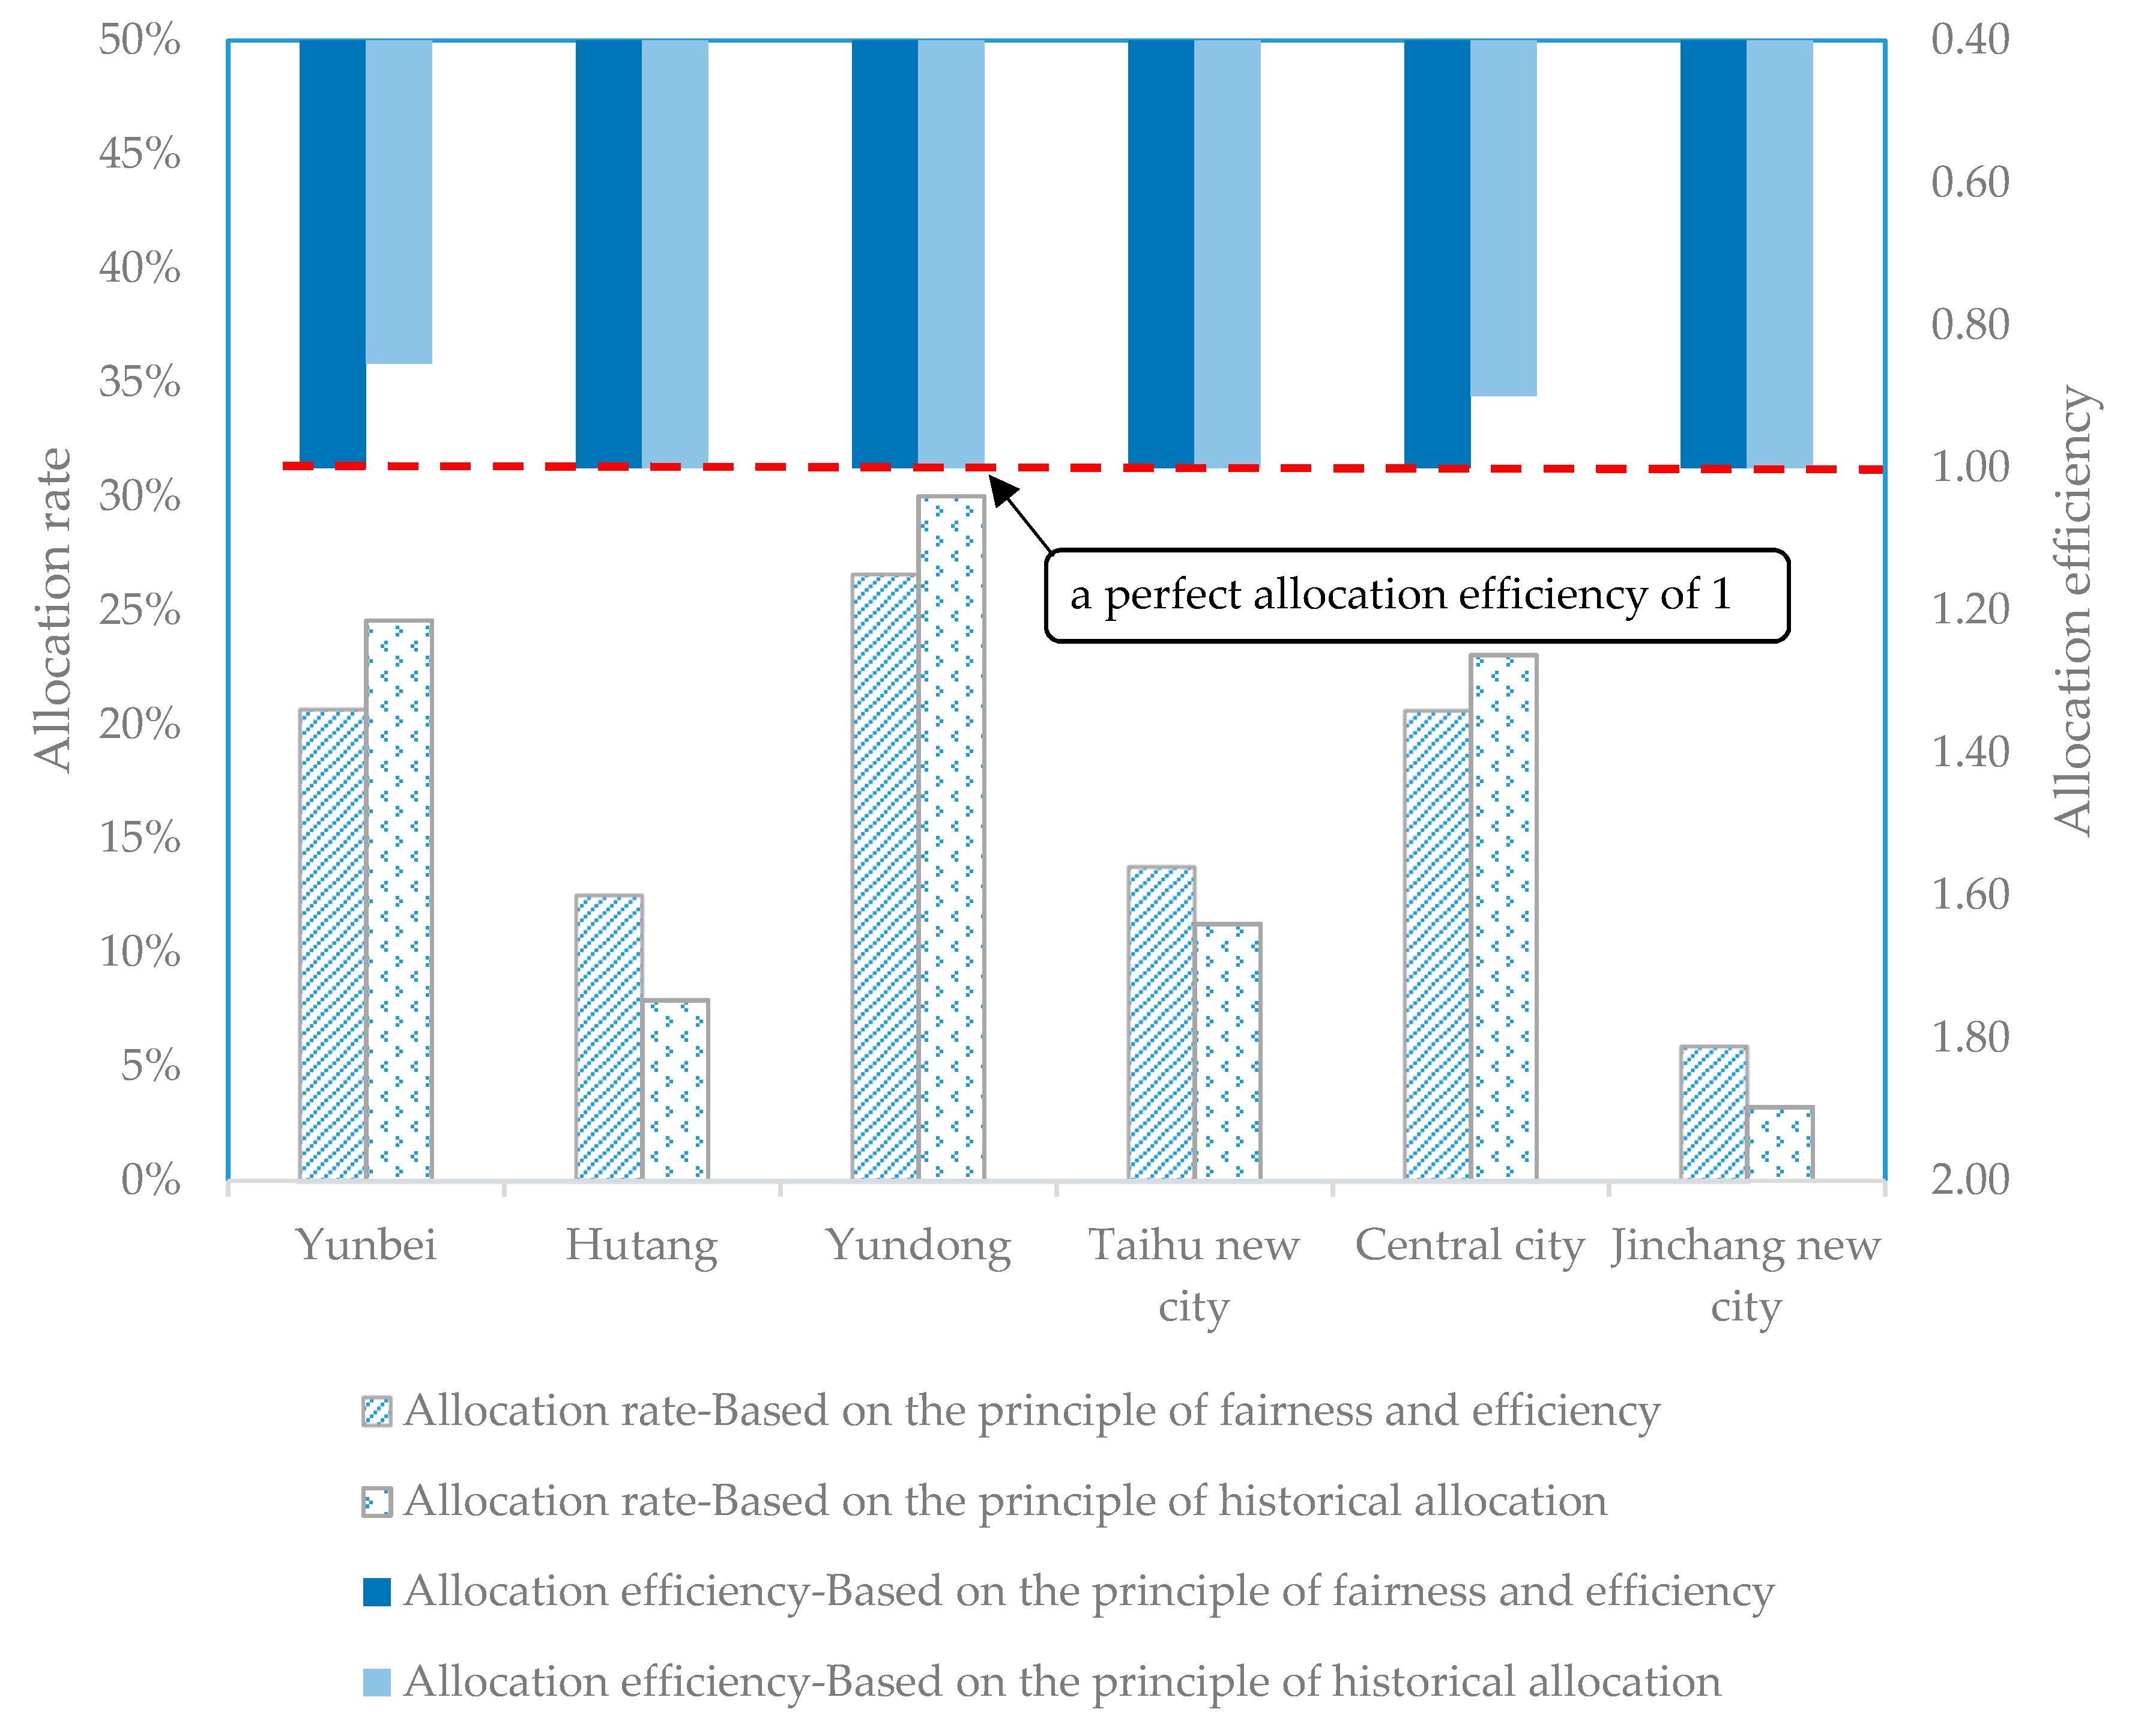
4.3. Evaluation of Allocation Results

According to the final results of the flood drainage rights allocation, the largest proportion of the allocation should be to the Yundong flood control region (26.59%), followed by Yunbei (20.66%) and Central City (20.61%). The comprehensive indexes of the social development in these three regions are relatively high and the demands for economic, social, and ecological development are strong, so the allocations of flood drainage rights are relatively higher.
The flood control regions with lower allocations include Taihu New City (13.76%), Hutang (12.51%), and Jinchang New City (5.88%). These three areas belong to the new city regions in Wuxi, Changzhou, and Suzhou, respectively. Compared with Yundong, Yunbei, and Central City, these three regions were relatively late in development and the comprehensive indexes of their social development were relatively lower. The historical flood drainage in the three regions is low and the demands for the allocation of flood drainage rights are relatively low. Therefore, the allocations of flood drainage rights are lower.
Different allocation principles may lead to different allocation results of flood drainage rights. In this study, the principle of flood drainage rights allocation was based on fairness and efficiency so the allocation result can be compared with the result based on the historical allocation principle (Figure 4). In Figure 4, the bars below represent the allocation rate, the hanging bars represent the allocation efficiency, and the red dashed line represents the allocation efficiency of 1.
(1) Allocation rate under different principles. By the principles of fairness and efficiency, the flood control region with the highest and lowest allocation rates are Yundong (26.59%) and Jinchang New City (5.88%), respectively. The difference between the highest and lowest rates is 20.71%. When allocated according to historical allocation principle, Yundong and Jinchang New City have the highest (30.01%) and lowest (3.22%) rates, respectively. The allocation rate of Yundong is higher than the rate based on the principle of fairness and efficiency, whereas the allocation rate of Jinchang New City is lower. The difference between the two regions increase to 26.79%. Under the historical allocation principle, the gap between the maximum and minimum allocation rates was larger.
(2) Allocation efficiency under different principles. With the principles of fairness and efficiency, the allocation efficiencies of the six regions were effective. When allocated according to the historical allocation principle, only Hutang, Yundong, Taihu New City, and Jinchang New City were effective, whereas the allocation efficiencies of Yunbei and Central City were 0.8534 and 0.8994, i.e., they had not reached the effective frontier.
Through the analysis of allocation proportion and allocation efficiency, it can be seen that the allocation effect of drainage rights based on the allocation principle of fairness and efficiency is better.

5. Conclusions

On the basis of the total load allocation of flood drainage rights, this study constructed a bi-level multi-objective programming model to distribute the flood drainage rights of the Sunan Canal in the Taihu Lake Basin. This study reflects the mutual influence and interaction between the principle of fairness and efficiency in the process of allocation and realized the harmonious allocation of flood drainage rights among the regions. After several iterations, the final adjustment results show that Yundong, Yunbei, and Central City should have higher allocations of flood drainage rights because of higher demands from economic, social, and ecological development. Taihu New City, Hutang, and Jinchang New City, respectively, belong to the new urban area of the Taihu Basin and have lower allocations of flood drainage rights. In the six regions, the allocation of flood drainage rights reached a fully effective state in the model. Compared to the results based on the historical allocation principle, the allocations based on the model of drainage rights constructed by this study are more reasonable. The bi-level multi-objective programming model of flood drainage rights allocation basically conforms to the current situation of social and economic development.
The main contribution of this study is its consideration of the social, economic, and ecological environments, flood drainage demand and efficiency, and other factors of different regions. This study constructed an allocation model of flood drainage rights based on the principles of fairness and efficiency. On the basis of the multi-objective optimal allocation method, the allocation efficiency of each region was calculated with the improved ZSG–DEA model and the drainage volume was adjusted by an improved proportional increase strategy. The allocation model is the combination and improvement of the multi-objective optimal allocation method, the allocation efficiency method, the proportional increase strategy, and other methods. This model was able to improve overall satisfaction and bring all cities up to 100% efficiency despite using substantially less water.
The flood and the drainage conflicts caused by it are widespread. The allocation scheme presented in this paper is only one of the ideas proposed for the allocation of flood drainage rights in China. Regarding the institutional background of water resources management in different countries and the flood drainage pressure faced by the regions, this paper presents the following suggestions: (1) The allocation of flood drainage rights should be comprehensively considered in combination with various factors. The single allocation principle cannot meet the rationality and scientific requirements of the flood drainage right of each region in the basin. In addition to the consideration of the drainage capacity of water conservancy projects, the rainfall distribution, flood drainage demand, as well as the socio-economic status and development needs of each region must be taken into account. In the future, the model should be further deepened on the basis of considering other relevant factors (such as location strategy, production, and living habits), so as to make theoretical research more compatible with reality. (2) Utilize the market mechanism to realize the allocation of flood drainage rights. After the confirmation of the allocation benchmark of the flood drainage rights, market transactions in the interior should be conducted according to the local drainage demand.

Author Contributions

Conceptualization, J.S. and F.S.; Data curation, Z.W. and K.Z.; Formal analysis, D.Z., Z.W. and L.L.; Methodology, D.Z. and B.L.; Writing–original draft, D.Z.; Writing–review & editing, D.Z. and B.L.

Funding

This research was funded by the Fundamental Research Funds for the Central Universities, grant number 2019B69214; Postgraduate Research & Practice Innovation Program of Jiangsu Province, grant number SJKY19_0408; the National Natural Science Foundation of China (No.71801130); Jiangsu Social Science Foundation Project (18GLD013).

Conflicts of Interest

The authors declare no conflict of interest.

References

  1. Warner, K.; Zommers, Z.; Wreford, A.; Hurlbert, M.; Viner, D.; Scantlan, J.; Halsey, K.; Halsey, K.; Tamang, C. Characteristics of transformational adaptation in climate-land-society interactions. Sustainability 2019, 11, 356. [Google Scholar] [CrossRef]
  2. Zhou, X.; Zheng, B.; Khu, S. Validation of the hypothesis on carrying capacity limits using the water environment carrying capacity. Sci. Total Environ. 2019, 665, 774–784. [Google Scholar] [CrossRef] [PubMed]
  3. Kim, H.; Lee, J.W.; Yoon, K.; Cho, Y. Numerical analysis of flood risk change due to obstruction. KSCE J. Civ. Eng. 2012, 16, 207–214. [Google Scholar] [CrossRef]
  4. Gaurav, K.; Sinha, R.; Panda, P.K. The Indus flood of 2010 in Pakistan: A perspective analysis using remote sensing data. Nat. Hazards 2011, 59, 1815–1826. [Google Scholar] [CrossRef]
  5. Yang, Y.; Bai, L.; Wang, B.; Wu, J.; Fu, S. Reliability of the global climate models during 1961–1999 in arid and semiarid regions of China. Sci. Total Environ. 2019, 667, 271–286. [Google Scholar] [CrossRef] [PubMed]
  6. Song, X.; Shi, P.; Jin, R. Analysis on the Contradiction between Supply and Demand of Water Resources in China Owing to Uneven Regional Distribution. Arid Zone Res. 2005, 2, 162–166. [Google Scholar]
  7. Chou, J.; Xian, T.; Dong, W.; Xu, Y. Regional temporal and spatial trends in drought and flood disasters in China and assessment of economic losses in recent years. Sustainability 2019, 11, 55. [Google Scholar] [CrossRef]
  8. Fang, J.; Kong, F.; Fang, J.; Zhao, L. Observed changes in hydrological extremes and flood disaster in Yangtze River Basin: Spatial-temporal variability and climate change impacts. Nat. Hazards 2018, 93, 89–107. [Google Scholar] [CrossRef]
  9. Su, Z.; Hao, Z.; Yuan, F.; Chen, X.; Cao, Q. Spatiotemporal variability of extreme summer precipitation over the Yangtze River Basin and the associations with climate patterns. Water 2017, 9, 873. [Google Scholar] [CrossRef]
  10. Al-Jawad, J.Y.; Alsaffar, H.M.; Bertram, D.; Kalin, R.M. A comprehensive optimum integrated water resources management approach for multidisciplinary water resources management problems. J. Environ. Manag. 2019, 239, 211–224. [Google Scholar] [CrossRef]
  11. Soderholm, K.; Pihlajamaki, M.; Dubrovin, T.; Veijalainen, N.; Vehvilainen, B.; Marttunen, M. Collaborative planning in adaptive flood risk management under climate change. Water Resour. Manag. 2018, 32, 1383–1397. [Google Scholar] [CrossRef]
  12. Lee, E.H.; Kim, J.H. Design and operation of decentralized reservoirs in urban drainage systems. Water 2017, 9, 246. [Google Scholar] [CrossRef]
  13. Ohana-Levi, N.; Givati, A.; Alfasi, N.; Peeters, A.; Karnieli, A. Predicting the effects of urbanization on runoff after frequent rainfall events. J. Land Use sci. 2018, 13, 81–101. [Google Scholar] [CrossRef]
  14. Cutter, S.L.; Emrich, C.T.; Gall, M.; Reeves, R. Flash flood risk and the paradox of urban development. Nat. Hazards Rev. 2018, 19, 05017005. [Google Scholar] [CrossRef]
  15. Monsieurs, E.; Dessie, M.; Adgo, E.; Poesen, J.; Deckers, J.; Verhoest, N.; Nyssen, J. Seasonal surface drainage of sloping farmland: A review of its hydrogeomorphic impacts. Land Degrad. Dev. 2015, 26, 35–44. [Google Scholar] [CrossRef]
  16. Qin, H.; Zhou, J.; Lu, Y.; Li, Y.; Zhang, Y. Multi-objective cultured differential evolution for generating optimal trade-offs in reservoir flood control operation. Water Resour. Manag. 2010, 24, 2611–2632. [Google Scholar] [CrossRef]
  17. Schmitt, T.G.; Thomas, M.; Ettrich, N. Analysis and modeling of flooding in urban drainage systems. J. Hydrol. 2004, 299, 300–311. [Google Scholar] [CrossRef]
  18. Freni, G.; Mannina, G.; Viviani, G. Uncertainty assessment of an integrated urban drainage model. J. Hydrol. 2009, 373, 392–404. [Google Scholar] [CrossRef]
  19. Yu, F.; Wang, Y.; Yuan, X.; Jiang, S. Preliminary study on concept and its basic characteristics of flood drainage right. J. Irrig. Drain. 2014, 33, 134–137. [Google Scholar]
  20. Bohringer, C.; Lange, A. Economic implications of alternative allocation schemes for emission allowances. Scand. J. Econ. 2005, 107, 563–581. [Google Scholar] [CrossRef]
  21. Anger, N.; Brouns, B.; Onigkeit, J. Linking the EU emissions trading scheme: Economic implications of allowance allocation and global carbon constraints. Mitig. Adapt. Strateg. Glob. Chang. 2009, 14, 379–398. [Google Scholar] [CrossRef]
  22. Binesh, N.; Niksokhan, M.H.; Sarang, A.; Rauch, W. Improving sustainability of urban drainage systems for climate change adaptation using best management practices: A case study of Tehran, Iran. Hydrol. Sci. J. 2019, 64, 381–404. [Google Scholar] [CrossRef]
  23. Yu, F.; Wang, Y.; Yuan, X. Preliminary study on the reasonable allocation of flood drainage right for midstream of Huaihe River. In Applied Mechanics and Materials; Scientific.net: Zurich, Switzerland, 2013; pp. 2208–2212. [Google Scholar]
  24. Kumar, D.N.; Baliarsingh, F.; Raju, K.S. Optimal reservoir operation for flood control using folded dynamic programming. Water Resour. Manag. 2010, 24, 1045–1064. [Google Scholar] [CrossRef]
  25. Hashemi, H.; Bazargan, J.; Mousavi, S.M.; Vandani, B. An extended compromise ratio model with an application to reservoir flood control operation under an interval-valued intuitionistic fuzzy environment. Appl. Math. Model 2014, 38, 3495–3511. [Google Scholar] [CrossRef]
  26. Wondimagegnehu, D.; Tadele, K. Evaluation of climate change impact on Blue Nile Basin Cascade Reservoir operation—Case study of proposed reservoirs in the Main Blue Nile River Basin, Ethiopia. PIAHS 2015, 366, 133. [Google Scholar] [CrossRef]
  27. Lohr, H.; Abebe, M. Coordinated reservoir operation of cascade dams in the Nile basin in a politically sensitive environment. Wasserwirtschaft 2019, 109, 186–189. [Google Scholar] [CrossRef]
  28. De Paes, R.P.; Boccia Brandao, J.L. Flood control in the Cuiaba River Basin, Brazil, with multipurpose reservoir operation. Water Resour. Manag. 2013, 27, 3929–3944. [Google Scholar] [CrossRef]
  29. Le Tuan, N.; Sugio, S. Flood control measures in the Red River basin and numerical simulation of their operation. PIAHSS 2001, 272, 341–348. [Google Scholar]
  30. Toth, E.; Brath, A.; Montanari, A. Comparison of short-term rainfall prediction models for real-time flood forecasting. J. Hydrol. 2000, 239, 132–147. [Google Scholar] [CrossRef]
  31. Tokar, A.S.; Johnson, P.A. Rainfall-runoff modeling using artificial neural networks. J. Hydrol. Eng. 1999, 4, 232–239. [Google Scholar] [CrossRef]
  32. Brouwer, R.; Akter, S.; Brander, L.; Haque, E. Socioeconomic vulnerability and adaptation to environmental risk: A case study of climate change and flooding in Bangladesh. Risk Anal. 2007, 27, 313–326. [Google Scholar] [CrossRef] [PubMed]
  33. Hegger, D.L.T.; Driessen, P.P.J.; Dieperink, C.; Wiering, M.; Raadgever, G.T.T.; van Rijswick, H.F.M.W. Assessing stability and dynamics in flood risk governance an empirically illustrated research approach. Water Resour. Manag. 2014, 28, 4127–4142. [Google Scholar] [CrossRef]
  34. Foudi, S.; Oses-Eraso, N.; Tamayo, I. Integrated spatial flood risk assessment: The case of Zaragoza. Land Use Policy 2015, 42, 278–292. [Google Scholar] [CrossRef]
  35. Cheng, C.T.; Chau, K.W. Fuzzy iteration methodology for reservoir flood control operation. J. Am. Water Resour. Assoc. 2001, 37, 1381–1388. [Google Scholar] [CrossRef]
  36. Wei, C.; Hsu, N. Optimal tree-based release rules for real-time flood control operations on a multipurpose multireservoir system. J. Hydrol. 2009, 365, 213–224. [Google Scholar] [CrossRef]
  37. Che, D.; Mays, L.W. Development of an optimization/simulation model for real-time flood-control operation of river-reservoirs systems. Water Resour. Manag. 2015, 29, 3987–4005. [Google Scholar] [CrossRef]
  38. Valeriano, O.C.S.; Koike, T.; Yang, K.; Yang, D. Optimal dam operation during flood season using a distributed hydrological model and a heuristic algorithm. J. Hydrol. Eng. 2010, 15, 580–586. [Google Scholar] [CrossRef]
  39. Lee, S.; Fitzgerald, C.J.; Hamlet, A.F.; Burges, S.J. Daily time-step refinement of optimized flood control rule curves for a global warming scenario. J. Water Resour. Plan. Manag. ASCE 2011, 137, 309–317. [Google Scholar] [CrossRef]
  40. Niewiadomska-Szynkiewicz, E.; Blaszczyk, J. Simulation-based optimization methods applied to large scale water systems control. In Proceedings of the 2016 International IEEE Conferences on Ubiquitous Intelligence & Computing, Advanced and Trusted Computing, Scalable Computing and Communications, Cloud and Big Data Computing, Internet of People, and Smart World Congress (UIC/ATC/ScalCom/CBDCom/IoP/SmartWorld), Toulouse, France, 18–21 July 2016; pp. 649–656. [Google Scholar]
  41. Che, D.; Mays, L.W. Application of an optimization/simulation model for real-time flood-control operation of river-reservoirs systems. Water Resour. Manag. 2017, 31, 2285–2297. [Google Scholar] [CrossRef]
  42. Prakash, O.; Srinivasan, K.; Sudheer, K.P. Adaptive multi-objective simulation-optimization framework for dynamic flood control operation in a river-reservoir system. Hydrol. Res. 2015, 46, 893–911. [Google Scholar] [CrossRef]
  43. Al-Jawad, J.Y.; Alsaffar, H.M.; Bertram, D.; Kalin, R.M. Optimum socio-environmental flows approach for reservoir operation strategy using many-objectives evolutionary optimization algorithm. Sci. Total Environ. 2019, 651, 1877–1891. [Google Scholar] [CrossRef] [PubMed]
  44. Johnson, D.; Geisendorf, S. Are neighborhood-level SUDS worth it? An assessment of the economic value of sustainable urban drainage system scenarios using cost-benefit analyses. Ecol. Econ. 2019, 158, 194–205. [Google Scholar] [CrossRef]
  45. Jimenez Ariza, S.L.; Alejandro Martinez, J.; Felipe Munoz, A.; Pablo Quijano, J.; Pablo Rodriguez, J.; Alejandro Camacho, L.; Diaz-Granados, M. A multicriteria planning framework to locate and select sustainable urban drainage systems (suds) in consolidated urban areas. Sustainability 2019, 11, 2312. [Google Scholar] [CrossRef]
  46. Malekmohammadi, B.; Zahraie, B.; Kerachian, R. Ranking solutions of multi-objective reservoir operation optimization models using multi-criteria decision analysis. Expert. Syst. Appl. 2011, 38, 7851–7863. [Google Scholar] [CrossRef]
  47. Syme, G.J.; Nancarrow, B.E. Achieving Sustainability and fairness in water reform: A Western Australian case study. Water Int. 2006, 31, 23–30. [Google Scholar] [CrossRef]
  48. Wodraska, J.W. Water: Resource or commodity. J. Am. Water Work. Assoc. 2006, 98, 86–90. [Google Scholar] [CrossRef]
  49. Paredes-Arquiola, J.; Martinez-Capel, F.; Solera, A.; Aguilella, V. Implementing environmental flows in complex water resources systems case study: the Duero river basin, Spain. River Res. Appl. 2013, 29, 451–468. [Google Scholar] [CrossRef]
  50. Colson, B.; Marcotte, P.; Savard, G. An overview of bilevel optimization. Ann. Oper. Res. 2007, 153, 235–256. [Google Scholar] [CrossRef]
  51. Floudas, C.A.; Gounaris, C.E. A review of recent advances in global optimization. J. Glob. Optim. 2009, 45, 3–38. [Google Scholar] [CrossRef]
  52. Garces, L.P.; Conejo, A.J.; Garcia-Bertrand, R.; Romero, R. A bilevel approach to transmission expansion planning within a market environment. IEEE Trans. Power Syst. 2009, 24, 1513–1522. [Google Scholar] [CrossRef]
  53. Shaker, R.R.; Zubalsky, S.L. Examining patterns of sustainability across Europe: A multivariate and spatial assessment of 25 composite indices. Int. J. Sustain. Dev. World 2015, 22, 1–13. [Google Scholar] [CrossRef]
  54. Yu, Q.; Wu, F. Bi-level programming model of provincial carbon emissions allocation from the coupling perspective of fairness and efficiency. Soft Sci. 2018, 32, 72–76. [Google Scholar]
  55. Charnes, A.; Cooper, W.W.; Rhodes, E. Measuring the efficiency of decision making units. Eur. J. Oper. Res. 1978, 2, 429–444. [Google Scholar] [CrossRef]
  56. Cook, W.D.; Seiford, L.M. Data envelopment analysis (DEA)—Thirty years on. Eur. J. Oper. Res. 2009, 192, 1–17. [Google Scholar] [CrossRef]
  57. Lins, M.; Gomes, E.G.; de Mello, J.; de Mello, A. Olympic ranking based on a zero sum gains DEA model. Eur. J. Oper. Res. 2003, 148, 312–322. [Google Scholar] [CrossRef] [Green Version]
  58. Gomes, E.G.; Lins, M.P.E. Modelling undesirable outputs with zero sum gains data envelopment analysis models. J. Oper. Res. Soc. 2008, 59, 616–623. [Google Scholar] [CrossRef]
Figure 1. Sunan Canal and urban flood control regions.
Water 11 01769 g001
Figure 2. Allocation process of flood drainage right in Sunan Canal.
Water 11 01769 g002
Figure 3. Average efficiency of flood drainage right allocation.
Water 11 01769 g003
Figure 4. Allocation rates and efficiencies under different allocation principles.
Water 11 01769 g004
Table 1. Urban flood control systems of Sunan Canal.
CityFlood Control SystemsTotal Scale (m3/s)Flow Discharged Directly into Sunan Canal (m3/s)
ChangzhouYunbei420.96179.00
Hutang78.1057.70
Subtotal499.06236.70
WuxiYundong485.60218.80
Taihu New City97.0082.00
Subtotal582.60300.80
SuzhouCentral City286.50168.00
Jinchang New City39.1023.50
Subtotal325.60191.50
Total1407.26729.00
Table 2. Socio-economic development indicators of flood control regions.
Flood Control RegionPopulation (Tens of Thousands)GDP (RMB 100 Million)Land Area (km2)
Yunbei101.381308.09156.20
Hutang50.00221.0184.00
Yundong138.841973.24144.00
Taihu New City57.60779.81139.10
Central City101.51694.0384.00
Jinchang New City7.6053.0213.70
Table 3. Comprehensive index of regional social development.
Flood Control RegionYunbeiHutangYundongTaihu New City Central CityJinchang New City
Comprehensive index of social development0.19670.14310.21510.17100.16480.1093
Table 4. Allocations and efficiencies of flood drainage rights.
Flood Control RegionInitial SolutionFirst IterationSecond IterationThird IterationAdjustment Mode (m3/s)
Allocation (m3/s)EfficiencyAllocation (m3/s)EfficiencyAllocation (m3/s)EfficiencyAllocation (m3/s)Efficiency
Yunbei83.010.843881.361.000082.650.999482.62 1.0000–0.39
Hutang57.700.772052.580.944550.021.000050.04 1.0000–7.66
Yundong88.641.0000104.651.0000106.291.0000106.34 1.000017.7
Taihu New City74.640.647355.280.984255.130.998455.05 1.0000–19.59
Central City72.500.967082.630.985782.411.000082.45 1.00009.95
Jinchang New City23.501.000023.501.000023.501.000023.50 1.00000.00
Total400.00-400.00-400.00-400.00--

