Evaluating the Risk-Based Performance of Bioinfiltration Facilities under Climate Change Scenarios


1
Senior Water Resources Engineer, OptiRTC, Boston, MA 02116, USA
2
College of Engineering, Villanova University, Villanova, PA 19085, USA
*
Author to whom correspondence should be addressed.
Water 2019, 11(9), 1765; https://doi.org/10.3390/w11091765
Submission received: 13 July 2019
/
Revised: 13 August 2019
/
Accepted: 20 August 2019
/
Published: 24 August 2019
(This article belongs to the Section Urban Water Management)
Abstract
:Many communities throughout the world are utilizing green infrastructure practices to mitigate the projected impacts of climate change. While some areas of the world are anticipating droughts, other areas are preparing for an increased flood risk, due to changes in precipitation volume and intensity. Cities rely on practices such as bioinfiltration to sustainably capture stormwater runoff and provide resilience against climate change. As cities aim to increase resilience and decrease climate-change-associated risks, a greater understanding of these risks is needed. A risk-based approach was used to evaluate bioinfiltration design and performance. Climate projections from the Couple Model Intercomparison Project Phase 5 were used to create near-term (2020–2049) and long-term (2050–2079) climate datasets for Philadelphia, Pennsylvania, using two representative concentration pathways (RCPs 2.6 and 8.5). Both near-term and long-term climate models demonstrated increased precipitation and daily temperatures, similar to other areas in the U.S. Northeast, Midwest, Great Plains, and Alaska. Climate data were used to model bioinfiltration practices using continuous simulation hydrologic models. Overflow events and cumulative risk increased from bioinfiltration sites when compared to the baseline scenario (1970–1999). This study demonstrates how to apply a risk-based approach to bioinfiltration design using climate projections and provides recommendations to increase resilience in bioinfiltration design.
1. Introduction
Climate change is a global issue characterized by increasing temperatures, rising sea levels, and changes in rainfall patterns. While certain areas of the U.S. are experiencing significant droughts, many areas in the eastern U.S. are preparing for increased extreme rainfall events, due to greater rainfall depths and intensity resulting from climate change [1,2] Growing populations and urbanization compound the issue of managing excess rainfall safely and sustainably. If increased rainfall occurs, risks of flooding could drastically increase throughout the world [3,4]. As a result, the U.S. Environmental Protection Agency (EPA) and the U.S. Army Corps of Engineers (USACE) are developing sustainable practices to provide resilience against impacts resulting from climate change [5,6]
As cities aim to enact more resilient stormwater management plans under changing climate conditions, a well-defined understanding of the acceptable risk associated with the design of green infrastructure (GI) practices—which target the smaller, more frequent events—is needed. Engineering risk assessment is based on the likelihood of system failure occurring, and the potential damages associated with system failure [7]. While risk assessment is well-defined for larger flood management infrastructure systems [8,9], that is not the case for GI. Accounting for and increasing adaptive capacity in GI systems could potentially decrease risk, by decreasing system failure likelihood and resultant damages. A risk assessment of infiltrating GI practices enables current design standards and regulatory risks to be quantified and indicates how increases in adaptive capacity may increase resilience and result in a lower risk of flood-related damages. The goal of this study is to inform planning and design to reliably meet current acceptable risk levels by evaluating bioinfiltration GI systems’ performances under baseline and climate change conditions.
1.1. Impacts Due to Climate Change
In the U.S., recent decades have seen an increase in average annual rainfall in the Midwest, Northeast, Great Plains, and Alaska [1]). Increases in temperature and precipitation in parts of the U.S. are expected to continue because of climate change [1,10,11]. For example, long-term climate projections predict a likely increase in mean annual precipitation for high latitude portions of North America by the mid-21st century, and a decrease in the southern portions of the U.S. ([1,2]. Flooding is projected to increase because of more precipitation and increased urbanization (i.e., imperviousness) and could worsen if cities do not have the infrastructure to combat the impacts of climate change [1]. The combination of the expansion of impervious areas, the potential for increased annual rainfall and the likelihood of increased heavy precipitation events, rising sea levels, and aging infrastructure will challenge U.S. cities’ flood resilience and require adaptation measures that reduce flood risk and water quality problems [10,12,13].
It is important for urban areas to quantify and understand the risk associated with climate change-induced precipitation changes to inform comprehensive stormwater management design and policy. The impacts of climate change and the need for the implementation of sustainable and resilient water resources practices have shown the importance of risk analysis and assessment over the last several decades [14]. In their Fourth Assessment report (2007), the IPCC suggested that the response to climate change should involve a risk-management-based approach that includes adaptions to, and the mitigation of, risk.
1.2. Green Infrastructure Adaptation
Green infrastructure (GI) is implemented in many locations (e.g., Philadelphia, New York, Toronto, and Washington D.C.) as an adaptation tool to mitigate risks and increase resilience against climate change [15,16,17,18]. Implementing GI measures, such as rain gardens, swales, green roofs, and infiltration trenches, can be considered a “no-regret” action, because GI is valuable—even if the impacts of climate change are not severe—and is a flexible, decentralized approach to adaptation [2,19,20].
Green infrastructure systems are typically designed to capture and locally manage the first 2.5–3.8 cm of a rainfall event from a drainage area and reduce runoff [21,22,23]. The target volume is based upon localized flooding, water quality capture and downstream erosive velocities [23,24,25,26]. Green infrastructure volume reduction is often credited based on the above ground storage volume and media layer storage potential in a GI system [24,25]. Green infrastructure practices can perform beyond their design capacity due to natural processes, such as infiltration and evapotranspiration (ET), that increase their potential for resilience and flood risk reduction [27,28,29,30]. Specifically, bioinfiltration practices have demonstrated an ability to capture runoff and reduce overflow events beyond the expected design performance [31,32].
Previous research has shown the beneficial impact of green infrastructure in climate change scenarios—in particular, demonstrating that GI practices implemented throughout an urban watershed help to manage additional runoff due to climate change and prevent combined sewer overflows [19,20,33]. Pyke et al. [20] assessed several types of site design (including low-impact site design) under several climate change scenarios and demonstrated potential annual changes in pollutant loads and stormwater runoff volumes. Franczyk and Chang [34] used monthly change factors to evaluate seasonal and monthly variations in runoff depth from several land use scenarios. Hathaway et al. [35] found that overflows for bioretention systems under climate change scenarios increased by between 60% and 136% when compared to a base climate condition. Further, Hathaway et al. [35] demonstrated the ability of larger ponding volumes and high infiltration in bioretention practices to reduce overflow volumes. Further quantification of the potential impacts of climate change is needed to inform the design of GI practices to reduce performance risk.
While GI effectiveness is evident, its stormwater management application has been treated separately from more traditional flood management. One key difference is that flood management uses a risk-based approach to inform design [8,36,37,38], but GI designs do not undergo the same type of analysis. Further, cities and municipalities are being tasked with implementing GI that will economically aid long-term stormwater management under changing climate conditions, but there is no commonly accepted procedure to do this. For climate change adaption, using a risk-based approach can serve as a guide to policy and action, while reducing risk from high- and low-probability events [39]. This present research focuses on informing design decisions that reduce risk from higher-probability rainfall events, through the evaluation of bioinfiltration performance under several climate scenarios. The goal of this research is to use the previously presented risk-based approach [40] to work within a framework to systematically identify potential increases in risk due to climate change and recommend bioinfiltration design adjustments that can increase resilience and decrease risk. Bioinfiltration design recommendations are provided to assist planners and designers in meeting present-day acceptable risk standards under climate change scenarios. This risk-based approach can be used in conjunction with other information, such as cost, pollutant loads, or overflow events to determine acceptable risk and to assist communities in planning and design [40].
2. Methods
The risk-based approach discussed in Lewellyn and Wadzuk [40] was used for this analysis, which uses long-term climate data and continuous simulations of a hydrologic GI model. Similarly to Lewellyn and Wadzuk [41], RECARGA [41] and SWMM Version 5.1 [42]) were used to model an array of simulated bioinfiltration designs and the Villanova treatment train—a series of vegetated and subsurface GI practices. For the present analysis, climate change scenarios were developed and used as an input for each hydrologic model.
As previously noted, many locations in the U.S. have experienced increases in precipitation and in locations in the Northeast U.S.; these increases are expected to continue [1,43,44]. To develop the long-term climate data, Philadelphia, Pennsylvania, was chosen as a representative example of potential impacts due to climate change, due to its location in the Northeast and estimated increases in precipitation. The results are discussed in the context of Philadelphia, Pennsylvania, although the same methodology can be applied to any baseline dataset, regardless of projected climate change impact.
2.1. Climate Projections
Climate projections were obtained from the Couple Model Intercomparison Project Phase 5 (CMIP5) [45]. Downscaled CMIP5 climate projections were obtained for precipitation, and minimum and maximum air temperature at an approximately 12 km × 12 km spatial resolution [45]. These projections were used to create change factors that can be applied to existing precipitation and temperature data to develop future projections. The Change Factor Method (CFM) uses a location-specific long-term, historical baseline dataset to estimate forecasted precipitation or temperature changes with a General Circulation Model (GCM) or Regional Climate Model (RCM) [46]. The primary CFM assumption is that the spatial pattern and the rainfall range and variability remain unchanged [46]. The additive CFM finds the average difference between the baseline parameter and the GCM/RCM, which is added to the baseline record to determine the estimated parameter record [46]. The multiplicative CFM finds the ratio of the average GCM/RCM estimate to the baseline parameter, which is multiplied by the baseline parameter to obtain an estimated parameter record [46]. The additive CFM is typically used for temperature projections, while the multiplicative CFM is typically used for precipitation [47,48,49,50]. Change Factor Methods are widely used due to the ease of application and the direct scaling of local precipitation and temperature data using GCM projections [47].
Climate projections from the CMIP5 multi-model ensemble dataset results were used as the GCM/RCM to derive the monthly temperature and precipitation change factors [45,51]. Table 1 provides a summary of the climate models used for this research. The change factors were applied to the baseline period (1970–1999) to establish climate projections for future evaluation periods (e.g., 2020–2049 and 2050–2079) and radiative forcing scenarios (Representative Concentration Pathways) based on emissions, concentrations and land use trajectories [52]. The two radiative forcing scenarios provided a range of uncertainty for the risk assessment by defining a “lower bound” (RCP 2.6) and an “upper bound” (RCP 8.5). Monthly precipitation and temperature averages were adjusted based on a comparison of CMIP5 average values for the baseline period (1970–1999) to historical values from the Philadelphia International Airport (PIA) National Climatic Data Center (NCDC) weather station [53], to correct bias in the monthly average values. A multiplicative change factor was used to correct bias in precipitation values, while an additive change factor was used to correct bias in temperature values. These adjustments were applied to CMIP5 projections to correct the change factors used in this analysis.
Mean, maximum, and minimum monthly and daily temperature measurements were used to compute the potential evapotranspiration (PET) that is used in a hydrologic model. Potential evapotranspiration was calculated using the Hargreaves equation, which uses a daily temperature range, daily average temperature, and extraterrestrial radiation [54]. Monthly averages for maximum and minimum temperatures from the CMIP5 ensemble data for both RCP 2.6 and RCP 8.5 scenarios were calculated. An additive change factor was determined for monthly maximum and minimum temperatures and applied to daily baseline temperature data, to obtain projections for the future evaluation periods.
Monthly, daily, and hourly precipitation records were obtained for the PIA weather station. Similarly to the temperature data, monthly rainfall averages for the baseline period were compared to the CMIP5 model ensemble results to determine the accuracy of the precipitation projections. The multiplicative change factor is applied to hourly rainfall data to simulate rainfall events.
Base, near-, and long-term projections for the PIA station were used as a model input for bioinfiltration modeling. The simulated bioinfiltration sites were modeled to show a range of possible bioinfiltration design performance under climate change scenarios. The observed bioinfiltration site (the Villanova treatment train) was used to provide an example of calibrated model performance under climate change scenarios.
2.2. Bioinfiltration Modeling
RECARGA was used to model simulated bioinfiltration sites [41,55]. A 930 m2 drainage area was used to generate runoff to each simulated bioinfiltration model. Each simulated bioinfiltration practice was sized with a surface area of 93 m2 to provide a 10:1 drainage area to bioinfiltration area. The 10:1 drainage area to bioinfiltration area was used to represent a design-loading ratio common in bioinfiltration implementation [25,26,56,57]. Runoff from the drainage area was modeled using the NRCS, CN methodology [58]. The drainage area to bioinfiltration sites was modeled as a 100% impervious surface (CN = 98). Bioinfiltration designs were varied in RECARGA to provide a range of performance results. Designs of simulated bioinfiltration practices from Lewellyn and Wadzuk [41] were used as part of the present analysis (Table 2).
A Villanova University bioinfiltration system (referred to as the treatment train) has observed data from July 2012 to December 2017 and was also evaluated using the risk-based methodology. The bioinfiltration treatment train system was designed for a 25 mm storm with a 7.5:1 drainage area to GI area ratio, and includes a vegetated swale (7.0 mm rainfall depth design capture), two rain gardens in series (10.0 mm), and an infiltration trench (IT; 8.0 mm) [31]. The treatment train has a 930 m2, 100% impervious drainage area (upper level of a nearby parking garage), and the entire system (IT and vegetated portion).
The treatment train was modeled using EPA SWMM [42] because of the ability to model multiple GI practices within the same simulation. The vegetated portion of the treatment train and the infiltration trench were modeled as separate storage units with seepage losses to represent infiltration. A previous study at the treatment train [31] found that increases and decreases in temperature had a significant impact on infiltration rates. Therefore, multiplicative factors were used to adjust infiltration rates on a monthly basis. The treatment train model was calibrated against observed data between January 2013 and May 2015.
Model results from the simulated and observed bioinfiltration sites were used for the risk determination process. The purpose of computing risk for these sites was to determine the potential impact of climate change on overflow and risk, and to inform the methods by which bioinfiltration designs could be adapted to future risks caused by the impacts of climate change.
2.3. Risk Determination
The risk-based approach used in this study follows the same methodology used in Lewellyn and Wadzuk [40]. Bioinfiltration design risk (i.e., annual overflow volume, Vtotal,v/t) is the product of the annual number of occurrences for a specific rainfall depth (Ov), the probability of overflow for that specific rainfall depth (Pover,v), and the average volume of overflow experienced for a specific depth of rainfall (Vavg,v) (Equation (1)).
Precipitation data from baseline and climate change scenarios were used to determine Ov. Hydrologic modeling was performed for simulated and actual bioinfiltration sites to determine Pover,v and Vavg,v.
The summed risk for each rainfall depth over the analysis period (t) is used to calculate the cumulative risk for a particular bioinfiltration design (Equation (2)). The parameter “i” represents each increment of rainfall depth.
Cumulative risk can be used on its own or with other information, such as published event mean concentrations, to determine acceptable risk (as demonstrated in [40]). Further, the risk-based method can easily be altered by removing the Vavg,v parameter from the risk determination. This represents overflow event per year and could be used by combined sewer communities to evaluate acceptable risk and bioinfiltration performance.
The acceptable risk was defined using a predevelopment scenario. The predevelopment scenario was used to represent the land use and soil type of a watershed prior to construction and development (i.e., the addition of impervious surfaces and potential soil compaction) taking place [59,60]. This scenario is often represented as a wooded or meadow area in conjunction with local historic soil information [25,26,59,60,61]. (Predevelopment conditions were modeled to match the GI systems drainage area as a meadow in “good” condition, with hydrologic group “B” soil (CN = 55) using the Natural Resource Conservation Service (NRCS) runoff curve number (CN) methodology [58]. This scenario was deemed suitable to use to develop the acceptable risk to correspond to local guidelines [25,26].
3. Results
Hydrologic modeling was performed for both simulated bioinfiltration sites and the Villanova treatment train using the baseline and four climate projection datasets for Philadelphia, Pennsylvania. The risk (Equation (1)) was calculated for each simulation and analyzed. The results are discussed in the context of this example, but the analysis procedure is applicable to any dataset.
3.1. Climate Modeling
Each climate scenario (RCP 2.6 and 8.5 for 2020–2049 and 2050–2079) for Philadelphia produced an increased average annual rainfall, average maximum daily temperature, and average minimum daily temperature over the baseline period (Table 3). Average annual rainfall increased by between 11.4% (near-term projections) and 15.7% (long-term projections) compared to the baseline period. Increases in average annual rainfall were less drastic when comparing climate change scenarios. The difference in average annual rainfall between each near-term (2020–2049) climate scenario (RCP 2.6 and RCP 8.5) is 6.0 mm (0.5% difference), while the difference between each long-term (2050–2079) climate change scenario (i.e., the difference between RCP 2.6 and RCP 8.5) is 11.0 mm (0.9% difference). The average maximum daily temperature increased between 1.7 °C (near-term) and 3.6 °C (long-term) (9.5% and 20.1%) when comparing baseline to near- and long-term climate scenarios. Average maximum daily temperature projections for near-term and long-term RCP 2.6 scenarios were all within 0.3 °C, while the long-term RCP 8.5 projection showed the greatest increase from the baseline condition (3.6 °C). Similarly, average minimum daily temperature increased between 2.0 °C (near-term) and 4.0 °C (long-term) (20% and 50%) when compared to the baseline.
Near-term climate projections for the PIA station were between 11.4% and 12.0% greater than the base period, and long-term climate projections were between 14.7% and 15.7% greater than the base period. Horton et al. [43] predicted an increase in average annual precipitation between 3% and 12% by the 2050s, and between 4% and 15% by the 2080s for New York State. The average increases in average annual precipitation are similar to the high end of the projections for New York State performed by Horton et al. [43]).
Daily rainfall of greater than 23 mm was found to increase from 2.4 to 2.5 events per year using near-term projections for the PIA station, and from 2.9 to 3.3 events per year using long term-projections for the PIA station. Further, daily rainfall greater than 41 mm was found to increase from 1.4 to 1.6 events per year using near-term projections for the PIA station, and from 1.7 to 1.9 events per year using long-term projections for the PIA station. The results demonstrate the impact of applying near-term and long-term climate projections to a continuous rainfall record. Miller et al. [44] evaluated climate projections in Philadelphia, Pennsylvania and found that “very heavy” (greater than 23 mm) precipitation was expected to occur 2 to 4 days per year more, while “extremely heavy” (greater than 41 mm) events were expected to occur approximately 2 days per year more by the end of the century.
3.2. Simulated Bioinfiltration Sites
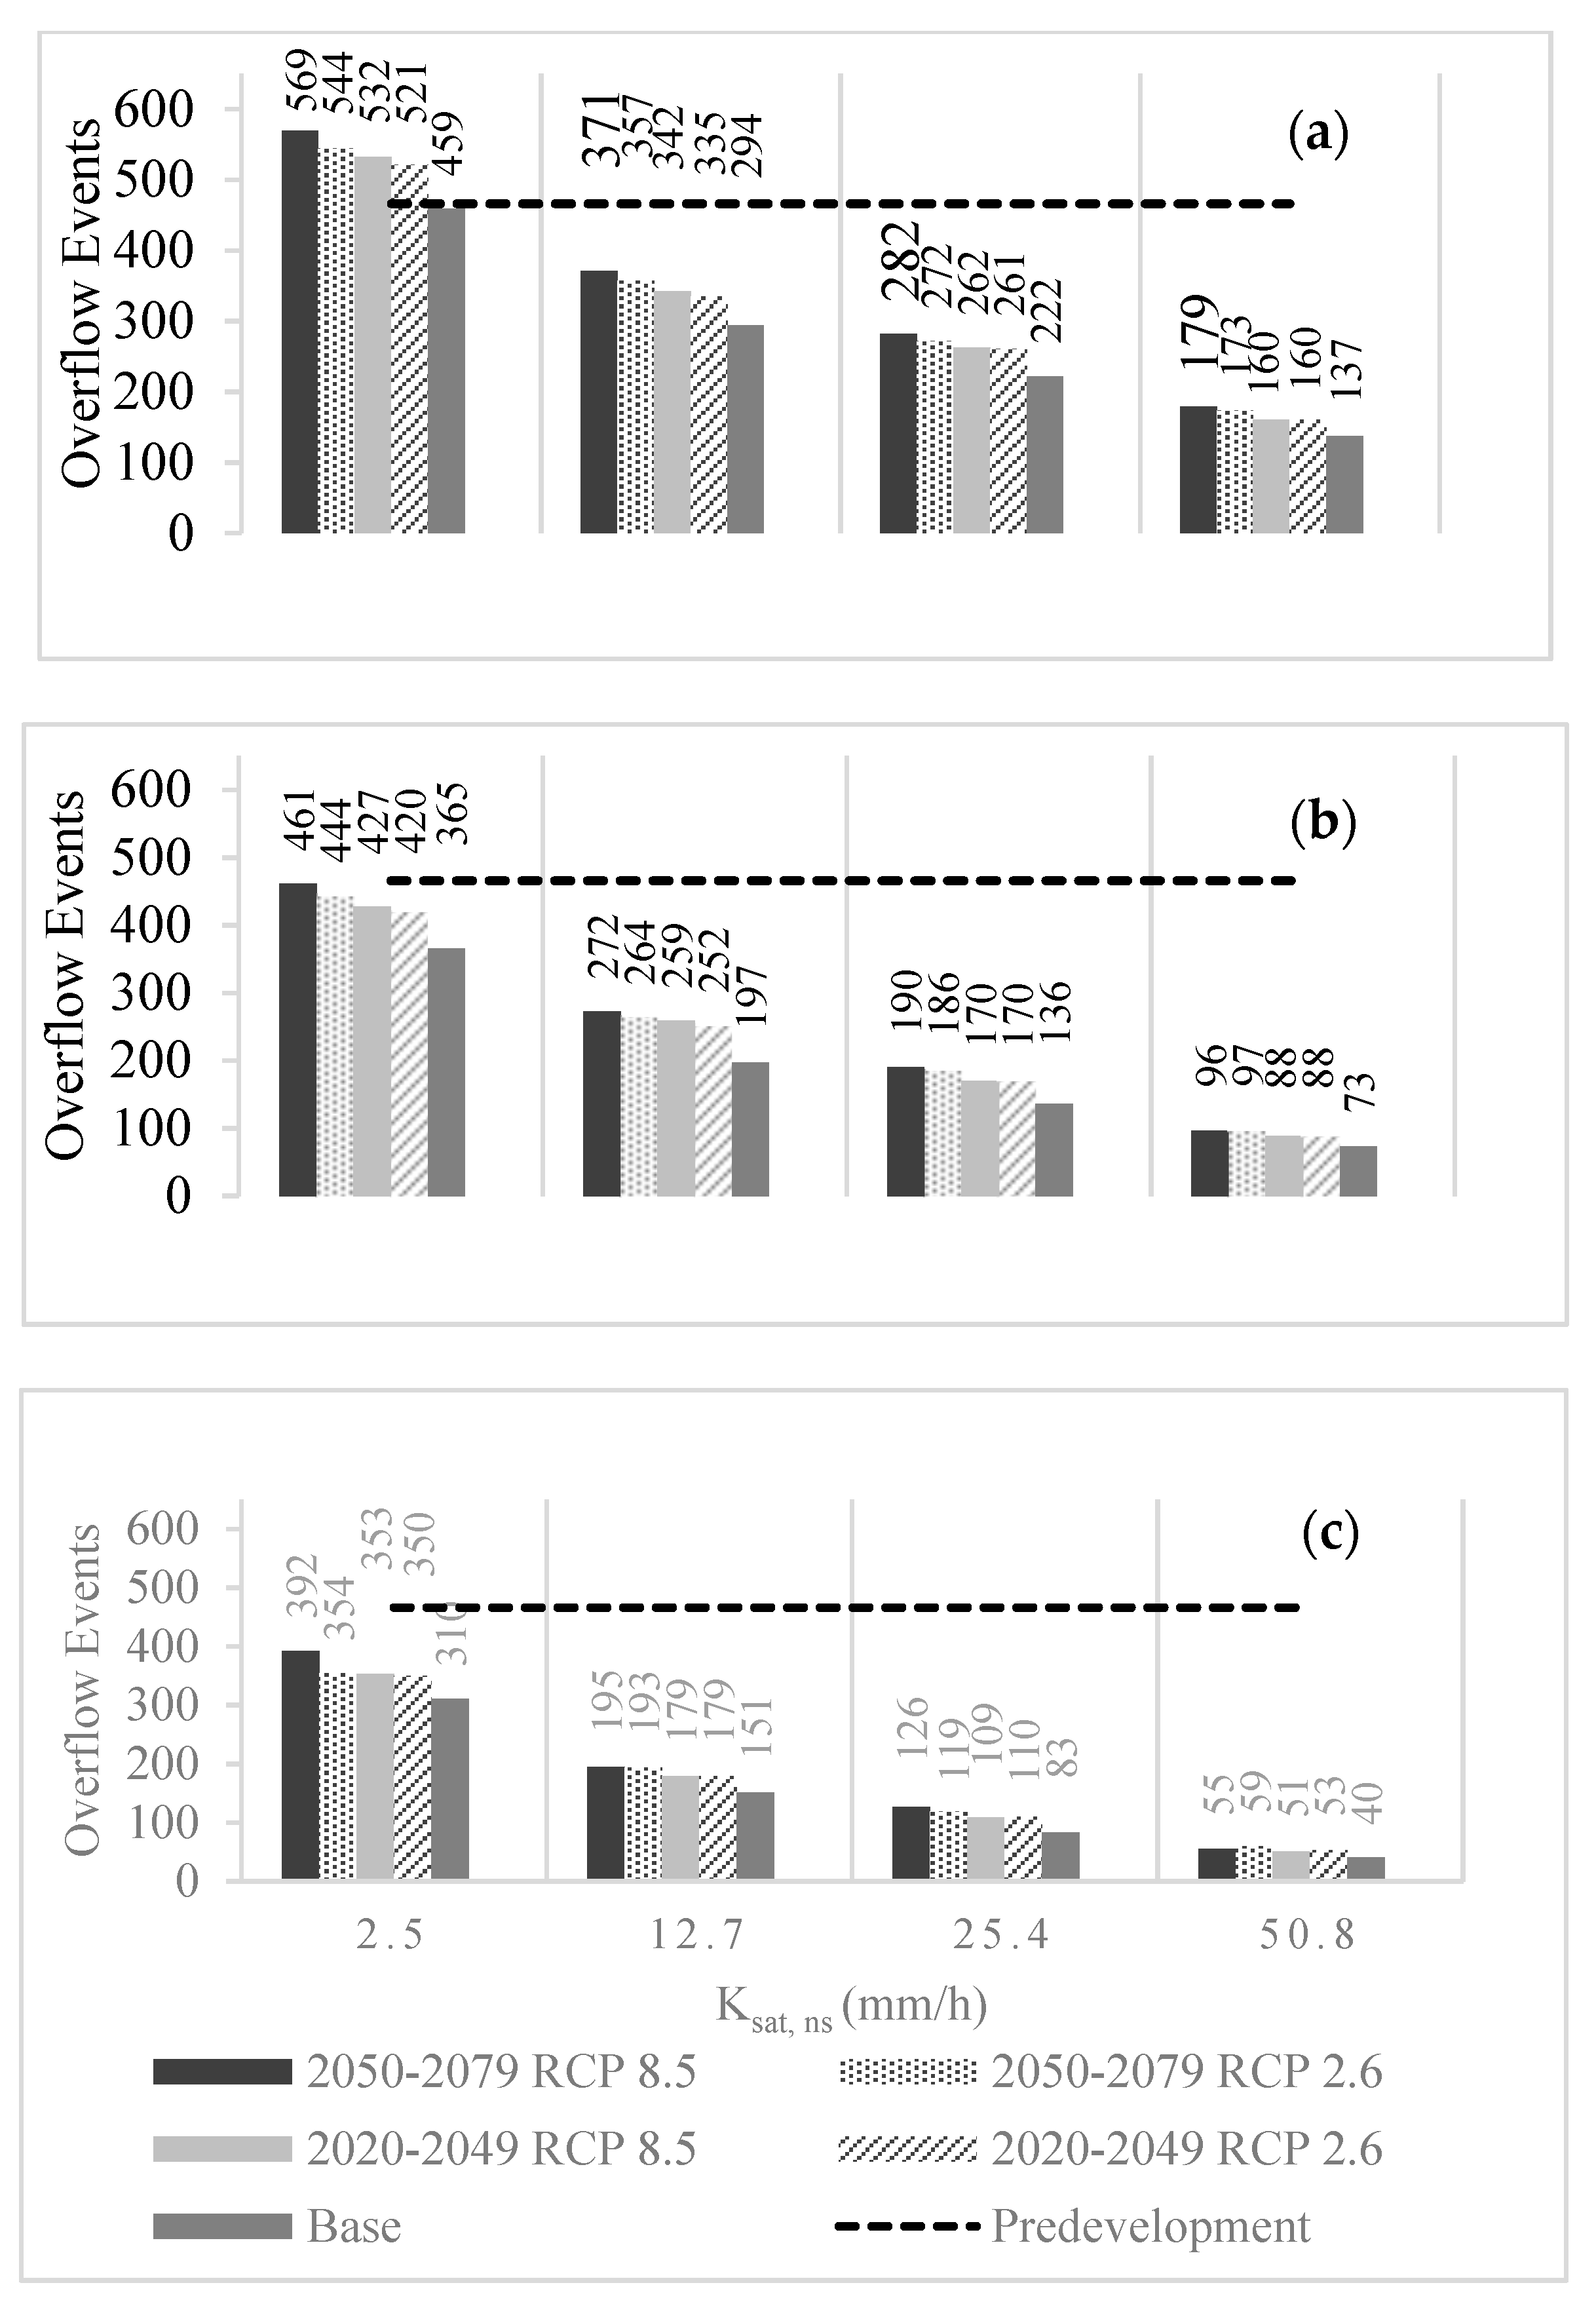
The baseline condition (1970–1999) for the simulated bioinfiltration sites resulted in between 40 and 458 overflow events, depending on ponding volume and native soil saturated hydraulic conductivity (Ksat, ns). Similarly to the findings in Lewellyn and Wadzuk [40], overflow events were more frequent for bioinfiltration sites with shallow ponding and low Ksat, ns. The increase in overflow events for these bioinfiltration sites was due to the limited volume of runoff being infiltrated during the rainfall event, which caused surface ponding to occur. Overflow occurred once surface ponding was exceeded, which occurred more frequently for bioinfiltration sites with shallow ponding. There was an increase in overflow events as rainfall depth increased for near-term and long-term climate scenarios. Overflow events increased by at least 13% when comparing each climate scenario to the baseline scenario (Figure 1). The maximum overflow case was 569 events for the 76 mm ponding and 2.5 mm/h Ksat, ns bioinfiltration design under the 2050–2079 RCP 8.5 scenario. Overflow events decreased as the available ponding volume increased and as Ksat, ns increased. Only climate change scenarios applied to bioinfiltration designs with 76 mm of ponding and a 2.5 mm/h Ksat, ns yielded more overflow events than the predevelopment condition (i.e., 466 events).
Overflow events were similar when comparing each RCP within the same period (near-term and long-term). The maximum difference for each near-term scenario was 11 overflow events (76 mm of ponding with 2.5 mm/h Ksat, ns). As Ksat, ns increased, the difference between the RCP 2.6 and 8.5 became small (0–2 overflow events) because of similar change factors for each RCP and the high absorptive capacity of each design. Further, the increase in precipitation intensity between each RCP in the near-term did not result in additional overflow events when facilities had a high Ksat, ns.
The maximum difference among long-term projection scenarios was 38 overflow events (229 mm of ponding with a 2.5 mm/h Ksat, ns). A higher Ksat, ns yielded smaller differences in overflow events between designs. For example, differences in overflow events for bioinfiltration facilities with a 50.8 mm/h Ksat, ns were between one and six events. Similarly to near-term projections, this is likely due to small differences in change factors between RCPs and native soils that are able to infiltrate increased rainfall intensity.
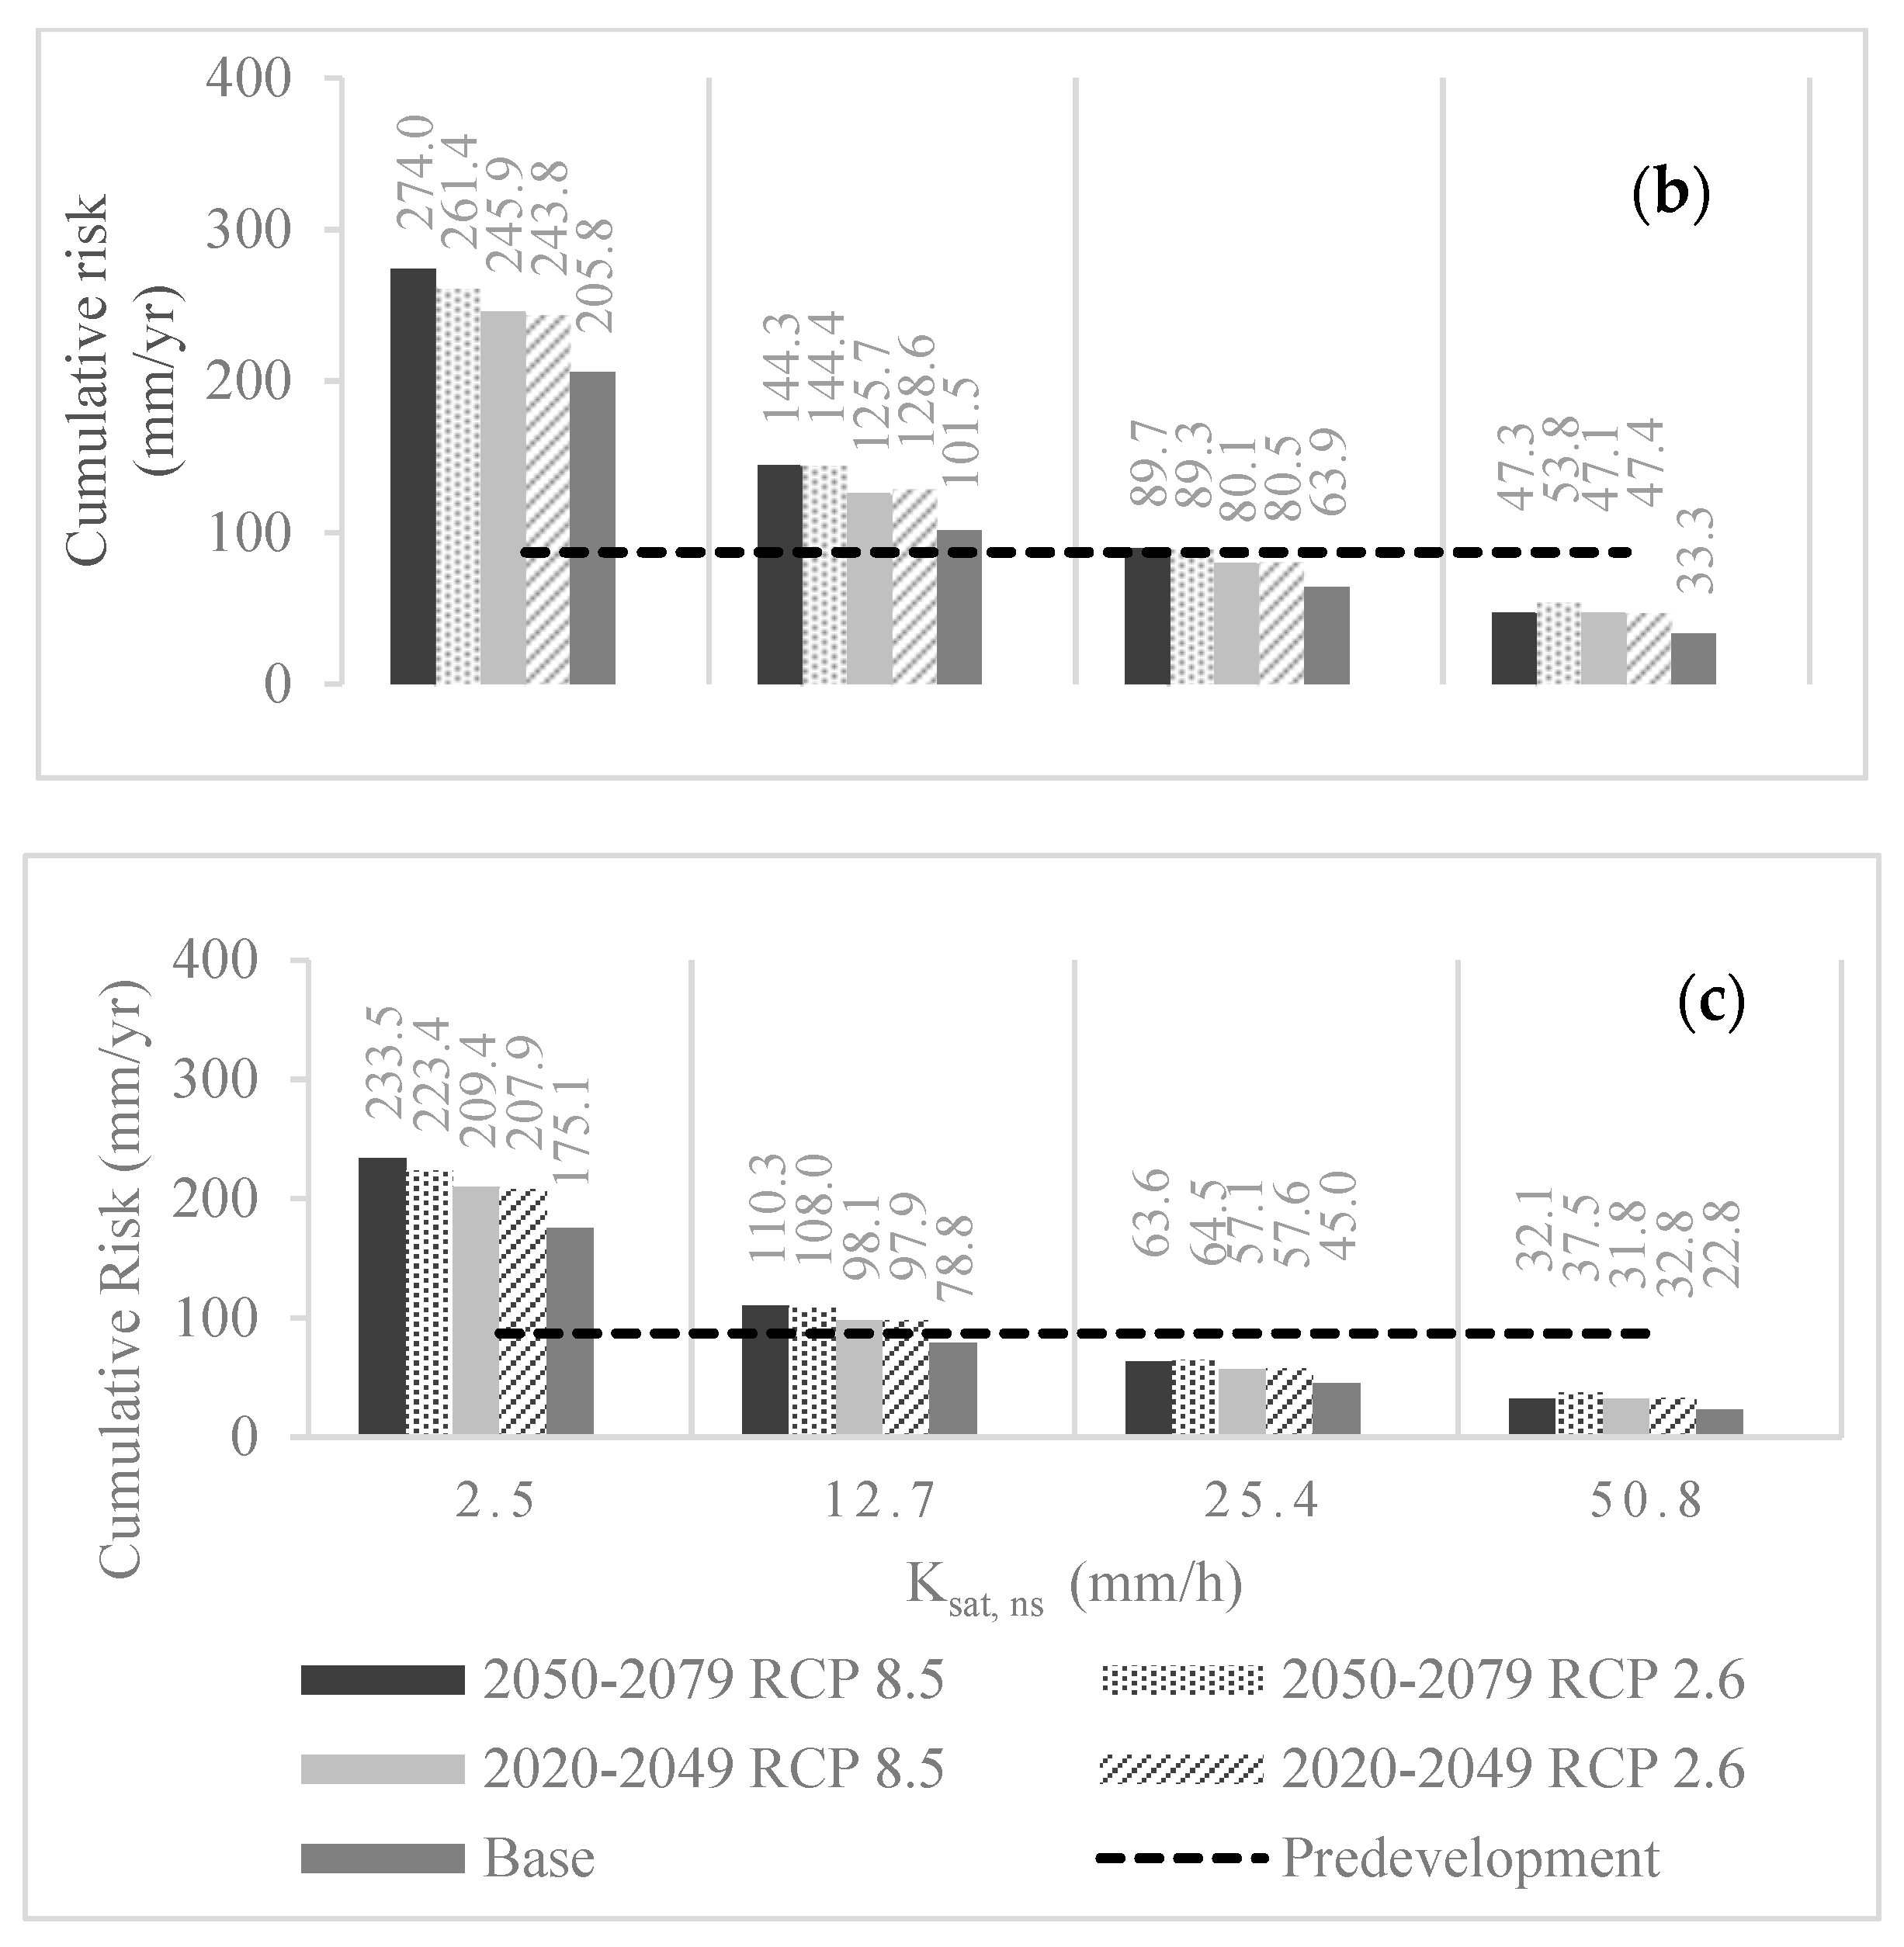
Each climate scenario resulted in an increase in cumulative risk for all bioinfiltration designs when compared to the baseline period (Figure 2). Cumulative risk increased between:
- 17% and 43% for the 2020–2049 RCP 2.6 scenario with a range of 9.9 mm/year to 42.6 mm/year;
- 18% and 39% for the 2020–2049 RCP 8.5 scenario with a range of 9.0 mm/year to 44.1 mm/year;
- 25% and 64% for the 2050–2079 RCP 2.6 scenario with a range of 14.7 mm/year to 61.3 mm/year;
- 31% to 42% for the 2050–2079 RCP 8.5 scenario with a range of 9.3 mm/year to 76.6 mm/year.
The predevelopment scenario for baseline conditions resulted in 466 runoff events and a cumulative risk of 87.2 mm/year. All bioinfiltration designs with a 50.8 mm/h Ksat, ns resulted in a cumulative risk below the predevelopment rate (acceptable risk). Conversely, all bioinfiltration designs with a Ksat, ns of 2.5 mm/h resulted in a cumulative annual risk greater than the predevelopment rate—although the baseline case was also greater than the predevelopment rate. The baseline scenario for 229 mm ponding and 12.7 mm/h Ksat, ns was below the acceptable risk, but went above the acceptable risk for all climate projection scenarios. Further, bioinfiltration designs with 152 mm of ponding and 25.4 mm/h Ksat, ns under long-term climate projections resulted in a cumulative annual risk greater than the acceptable risk (89.3–89.8 mm/year) when the baseline conditions and near-term climate projections were of an acceptable risk (63.9–80.5 mm/year).
The differences between RCP precipitation projections are relatively small compared to the increases over the base conditions (i.e., 6.0 mm/year, or 0.5% increase for near-term projections and 11.0 mm/year, or 1.0% increase for long-term projections). The increases in cumulative risk when compared to the base conditions were up to 44.1 mm/year (18% increase) for near-term projections, and up to 76.7 mm/year for long-term projections (31% increase). However, the average cumulative annual risk for each climate change scenario was not statistically different (p = 0.05) from the baseline condition. This has been observed in other studies in the Mid-Atlantic US [62]. It is suggested that the difference should not be trivialized, as the potential impact in overflow volume is substantial. The range of differences over a 30-year climate period compared to baseline conditions results from 150 mm (140 m3 over the drainage area) to 1320 mm (1228 m3) additional overflow from the drainage area under near-term projections, and 210 mm (195 m3) to 2310 mm (2148 m3) additional overflow from the drainage area under long-term projections.
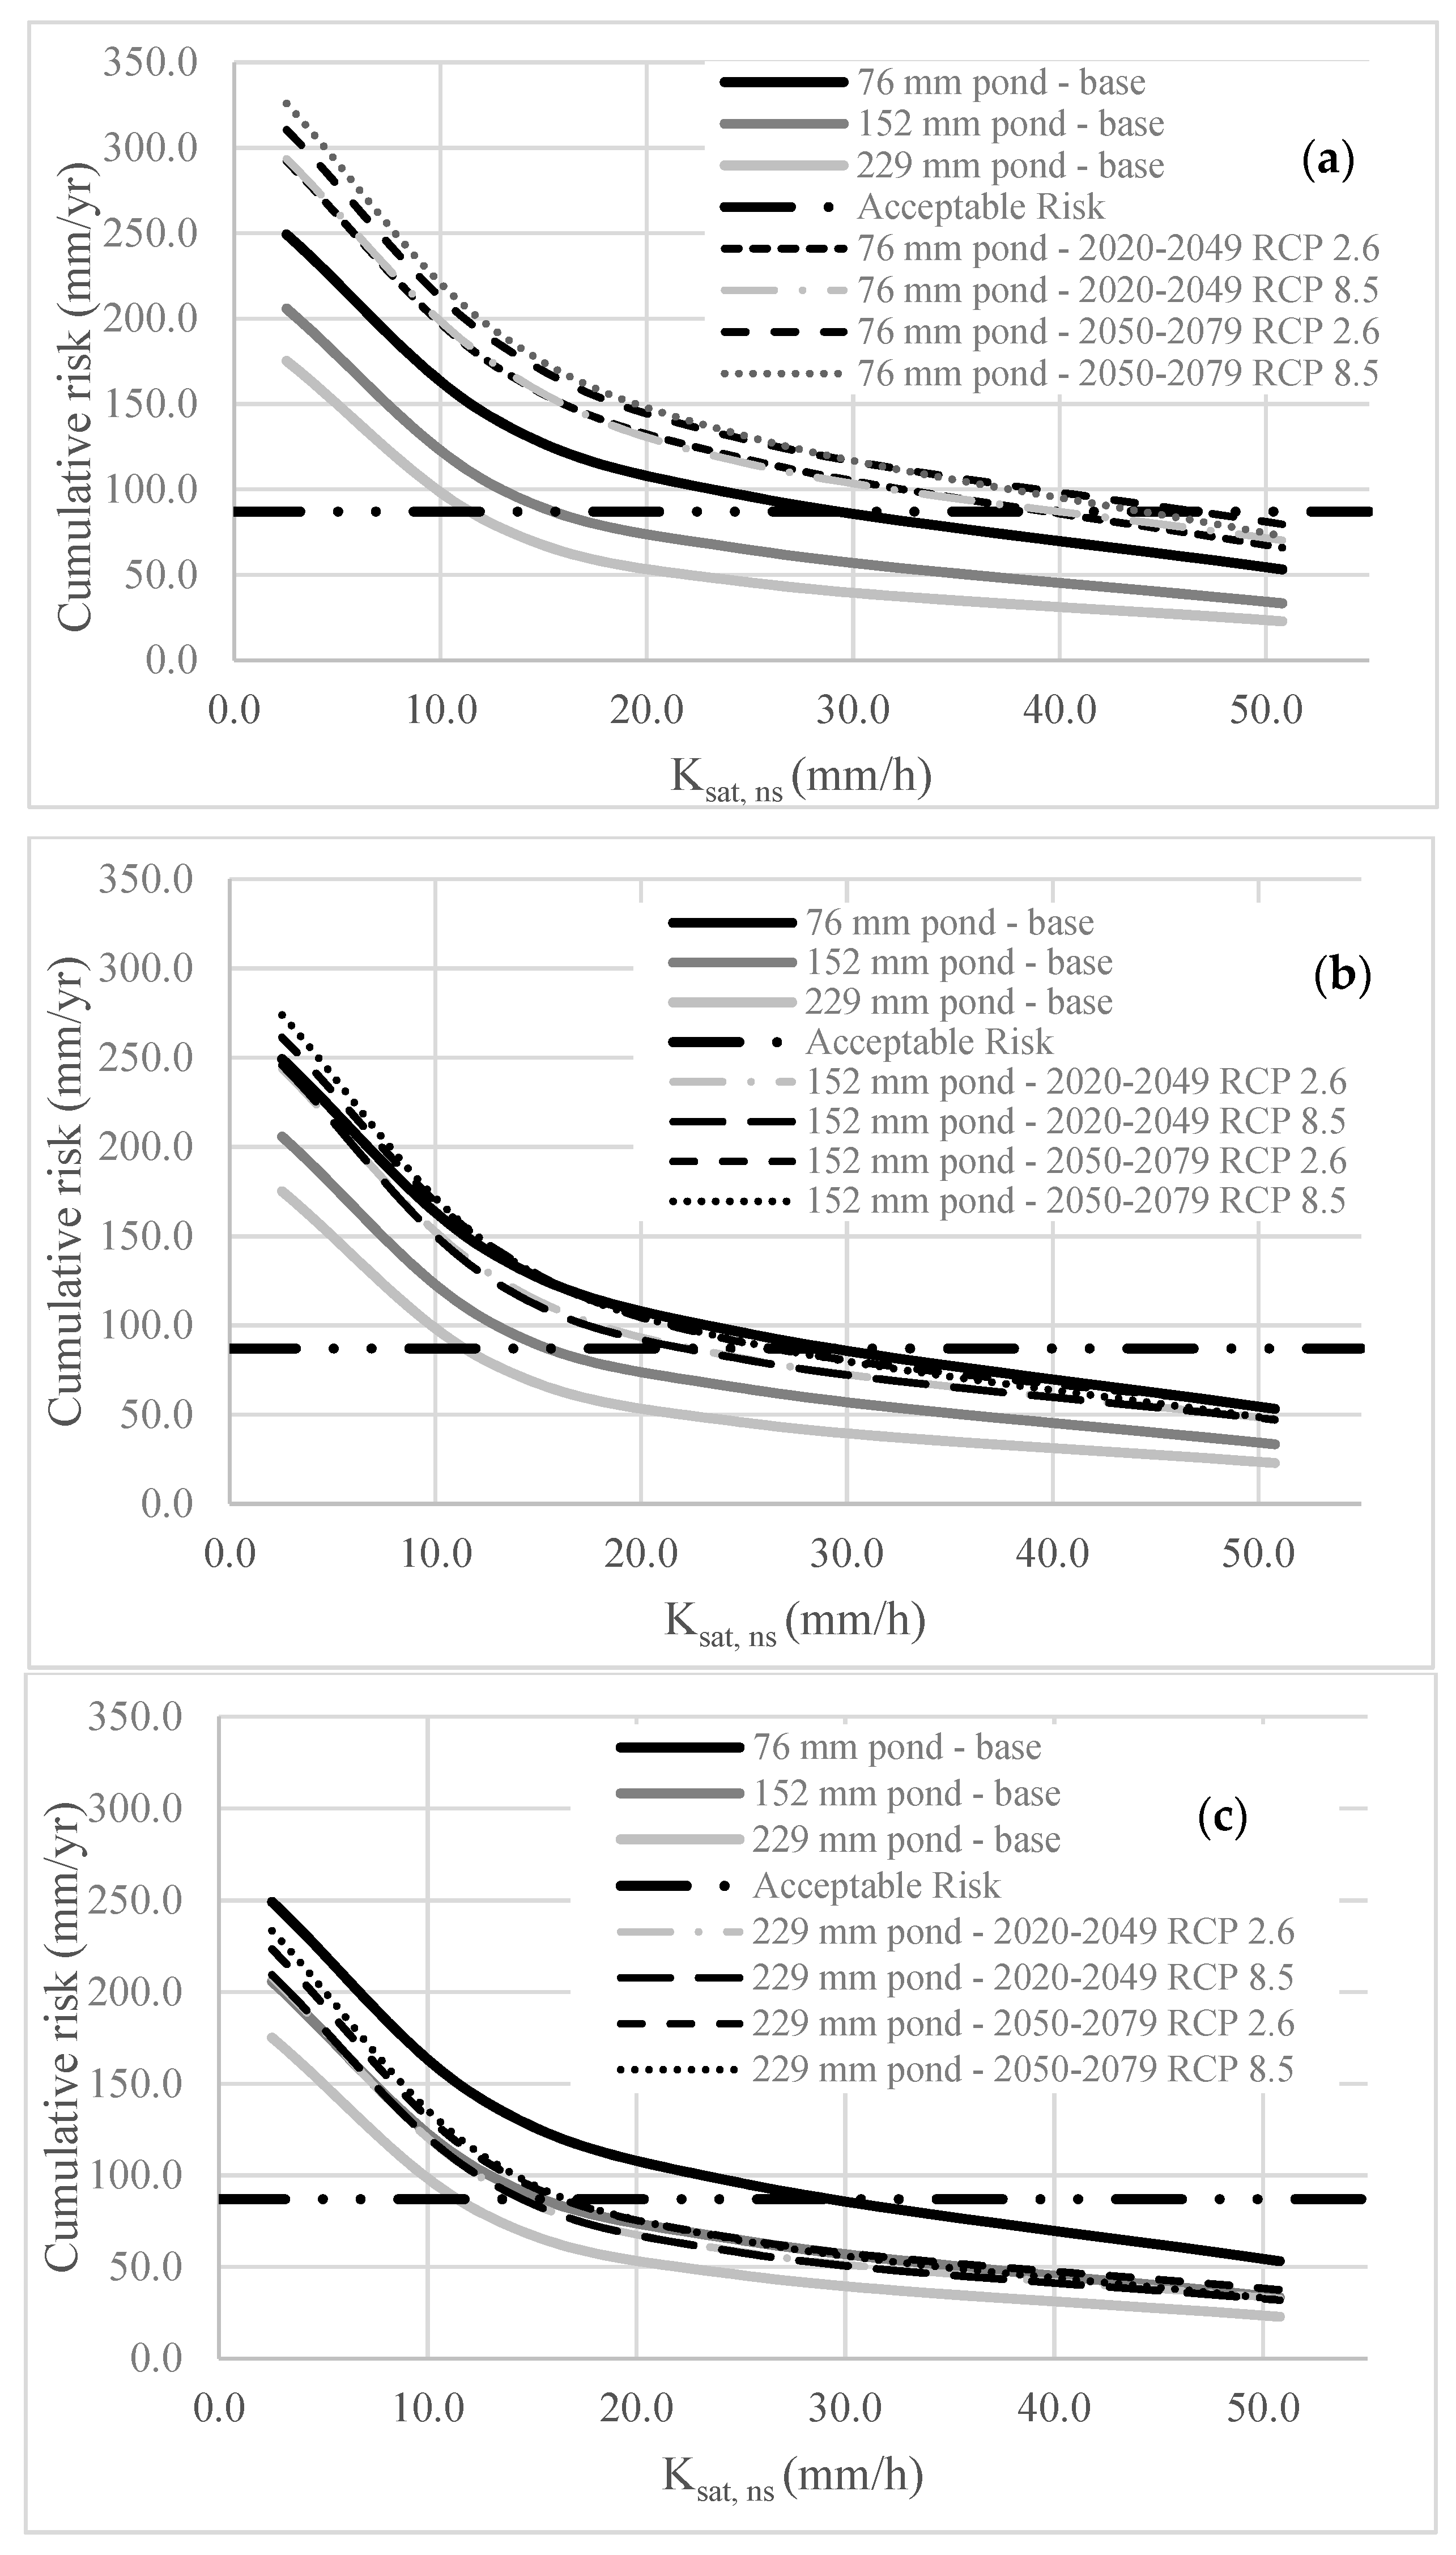
Graphically comparing cumulative annual risk based on Ksat, ns illustrates the similarities between projections and the potential behavior of bioinfiltration facilities under climate change scenarios. (Figure 3). A 76 mm ponding depth facility would perform worse (i.e., have greater risk) for all Ksat, ns under climate change projections (Figure 3a). A 152 mm ponding depth facility under climate change projections would behave most similarly to a 76 mm facility under baseline conditions (Figure 3b). A 229 mm ponding depth facility under climate change projections would behave most similarly to a 152 mm facility under baseline conditions (Figure 3c). While this trend should be investigated and modeled further with additional bioinfiltration designs, it appears that building bioinfiltration designs with more ponding depth will offer the most absorptive capacity for future scenarios.
3.3. Treatment Train
The treatment train model demonstrated increased overflow events when compared to the baseline climate scenario (1970–1999) for each climate change scenario—from 47 to 74 events (1.6 to 2.5 events/year.) (Table 4). Additionally, cumulative annual risk increased by between 13.3 mm/year and 27.0 mm/year over the baseline condition, although these results were not statistically different, similarly to the simulated bioinfiltration results. Overflow events were less than the predevelopment scenario (466 overflow events) and the cumulative annual risk was less than the acceptable risk (87.2 mm/year) for all climate scenarios (between 158 and 232 fewer events and 13.3 mm/year and 40.3 mm/year cumulative risk). Similarly to the simulated bioinfiltration designs, the risk results were not significantly different for climate change scenarios when compared to the base climate condition.
The treatment train model results are consistent with previously observed findings and show that systems with relatively high native soil infiltration rates can absorb greater depths and intensities of rainfall, which reduce risk and increase resilience. Saturated hydraulic conductivity, on average, was 46.7 mm/h in the vegetated portion and 89.7 mm/h in the infiltration trench, however, it varied seasonally between 8.9 mm/h and 127.0 mm/h in the vegetated portion and 17.1 mm/h and 243.8 mm/h in the infiltration trench. Ponding within the vegetated portion of the treatment train varies between the swale and rain gardens but is 152 mm on average throughout. The seasonal variation in Ksat, ns is associated with the system’s ability to capture a runoff volume greater than the static design volume [31].
4. Discussion
Results from Section 3.2 and Section 3.3 illustrate the potential increase in the risk of bioinfiltration overflow as a result of climate change for the Philadelphia, PA example. The potential increases in risk provide guidance for planners and designers to attempt to mitigate this risk through more resilient bioinfiltration designs. Figure 3 illustrates that the projected increases in precipitation result in a performance similar to bioinfiltration with reduced ponding volume. For example, Figure 3b illustrates that bioinfiltration facilities with a ponding depth of 152 mm under climate change scenarios perform similarly to bioinfiltration facilities with a ponding depth of 76 mm under present day climate scenarios. Similarly, Figure 2 provides several examples of increased ponding for bioinfiltration facilities resulting in a reduced risk under climate change scenarios. All climate scenarios for bioinfiltration facilities with 76 mm of ponding depth and 25.4 mm/h Ksat, ns result in risks above the acceptable threshold. The bioinfiltration scenarios with 152 mm of ponding depth and 25.4 mm/h Ksat, ns resulted in a cumulative risk below (base and near-term projections) or slightly above (long-term projections) the acceptable risk. Further, examining the bioinfiltration designs with 229 mm of ponding depth and 25.4 m/h Ksat, ns demonstrates a cumulative risk below the acceptable risk for all climate scenarios. While the specific results are for the Philadelphia, PA example, in general these results demonstrate that ponding depth in bioinfiltration may be an effective tool for decreasing potential risks from the impacts of climate change. Designs with increased ponding depth should be balanced with soil depth based on other design considerations, such as plant health.
The impact of native soil infiltration on risk reduction is apparent when evaluating Figure 2 and the results of the treatment train. All bioinfiltration scenarios with Ksat, ns of 50.8 mm/h resulted in risks below the acceptable risk threshold for all ponding depths evaluated as part of this study. Further, the treatment train demonstrated the performance of an observed site with relatively high Ksat, ns that resulted in a cumulative annual risk below the acceptable risk threshold for all climate scenarios. These results indicate how bioinfiltration sites with relatively high Ksat, ns can reduce risks under climate change scenarios, even with reduced ponding depth (as seen in the treatment train and the bioinfiltration design with 76 mm ponding depth and 50.8 mm/h Ksat, ns). Conversely, all bioinfiltration designs with 2.5 mm/h Ksat, ns resulted in risks above the acceptable risk threshold. In general, underdrains should be considered when Ksat, ns is limited, or when the combination of available ponding depth and Ksat, ns would result in risks above acceptable levels. Designing underdrains to mimic the performance of bioinfiltration sites with higher Ksat, ns could result in risks below the acceptable threshold.
5. Summary and Conclusions
This research provides a framework to systematically evaluate GI design under changing climate conditions, specifically because it used a risk-based method to evaluate the potential impacts from near-term and long-term climate change on bioinfiltration design and performance. For the example case study, all climate change scenarios computed predicted overall increases in average precipitation, maximum daily temperature, and minimum daily temperature. Further, overflow events and cumulative annual risk increased under each climate scenario for simulated bioinfiltration designs and the Villanova treatment train. Increases in cumulative annual risk for simulated bioinfiltration designs with higher ponding and lower infiltration rates (e.g., 229 mm of ponding and 12.7 mm/h Ksat, ns and designs with 152 mm of ponding and 25.4 mm/h Ksat, ns) resulted in risks above the acceptable risk level, while the baseline condition was below the acceptable risk. The effect of climate change appears to be that bioinfiltration systems perform similarly to baseline systems with less available ponding depth. While the Villanova treatment train has demonstrated a greater volume capture when compared to the design [31], overflow events and cumulative annual risk increased for all climate change scenarios. With greater annual risk, the existing absorptive capacity of the treatment train will be used, which diminishes the system failure buffer and highlights the importance of properly maintaining these systems to maximize this capacity.
Soil and ponding depths for each simulated bioinfiltration facility were chosen to compare facilities with similar static capture volumes (the volume available in ponding and the volume available in soil). Similarly to the baseline condition, increased ponding depths and higher Ksat, ns values resulted in a lower cumulative annual risk for climate scenarios. Increased ponding depth can add resilience to bioinfiltration designs under climate change, due to the available storage above the soil layer. Higher native soil infiltration rates are needed when ponding depth is not available to ensure an acceptable risk. While this may limit design due to native soil infiltration rates, many communities require an underdrain to ensure adequate drawdown if soil properties do not meet design standards [24,26,63].
The predevelopment or acceptable risk from the baseline condition (e.g., 87.2 mm/year) was used as a benchmark for the climate change scenarios. This does not take into account the potential future development of a drainage area or account for any potential changes in precipitation. The predevelopment scenario was used to represent the “natural hydrology” of an area, which was considered to be the hydrology before any development took place. Accounting for projected land use changes or increases in precipitation in the predevelopment condition would change the acceptable risk target and provide a risk that was not representative of the “natural hydrology” of a drainage area. Therefore, the acceptable risk for the baseline condition was used for comparison with climate change scenarios.
Underdrains are useful when designing GI to meet discharge requirements or to ensure drawdown when native soil infiltration rates are inadequate. Further, the use of real-time control GI designs has been used recently to optimize site performance. Typically, a valve is installed on an underdrain to control discharge from the facility depending on the real-time weather forecast. This approach can limit underdrain flow and lead to greater infiltration and reduced peak flows during rain events while mitigating risk of overflowing the system. Additionally, the use of real-time control design could decrease the risk in bioinfiltration designs and mitigate impacts due to climate change in the future. Green infrastructure designs utilizing real-time control should be further investigated to determine risk reduction benefit under baseline and climate change projections.
There are inherent uncertainties when utilizing climate projections due to predicted greenhouse gas emissions, natural climate variability, and spatial scales [2,20,35,62]. Further, while the CFM presents a straightforward approach to applying RCM results to historical data, there are limitations such as the assumption of unchanged climate patterns over time [46,47]. Two RCPs (2.6 and 8.5) were used under two future periods (2020–2049 and 2050–2079) to provide a range of hydrologic results for uncertain future climate conditions. While each individual projection has the inherent uncertainties mentioned above, the range of results from the two RCPs was used in lieu of a sensitivity analysis of each projection. These RCPs generally capture the expected envelope of predictions based on present knowledge.
One goal of the present study was to illustrate a systematic framework to assess potential climate change impacts on bioinfiltration facilities to assist GI design and planning. Implementing GI represents a “no-regret” action due to the overall benefit of GI, even without climate change [2,19,20]. Each climate scenario in each period showed projected precipitation and temperature increases at a monthly scale with the only expected precipitation decrease occurring in the month of June under near-term climate projections. While the actual number of overflow events and the cumulative risk for bioinfiltration will likely differ from numbers presented in this study, and as the method is applied to different locations, the need for the design and planning of GI under future climate scenarios is valuable. Further, these results could be used as an initial step to better understand the design life, maintenance concerns, and need for renovation or replacement of GI practices under future climate scenarios. The numeric results of this analysis are specific to Philadelphia, Pennsylvania; however, the methods used for analysis are transferrable to locations where climate change projections and adequate climate records are available. For regions with similar expected changes (i.e., increased precipitation and temperature), the trends observed herein will likely hold. For regions with projected precipitation decreases and prolonged droughts, a similar analysis can be prepared to direct sizing and plant selection, to optimize future system performance.
6. Acknowledgements and Data Availability
We acknowledge Villanova University and the National Science Foundation for funding this research. This research is based upon work supported by the National Science Foundation grant entitled “Partnerships for Innovation: Building Innovation Capacity in Smart Stormwater Green Infrastructure Services” (#1430168).
We acknowledge the World Climate Research Programme’s Working Group on Coupled Modelling, which is responsible for CMIP, and we thank the climate modeling groups for producing and making available their model output. For CMIP, the U.S. Department of Energy’s Program for Climate Model Diagnosis and Intercomparison provided coordinating support and led the development of software infrastructure in partnership with the Global Organization for Earth System Science Portals.
Data used for modeling and supporting the conclusions presented in this manuscript are stored on the Open Science Framework (OSF) data repository (DOI 10.17605/OSF.IO/8C5GH)
Author Contributions
Conceptualization, C.L. and B.W.; methodology, C.L. and B.W.; validation, C.L. and B.W.; formal analysis, C.L.; investigation, C.L.; resources, C.L. and B.W.; data curation, C.L.; writing—original draft preparation, C.L.; writing—review and editing, C.L. and B.W.; visualization, C.L. and B.W.; supervision, B.W.; project administration, B.W.; funding acquisition, B.W.
Funding
This research was funded by the National Science Foundation grant entitled “Partnerships for Innovation: Building Innovation Capacity in Smart Stormwater Green Infrastructure Services” (#1430168).
Conflicts of Interest
The authors declare no conflict of interest.
References
- Melillo, J.M.; Richmond, T.C.; Yohe, G.W. (Eds.) Climate Change Impacts in the United States: The Third National Climate Assessment; U.S. Global Change Research Program: Washington, DC, USA, 2014; p. 841. [CrossRef]
- IPCC. Climate Change (2014). Impacts, Adaptation, and Vulnerability. Part A: Global and Sectoral Aspects. Contribution of Working Group II to the Fifth Assessment Report of the Intergovernmental Panel on Climate Change; Field, C.B., Barros, V.R., Dokken, D.J., Mach, K.J., Mastrandrea, M.D., Bilir, T.E., Chatterjee, M., Ebi, K.L., Estrada, Y.O., Genova, R.C., et al., Eds.; Cambridge University Press: Cambridge, UK; New York, NY, USA, 2014; p. 1132. [Google Scholar]
- IPCC. Climate Change 2007: Synthesis Report. Contribution of Working Groups I, II and III to the Fourth Assessment Report of the Intergovernmental Panel on Climate Change; Pachauri, R.K., Reisinger, A., Eds.; IPCC: Geneva, Switzerland, 2007; p. 104. [Google Scholar]
- Arnell, N.W.; Gosling, S.N. The impacts of climate change on river flood risk at the global scale. Clim. Chang. 2016, 134, 387. [Google Scholar] [CrossRef]
- U.S Environmental Protection Agency (EPA). Being Prepared for Climate Change a Workbook for Developing Risk Based Adaption Plans. Office of Water. EPA 842-K-14-002. Available online: https://www.epa.gov/sites/production/files/2014-09/documents/being_prepared_workbook_508.pdf. (accessed on 8 August 2014).
- U.S. Army Corps of Engineers (USACE). USACE Climate Change Adaption Plan. and Report 2011; USACE: Washington, DC, USA, 2011.
- Francis, R.; Bekera, B. A metric and frameworks for resilience analysis of engineered and infrastructure systems. Reliab. Eng. Syst. Saf. 2014, 121, 90–103. [Google Scholar] [CrossRef]
- USACE. Risk Analysis for Flood Damage Reduction Studies ER 1105-2-101.; Department of the Army: Washington, DC, USA, 2006.
- IPET. Performance Evaluation of the New Orleans and Southeast Louisiana Hurricane Protection System Final Report of the Interagency Performance Evaluation Task Force; USACE: Washington, DC, USA, 2009. [Google Scholar]
- Karl, T.R.; Melillo, J.M.; Peterson, T.C. (Eds.) Global Climate Change Impacts in the United States; Cambridge University Press: Cambridge, UK, 2009. [Google Scholar]
- Kunkel, K.E.; Stevens, L.E.; Stevens, S.E.; Sun, L.; Janssen, E.; Wuebbles, D. Regional Climate Trends and Scenarios for the U.S. National Climate Assessment Part 1. Climate of the Northeast, U.S.; National Oceanic and Atmospheric Administration: Washington, DC, USA, 2013.
- European Environment Agency (EEA). Urban Adaptation to Climate Change in Europe 2016: Transforming Cities in a Changing Climate; Technical Report No. 12/2016; European Environment Agency: Copenhagen, Denmark, 2016; ISSN 1977-8449. [Google Scholar]
- Hejazi, M.I.; Markus, M. Impact of urbanization and climate variability on flood in Northeastern Illinois. J. Hydrol. Eng. 2009, 14, 606–616. [Google Scholar] [CrossRef]
- Faber, M.H.; Stewart, M.G. Risk assessment for civil engineering facilities: Critical overview and discussion. Reliab. Eng. Syst. Saf. 2003, 80, 173–184. [Google Scholar] [CrossRef]
- District of Columbia Water and Sewer Authority (DCWSA). Long Term Control Plan Modification for Green Infrastructure; District of Columbia Water and Sewer Authority: Washington, DC, USA, 2014.
- New York City Department of Environmental Protection (NYCDEP). NYC Green Infrastructure Plan 2011. Available online: http://www.nyc.gov/html/dep/pdf/green_infrastructure/gi_annual_report_2012.pdf. (accessed on 10 October 2015).
- Philadelphia Water Department (PWD). Green City Clean Waters the City of Philadelphia’s Program for Combined Sewer Overflow; Philadelphia Water Department: Philadelphia, PA, USA, 2011.
- Toronto Environment Office (TEO). Ahead of the Storm. Preparing Toronto for Climate Change; Toronto Environment Office: Toronto, ON, Canada, 2008.
- Kirshen, P.; Caputo, L.; Vogel, R.M.; Mathisen, P.; Rosner, A.; Renaud, T. Adapting urban infrastructure to climate change: A drainage case study. J. Water Resour. Plann. Manag. 2015, 141, 04014064. [Google Scholar] [CrossRef]
- Pyke, C.; Warren, M.P.; Johnson, T.; LaGro Jr, J.; Scharfenberg, J.; Groth, P.; Main, E. Assessment of low impact development for managing stormwater with changing precipitation due to climate change. Landsc. Urban Plan 2011, 103, 166–173. [Google Scholar] [CrossRef]
- EPA. Summary of State Stormwater Standards. Office of Water; US Environmental Protection Agency: Washington, DC, USA, 2011.
- National Research Council (NRC). Urban. Stormwater Management in the United States; The National Academies Press: Washington, DC, USA, 2009. [Google Scholar]
- Water Environment Federation (WEF). Rainfall to Results: The Future of Stormwater; Water Environment Federation: Alexandria, VA, USA, 2015. [Google Scholar]
- Maryland Department of the Environment (MDE). Maryland Stormwater Design Manual; Maryland Department of the Environment: Baltimore, MD, USA, 2009.
- PA Department of Environmental Protection (PADEP). Pennsylvania Best Management Practices Manual; Bureau of Watershed Management: Harrisburg, PA, USA, 2006.
- Philadelphia Water Department (PWD). Philadelphia Water (PWD) Stormwater Management Guidance Manual. Available online: https://www.pwdplanreview.org/upload/pdf/Full%20Manual%20(Manual%20Version%202.1).pdf (accessed on 8 April 2014).
- Davis, A.P. Field performance of bioretention: Hydrology impacts. J. Hydrol. Eng. 2008, 13, 90–95. [Google Scholar] [CrossRef]
- Horst, M.; Welker, A.L.; Traver, R.G. Multiyear performance of a pervious concrete infiltration basin BMP. J. Irrig. Drain. 2011, 137, 352–358. [Google Scholar] [CrossRef]
- Lord, L.E.; Komlos, J.; Traver, R. Role of volume reduction and attenuation in the loss of nitrogen from a bioinfiltration SCM. In Proceedings of the 2013 International Low Impact Development Symposium, St. Paul, MI, USA, 18–22 August 2013. [Google Scholar]
- Luell, S.K.; Hunt, W.F.; Winston, R.J. Evaluation of undersized bioretention stormwater control measures for treatment of highway bridge deck runoff. Water Sci. Technol. 2011, 64, 974–979. [Google Scholar] [CrossRef]
- Lewellyn, C.; Lyons, C.; Traver, R.; Wadzuk, B. Evaluation of seasonal and large storm runoff volume capture of an infiltration green infrastructure system. J. Hydrol. Eng. 2015, 21, 04015047. [Google Scholar] [CrossRef]
- Tang, S.; Luo, W.; Jia, Z.; Liu, W.; Li., S.; Wu, Y. Evaluating Retention Capacity of Infiltration Rain Gardens and Their Potential Effect on Urban Stormwater Management in the Sub-Humid Loess Region of China. Water Resour. Management 2015, 30, 983–1000. [Google Scholar] [CrossRef]
- Zahmatkesh, Z.; Burian, S.J.; Karamouz, M.; Tavakol-Davani, H.; Goharian, E. Low-Impact Development Practices to Mitigate Climate Change Effects on Urban Stormwater Runoff: Case Study of New York City. J. Irrig. Drain. 2014, 141, 04014043. [Google Scholar] [CrossRef]
- Franczyk, J.; Chang, H. The effects of climate change and urbanization on the runoff of the Rock Creek basin in the Portland metropolitan area, Oregon, USA. Hydrol. Proc. 2009, 23, 805–815. [Google Scholar] [CrossRef]
- Hathaway, J.M.; Brown, R.A.; Fu, J.S.; Hunt, W.F. Bioretention function under climate change scenarios in North Carolina, USA. J. Hydrol. 2014, 519, 503–511. [Google Scholar] [CrossRef]
- Brekke, L.D.; Maurer, E.P.; Anderson, J.D.; Dettinger, M.D.; Townsley, E.S.; Harrison, A.; Pruitt, T. Assessing reservoir operations risk under climate change. Water Resour. Res. 2009, 45, W04411. [Google Scholar] [CrossRef]
- Davis, D.W.; Goldman, D.M.; Eiker, E.E. Application of Risk-Based Analysis to Planning Reservoir and Levee Flood Damage Reduction Systems; Technical Report No. 160; Hydrologic Engineering Center: St Davis, CA, USA, 2000. [Google Scholar]
- Tung, Y.; Mays, L.W. Risk Models for Flood Levee Design. Water Resour. Res. 1981, 14, 833–841. [Google Scholar] [CrossRef]
- Yohe, G.; Leichenko, R. Chapter 2: Adopting a Risk-Based Approach. New York City Panel on Climate Change 2010 Report. Ann. N.Y. Acad. Sci. 2010, 1196, 29–40. [Google Scholar] [CrossRef]
- Lewellyn, C.; Wadzuk, B. Risk-based methodology for evaluation of bioinfiltration design and performance. J. Sustain. Water Built Environ. 2018, 5. [Google Scholar] [CrossRef]
- Atchison, D.; Severson, A. RECARGA User’s Manual, Version 2.3; University of Wisconsin—Madison: Madison, WI, USA, 2004. [Google Scholar]
- Latham, M.; Carter, C. Storm Water Management Model (SWMM); EPA/600/F-16/246; US EPA Office of Research and Development: Washington, DC, USA, 2016. [Google Scholar]
- Horton, R.M.; Bader, D.A.; Rosenzeig, C.; DeGaetano, A.T.; Solecki, W. Climate Change in New York State: Updating the 011 ClimAID Climate Risk Information Supplement to NYSERDA Report 11-18; New York State Energy Research: Albany, NY, USA, 2014.
- Miller, R.; Choate, A.; Wong, A.; Snow, C.; Snyder, J.; Jaglom, W.; Biggar, S.; Schultz, P. Useful Climate Information for Philadelphia: Past and Future; Philadelphia Mayor’s Office of Sustainability: Philadelphia, PA, USA, 2014.
- Reclamation. Downscaled CMIP3 and CMIP5 Climate and Hydrology Projections: Release of Hydrology Projections, Comparison with preceding Information, and Summary of User Needs; U.S. Department of the Interior, Bureau of Reclamation, Technical Services Center: Denver, CO, USA, 2014; p. 110.
- Diaz-Nieto, J.; Wilbey, R.L. A comparison of statistical downscaling and climate change factor methods: Impacts on lowflows in the River Thames, United Kingdom. Clim. Chang. 2005, 69, 245–268. [Google Scholar] [CrossRef]
- Anandhi, A.; Frei, A.; Pierson, D.C.; Schneiderman, E.M.; Zion, M.S.; Lounsbury, D.; Matonse, A.H. Examination of change factor methodologies for climate change impact assessment. Water Resour. Res. 2011, 47, W03501. [Google Scholar] [CrossRef]
- Akhtar, M.; Ahmad, N.; Booji, M.J. The impact of climate change on the water resources of Hindukush-Karakorum-Himalaya region under different glacier coverage scenarios. J. Hydrol. 2008, 255, 148–163. [Google Scholar] [CrossRef]
- Hay, L.E.; Wilby, R.L.; Leavesly, G.H. A comparison of delta change and downscaled GCM scenarios for three mountainous basins in the United States. J. Am. Water Resour. Assoc. 2000, 36, 387–397. [Google Scholar] [CrossRef]
- Kilsby, C.G.; Jones, P.D.; Burton, A.; Ford, A.C.; Fowler, H.J.; Harpham, C.; Wilby, R.L. A daily weather generator for use in climate change studies. Env. Model. Softw. 2007, 22, 1705–1719. [Google Scholar] [CrossRef]
- Maurer, E.P.; Brekke, L.; Pruitt, T.; Duffy, P.B. Fine-resolution climate projections enhance regional climate change impact studies. Eos Trans. Agu. 2007, 88, 504. [Google Scholar] [CrossRef]
- Van Vuuren, D.P.; Edmonds, J.; Kainuma, M.; Riahi, K.; Thomson, A.; Hibbard, K.; Masui, T. The representative concentration pathways: An overview. Clim. Chang. 2011, 109, 5–31. [Google Scholar] [CrossRef]
- National Oceanic and Atmospheric Administration. Climate Data Online Search. Available online: http://www.ncdc.noaa.gov/cdoweb/search?datasetid=GHCNDMS (accessed on 3 October 2015).
- Hargreaves, G.H.; Semani, Z.A. Reference crop evapotranspiration from temperature. Appl. Eng. Agric. 1985, 1, 96–99. [Google Scholar] [CrossRef]
- Montgomery Associates. LA_RECARGA User’s Manual; City of Los Angeles: Los Angeles, CA, USA, 2009.
- Prince George’s County Department of Environmental Resources (PGDER). Bioretention Manual. Available online: https://www.ct.gov/deep/lib/deep/p2/raingardens/bioretention_manual_2009_version.pdf (accessed on 23 April 2018).
- Minnesota Pollution Control Agency (MPCA). Design Criteria for Bioretention. Available online: https://stormwater.pca.state.mn.us/index.php?title=Design_criteria_for_bioretention. (accessed on 23 April 2018).
- Soil Conservation Service (SCS, now NRCS). National Engineering Handbook. Section 4-Hydrology; Soil Conservation Service: Washington, DC, USA, 1985.
- Minnesota Pollution Control Agency (MPCA). What is the Pre-Development Condition. Available online: https://stormwater.pca.state.mn.us/index.php/What_is_the_pre-development_condition (accessed on 11 August 2019).
- Thomsen, B.W.; Porcello, J.J. Predevlopment Hydrology of the Salt River Indian Reservation, East Salt River Valley, Arizona. U.S. Geol. Surv. Water-Resour. Investig. Rep. 1991, 91, 4132. [Google Scholar] [CrossRef]
- Washington State Department of Ecology (WSDE). Stormwater Management Manual for Western Washington. Publication number 14-10-055. Available online: http://www.ecy.wa.gov/programs/wq/stormwater/manual/2014SWMMWWinteractive/Content/Resources/DocsForDownload/2014SWMMWW.pdf (accessed on 23 April 2018).
- Thompson, A.; Barnes, J.; Pierce, D.; Dickson, L.; Beauvais, N.; Ghosh, I.; Brahim, N.; Hagan, K. Climate Projections and Scenario Development Climate Change Adaptation Plan for the District of Columbia. RFA: 2013-9-OPS; Department of Energy and Environment: Washington, DC, USA, 2015.
- North Carolina Department of Environment and Natural Resources (NCDENR). Stormwater Best Management Practices Manual; North Carolina Department of Environment and Natural Resources: Raleigh, NC, USA, 2009.
Figure 1.
Cumulative overflow events for each climate scenario based on Ksat, ns for bioinfiltration facilities with: (a) 76 mm of ponding, (b) 152 cm of ponding, and (c) 229 mm of ponding.
Figure 1.
Cumulative overflow events for each climate scenario based on Ksat, ns for bioinfiltration facilities with: (a) 76 mm of ponding, (b) 152 cm of ponding, and (c) 229 mm of ponding.

Figure 2.
Comparison of the annual cumulative risk for bioinfiltration designs under near-term and long-term climate projections compared to the base and predevelopment conditions for bioinfiltration facilities with: (a) 76 mm of ponding, (b) 152 mm of ponding, and (c) 229 mm of ponding.
Figure 2.
Comparison of the annual cumulative risk for bioinfiltration designs under near-term and long-term climate projections compared to the base and predevelopment conditions for bioinfiltration facilities with: (a) 76 mm of ponding, (b) 152 mm of ponding, and (c) 229 mm of ponding.


Figure 3.
Cumulative risk for climate change scenarios based on Ksat, ns compared to cumulative risk and predevelopment conditions for bioinfiltration designs with: (a) 76 mm of ponding, (b) 152 mm of ponding, and (c) 229 mm of ponding.
Figure 3.
Cumulative risk for climate change scenarios based on Ksat, ns compared to cumulative risk and predevelopment conditions for bioinfiltration designs with: (a) 76 mm of ponding, (b) 152 mm of ponding, and (c) 229 mm of ponding.


Table 1.
CMIP5 models utilized for this study (Reclamation 2014).
| Modeling Center (or Group) | Institute ID | Model Name |
|---|---|---|
| Commonwealth Scientific and Industrial Research Organization (CSIRO) and Bureau of Meteorology (BOM), Australia | CSIRO-BOM | ACCESS1.0 |
| Beijing Climate Center, China Meteorological Administration | BCC | BCC-CSM1.1 |
| BCC-CSM1.1 (m) | ||
| Canadian Centre for Climate Modelling and Analysis | CCCMA | CanESM2 |
| National Center for Atmospheric Research | NCAR | CCSM4 |
| Community Earth System Model Contributors | NSF-DOE-NCAR | CESM1-BGC |
| CESM1-CAM5 | ||
| Centro Euro-Mediterraneo per I Cambiamenti Climatici | CMCC | CMCC-CM |
| Centre National de Recherches Météorologiques/Centre Européen de Recherche et Formation Avancée en Calcul Scientifique | CNRM-CERFACS | CNRM-CM5 |
| Commonwealth Scientific and Industrial Research Organization in collaboration with Queensland Climate Change Centre of Excellence | CSIRO-QCCCE | CSIRO-Mk3.6.0 |
| The First Institute of Oceanography, SOA, China | FIO | FIO-ESM |
| NOAA Geophysical Fluid Dynamics Laboratory | NOAA GFDL | GFDL-CM3 |
| GFDL-ESM2G | ||
| GFDL-ESM2M | ||
| NASA Goddard Institute for Space Studies | NASA GISS | GISS-E2-R |
| GISS-E2-R-CC | ||
| Met Office Hadley Centre (additional HadGEM2-ES realizations contributed by Instituto Nacional de Pesquisas Espaciais) | MOHC | HadGEM2-AO |
| HadGEM2-ES | ||
| Institute for Numerical Mathematics | INM | INM-CM4 |
| Institut Pierre-Simon Laplace | IPSL | IPSL-CM5A-MR |
| IPSL-CM5B-LR | ||
| Japan Agency for Marine-Earth Science and Technology, Atmosphere and Ocean Research Institute (The University of Tokyo), and National Institute for Environmental Studies | MIROC | MIROC-ESM |
| MIROC-ESM-CHEM | ||
| Atmosphere and Ocean Research Institute (The University of Tokyo), National Institute for Environmental Studies, and Japan Agency for Marine-Earth Science and Technology | MIROC | MIROC5 |
| Max-Planck-Institut für Meteorologie (Max Planck Institute for Meteorology) | MPI-M | MPI-ESM-MR |
| MPI-ESM-LR | ||
| Meteorological Research Institute | MRI | MRI-CGCM3 |
| Norwegian Climate Centre | NCC | NorESM1-M |
Table 2.
Bioinfiltration parameters used to create twelve unique bioinfiltration designs for risk-based modeling.
Table 2.
Bioinfiltration parameters used to create twelve unique bioinfiltration designs for risk-based modeling.
| Ponding Depth (mm) | Media Depth (mm) | Saturated Hydraulic Conductivity (mm/h) |
|---|---|---|
| 76 | 864 | 2.5 |
| 12.7 | ||
| 25.4 | ||
| 50.8 | ||
| 152 | 610 | 2.5 |
| 12.7 | ||
| 25.4 | ||
| 50.8 | ||
| 229 | 356 | 2.5 |
| 12.7 | ||
| 25.4 | ||
| 50.8 |
Table 3.
A comparison of rainfall depth and daily temperature for the baseline and four climate change scenarios using the Change Factor Method (CFM) approach.
Table 3.
A comparison of rainfall depth and daily temperature for the baseline and four climate change scenarios using the Change Factor Method (CFM) approach.
| Scenario | Total Rainfall (mm) | Average Annual Rainfall (mm) | Average Max Daily Temp (°C) | Average Min Daily Temp (°C) |
|---|---|---|---|---|
| Base | 31,714 | 1057 | 17.9 | 8.0 |
| 2020–2049 RCP 2.6 | 35,350 | 1178 | 19.6 | 10.0 |
| 2020–2049 RCP 8.5 | 35,512 | 1184 | 19.9 | 10.2 |
| 2050–2079 RCP 2.6 | 36,350 | 1212 | 19.8 | 10.3 |
| 2050–2079 RCP 8.5 | 36,700 | 1223 | 21.5 | 12.0 |
Table 4.
A comparison of overflow events and cumulative annual risk for the treatment train under baseline and climate change scenarios.
Table 4.
A comparison of overflow events and cumulative annual risk for the treatment train under baseline and climate change scenarios.
| Scenario | Overflow Events | Difference from Base (Events) | Cumulative Annual Risk (mm/Year) | Difference from Base (mm/Year) |
|---|---|---|---|---|
| Base (1970–1999) | 234 | - | 46.9 | - |
| 2020–2049 RCP 2.6 | 281 | 47 | 60.2 | 13.3 |
| 2020–2049 RCP 8.5 | 283 | 49 | 65.3 | 18.4 |
| 2050–2079 RCP 2.6 | 289 | 55 | 67.1 | 20.2 |
| 2050–2079 RCP 8.5 | 308 | 74 | 73.9 | 27.0 |
© 2019 by the authors. Licensee MDPI, Basel, Switzerland. This article is an open access article distributed under the terms and conditions of the Creative Commons Attribution (CC BY) license (http://creativecommons.org/licenses/by/4.0/).
Share and Cite
MDPI and ACS Style
Lewellyn, C.; Wadzuk, B. Evaluating the Risk-Based Performance of Bioinfiltration Facilities under Climate Change Scenarios. Water 2019, 11, 1765. https://doi.org/10.3390/w11091765
AMA Style
Lewellyn C, Wadzuk B. Evaluating the Risk-Based Performance of Bioinfiltration Facilities under Climate Change Scenarios. Water. 2019; 11(9):1765. https://doi.org/10.3390/w11091765
Chicago/Turabian StyleLewellyn, Conor, and Bridget Wadzuk. 2019. "Evaluating the Risk-Based Performance of Bioinfiltration Facilities under Climate Change Scenarios" Water 11, no. 9: 1765. https://doi.org/10.3390/w11091765
Note that from the first issue of 2016, this journal uses article numbers instead of page numbers. See further details here.