

Millennials Maintain Debt Payoff Momentum While Baby Boomers Keep Borrowing
As consumers grow older, they make more money and pay off debts, in turn giving them more wealth than younger folks — or so the story goes. But that story has changed a bit in modern times as home and education costs have climbed while real wages stagnated so much that those born later have had much greater difficulty following a positive financial trajectory.
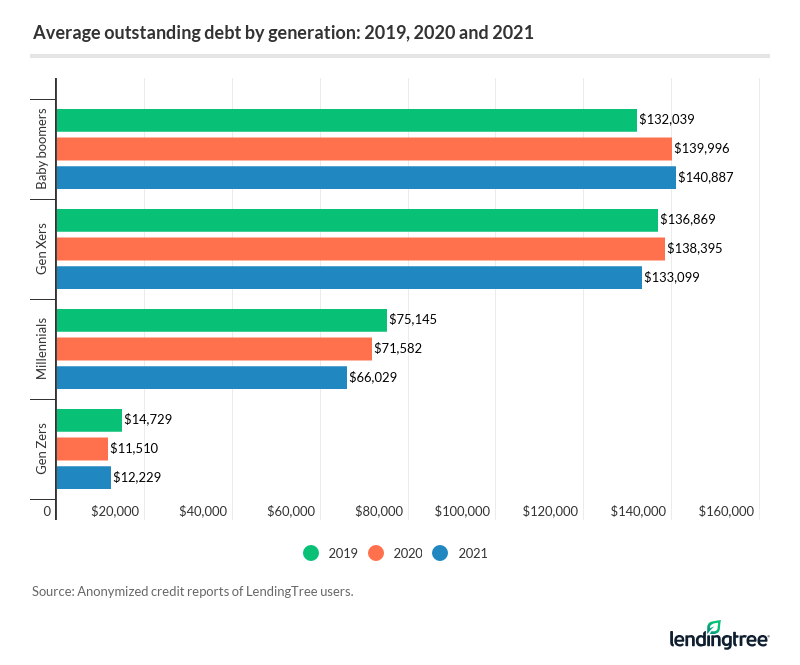
After years of commentary about being broke, not being able to afford houses and overspending on coffee, millennials appear to be making some progress, particularly when paying off debt. In fact, LendingTree researchers found millennials reduced their average debt between 2019 and 2020 and 2020 and 2021, while baby boomers added debt in both periods.
Using more than 340,000 anonymous credit reports from LendingTree users, analysts found interesting generational differences in debt payoffs over the past few years.
Key findings
- Gen Zers, millennials and Gen Xers reduced their average debt between 2019 and 2021. Millennials lowered their debt by the largest amount — $9,117 — while Gen Zers reduced it by the largest percentage — 17%.
- Baby boomers increased their average debt in the same period. Baby boomers added $8,848, or 6.7%, to their average debt burden between 2019 and 2021.
- Millennials reduced their average debt in both one-year periods between 2019 and 2021, while baby boomers increased theirs in both periods. Gen Zers and Gen Xers saw different patterns. Gen Xers’ average debt increased between 2019 and 2020 but decreased between 2020 and 2021, while the reverse occurred for Gen Zers.
- Gen Zers saw the widest changes in debt distribution between 2019 and 2021. Student loans accounted for 24.6% of Gen Zers’ debt in 2021, down from 30.2% in 2019. Meanwhile, auto loans accounted for a higher percentage of their debt.
Millennials keep debt payoff momentum going throughout the pandemic
Though the coronavirus pandemic brought financial turmoil to plenty of Americans, many were able to take advantage of the crisis to get out of debt or add to their savings.
Economic impact payments (also known as stimulus checks) and provisions like the federal student loan interest pause meant some consumers had more cash on hand than usual. Additionally, state lockdowns and social restrictions limited folks’ options for going out to spend extra money.
Before the pandemic, millennials and Gen Zers started a downward trajectory with their average debt balances, bringing balances down by an average of $3,391 from 2019 to 2020. Millennials continued to lower their average debt into 2021, while Gen Zers took on a slightly heftier debt burden, adding $720 to their average.
Still, Gen Zers maintained a lower average debt balance in 2021 than in 2019. In fact, the young generation’s debt saw the biggest drop — 17% — over the two years. Millennials’ consistent debt payoff pattern helped them take the most dollars off their debt, bringing their balances down by an average of $9,117 since 2019.
| Changes to generational debt | ||||
| 2019 to 2020 ($) | 2020 to 2021 ($) | 2019 to 2021 ($) | 2019 to 2021 (%) | |
| Baby boomers | $7,957 | $891 | $8,848 | 6.7% |
| Gen Xers | $1,526 | -$5,297 | -$3,770 | -2.8% |
| Millennials | -$3,563 | -$5,554 | -$9,117 | -12.1% |
| Gen Zers | -$3,219 | $720 | -$2,500 | -17.0% |
Baby boomers take their debt in the other direction
Baby boomers, on the contrary, have increased their balances over the two years. Growing their average debt by 6.7% or $8,848, boomers may not have taken a break from borrowing in two years.
Low mortgage and personal loan rates may have also made borrowing more attractive in the past year.
Gen Xers similarly increased their average debt balances from 2019 to 2020 but brought their average back down by 2021 for a total deficit of $3,770 over the two years.
Gen Zers rearranged debt on the way down
Observing the different types of debt owned by each generation may also help explain the shifts in balances. Those born in 1996 or later saw the widest changes in their debt distribution between 2019 and 2021. For example, student loans accounted for 30.2% of Gen Zers’ debt on average in 2019 but shrank to 24.6% in 2021.
It’s likely the student loan interest freeze allowed motivated borrowers to bring down balances faster without competing against compounding interest. Borrowers may have also put stimulus checks or extra unemployment income toward student debt. On the contrary, Gen Zers and millennials increased the share that auto loans contribute to their overall debt balances, with Gen Z auto debt growing by more than 5 percentage points.
With the pandemic-fueled housing market running so hot, it’s not too surprising to see every generation allocating greater shares of debt to mortgages.
| Average debt distribution: 2019 vs. 2021 | ||||||||||
| Personal loans | Student loans | Credit cards | Auto loans | Mortgages | ||||||
| 2019 | 2021 | 2019 | 2021 | 2019 | 2021 | 2019 | 2021 | 2019 | 2021 | |
| Baby boomer | 5.8% | 3.9% | 5.3% | 4.8% | 8.6% | 8.3% | 10.6% | 10.3% | 69.6% | 72.7% |
| Gen X | 5.7% | 4.4% | 10.7% | 10.9% | 8.6% | 7.2% | 13.0% | 12.9% | 62.0% | 64.6% |
| Millennial | 5.2% | 4.3% | 21.2% | 20.4% | 9.9% | 7.7% | 18.2% | 19.7% | 45.6% | 47.9% |
| Gen Z | 4.3% | 5.1% | 30.2% | 24.6% | 10.8% | 8.3% | 45.4% | 50.9% | 9.3% | 11.1% |
As pandemic provisions end, stick with the good habits
Few people probably wish to see another pandemic or other crisis like it in their lifetimes, but the numbers show some of the positive effects of such a widespread catastrophe.
While Americans may not see another stimulus check or unemployment benefits like they did during the pandemic, they can take a few lessons from the experience to keep bringing down their debt.
- Skip the restaurant. If they haven’t already, many consumers are itching to get back to dining out and enjoying other leisure activities. Those eager to pay off debt or build savings should consider cutting back on some of those meal outings to keep a tighter budget and put more toward their goals.
- Use cash windfalls to your advantage. For those who didn’t have to rely on stimulus checks for necessities or bills, the economic impact payments may have served as “found money,” which is great to put toward outstanding debt. “When we Americans come into a little bit of extra money, we tend to want to spend it when we might be best served using that cash to pay down debt or to build savings,” Schulz says.
- Ask for help. Many consumers who may have been struggling to make payments during the pandemic reached out to their lenders to see what options they had, and many reaped benefits like lower APRs on credit cards. But don’t wait for the next global crisis to ask. “The truth is that you have much more power over your lenders than you realize,” Schulz says. “You just have to be willing to wield it, and often it is as easy to do as picking up the phone and asking.”
Methodology
Using an anonymized sample of more than 340,000 credit reports from LendingTree users — divided between March 2019, March 2020 and March 2021 — analysts calculated the average debt balances across five major debt types (personal loans, student loans, credit cards, auto loans and mortgages).
The generations researchers examined include:
- Generation Z (born after 1996; ages 18 to 24 in 2021)
- Millennials (born between 1981 and 1996; ages 25 to 40 in 2021)
- Generation X (born between 1965 and 1980; ages 41 to 55 in 2021)
- Baby boomers (born between 1946 and 1964; ages 56 to 75 in 2021)
Analysts then compared the average balances from the two time periods.