Community Life Survey 2021/22: Wellbeing and loneliness
Updated 3 May 2023
Applies to England

© Crown copyright 2023
This publication is licensed under the terms of the Open Government Licence v3.0 except where otherwise stated. To view this licence, visit nationalarchives.gov.uk/doc/open-government-licence/version/3 or write to the Information Policy Team, The National Archives, Kew, London TW9 4DU, or email: psi@nationalarchives.gov.uk.
Where we have identified any third party copyright information you will need to obtain permission from the copyright holders concerned.
This publication is available at https://www.gov.uk/government/statistics/community-life-survey-202122/community-life-survey-202122-wellbeing-and-loneliness
The Community Life Survey is a household self-completion survey (online survey, with paper survey for adults not digitally engaged) of adults aged 16+ in England. This chapter summarises results related to wellbeing and loneliness from the 2021/22 survey, which ran from October 2021 to September 2022.
Differences between groups are only reported on in this publication where they are statistically significant i.e. where we can be confident that the differences seen in our sampled respondents reflect the population.[footnote 1]
1. Wellbeing
Two questions were used where respondents were asked about overall wellbeing, and these questions measure responses on a scale from 0 (not at all) to 10 (completely).
- Overall, how satisfied are you with your life nowadays? (referred to as life satisfaction).
- Overall, to what extent do you feel that the things you do in your life are worthwhile? (referred to as self-worth)
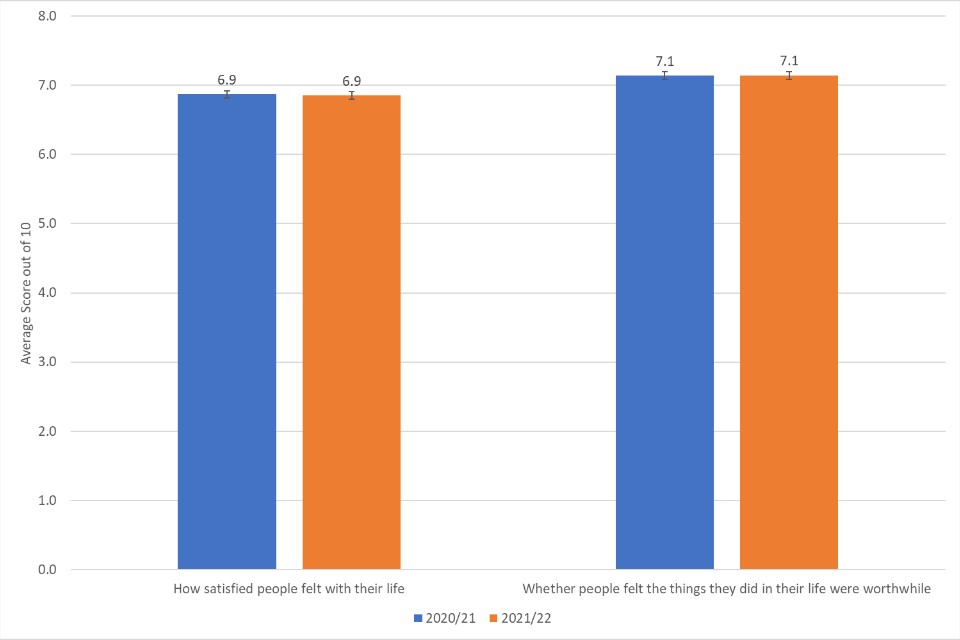
The mean scores for life satisfaction and self-worth in 2021/22 were consistent with those in 2020/21. Out of 10, the average score for life satisfaction was 6.9 in both 2020/21 and 2021/22 and the average score for self-worth was 7.1 in both years.
Figure 2.1: Life satisfaction and self-worth, 2020/21 - 2021/22.
Two questions were asked about how a respondent felt yesterday, and these questions also measure responses on a scale from 0 (not at all) to 10 (completely).
-
Overall, how happy did you feel yesterday? (referred to as happiness).
-
On a scale where 0 is “not at all anxious” and 10 is “completely anxious”, overall, how anxious did you feel yesterday? (referred to as anxiety).
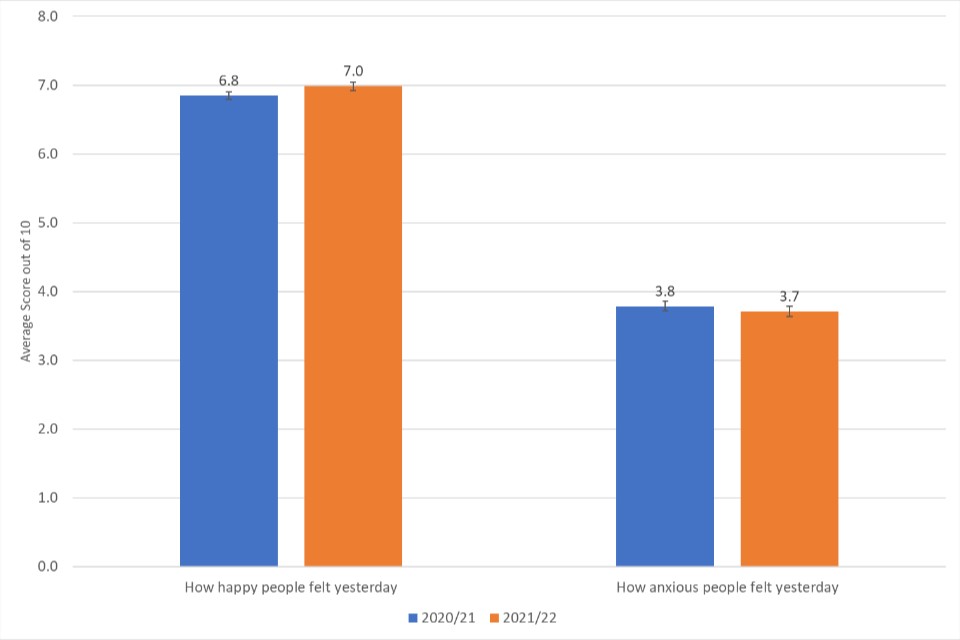
How happy people felt the day before taking the survey increased in 2021/22, to a mean score of 7.0 from 6.8 in 2020/21, however the results for 2021/22 are consistent with those seen in years 2013/14 to 2019/20. The mean score for how anxious people felt the day before taking the survey was 3.7 in 2021/22, inline with the average anxiety score in 2020/21 (3.8).
Figure 2.2: Feeling happy and anxious, 2020/21 - 2021/22
2. Loneliness
GSS harmonised questions on different aspects of loneliness were included in the 2021/22 survey.
These are:
-
How often do you feel lonely? (direct measure)
-
How often do you feel that you lack companionship? (indirect measure)
-
How often do you feel left out? (indirect measure)
-
How often do you feel isolated from others? (indirect measure)
The three indirect questions are used to create a loneliness score between three and nine, three being the least lonely and nine being the most.
For further information, see Measuring loneliness: guidance for use of the national indicators on surveys - Recommended measures for adults.
Overall in 2021/22:
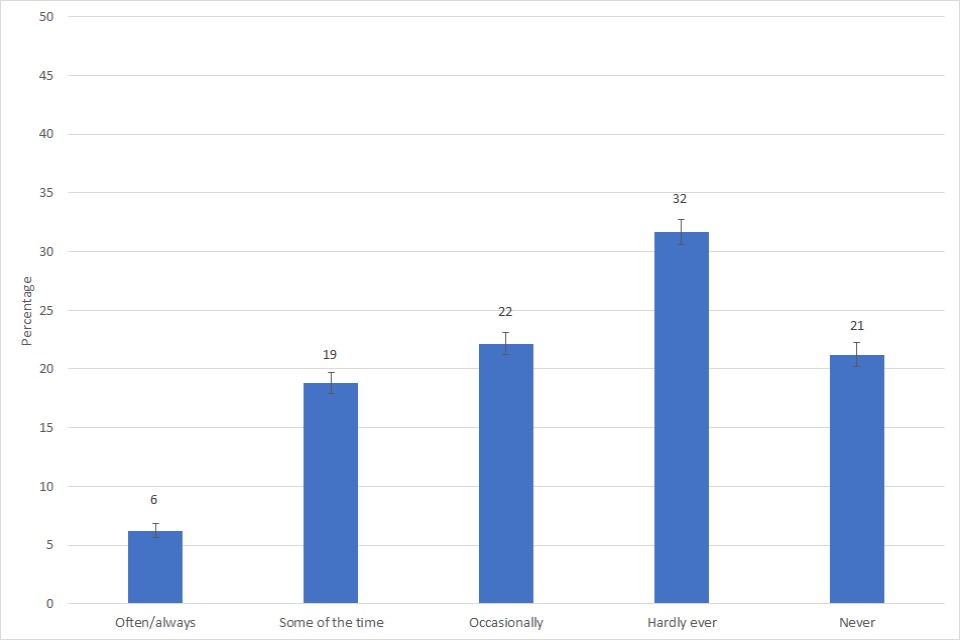
6%of respondents (approximately 3 million people in England) said they feel lonely often or always. This is the same as in 2019/20 and 2020/21.
21% of respondents (approximately 10 million people in England) said they never feel lonely, similar to 2020/21 (20%)
A composite loneliness score was produced combining the three indirect loneliness measures. A high score indicating loneliness was reported for 8% of respondents, approximately 4 million people in England; a similar proportion to 2020/21 (9%). However the composite score indicating low levels of loneliness was reported for 58% of respondents, significantly higher than the score in 2020/21 (53%).
There was no significant difference in the proportion of respondents reporting being lonely often/always and whether they formally volunteered or not (6% for those who did not formally volunteer vs 5% for those that did). This is different to 2020/21 and 2019/20 when respondents who formally volunteered were less likely to report being lonely often/always (4%) than those who did not formally volunteer (7%).
Figure 2.3: How often respondents feel lonely, 2021/22
Respondents who identified as male were more likely than those who identified as female to say that they never felt lonely (25% compared with 18%). [footnote 2]
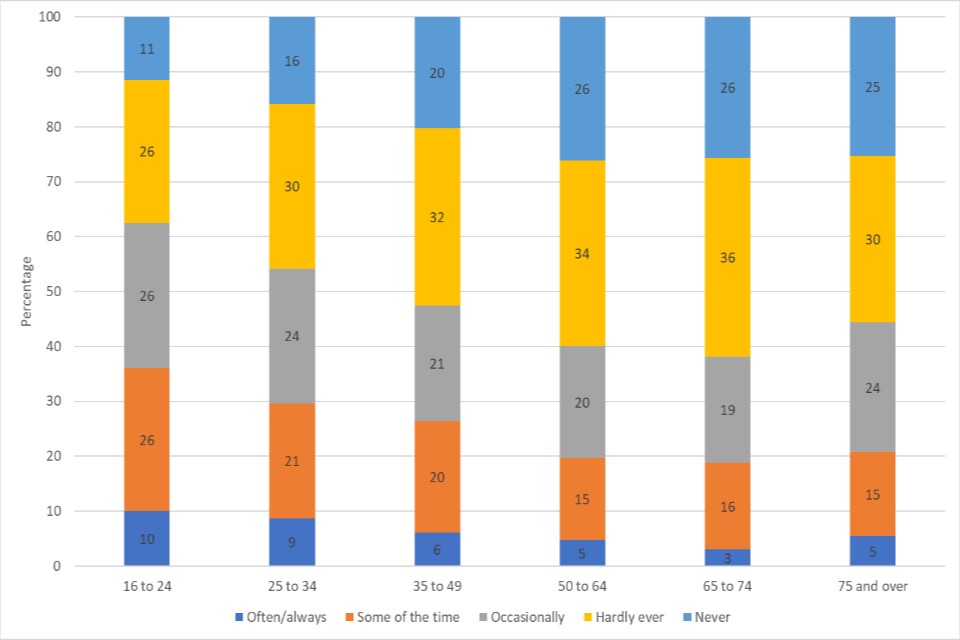
There were differences by age group in feelings of loneliness, with people aged 16-24 more likely to say they feel lonely often/always (10%) than every other age group (3 to 6%) aside from those aged 25-34 (9%).
Figure 2.4: How often respondents feel lonely by age group, 2021/22
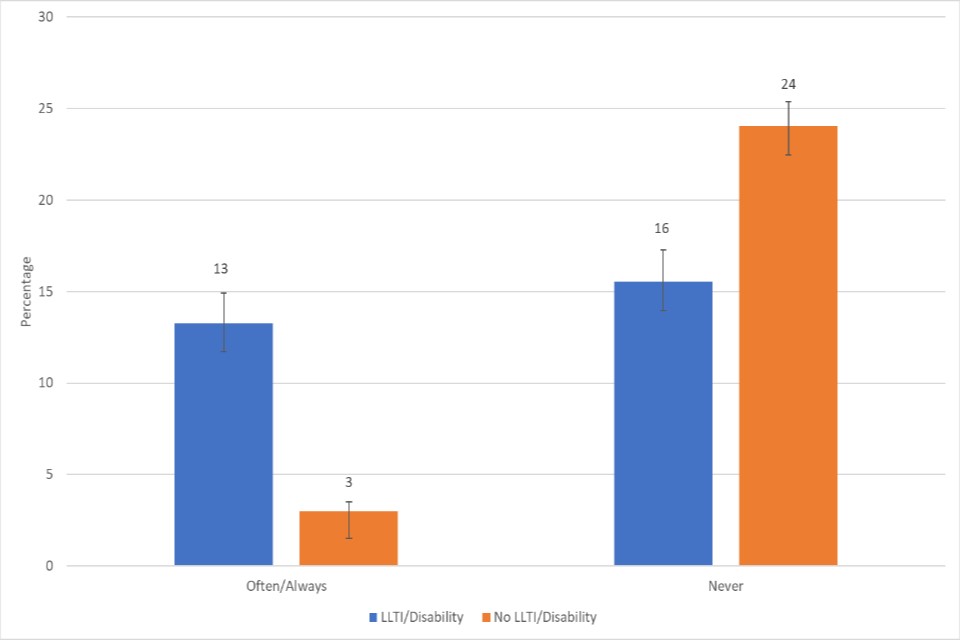
People with a limiting long-term illness or disability were more likely to say they felt lonely often/always than those without (13% compared with 3%) and less likely to say they never felt lonely (16% compared with 24%).
Those living in the most deprived areas were more likely to feel lonely often/always than those living in the least deprived areas (9% compared with 4%).
No variability was seen between different ethnic groups, region or rural/urban categories.
Figure 2.5: Proportion of respondents who feel lonely often/always or never, by limiting long-term illness/disability (LLTI/Disability), 2021/22
3. Indirect loneliness composite score
There is variation in how people understand the term “loneliness” and some people might be reluctant to admit to loneliness. To address this the Community Life Survey also asks three indirect questions about loneliness.
The three indirect questions asked respondents:
-
How often do you feel that you lack companionship?
-
How often do you feel left out?
-
How often do you feel isolated from others?
The three indirect questions are used to create a loneliness score between three and nine, three being the least lonely and nine being the most.
For further information, see Measuring loneliness: guidance for use of the national indicators on surveys - Recommended measures for adults.
Overall:
8% of respondents received a score of 8 or 9 (representing people who feel lonely most often).
Respondents who identified as either male or female were equally as likely to score an 8 or 9 (7% vs 9%). However males were more likely to score a 3 or 4 (people who feel lonely least often) than females (62% vs 54%).[footnote 2]
Respondents aged between 16-24 were more likely to score an 8 or a 9 than any other age groups (13% vs 5-9%), aside from 25-34 (10%).
Respondents with a limiting long-term illness or disability were more likely to score an 8 or 9 than those with no limiting long-term illness or disability (17% vs 4%).
Respondents from the most deprived areas were more likely to score an 8 or a 9 than those living in the least deprived area (11% vs 5%).
There were no differences observed across different ethnic groups, by region or across rural/urban areas.
-
The 95% confidence intervals are indicated by error bars on the charts. They show the range that we are 95% confident the true value for the population falls between. When there is no overlap between the error bars for two or more groups, we can be more confident that the differences between groups represent true differences between these groups in the population. ↩
-
Respondents who reported their gender as ‘other’ have not been included in this chart due to the number of respondents being small and therefore potentially disclosive. ↩ ↩2