Updated August 26, 2022, to correct errors in Figures B and D
Over the last 18 years, EPI has closely tracked trends in teacher pay. Over these nearly two decades, a picture of increasingly alarming trends has emerged.1 Simply put, teachers are paid less (in weekly wages and total compensation) than their nonteacher college-educated counterparts, and the situation has worsened considerably over time.
Prior to the pandemic, the long-trending erosion in the relative wages and total compensation of teachers was already a serious concern. The financial penalty that teachers face discourages college students from entering the teaching profession and makes it difficult for school districts to keep current teachers in the classroom. Trends in teacher pay coupled with pandemic challenges may exacerbate annual shortages of regular and substitute teachers.2
Providing teachers with compensation commensurate with that of other similarly educated professionals is not simply a matter of fairness but is necessary to improve educational outcomes and foster future economic stability of workers, their families, and communities across the U.S. We explain in greater detail why teacher pay and compensation is so important in a prior report (Allegretto and Mishel 2019). In this analysis, we add two more years, 2020 and 2021, to our long-running series.
Key findings
- Inflation-adjusted average weekly wages of teachers have been relatively flat since 1996. The average weekly wages of public school teachers (adjusted only for inflation) increased just $29 from 1996 to 2021, from $1,319 to $1,348 (in 2021 dollars). In contrast, inflation-adjusted weekly wages of other college graduates rose from $1,564 to $2,009 over the same period—a $445 increase.
- The relative teacher wage penalty grew to a record high in 2021. It was 23.5% in 2021, up from 6.1% in 1996. The penalty for men rose from 15.1% to 35.2% over that period. Women had a negligible wage penalty of 0.1% in 1996 but faced a wage penalty of 17.1% in 2021.
- The benefits advantage for teachers has not been enough to offset the growing wage penalty. The teacher total compensation penalty was 14.2% in 2021 (a 23.5% wage penalty offset by a 9.3% benefits advantage). The bottom line is that the teacher total compensation penalty grew by 11.5 percentage points from 1993 to 2021.
- The relative teacher wage penalty exceeds 20% in 28 states. Teacher weekly wage penalties estimated for each state range from 3.4% in Rhode Island to 35.9% in Colorado. In 28 states, teachers are paid less than 80 cents on the dollar earned by similar college-educated workers in those states.
Data and relevant information
We use two sources of data, both from the Bureau of Labor Statistics (BLS). We provide a comprehensive discussion of the data and methodologies that produce our teacher weekly wage and total compensation estimates in a prior report (Allegretto and Mishel 2019, Appendix A). Following is a summary of that discussion.
First, we use Current Population Survey Outgoing Rotation Groups (CPS-ORG) data for the wage analyses. We focus on weekly wages, which avoids comparisons of weekly hours worked or length of the work year (i.e., the “summers off” issue for teachers) between teachers and other college graduates.3 The sample is restricted to full-time workers (working at least 35 hours per week), 18 to 64 years old, with at least a bachelor’s degree. The education restriction is made because teachers today need at least a bachelor’s degree to teach. The sample is further limited to those who reported their wage information directly (i.e., nonresponders whose wage data was imputed by BLS are excluded).4
The BLS top-codes weekly wages above a defined threshold that has not been updated for inflation since 1998. As a result, a growing share of workers are assigned top-coded wages, which has generated a growing understatement of college graduate wages relative to those of teachers. EPI replaces original top-coded values with with Pareto-distribution implied means above the CPS top-code for men and women.5
The second data source we use to assess benefits is from BLS’s National Compensation Survey’s Employer Costs for Employee Compensation (ECEC) program. Specifically, we pull data on employer costs per hour worked for detailed categories of compensation for “primary, secondary, and special education school teachers” in the public sector and “civilian professionals”—the latter being the broadest category available that corresponds with all college graduates. “Benefits” in our analysis refers to employer costs for health and life insurance, retirement plans, and payroll taxes (i.e., Social Security, unemployment insurance, and workers’ compensation). The remaining components of compensation are “W-2 wages,” a wage measure that corresponds to the wages captured in the CPS data used above. W-2 wages are the wages reported to employees and to the Internal Revenue Service. They include “direct wages,” defined by the BLS as “regular payments from the employer to the employee as compensation for straight-time hourly work, or for any salaried work performed” and other wage items, including “supplemental pay.” Supplemental pay includes premium pay for overtime, bonus pay, profit-sharing, and “paid leave.”
A note about the COVID-19 pandemic
The COVID-19 pandemic and related recession may have affected the comparability of the 2020 and 2021 data with CPS data from earlier years. Pandemic-related workforce disruptions were significantly greater than workforce disruptions at any time in recent experience. These disruptions may have affected the quality and the comparability of the CPS data for those years.
Gould and Kandra (2022) investigated the issue and provide insights into the most affected workers by demographics and educational attainment. They show that employment losses in the 12 months after the onset of the pandemic relative to the 12 months immediately prior to the pandemic were heavily concentrated among workers with less than a four-year college degree (down 17.4% for workers with less than a high school degree, down 11.3% for those with only a high school degree, and down 10.1% for those with less than a four-year college degree).6
However, employment changes over the same time frame were much smaller for workers with higher levels of formal education. According to Gould and Kandra, employment was down just 3.5% for workers with a four-year college degree, while for those with advanced degrees, employment was actually up 0.6%. Additionally, in the second 12 months (i.e., months 13–24) following the onset of the pandemic, employment more than recovered for those with at least a four-year degree, which was not the case for any other category of educational attainment.
As noted above, our sample is restricted to workers who have at least a bachelor’s degree, and according to Gould and Kandra’s findings, these are the workers who were least affected by pandemic disruptions. While it is possible that labor market disruptions may distort our findings here, we do know that workers in our sample were much less affected by the employment disruptions resulting from the pandemic than other workers.7 We therefore proceed following the same methodology we have used for earlier versions of this analysis. Any pandemic-related issues with the data that come to light will be addressed in future updates of this work.
Findings
Our findings are presented in four sections. We first present trends in annual average weekly wages (adjusted for inflation) from 1979 through 2021 for teachers and other college graduates. Next, we report annual estimates of the national teacher weekly wage penalty using standard regression techniques to control for systematic differences in age, education, state of residence, and other factors known to affect wage rates. Third, we offer regression-adjusted estimates of the teacher pay gap for each state and for the District of Columbia. Finally, we factor in nonwage benefits to estimate a total compensation penalty that includes wages and benefits at the national level (which is not possible for each state).
Weekly wage trends: The unadjusted gap
The trends in average weekly wages of public school teachers and of other college graduates, adjusted only for inflation, are presented in Figure A. As discussed in a prior report (Allegretto and Mishel 2019, Appendix A), flags to identify imputed wage data (i.e., data not directly reported by the survey respondent) are incomplete or not available for 1994 and 1995; data points for these years are interpolated and represented by dotted lines in the figure.
Teachers’ weekly wages have remained relatively flat for 25 years: Average weekly wages of public school teachers and other college graduates, 1979–2021
| Year | Public school teachers | Other college grads | Public school teachers | Other college grads | Public school teachers | Other college grads |
|---|---|---|---|---|---|---|
| 1979 | $1,052 | $1,364 | ||||
| 1980 | $1,014 | $1,330 | ||||
| 1981 | $1,022 | $1,340 | ||||
| 1982 | $1,037 | $1,367 | ||||
| 1983 | $1,050 | $1,387 | ||||
| 1984 | $1,092 | $1,408 | ||||
| 1985 | $1,118 | $1,435 | ||||
| 1986 | $1,171 | $1,495 | ||||
| 1987 | $1,195 | $1,519 | ||||
| 1988 | $1,233 | $1,548 | ||||
| 1989 | $1,211 | $1,510 | ||||
| 1990 | $1,218 | $1,509 | ||||
| 1991 | $1,213 | $1,510 | ||||
| 1992 | $1,224 | $1,526 | ||||
| 1993 | $1,250 | $1,536 | $1,250 | $1,536 | ||
| 1994 | $1,273 | $1,545 | ||||
| 1995 | $1,296 | $1,555 | ||||
| 1996 | $1,319 | $1,564 | $1,319 | $1,564 | ||
| 1997 | $1,311 | $1,596 | ||||
| 1998 | $1,316 | $1,644 | ||||
| 1999 | $1,316 | $1,705 | ||||
| 2000 | $1,319 | $1,727 | ||||
| 2001 | $1,311 | $1,751 | ||||
| 2002 | $1,322 | $1,775 | ||||
| 2003 | $1,336 | $1,773 | ||||
| 2004 | $1,334 | $1,773 | ||||
| 2005 | $1,292 | $1,766 | ||||
| 2006 | $1,283 | $1,776 | ||||
| 2007 | $1,293 | $1,758 | ||||
| 2008 | $1,277 | $1,760 | ||||
| 2009 | $1,333 | $1,812 | ||||
| 2010 | $1,352 | $1,811 | ||||
| 2011 | $1,302 | $1,767 | ||||
| 2012 | $1,284 | $1,784 | ||||
| 2013 | $1,280 | $1,794 | ||||
| 2014 | $1,259 | $1,784 | ||||
| 2015 | $1,286 | $1,844 | ||||
| 2016 | $1,292 | $1,891 | ||||
| 2017 | $1,288 | $1,870 | ||||
| 2018 | $1,288 | $1,907 | ||||
| 2019 | $1,319 | $1,931 | ||||
| 2020 | $1,339 | $2,005 | ||||
| 2021 | $1,348 | $2,009 |
Notes: Figure shows average weekly wages (2021$) of public school teachers (elementary, middle, and secondary) and other college graduate (nonteacher) peers. Data points for 1994 and 1995 are unavailable; dotted lines represent interpolated data. See Allegretto and Mishel 2019, Appendix A, for more details on data and methodology.
Source: Author’s analysis of Current Population Survey Outgoing Rotation Group data accessed via the EPI Current Population Survey Extracts, Version 1.0.29 (EPI 2022a), https://microdata.epi.org.
In 1979, teachers earned $1,052 per week (in 2021 dollars), which is 22.9% less than the $1,364 earned by other college graduates. The difference in wages between teachers and other college graduates decreased slightly into the mid-1990s, falling to 15.7% in 1996, but then increased considerably during the tight labor markets of the late 1990s into the early 2000s. The wages of nonteacher college graduates jumped by 13.5% from 1996 to 2002 during an unusual time of exceptional wage growth among low-, middle-, and high-wage earners. But inflation-adjusted wages of teachers did not grow strongly during this period, in part because teacher pay is often set by long-term contracts, and public-sector wages are not as volatile (they do not rise and fall as much) as private-sector wages. Teacher weekly wages remained flat in inflation-adjusted terms from 1996 to 2002, increasing just 0.3%, leaving the real average weekly wage of teachers 25.5% less than their college graduate counterparts.
This difference remained fairly consistent, with some ups and downs, throughout the 2000s. But, a significant widening of the wage gap has occurred since 2010 as teacher wages remained relatively flat while wages of other college graduates took off. The difference increased by 7.6 percentage points between 2010 and 2021—leaving the average weekly wages of teachers 32.9% behind that of other college graduates by 2021, the largest difference recorded in our series.
Regression-adjusted wage gaps
To obtain an apples-to-apples comparison of earnings between teachers and nonteacher college graduates, we must control for any systematic differences in factors that typically affect pay, including a worker’s age, formal education (B.A., M.A., professional degree, or Ph.D.), marital status, race/ethnicity, and state of residence. To do this, we use standard regression techniques to estimate the weekly wages of public school teachers relative to other college graduates.8 We do this for all teachers (which includes a gender control), as well as separately for women and men.
Teachers earn 23.5% less than comparable college graduates: Public school teacher weekly wage penalty (or premium) for all teachers and by gender, 1979–2021
| Year | All | Women | Men | All | Women | Men | All | Women | Men |
|---|---|---|---|---|---|---|---|---|---|
| 1979 | -7.1% | 6.5% | -16.6% | ||||||
| 1980 | -9.30% | 4.50% | -19.20% | ||||||
| 1981 | -10.10% | 3.10% | -19.00% | ||||||
| 1982 | -10.20% | 2.80% | -19.40% | ||||||
| 1983 | -11.80% | 1.00% | -20.70% | ||||||
| 1984 | -10.00% | 2.50% | -19.70% | ||||||
| 1985 | -10.20% | 1.90% | -19.50% | ||||||
| 1986 | -8.80% | 3.20% | -18.40% | ||||||
| 1987 | -7.90% | 3.90% | -18.10% | ||||||
| 1988 | -8.00% | 5.10% | -18.20% | ||||||
| 1989 | -8.20% | 3.00% | -17.00% | ||||||
| 1990 | -7.70% | 4.00% | -17.90% | ||||||
| 1991 | -9.10% | 0.60% | -16.30% | ||||||
| 1992 | -7.00% | 3.10% | -15.60% | ||||||
| 1993 | -5.1% | 4.1% | -13.1% | -5.10% | 4.10% | -13.10% | |||
| 1994 | -5.40% | 2.70% | -13.70% | ||||||
| 1995 | -5.70% | 1.30% | -14.40% | ||||||
| 1996 | -6.1% | -0.1% | -15.1% | -6.1% | -0.1% | -15.1% | |||
| 1997 | -6.20% | 1.20% | -18.60% | ||||||
| 1998 | -9.00% | -1.50% | -20.50% | ||||||
| 1999 | -10.40% | -2.70% | -21.70% | ||||||
| 2000 | -11.80% | -5.10% | -22.70% | ||||||
| 2001 | -12.10% | -4.00% | -25.30% | ||||||
| 2002 | -12.10% | -5.10% | -24.10% | ||||||
| 2003 | -11.30% | -4.90% | -21.20% | ||||||
| 2004 | -12.80% | -6.20% | -23.30% | ||||||
| 2005 | -13.30% | -6.30% | -24.50% | ||||||
| 2006 | -15.00% | -8.00% | -27.30% | ||||||
| 2007 | -11.70% | -4.70% | -23.40% | ||||||
| 2008 | -14.50% | -7.70% | -25.70% | ||||||
| 2009 | -12.50% | -4.50% | -24.70% | ||||||
| 2010 | -11.90% | -4.60% | -23.70% | ||||||
| 2011 | -12.80% | -6.40% | -24.20% | ||||||
| 2012 | -16.00% | -10.00% | -26.20% | ||||||
| 2013 | -16.40% | -10.10% | -27.30% | ||||||
| 2014 | -16.50% | -10.50% | -26.20% | ||||||
| 2015 | -18.40% | -13.40% | -26.70% | ||||||
| 2016 | -19.40% | -12.20% | -31.60% | ||||||
| 2017 | -20.90% | -15.50% | -30.50% | ||||||
| 2018 | -22.00% | -15.90% | -31.80% | ||||||
| 2019 | -19.20% | -13.20% | -30.20% | ||||||
| 2020 | -21.60% | -15.20% | -33.80% | ||||||
| 2021 | -23.5% | -17.1% | -35.2% |
Notes: Figure shows regression-adjusted weekly wage penalties (or premiums) for public school teachers (elementary, middle, and secondary) relative to their college-educated, nonteaching peers. Data points for 1994 and 1995 are unavailable; dotted lines represent interpolated data. See Allegretto and Mishel 2019, Appendix A, for more details on data and methodology.
Figure reports regression-adjusted teacher weekly wage penalties: how much less, in percentage terms, public school teachers (elementary, middle, and secondary) earn in weekly wages relative to their college-educated, nonteaching peers. College-educated workers refers to workers who have a bachelor’s degree or more education. The dependent variable is (log) weekly wages with indicator controls on public school teacher, private school teacher, gender, and married, along with indicator sets on education (M.A., professional degree, Ph.D.) and race/ethnicity (Black, Hispanic, other); also included are age as a quartic and state fixed effects. See Allegretto and Mishel 2019, Appendix A, for more details on data and methodology.
Source: Author’s analysis of Current Population Survey Outgoing Rotation Group data accessed via the EPI Current Population Survey Extracts, Version 1.0.29 (EPI 2022a), https://microdata.epi.org.
We present relative wages as percentage differences from the perspective of teachers, i.e., how much less (or more) teachers earn in weekly wages relative to other college graduates. We define a weekly wage “penalty” for teachers when the regression estimates suggest that teachers, all else equal, are paid less than other college graduates; the penalty appears as a negative number in Figure B. When teachers are paid more, the number is positive and is referenced as a “premium.”
Generally, the teacher wage penalty has been on a worsening trajectory since the mid-1990s. A slight shrinking of the gap in 2019 was short lived. It widened again in 2020, to 21.6%, and in 2021, the penalty reached a record 23.5%. That means that, on average, teachers earned just 76.5 cents on the dollar compared with what similar college graduates earned working in other professions—and much less than the relative 93.9 cents on the dollar that teachers earned in 1996.
Relative wage trends by gender are revealing. First, through the mid-1990s, women in the teaching profession had a relative wage “premium” (or were close to parity) relative to comparable women working in other professions. In earlier work (Allegretto, Corcoran, and Mishel 2008), we showed that women teachers had a 14.7% wage premium in 1960. In 2021, they had a 17.1% wage penalty. Thus, over six decades there has been a 31.8 percentage-point swing for the worse in the relative wage gap for women teachers.
The large wage penalty that men face in the teaching profession goes a long way toward explaining why the gender makeup of the profession has not changed much over the past few decades. The pre-1996 wage penalty for male teachers, compared with other male college graduates, was already large; by 2021, it had grown to a record 35.2%.
The wage penalty for teachers overall hit record levels in 2021. When we break it down by gender, we see that both men and women faced record-high wage penalties for choosing teaching as a career.
Teacher weekly wage penalties by state
To this point, we have focused on average public school teacher wage penalties for the United States as a whole. Next, we present regression-adjusted teacher wage penalties by state. To estimate relative teacher earnings by state, we pool six years of CPS data from 2016 through 2021 to assure ample sample sizes for each state. Again, we compare public school teachers with nonteacher college graduates within each state and estimate gaps for each state and the District of Columbia.
The teacher weekly wage penalty is greater than 20% in 28 states: Teacher weekly wage penalty, by state
| State | Teacher weekly pay penalty |
|---|---|
| Colorado | -35.9% |
| Oklahoma | -32.8% |
| Virginia | -32.7% |
| Arizona | -32.0% |
| Alabama | -30.6% |
| Oregon | -29.4% |
| Washington | -29.1% |
| Missouri | -28.3% |
| Louisiana | -27.8% |
| New Mexico | -27.4% |
| Georgia | -26.8% |
| Minnesota | -25.9% |
| Idaho | -25.2% |
| Kentucky | -24.7% |
| North Carolina | -24.5% |
| Maine | -24.0% |
| Tennessee | -23.8% |
| Illinois | -23.4% |
| Kansas | -22.6% |
| Utah | -22.5% |
| Wisconsin | -22.2% |
| Texas | -21.5% |
| Indiana | -21.4% |
| Nebraska | -20.7% |
| Arkansas | -20.5% |
| Massachusetts | -20.5% |
| Nevada | -20.4% |
| Maryland | -20.3% |
| New Hampshire | -19.9% |
| Florida | -19.6% |
| West Virginia | -19.2% |
| District of Columbia | -19.0% |
| Michigan | -18.4% |
| South Dakota | -17.9% |
| North Dakota | -17.8% |
| California | -17.6% |
| Connecticut | -17.1% |
| Montana | -17.0% |
| Iowa | -16.3% |
| Hawaii | -15.5% |
| Pennsylvania | -15.2% |
| Alaska | -14.9% |
| Mississippi | -14.7% |
| Ohio | -14.4% |
| Vermont | -13.6% |
| New York | -13.2% |
| Delaware | -10.9% |
| South Carolina | -8.3% |
| New Jersey | -4.5% |
| Wyoming | -4.0% |
| Rhode Island | -3.4% |
Notes: Figure shows state-specific regression-adjusted weekly wage penalties for public school teachers (elementary, middle, and secondary) relative to their college-educated, nonteaching peers. See Allegretto and Mishel 2019, Appendix A, for more details on data and methodology.
Figure reports state-specific regression-adjusted teacher weekly wage penalties: how much less, in percentage terms, public school teachers (elementary, middle, and secondary) earn in weekly wages relative to their college-educated, nonteaching peers. College-educated workers refers to workers who have a bachelor’s degree or more education. The dependent variable is (log) weekly wages with indicator controls on public school teacher, public school teacher interacted with each state (relevant estimate), private school teacher, gender, and married, along with indicator sets on education (M.A., professional degree, Ph.D.) and race/ethnicity (Black, Hispanic, other); also included are age as a quartic, state fixed effects. See Allegretto and Mishel 2019, Appendix A, for more details on data and methodology.
Source: Author’s analysis of pooled 2016–2021 Current Population Survey Outgoing Rotation Group data accessed via the EPI Current Population Survey Extracts, Version 1.0.29 (EPI 2022a), https://microdata.epi.org.
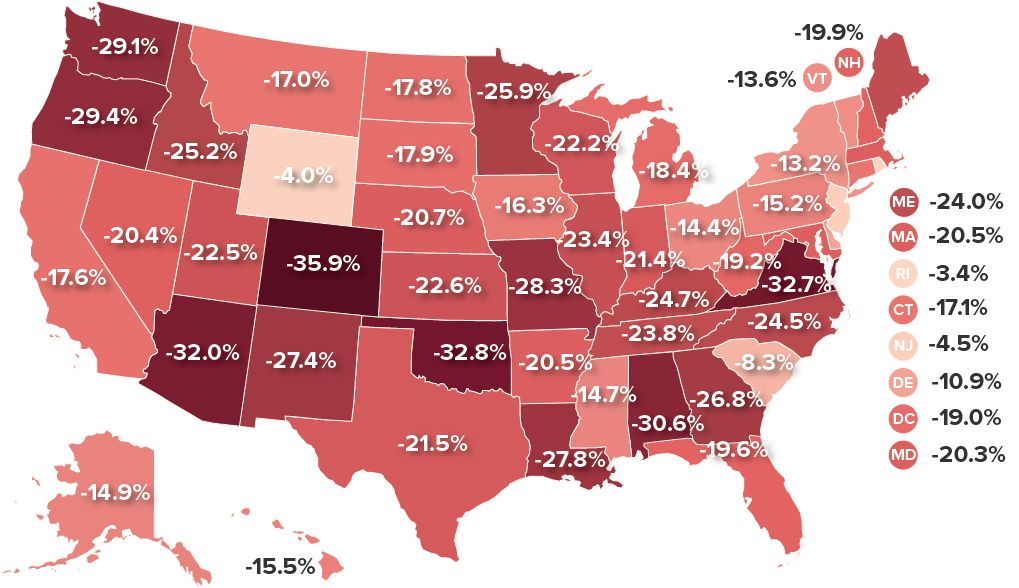
In no state does the relative weekly wage of teachers equal or surpass that of their nonteaching college graduate counterparts. Figure C presents state gaps in a bar chart, ranked from the largest wage penalty to the smallest (Figure D presents the same data in a map). Rhode Island, Wyoming, and New Jersey have the smallest wage penalties—at 3.4%, 4.0%, and 4.5%, respectively. Colorado has the largest gap at 35.9%. Four other states join Colorado in having wage penalties above 30%: Oklahoma (32.8%), Virginia (32.7%), Arizona (32.0%), and Alabama (30.6%).9 Teacher wage penalties are larger than 20% in 28 states.
How underpaid are teachers in your state?: Depending on the state, teachers make between 3.4% and 35.9% less than other comparable college-educated workers
| State | Teacher weekly pay penalty |
|---|---|
| Colorado | -35.9% |
| Oklahoma | -32.8% |
| Virginia | -32.7% |
| Arizona | -32.0% |
| Alabama | -30.6% |
| Oregon | -29.4% |
| Washington | -29.1% |
| Missouri | -28.3% |
| Louisiana | -27.8% |
| New Mexico | -27.4% |
| Georgia | -26.8% |
| Minnesota | -25.9% |
| Idaho | -25.2% |
| Kentucky | -24.7% |
| North Carolina | -24.5% |
| Maine | -24.0% |
| Tennessee | -23.8% |
| Illinois | -23.4% |
| Kansas | -22.6% |
| Utah | -22.5% |
| Wisconsin | -22.2% |
| Texas | -21.5% |
| Indiana | -21.4% |
| Nebraska | -20.7% |
| Arkansas | -20.5% |
| Massachusetts | -20.5% |
| Nevada | -20.4% |
| Maryland | -20.3% |
| New Hampshire | -19.9% |
| Florida | -19.6% |
| West Virginia | -19.2% |
| District of Columbia | -19.0% |
| Michigan | -18.4% |
| South Dakota | -17.9% |
| North Dakota | -17.8% |
| California | -17.6% |
| Connecticut | -17.1% |
| Montana | -17.0% |
| Iowa | -16.3% |
| Hawaii | -15.5% |
| Pennsylvania | -15.2% |
| Alaska | -14.9% |
| Mississippi | -14.7% |
| Ohio | -14.4% |
| Vermont | -13.6% |
| New York | -13.2% |
| Delaware | -10.9% |
| South Carolina | -8.3% |
| New Jersey | -4.5% |
| Wyoming | -4.0% |
| Rhode Island | -3.4% |
Notes: Figure shows state-specific regression-adjusted weekly wage penalties for public school teachers (elementary, middle, and secondary) relative to their college-educated, nonteaching peers. See Allegretto and Mishel 2019, Appendix A, for more details on data and methodology.
Figure reports state-specific regression-adjusted teacher weekly wage penalties: how much less, in percentage terms, public school teachers (elementary, middle, and secondary) earn in weekly wages relative to their college-educated, nonteaching peers. College-educated workers refers to workers who have a bachelor’s degree or more education. The dependent variable is (log) weekly wages with indicator controls on public school teacher, public school teacher interacted with each state (relevant estimate), private school teacher, gender, and married, along with indicator sets on education (M.A., professional degree, Ph.D.) and race/ethnicity (Black, Hispanic, other); also included are age as a quartic, state fixed effects. See Allegretto and Mishel 2019, Appendix A, for more details on data and methodology.
Source: Author’s analysis of pooled 2016–2021 Current Population Survey Outgoing Rotation Group data accessed via the EPI Current Population Survey Extracts, Version 1.0.29 (EPI 2022a), https://microdata.epi.org.
Adding benefits to the picture
The analysis thus far has focused specifically on teachers’ weekly wages relative to those of other comparable college graduates. Yet benefits such as retirement plans and health insurance make up a sizeable share of a worker’s total compensation package. Thus, to get a more complete picture of how teachers are faring relative to other college graduates, we need to factor in those benefits. Teachers generally receive a higher share of their compensation as benefits than other professionals do, partially offsetting the weekly wage penalty they face. In this section we examine the teacher benefits advantage and how it impacts relative total compensation.10
Table 1 provides the basic information necessary to compare the benefits packages of primary, secondary, and special education public school teachers with those of comparable workers (specifically, workers in professional occupations).11 This table draws on the BLS Employer Costs for Employee Compensation (ECEC) series.
The teacher compensation penalty grew to 14.2% in 2021: Trends in the teacher total compensation penalty, selected years, 1979–2021
| W-2 wage share of compensation | Public school teachers | ||||
|---|---|---|---|---|---|
| Year | Professionals | Public school teachers | Wage penalty | Benefits advantage | Compensation penalty |
| 1979 | n.a. | n.a. | -7.3% | n.a. | n.a. |
| 1993 | n.a. | n.a. | -5.1% | 2.4% | -2.7% |
| 2004 | 81.3% | 79.3% | -12.8% | 2.2% | -10.7% |
| 2007 | 80.7% | 77.2% | -11.7% | 4.0% | -7.7% |
| 2010 | 79.8% | 75.6% | -11.9% | 4.9% | -7.1% |
| 2017 | 78.1% | 71.4% | -20.9% | 7.4% | -13.5% |
| 2018 | 78.5% | 70.9% | -22.0% | 8.3% | -13.7% |
| 2019 | 78.6% | 70.7% | -19.2% | 9.0% | -10.2% |
| 2020 | 78.4% | 70.5% | -21.6% | 8.8% | -12.8% |
| 2021 | 78.5% | 70.1% | -23.5% | 9.3% | -14.2% |
| Percentage-point change | |||||
| 1979–1991 | n.a. | n.a. | 2.0 | n.a. | n.a. |
| 1993–2007 | n.a. | n.a. | -6.6 | 1.6 | -5.0 |
| 1994–2007 | -0.6 | -2.1 | n.a. | n.a. | n.a. |
| 2007–2019 | -2.1 | -6.5 | -7.5 | 5.0 | -2.5 |
| 2007–2021 | -2.1 | -7.1 | -11.8 | 5.3 | -6.5 |
| 2019–2020 | -0.1 | -0.2 | -2.4 | -0.1 | -2.5 |
| 2020–2021 | 0.1 | -0.4 | -1.9 | 0.4 | -1.5 |
| 2019–2021 | 0.0 | -0.7 | -4.3 | 0.3 | -4.0 |
| 1993–2021 | n.a. | n.a. | -18.4 | 6.9 | -11.5 |
Notes: The benefits advantage is the degree to which higher benefits offset the wage penalty. See the “Computing the Benefits Advantage” section in Appendix A of Allegretto and Mishel 2019 for data and methodology details. “n.a.” indicates that data are not available. Explanations of missing data and other data issues are documented in the “Historical Data Issues” section of the 2019 appendix.
Source: Author’s analysis of Current Population Survey Outgoing Rotation Group data and Bureau of Labor Statistics Employer Costs for Employee Compensation data.
The first pair of columns in Table 1 under “W-2 wage share of compensation” present the share of W-2 wages in total compensation for professionals in all occupations and for state and local K–12 public school teachers. The W-2 wage share of compensation and the benefits share of compensation sum to 100%. These W-2 shares allow us to examine how important wages are relative to benefits in the total compensation package.
In 2021, for example, teacher W-2 wages made up 70.1% of their total compensation. For professionals, the share was 78.5%. That means that for every dollar of teachers’ total compensation, 70.1 cents went to wages and 29.9 cents went to benefits, while for professionals, 78.5 cents went to wages and 21.5 cents went to benefits. Therefore, for every dollar of total compensation, public school teachers receive more in benefits than other professionals. We refer to this as the “benefits advantage.”12
The columns under “Public school teachers” in Table 1 provide the information for our calculations. The “Wage penalty” column reports the teacher wage penalty from Figure B, followed by the “Benefits advantage” that teachers have; combining these two figures gives us an estimate for the teacher total compensation penalty, shown in the last column. The benefits advantage for teachers partially offsets their estimated relative wage disadvantage and thus shrinks the teacher total compensation gap.
The benefits advantage for teachers in 2021 was 9.3%, significantly higher than the 2.4% teacher benefits advantage in 1993. This was not enough, however, to offset the decline in relative wages over the same period—from -5.1% in 1993 to -23.5% in 2021. The total teacher compensation penalty was 14.2% in 2021—widening the total compensation gap by 4 percentage points from 2019 to 2021.
Final thoughts
This report is the latest in a series that has included two books and numerous reports over the last 18 years. The picture that continues to emerge is one of a long-steep relative erosion of teacher wages. Adding benefits to the picture helps, but the 2021 total compensation gap (14.2%) is the worst we have ever reported, as are the weekly wage gaps.
Among those students who would like to dedicate their careers to teaching, many are undoubtedly choosing to forgo a public school teaching career in lieu of a better-paying career choice. The most oft-cited reason for a lack of interest in teaching—according to a survey of potential students taking a college entrance examination—is low teacher salaries (Croft, Guffy, and Vitale 2018). Parents of college-bound students may discourage them from considering teaching as a career. A poll showed that a majority of parents would not want their children to become teachers, many citing low pay as a major factor (PDK 2018).
Without targeted and significant policy action—not just on teacher pay but on school funding more generally—there can be no reasonable expectation of reversal in sight for pandemic-stressed schools and those who serve public education (see Allegretto, García, and Weiss 2022). For teachers, the pandemic exposed and heightened long-standing fissures—including worsening shortages of permanent teachers and qualified substitutes. This report again sounds the alarm on the long erosion in relative teacher wages and the widening gap in total compensation—which makes the prospects for attracting and retaining the teachers needed to alleviate shortages difficult at best.
Notes
1. See How Does Teacher Pay Compare (Allegretto, Corcoran, and Mishel 2004); The Teacher Penalty (Allegretto, Corcoran, and Mishel 2008); and the following issue briefs and reports in the series: Allegretto, Corcoran, and Mishel 2011; Allegretto and Tojerow 2014; and Allegretto and Mishel 2016, 2018, 2019.
2. For a wide-ranging examination of teacher shortages see the EPI summary of papers on the topic by García and Weiss (2020) and the Learning Policy Institute’s blog series (LPI 2022).
3. In Allegretto and Mishel 2019, we provide evidence that teachers work weekly hours similar to those of other professionals.
4. Our earlier work documents that BLS’s imputation method overstates teacher earnings, which is not the case for the other college graduate sample (Allegretto, Corcoran, and Mishel 2008, 9).
5. For more about top-code adjustments, see EPI 2022b.
6. See Gould and Kandra 2022, Table 1.
7. CPS data collection procedures and response rates were also affected by the pandemic. McIllece (2020) provides some insights into resultant bias in top-line labor force statistics such as the unemployment rate.
8. The wage model includes controls for both public school teacher and private school teacher. The weekly wage penalty estimates are based on the coefficient on the public school teacher indicator. Regression for all teachers includes a gender control. See Allegretto and Mishel 2019, Appendix A, for specification details.
9. The state outcomes from our 2019 report are similar, which is not unexpected given that there is some overlap in the CPS data we use. In 2019 we estimated the state gaps using 2014–2019 data; in this report, we use 2016–2021 data.
10. We draw heavily on our prior work analyzing the “benefits bias”—which we now label the “benefits advantage” (see Allegretto, Corcoran, and Mishel 2004, 2008).
11. The ECEC provides compensation data for a narrower category of “primary, secondary, and special education school teachers” and for a broader category of “teachers.” We analyze the narrower category, which closely matches the definition of teachers in our CPS-ORG data, using data limited to state and local public-sector workers. The inclusion of kindergarten and special education teachers in the benefits analysis does not produce any more substantial differences than if they were excluded (as they are in the CPS sample used to estimate the wage penalty). Greater methodological detail is provided in Appendix A of Allegretto and Mishel 2019.
12. Our analysis accounts for differences in annual weeks worked, as it is based on the usual weekly wages of teachers and other college graduates, not hourly wages or annual earnings. One reason health and pension costs are higher for teachers is that teacher health benefits are provided for a full year while teacher salaries are for less than a full year.
References
Allegretto, Sylvia A., Sean P. Corcoran, and Lawrence Mishel. 2004. How Does Teacher Pay Compare? Methodological Challenges and Answers. Washington, D.C.: Economic Policy Institute.
Allegretto, Sylvia A., Sean P. Corcoran, and Lawrence Mishel. 2008. The Teaching Penalty: Teacher Pay Losing Ground. Washington, D.C.: Economic Policy Institute.
Allegretto, Sylvia A., Sean P. Corcoran, and Lawrence Mishel. 2011. The Teaching Penalty: An Update Through 2010. Economic Policy Institute Issue Brief no. 298, March 2011.
Allegretto, Sylvia A., Emma García, and Elaine Weiss. 2022. Public Education Funding in the U.S. Needs an Overhaul: How a Larger Federal Role Would Boost Equity and Shield Children from Disinvestment During Downturns. Economic Policy Institute, July 2022.
Allegretto, Sylvia A., and Lawrence Mishel. 2016. The Teacher Pay Gap Is Wider Than Ever: Teachers’ Pay Continues to Fall Further Behind Pay of Comparable Workers. Economic Policy Institute, August 2016.
Allegretto, Sylvia A., and Lawrence Mishel. 2018. The Teacher Pay Penalty Has Hit a New High: Trends in the Teacher Wage and Compensation Gaps Through 2017. Economic Policy Institute, September 2018.
Allegretto, Sylvia A., and Lawrence Mishel. 2019. The Teacher Weekly Wage Penalty Hit 21.4 Percent in 2018, a Record High. Economic Policy Institute, April 2019.
Allegretto, Sylvia A., and Ilan Tojerow. 2014. “Teacher Staffing and Pay Differences: Public and Private Schools.” Monthly Labor Review (U.S. Department of Labor, Bureau of Labor Statistics), September 2014.
Bureau of Labor Statistics (BLS). 2022a. “Employer Costs for Employee Compensation – December 2021” (news release). March 18, 2022.
Bureau of Labor Statistics (BLS). 2022b. Employer Costs for Employee Compensation Historical Listing: National Compensation Survey, March 2004–September 2021.
Croft, Michelle, Gretchen Guffy, and Dan Vitale. 2018. Encouraging More High School Students to Consider Teaching. ACT Policy Research, June 2018.
Economic Policy Institute (EPI). 2022a. Current Population Survey Extracts, Version 1.0.27, https://microdata.epi.org.
Economic Policy Institute (EPI). 2022b. “Methodology: Wage Variables.” EPI Microdata Extracts documentation, accessed August 2022.
García, Emma, and Elaine Weiss. 2020. Examining the Factors That Play a Role in the Teacher Shortage Crisis: Key Findings from EPI’s “Perfect Storm in the Teacher Labor Market” Series. Economic Policy Institute, October 2020.
Gould, Elise, and Jori Kandra. 2022. State of Working America 2021: Measuring Wages in the Pandemic Labor Market. Economic Policy Institute, April 2022.
Learning Policy Institute (LPI). 2022. Blog Series on Educator Quality: Recruitment & Retention. LPI Blog. Accessed July 2022.
McIllece, Justin J. 2020. “Covid-19 and the Current Population Survey: Response Rates and Estimation Bias.” U.S. Bureau of Labor Statistics, Office of Survey Methods Research, October 2020.
Phi Delta Kappan (PDK). 2018. Teaching: Respect but Dwindling Appeal. The 50th Annual PDK Poll of the Public’s Attitudes Toward the Public Schools. Supplement to Kappan magazine, September 2018.
Figure B has been corrected to fix the wage penalties from 1995 through 2020, which were originally shifted by one year. The 2021 wage penalties were correctly reported in the original. In the “Key Findings” box, text has been corrected to reflect Figure B corrections: The 1996 penalty for men was 15.1% (not 18.6%); for women, the penalty was 0.1% (rather than a wage premium of 1.3%).
Figure D has been corrected to fix typographical errors. The teacher pay penalty in Pennsylvania is 15.2% (not 14.2%, as originally reported); in Indiana, 21.4% (not 21.3%); in Georgia, 26.8% (not 26.5%).
