Defining Quality Tolerance Limits and Key Risk Indicators that Detect Risks in a Timely Manner: Reflections from Early Adopters on Emerging Best Practices (Part 3)
Series Part 3—Methods for early detection of risk and summary.
In Part 1 of our guidance for quality tolerance limit (QTL) use in clinical research, we summarized the WCG Metrics Champion Consortium (MCC), now part of the WCG Avoca Quality Consortium, QTL Working Group discussions that explored the relationship between QTL and key risk indicators (KRIs). In Part 2 of the series, we delved into the process of defining QTLs. In this final section, we will focus on methods for the early detection of risk. We then offer a summary plus an appendix featuring a worked example.
Early signal detection in risk control
QTLs are designed for risk control (see section 5.0.4 of ICH E6 (R2)).1 A key element of effective risk control is the earliest possible detection of risk to enable proactive interventions that prevent or minimize the impact of issues that matter. Unfortunately, as described in Part 1 of the series, the more sensitive a measurement is to risk early in the trial, the more likely it will provide false signals. As deviations from the QTLs (signals) need to be reported in the clinical study report (CSR), this is an effective disincentive to use QTLs that will provide an early signal. TransCelerate Biopharma2 proposes using a “secondary limit” to overcome this challenge. The secondary limit is typically 50-75% of the QTL threshold. It is an “early warning” system to alert the study team that the threshold might be exceeded in due course. It provides an earlier signal of risk that does not need to be reported in the CSR.
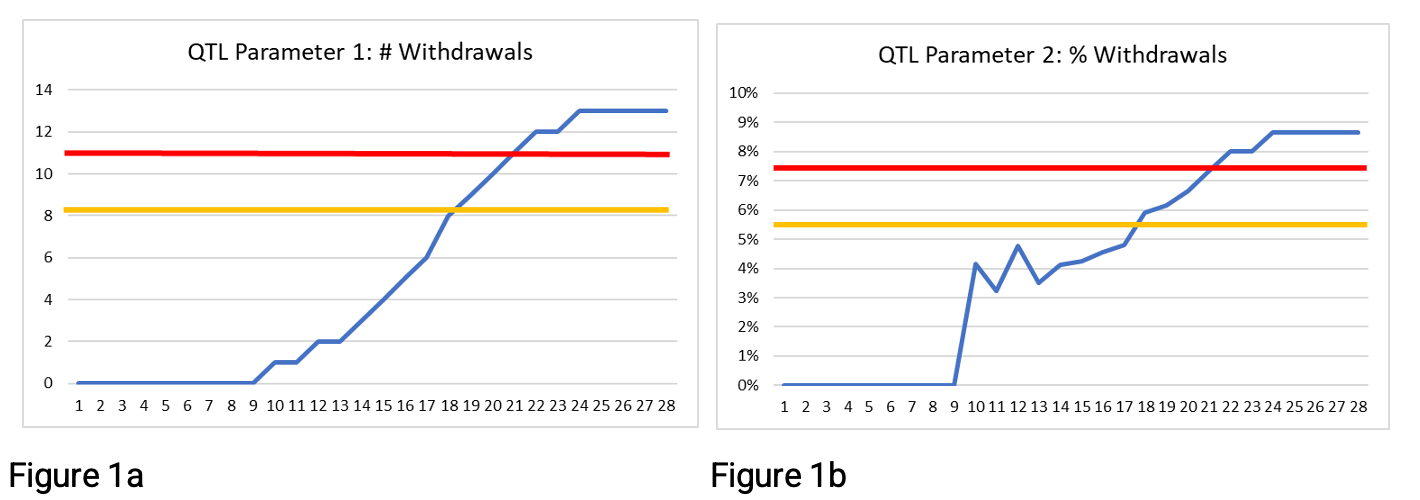
Figures 1a and 1b below provide examples of using a secondary limit (shown in yellow) along with the QTL threshold (shown in red) with two QTL parameters proposed by TransCelerate Biopharma.2 The secondary limit is set at 75% of the QTL threshold. Rather than waiting for the QTL threshold to be exceeded at week 21, there is an early warning that the secondary limit is exceeded at week 18. Three weeks’ additional warning may be enough time to take action and avoid the QTL threshold being breached.


Figures 2a and 2b below show the same data but with the secondary limit at 50% of the QTL threshold rather than 75%. Here the secondary limit is exceeded at 17 weeks, or 10 weeks, depending on the QTL parameter being used. Many organizations encounter a challenge when using this approach to determine the appropriate secondary limit. The 50% secondary limit provides an earlier signal, but a decision is needed as to whether the signal is noise or worthy of investigation. If the rate continues, will the QTL threshold itself be exceeded before study end? In these examples, we show data to study end, so we know that the QTL threshold is exceeded. However, earlier in the study, week 13, for example, how would you determine whether there is a systemic issue or whether exceeding the secondary limit is a signal worthy of further investigation?


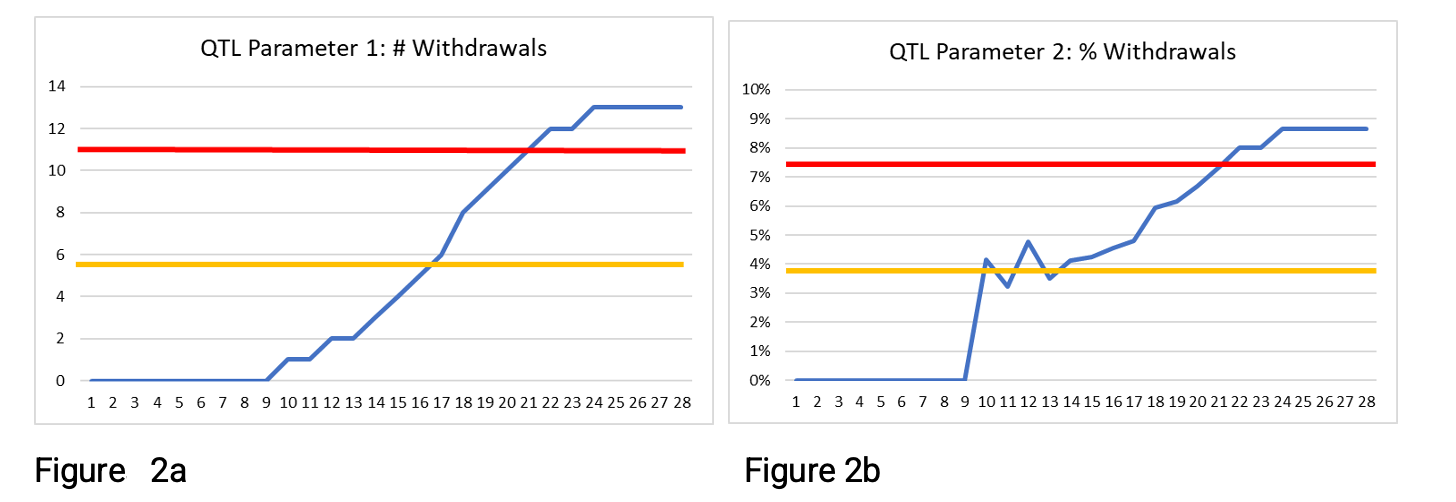
As we review the figures above, clearly, the parameters are both tending to increase over time. For the number of withdrawals, this is no surprise, as it is a cumulative measure. But why is the % withdrawals parameter tending to increase over time? This is because the opportunity for a participant to withdraw increases the longer they are on the trial. A participant who has been on the trial for seven weeks has had seven weeks to potentially withdraw, whereas a participant who has just been enrolled has had very little opportunity to withdraw.
Figures 1b and 2b, which depict results for a parameter normalized by the number of enrolled participants, have values closer to the QTL threshold (and the secondary limit) much earlier than the simple count of withdrawals in Figures 1a and 2a. Other normalization factors can be used to take account of situations where the opportunity increases over time. They can provide an alternative approach to the use of the secondary limit.
Metric definition and impact on early signal detection
The way a metric (whether a KRI or a QTL) is defined can profoundly affect how early a signal is detected. Some organizations employ complex statistical models, e.g., Bayesian statistics or funnel plots, to allow for early data variability and the ability to extrapolate impact from early views. A simpler but arguably less precise approach is to change the denominator for calculating a metric. This approach can help provide a much earlier signal of risk, which can lead to further detailed analysis as required. There is more information plus examples of defining parameters to provide early signals in a WCG white paper “Measure the Right Things at the Right Time: Design KRIs and KPIs that Provide Timely Insights.” Key points from the paper:
- The normalization of a metric (the denominator) can impact whether a metric is a leading or lagging one. Selecting the right normalization factor can mean a potential issue is detected weeks or even months earlier.
- If the opportunity of an item being measured (e.g., participant withdrawal) increases the longer the available time, then the leading metric should take this time element into account
Normalization of metrics used as QTLs and KRIs
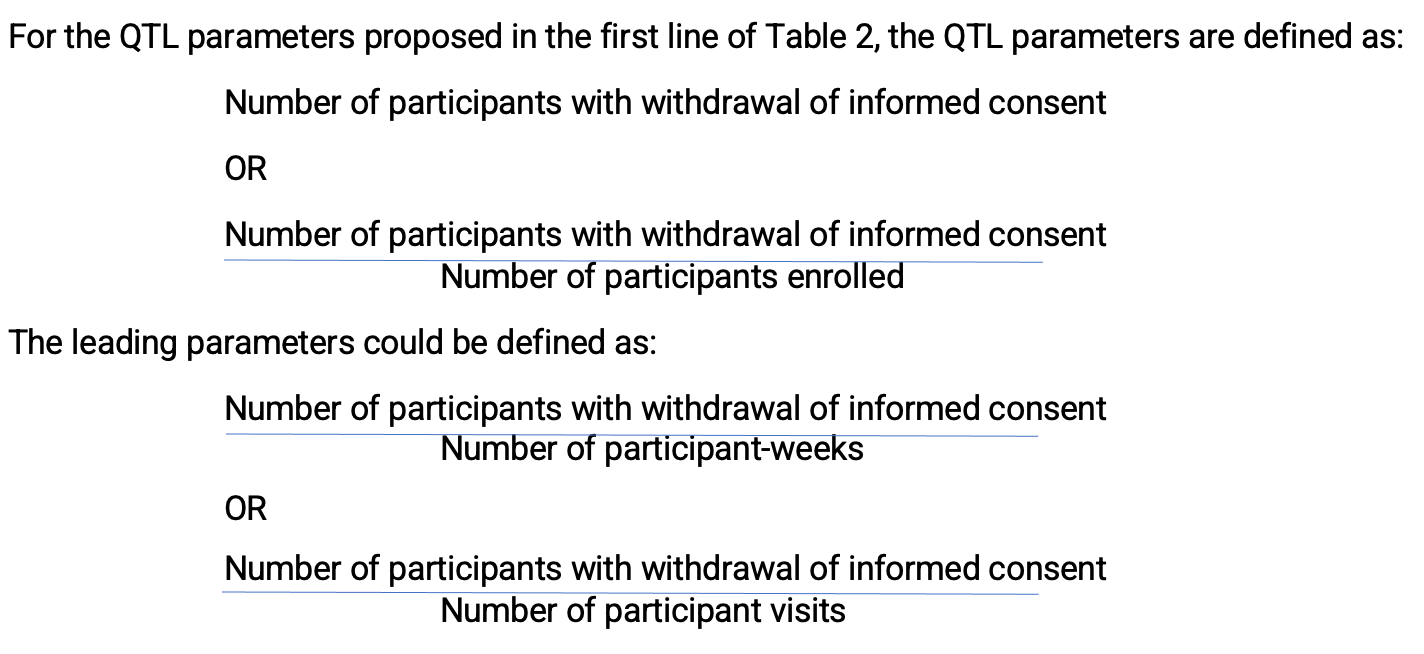
TransCelerate Biopharma2 propose two possible QTL parameters to monitor different risks to the critical quality factor “withdrawal criteria and trial participation retention.” (Table 1)


Table 1. Two possible QTL parameters
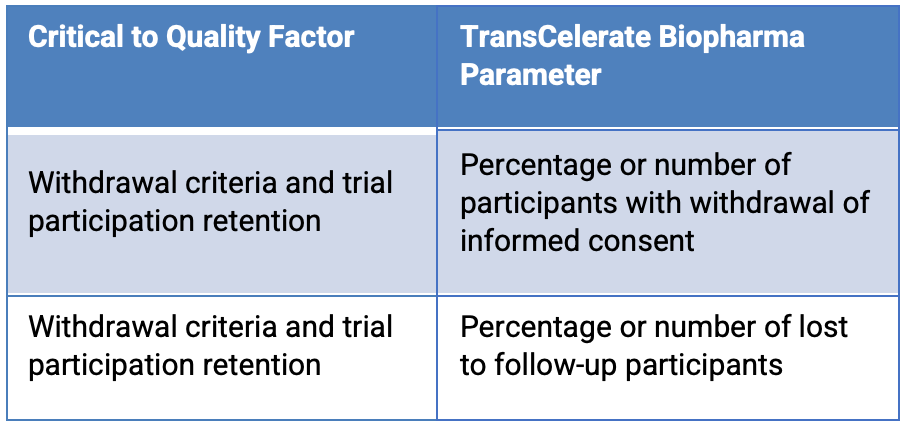
The data for these are readily available, and teams are likely to establish quality tolerance limits based on the study design and statistical analysis plan. It is critical to the quality of the study that the QTL threshold for these parameters is not exceeded by study end. As demonstrated above, using the QTL threshold with these parameters does not provide an early signal that the QTL might be exceeded by study end. From an operational perspective, though, during the study, it would be preferable to have an early signal that if the trend continues, the QTL parameter is likely to be exceeded by study end.
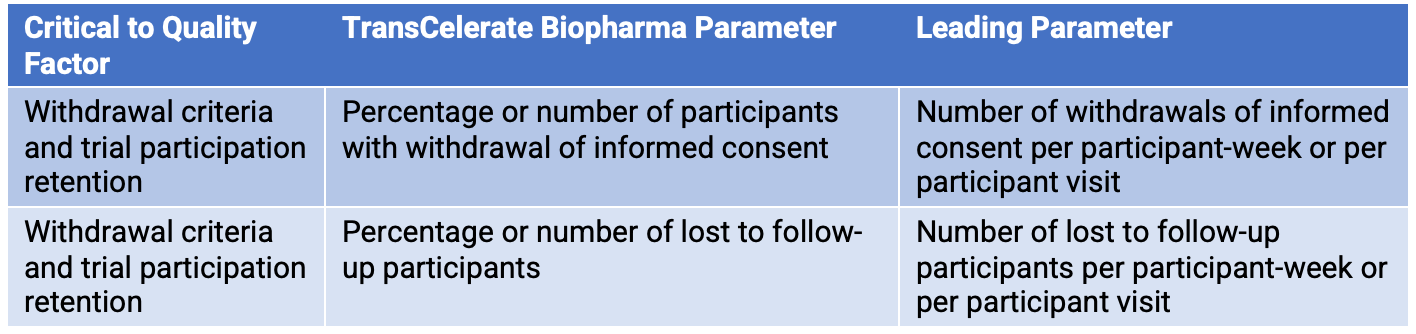
The number of participants with withdrawal of informed consent is more likely to occur the longer participants are in the study. Early in the study, there are likely to be few participants who have withdrawn informed consent. However, as participants are in the study longer, they have more opportunity to withdraw informed consent. Similarly, this logic can be applied to the QTL parameter lost to follow-up participants. A leading parameter can be defined with a normalization factor that takes this time element into account. A normalization factor such as participant-week or participant visits helps adjust for the increased opportunity for withdrawal of informed consent or loss to follow-up over time. (Table 2)


Table 2. Critical-to-quality factors and parameters


Modifying the normalization factor can mean dispensing with the secondary limit. A potential issue is detected weeks, or even months, earlier—allowing investigation and mitigation actions to be implemented sooner. This is demonstrated with an example in the appendix following the end of this article.
Companion KRIs
The Consortium QTL Working Group proposes an alternative to using a QTL parameter with a secondary limit. It is an approach that helps overcome the challenge posed by the balance between obtaining a signal of an emerging issue in time to act and the CSR reporting requirements. The alternative is to use a leading parameter such as that described in the previous section in addition to the QTL. The leading parameter can be considered an operational KRI used as a companion to the QTL. This way, the easily measured QTL parameter and threshold can be used to provide a signal where the quality objectives are not, or are unlikely to be, met. However, the companion KRIs can provide an earlier signal that, if the study continues as it has, the quality objectives will not be met.
As stated in the previous section, the leading parameter companion KRI should be defined to give an early signal of whether, if the current rate continues, the QTL threshold is likely to be exceeded by study end. The approach of using companion KRIs can be expanded further. Companion KRIs could be defined at other levels such as country and site. Using this approach allows the QTL parameter and threshold to be kept in the easy-to-interpret form, e.g., the number of withdrawals, and the operational companion KRIs providing an early signal. Investigation and action might be needed for the QTL threshold not to be exceeded. The approach is shown diagrammatically in Figure 3 below.


Figure 3.
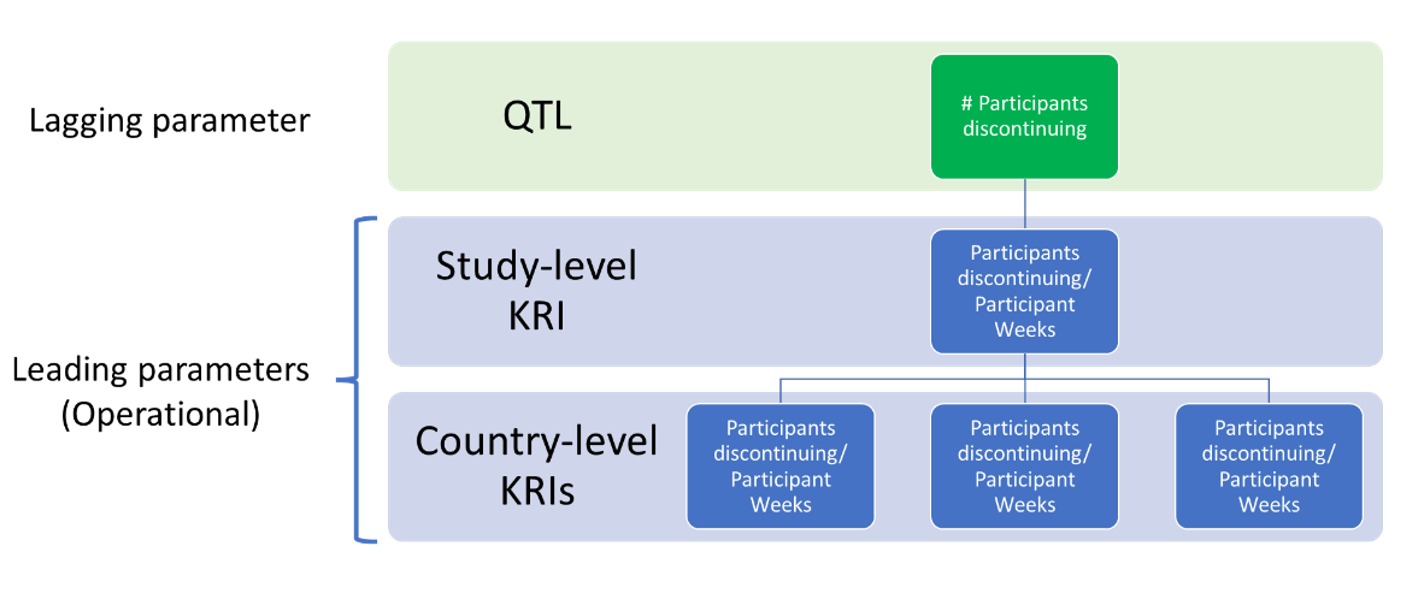
In addition, the companion KRIs would be available to help inform root cause analysis efforts when there is a concerning trend at the study level.
The use of QTL companion KRIs in this way provides more time to address conditions that may result in exceeding QTL thresholds, which need to be reported in the CSR if considered an important deviation. Exceeding KRI limits should be documented in the trial master file (TMF) but do not need to be included in the CSR. Thus, the barrier to their usage as well as any actions taken or not taken is lower, and they reduce the likelihood of experiencing significant QTL deviations. Companion KRIs could be used operationally to help ensure the QTL threshold is not exceeded at study end. This is, undoubtedly, the purpose of including QTLs in ICH E6 (R2).
Summary
The Consortium QTL Working Group discussed many of the key challenges with the definition, implementation and use of QTLs in clinical trials. Building on TransCelerate Biopharma definitions, participants concluded that QTLs should be considered a special subset of study-level KRIs, focused on the most critical risks. The group agreed on areas where QTLs are typically used and not used and developed an approach to overcome the challenge of balancing the need to define a QTL to provide an early signal with the potentially increased reporting burden in the CSR. The approach is to use additional KRIs alongside the QTL and for these KRIs to be defined to provide an early signal of an emerging issue.
By careful use of normalization factors, it is possible to design companion KRIs that can focus on the rate of change and can be used to project whether, if the rate continues, the QTL is likely to be breached by study end. The use of companion KRIs to the QTL helps realize the benefits of QTLs—to help maintain the control of the trial for critical parameters and restrict the reporting of deviations in the CSR to those that are important.
Please see Parts 1 and 2 of this series for the whole story. If you would like more information on the Consortium, please visit our website.
Authors
Keith Dorricott, MBB, Senior Consultant, WCG Avoca, Steve Young, Chief Scientific Officer, CluePoints, Linda B. Sullivan, MBA (corresponding author), Senior Advisor, Metrics & Performance Management, WCG, Founder and former Executive Director, Metrics Champion Consortium
Contributors to this article include: Maureen Cunningham, United Therapeutics, Adam Czernik, Janssen, Kevin Douglass, Daiichi Sankyo, Todd Johnson, Lokavant, Olgica Klindworth, Medidata (previously associated with PPD), Crupa Kurien, Pfizer, Kim Lombardo, Moderna, Gillian Pilbrow, ICON PLC, Leslie M. Sam, Wool Consulting Group, Kristin Stallcup, Castor, Yumi Sugiura, BMS, Macarena Sahores, Senior RBQM Operations Consultant, TRI
Legal note: Contributions by the co-authors and contributors are solely their own and are not intended to express the views of their organizations.
References
- ICH E6 (R2) https://www.ich.org/page/efficacy-guidelines
- Quality Tolerance Limits: Framework for Successful Implementation in Clinical Development. Bhagat, R et al. Therapeutic Innovation & Regulatory Science 2020. https://doi.org/10.1007/s43441-020-00209-0.
Appendix
Example: Demonstrating the Impact of Different Normalization Factors
Note: this worked example is based on experience of consortium members but is not actual study data.
Let’s consider two QTL parameters used in a worked example to see when you might have a signal (flag) that the study has a higher-than-expected number of withdrawals.
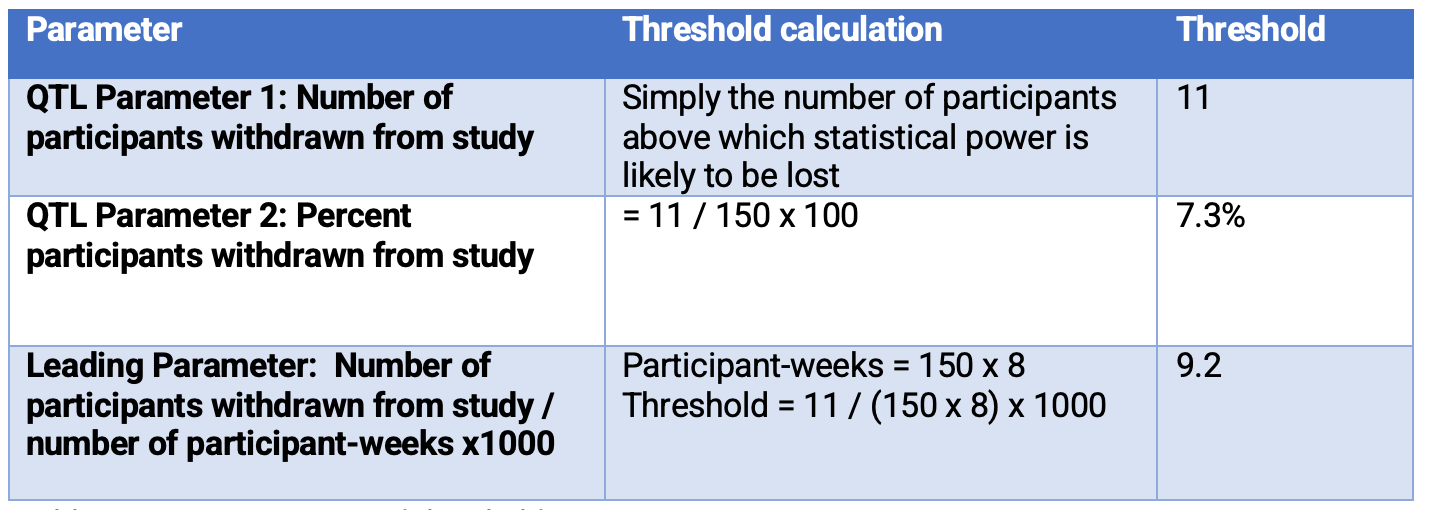
- The study has 150 planned participants.
- Treatment period is 8 weeks.
- Enrollment is completed by week 20.
- If 11 or more participants withdraw from the study, by study end, it is unlikely the study will have the statistical power needed to draw a conclusion.
Table 3 below provides the QTL parameters proposed by TransCelerate Biopharma2 and the QTL thresholds. It also provides a leading parameter example and the associated threshold.


Table 3. QTL parameters and thresholds
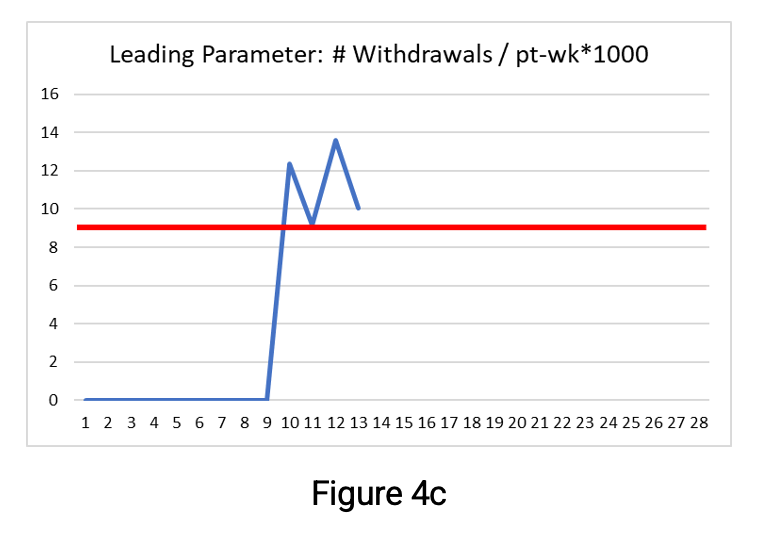
Figures 4a, b, and c below show the parameter values through week 13. The thresholds are shown as a red line and the secondary limit for the QTL parameters (here set at 75%) as the yellow line.


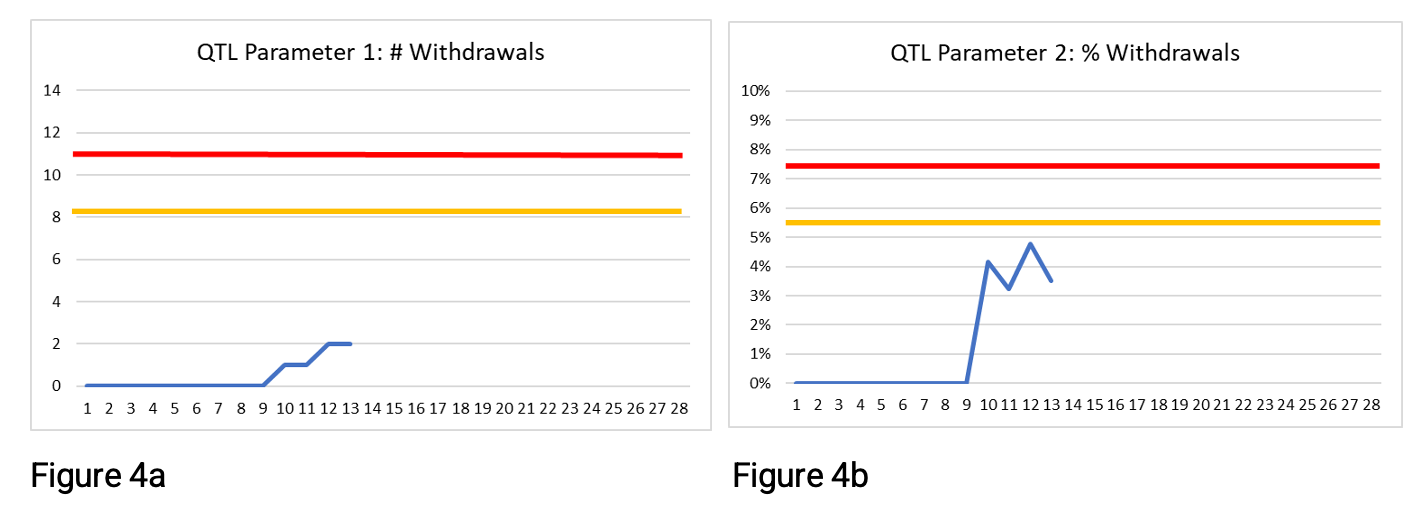


At week 13, two participants have withdrawn. This is below the QTL threshold and the secondary limit for both QTL parameters in Figures 4a and 4b. There is no risk signal at week 13 using these QTL parameters. If you were monitoring QTL parameter 1 or 2 only, then at week 13 you would likely not be concerned as to whether the QTL threshold would be exceeded by study end. But because there is more opportunity (chance) for participants to withdraw the longer they are on the study; these QTL parameters may be giving false reassurance.
The leading parameter shown in Figure 4c has a clear risk signal—the threshold has been exceeded since week 10. Exceeding the threshold for this leading parameter means that if the rate continues, then by study end, the number of withdrawn participants is likely to exceed the acceptable number, i.e., the QTL parameters will exceed their QTL thresholds if the current rate of withdrawal continues. Note that the leading parameter is designed to provide an early signal of risk, and no secondary limit is required.
Figures 5a-c below show the parameter values as they progress through week 24.


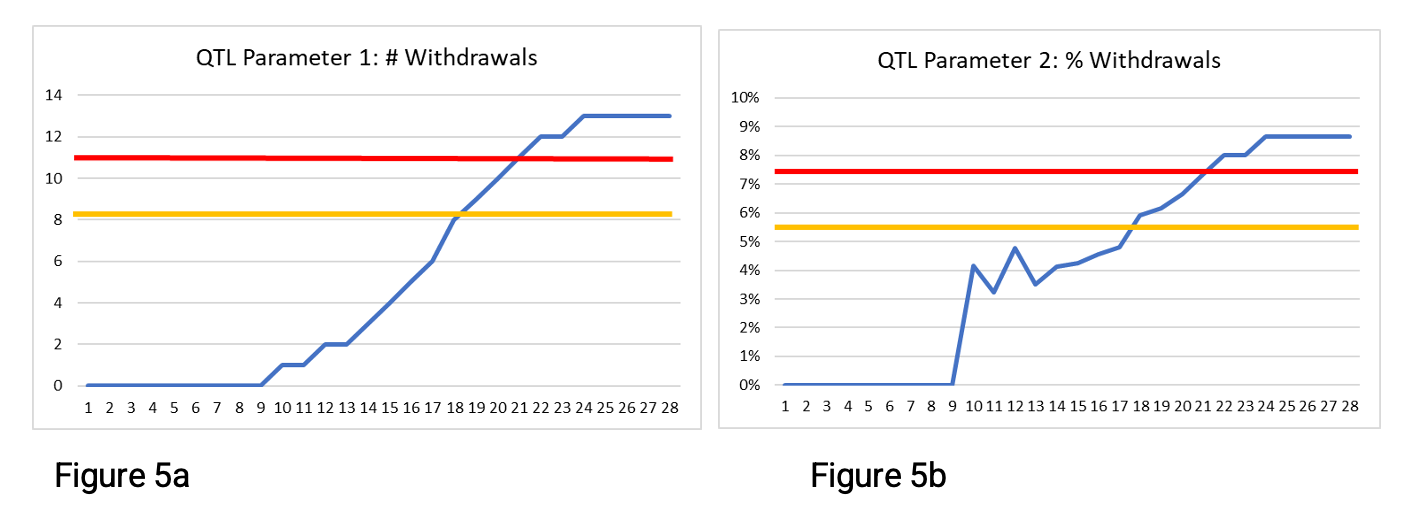


In Figures 5a and 5b, we see that the secondary limits and QTL thresholds were exceeded during this time period. Figure 5a shows that 13 participants withdrew from the study, exceeding the 11-participant QTL threshold stated in Table 3, which might lead to a loss of statistical power for the study. Notice that Figure 5a shows the parameter values rising rapidly beginning around week 13—illustrating that the number of participant withdrawals increased the longer participants were in the study.
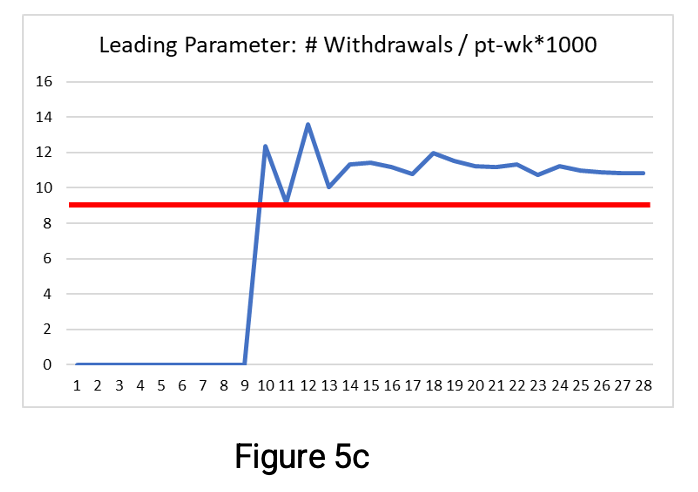
The leading parameter—shown in Figure 5c—has values exceeding its threshold from week 10. It provides an early signal that if the rate of withdrawal continues, then the QTL threshold is likely to be exceeded by study end. By taking early action and reducing the withdrawal rate to remain below the leading parameter threshold (if possible), it is less likely that the QTL threshold will be exceeded by study end. The additional benefit is that no arbitrary secondary limit is required for the leading parameter. By week 15, the leading parameter is leveling off at around 11 withdrawals per 1000 participant-weeks—exceeding the threshold limit of 9.2. This illustrates an additional benefit of using this leading parameter. It is easier to estimate the number of participant withdrawals by study end (assuming the rate continues unchanged). As there are 1200 participant-weeks planned, we can multiply 11 by 1200/1000 to estimate 13.2 participant withdrawals by study end.
Thus, using the leading parameter makes it possible to detect an early signal (week 10) of a possible issue. And by week 14, to estimate the potential impact if there are no changes to the trend. This contrasts with the detection of a possible issue at week 18 with the two QTL parameters shown in Figures 5a and 5b when using the secondary limit at 75% of the QTL threshold. It is leading parameters such as these that are proposed as companion KRIs.


")


Industry Assessment of Risk-Based Quality Management Emphasizes Value of Adoption
April 4th 2024A study conducted by the Tufts CSDD in collaboration with CluePoints and PwC revealed that slightly more than half of sponsors and contract research organizations have adopted risk-based quality management approaches.


Clinical Trial Results Show Krystexxa Reduced Blood Pressure in Adults With Chronic Gout
November 6th 2023Pegloticase (Krystexxa; Amgen) is approved to treat chronic gout in adults who fail to normalize serum uric acid and whose signs and symptoms are inadequately controlled with xanthine oxidase inhibitors.

