Better Together: The Latest in Anomalo’s Integration with Alation
September 25, 2023
Well over a year ago, Anomalo signed onto Alation’s Open Data Quality Initiative as a founding member. Since then, Anomalo has continually invested in this partnership, integrating its data quality monitoring platform with Alation’s data catalog and subsequently adding features to better serve mutual customers.
Today, Anomalo reaffirms its commitment to delivering value for our mutual customers by further expanding its integration with Alation. For starters, it’s easier than ever to enable the integration directly from Anomalo’s admin controls, with virtually no setup beyond that. As for new features, we’ve put an emphasis on broadening the integration’s capabilities so that you can seamlessly incorporate data quality into all parts of your data management strategy.
In this post, we’ll highlight Anomalo’s integration with Alation Everywhere for Tableau. We’ll also cover how Alation’s data lineage features enhance Anomalo’s ability to comprehensively monitor data quality. Finally, we’ll discuss Alation’s custom fields feature and how that works with Anomalo to show all the key information about your data in one place.
Access Anomalo when creating or viewing Tableau visualizations
As part of Alation Anywhere, users of the business intelligence tool Tableau have direct access to the context from their data catalog without having to switch apps. Now, with the expanded Anomalo integration, Tableau users can additionally view Anomalo’s data quality information while creating or viewing a data visualization.
Suppose you’re viewing a Tableau dashboard to decide on how much inventory to order for the coming quarter. If Anomalo detects a discrepancy with the underlying data, Tableau will show an alert containing the results of the failed Anomalo check so you don’t inadvertently place the wrong order. Should you check the Tableau table supporting a particular visualization, the table will display the same warning messages along with links back to Alation and Anomalo for you to dig deeper. If you were building a new visualization or dashboard in Tableau, you can also see Anomalo’s results in-line with your data sources so you know to choose only vetted tables.
This integration marks a huge step forward in fostering trust at all levels of the modern data stack. Business intelligence professionals can have confidence that the decisions they’re driving are founded on reliable data. And when data quality does go awry, data consumers can stay alert and refrain from operating on bad information.
Alation’s data lineage augments Anomalo’s data monitoring
Anomalo and Alation are truly better together—the integration goes well beyond just displaying information from one platform in the other. Alation offers advanced data lineage capabilities that chart the flow of data and how data has changed over time. Anomalo leverages these records to have a broader view of data quality as it relates to your entire data catalog.
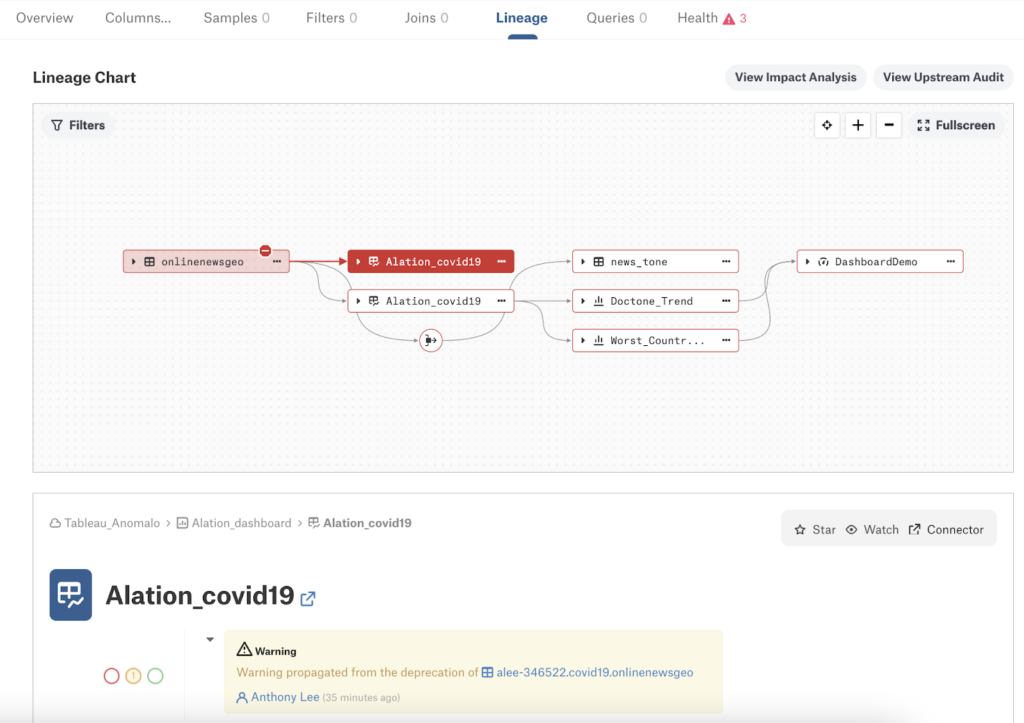
When Anomalo discovers a data issue, it interfaces with Alation’s knowledge of the data’s lineage to pinpoint where the issue may have spread or what other assets might be at risk. This way, you can contain data quality problems before they expand to your entire stack. Together with Anomalo’s root-cause analysis, you can quickly resolve the core issue and resume business as usual. Particularly in cases where a data issue stems from a specific segment of your data that would be difficult to manually identify, Anomalo’s root-cause analysis automates and accelerates that search.
Custom fields in Alation store information from Anomalo
The latest version of the integration gives you options for how to view Anomalo information and visualizations in Alation. You can choose whether or not profile visualizations from Anomalo are viewable from Alation. Moreover, you can configure which specific field in Alation should contain these visualizations and link back to the relevant place in Anomalo.
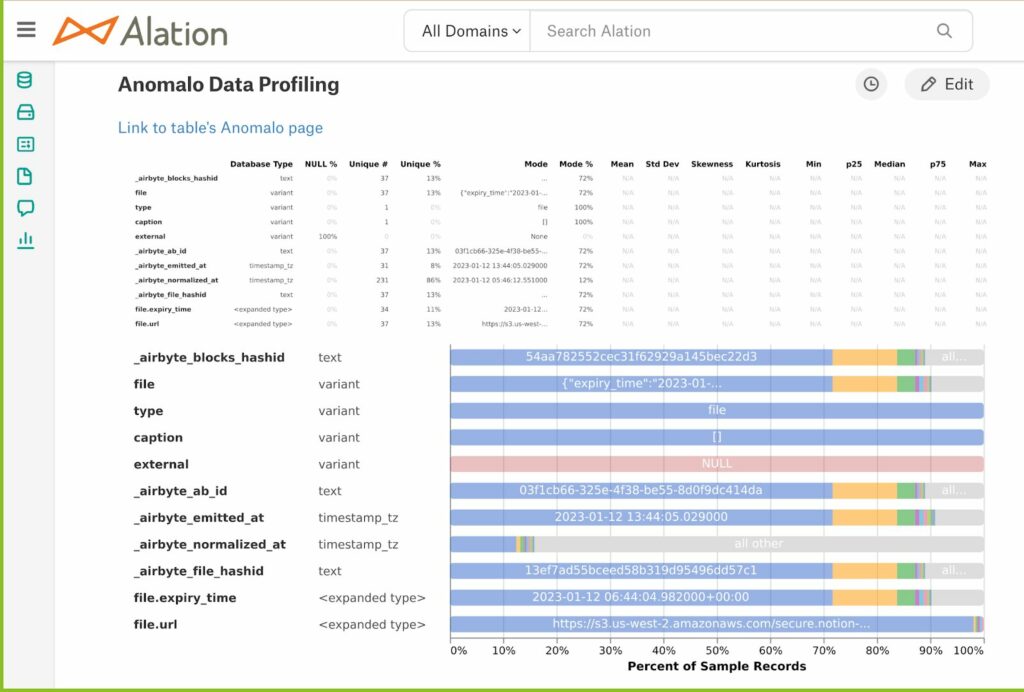
We recommend you create a new, custom field in Alation and add that to your default table template. Then, you can configure Anomalo to use this custom field as part of the integration. Alternatively, you can select the option that overwrites the “description” field in Alation if you don’t want to make a separate field.
Custom fields in Alation are a powerful way to organize metadata about your tables. Mutual customers of Anomalo and Alation are excited about being able to take more control over how their Anomalo data gets represented in Alation.
Conclusion
Anomalo and Alation’s partnership has established a joint foundation that other products in the data ecosystem can rely on. Because your data quality solution and data catalog work together so seamlessly, you’ll always have a complete picture of your data’s integrity and structure when using your business intelligence software, data warehouse, or other data tools. This is more than a one-time deal: as Anomalo and Alation continue to invest in their other integrations, whatever improvements one platform makes get amplified by the other.
Are you new to Anomalo and want to give it a try? Reach out to request a demo today.
Related Resources
Learn more by browsing our library of announcements, guides, and technical deep dives on data quality.


Get Started
Meet with our expert team and learn how Anomalo can help you achieve high data quality with less effort.