Dec 20, 2020
.
12 min read
Report – 2020 Data Insights in Hospitality.

No one needs another report demonstrating that 2020 was an “unprecedented”, “challenging” or “disrupted” year, not least anyone working in the hospitality sector who lived it. Analysing more than 2,000,000 customer interactions in the UK hospitality sector, we’ve tried to keep away from the COVID cliches. Instead, we believe it is more interesting to look at how the industry responded, how a year of fluctuating guidelines affected human behaviour and the impact of schemes designed to help hospitality (as well as their limitations).
The 2m customer/venue interactions logged by Stampede include people scanning QR codes for track and trace purposes, registering their details in-app or connecting to a venue’s guest Wi-Fi. The data is broken down by venue type (pubs, restaurants, cafes, hotels etc.), location, date and even dwell time. This unique data set reveals the impact of localised lockdowns, and how behaviour varied throughout the UK at different stages of the pandemic. Key findings include:
- During The Eat Out To Help Out scheme 48.1% of UK restaurant visits were on Monday, Tuesday or Wednesday. Wednesday became the most popular day of the week for restaurants, remarkably overtaking Friday and Saturday
- EOTHO did cannibalise weekend trade to some extent, but brought in more business than restaurants lost at the weekend
- The UK population moved away from late night drinking and dining long before the curfew was introduced, with pubs, bars and restaurants all experiencing earlier spikes in traffic vs 2019
- Venues were far more dependent on regular / returning customers post-lockdown vs bringing in new customers
- Café numbers were boosted during lockdowns, as some of the only venues open for takeaway
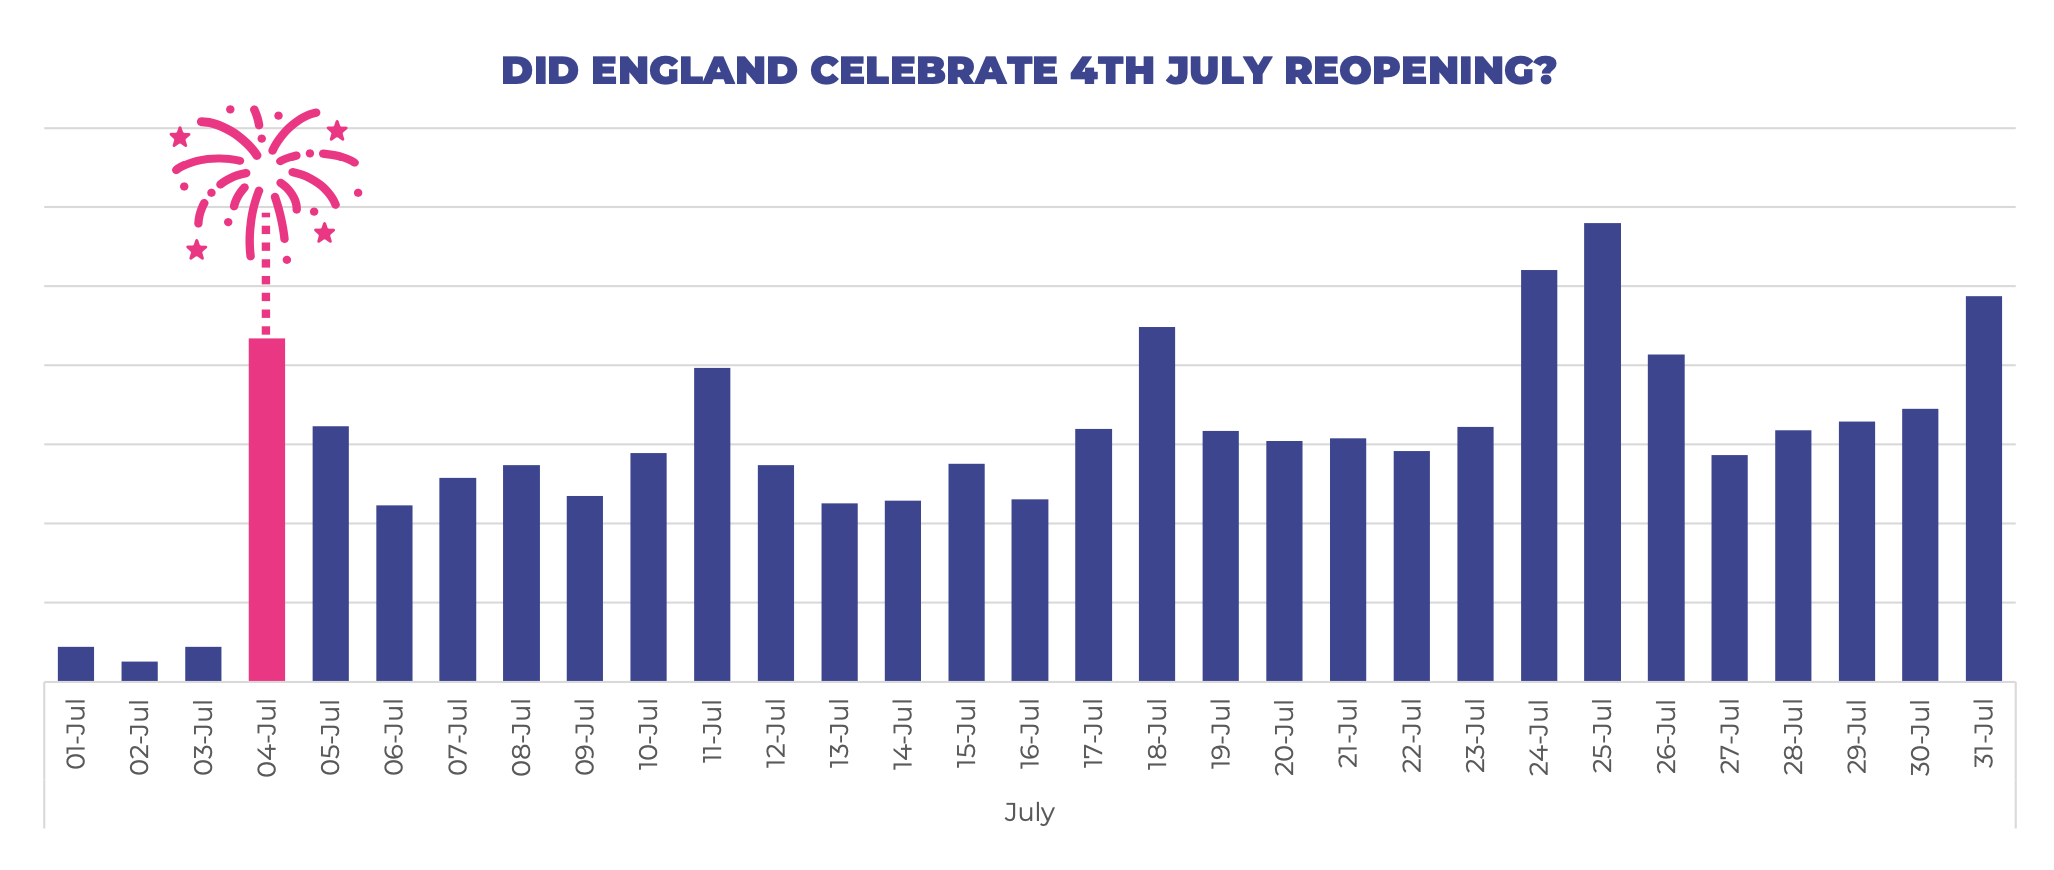
- England did not go overboard when pubs reopened on 4th July. Dubbed “Independence Day”, pubs had a similar number of customers this weekend compared to most in July, and only a fraction of the numbers recorded in August, September and October
Starting with the big trends… if you look at our 2.3 million venue/customer interactions over the course of 2020 in its entirety, hospitality businesses were returning to pre-COVID levels by late August. In September, they were even outperforming Jan/Feb business – although they are typically quiet months.
Despite the return to normality, it’s important to note that it took time for people to come back, and that the hospitality sector cannot be turned on and off like a tap. It takes time for human behaviour/patterns to change. If people get used to the idea of staying in, or believe it is their duty to do so, changing the law to allow hospitality venues to reopen will not prompt people to do so overnight.
It’s interesting how much August and September resembled January and February in terms of venue activity. By this point, people had relaxed their attitudes to COVID in many respects, and were treating it as a normal, albeit quieter period.

With fewer people commuting, millions working from home, furloughed or unemployed as a result of COVID, the pandemic caused major disruption to people’s schedules, whereabouts and finances. In addition to lockdowns and schemes like EOTHO, we wanted to analyse how this disruption impacted people’s relationship with hospitality venues during the pandemic.
Eat Out To Help Out
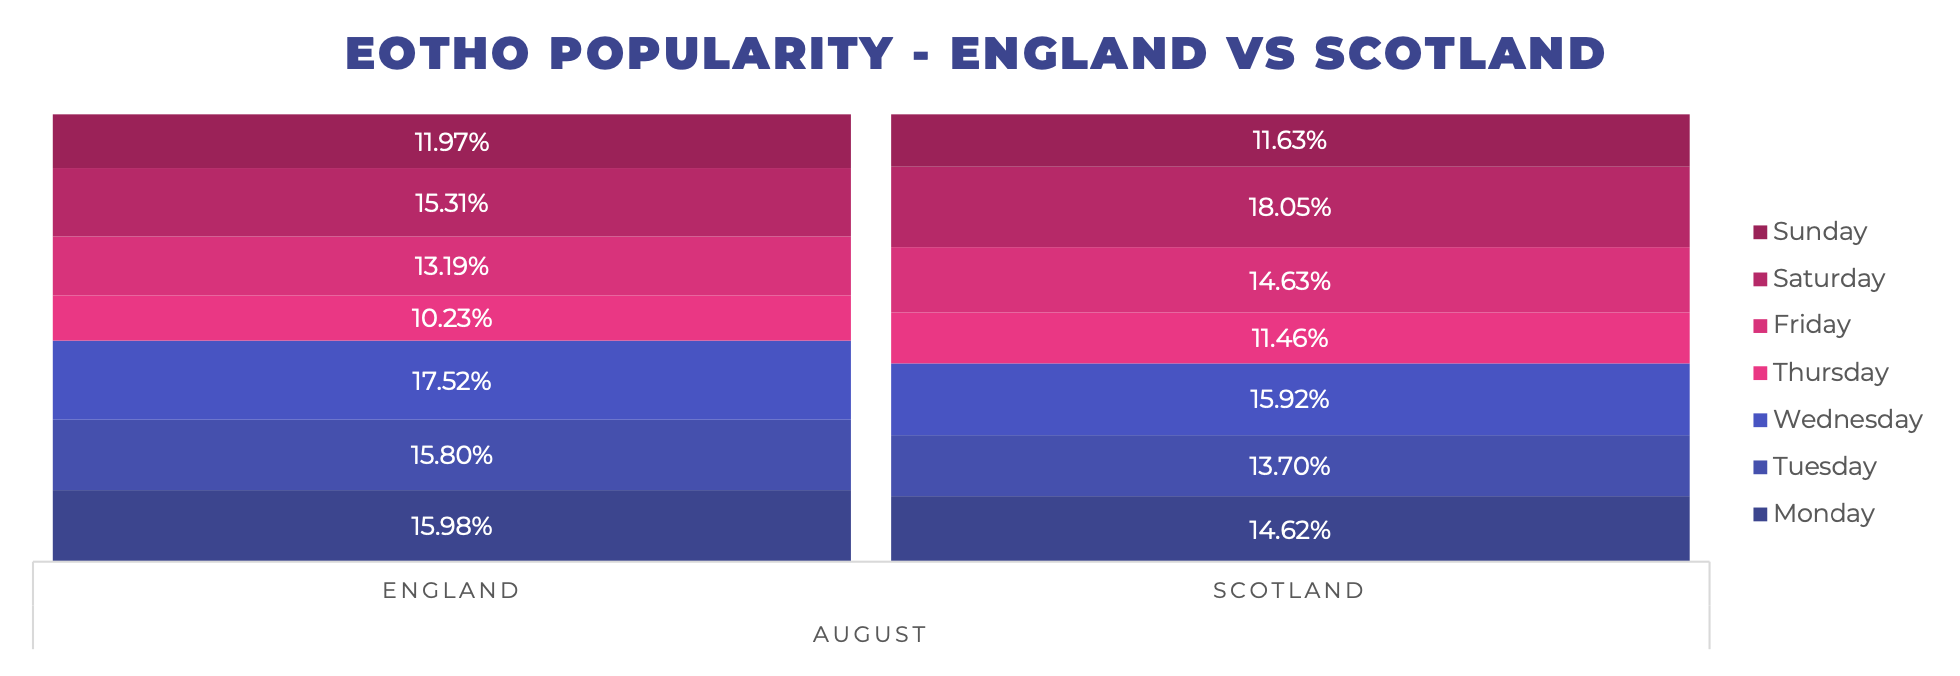
One of the most obvious trends we saw in 2020 was that EOTHO causes a huge spike in restaurant visits in August between Monday and Wednesday. In 2019, Mon-Weds accounts for 37.5% of restaurant visits. In August 2020, 48.1% of restaurant visits were on Monday, Tuesday or Wednesday. Wednesday became the most popular day of the week for restaurants, remarkably overtaking Friday and Saturday. In September, 21% of all restaurant visits were recorded on a Saturday, but this number drops way down to 16% in August. August also saw record lows for Sunday, Friday and Thursday.
Post EOTHO – Monday-Wednesday volumes immediately returned to normal levels in September, despite some restaurants continuing EOTHO offers. Customers quickly returned to making Friday, Saturday and Sunday their preferred days for dining out.

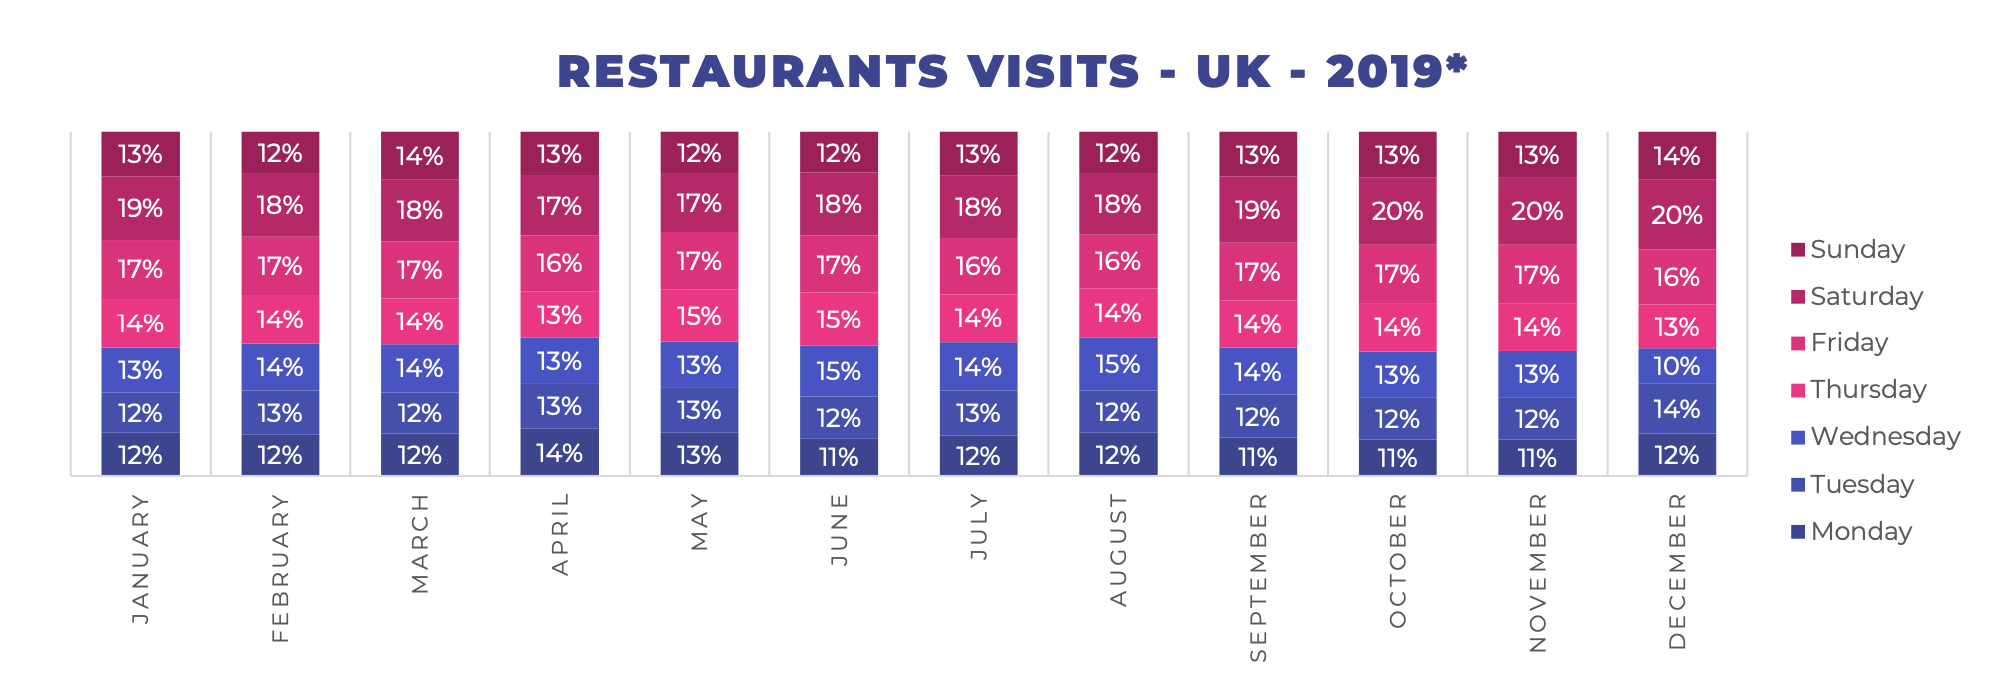
*Please note, these charts are adjusted to account for how many times a specific day occurs each month. For example, if there are five Mondays in the month, we divide all Monday visits by five. If there are four, we divide by four etc. We have not included data for months when the UK was in a nationwide lockdown.
Did EOTHO cannibalise weekend trade?
There has been a lot of debate over the success and limitations of EOTHO. Many believe it was an outright success for bringing people back to restaurants and bars, for cutting costs for consumers and prompting them to spend more – thereby boosting business revenues. It’s hard to argue with these points, and we don’t know if hospitality numbers would’ve returned without it, but other people have questioned whether the increased weekday trade had a negative impact on weekend business. They argue that similar numbers of people went to restaurants in August, but simply did so on a different day. The concern is that Mon-Weds customers also spent less on alcohol in comparison to usual weekend trade (alcohol being a high profit margin item for restaurants).
Our data shows that both sides have merit:
Yes
The total number of Friday, Saturday and Sunday restaurant visits appears to be lower in August compared to the following month – both as a percentage of daily trade and total figures. 42% of August restaurant trade came between Fri-Sun, significantly lower than September’s 51%. In terms of total figures, Fri-Sun trade in August was down 12% vs September (again, this also accounts for the number of weekends in each month).
No
It may be unfair to say that EOTHO cannibalised weekend trade. August was categorically a great month for restaurants. There were more total restaurant visits in August vs September or October, and August’s numbers were far higher than July. July was an extremely quiet and disrupted month, meaning the August rush essentially came from a standing start. The minor dip in Fri-Sun trade is more than offset by the weekday bump, and the next chart also demonstrates that restaurants were doing especially well at the end of August when EOTHO was in full swing.
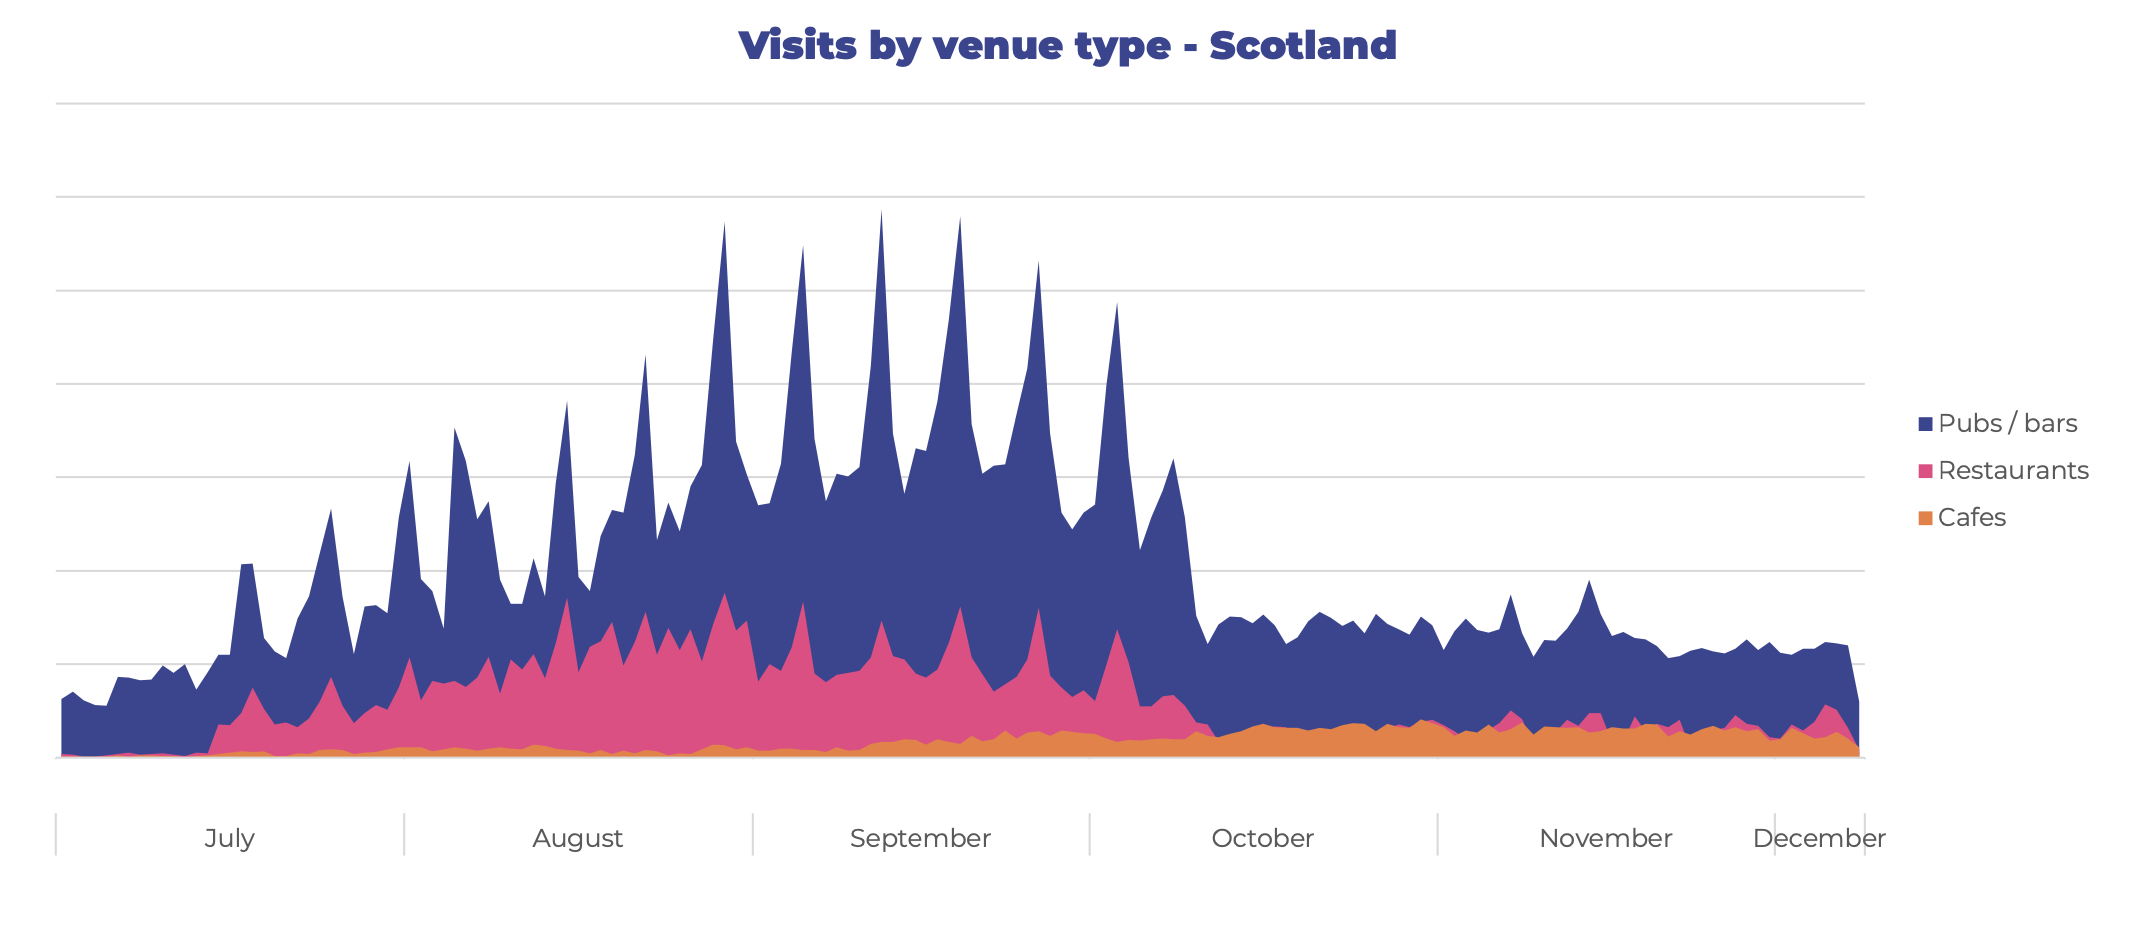
Trends by venue
Restaurants and pubs account for the majority of Stampede registrations in the UK. Historically, cafes have been a smaller market but since lockdown we have seen that cafes have performed well by comparison – and it appears as though cafes have picked up some of the business lost by pubs and restaurants. It’s worth noting that there are periods in which cafes were among the only hospitality venues open (for takeaway food & drink). However, the latest data going into December (when most UK restaurants/pubs had reopened) suggests that café activity is still relatively high.
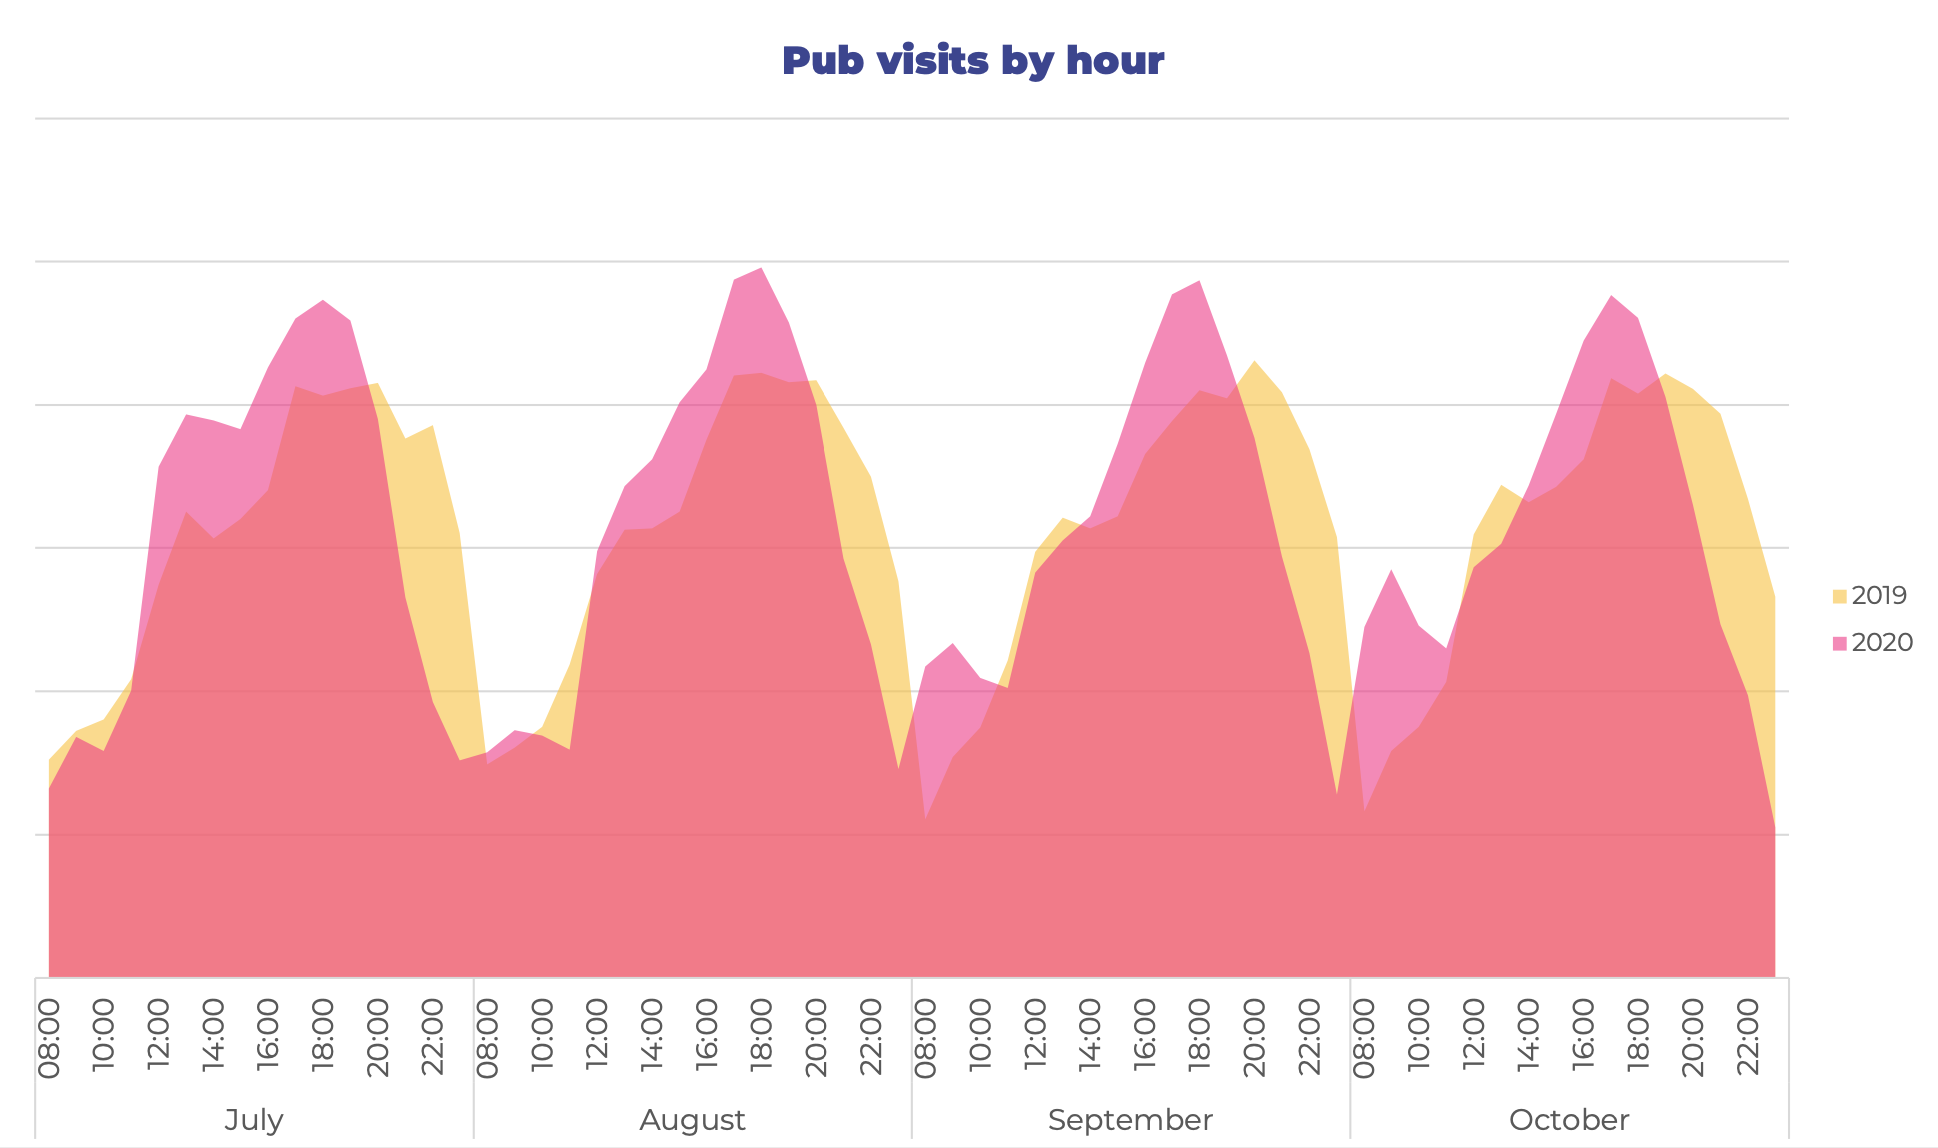
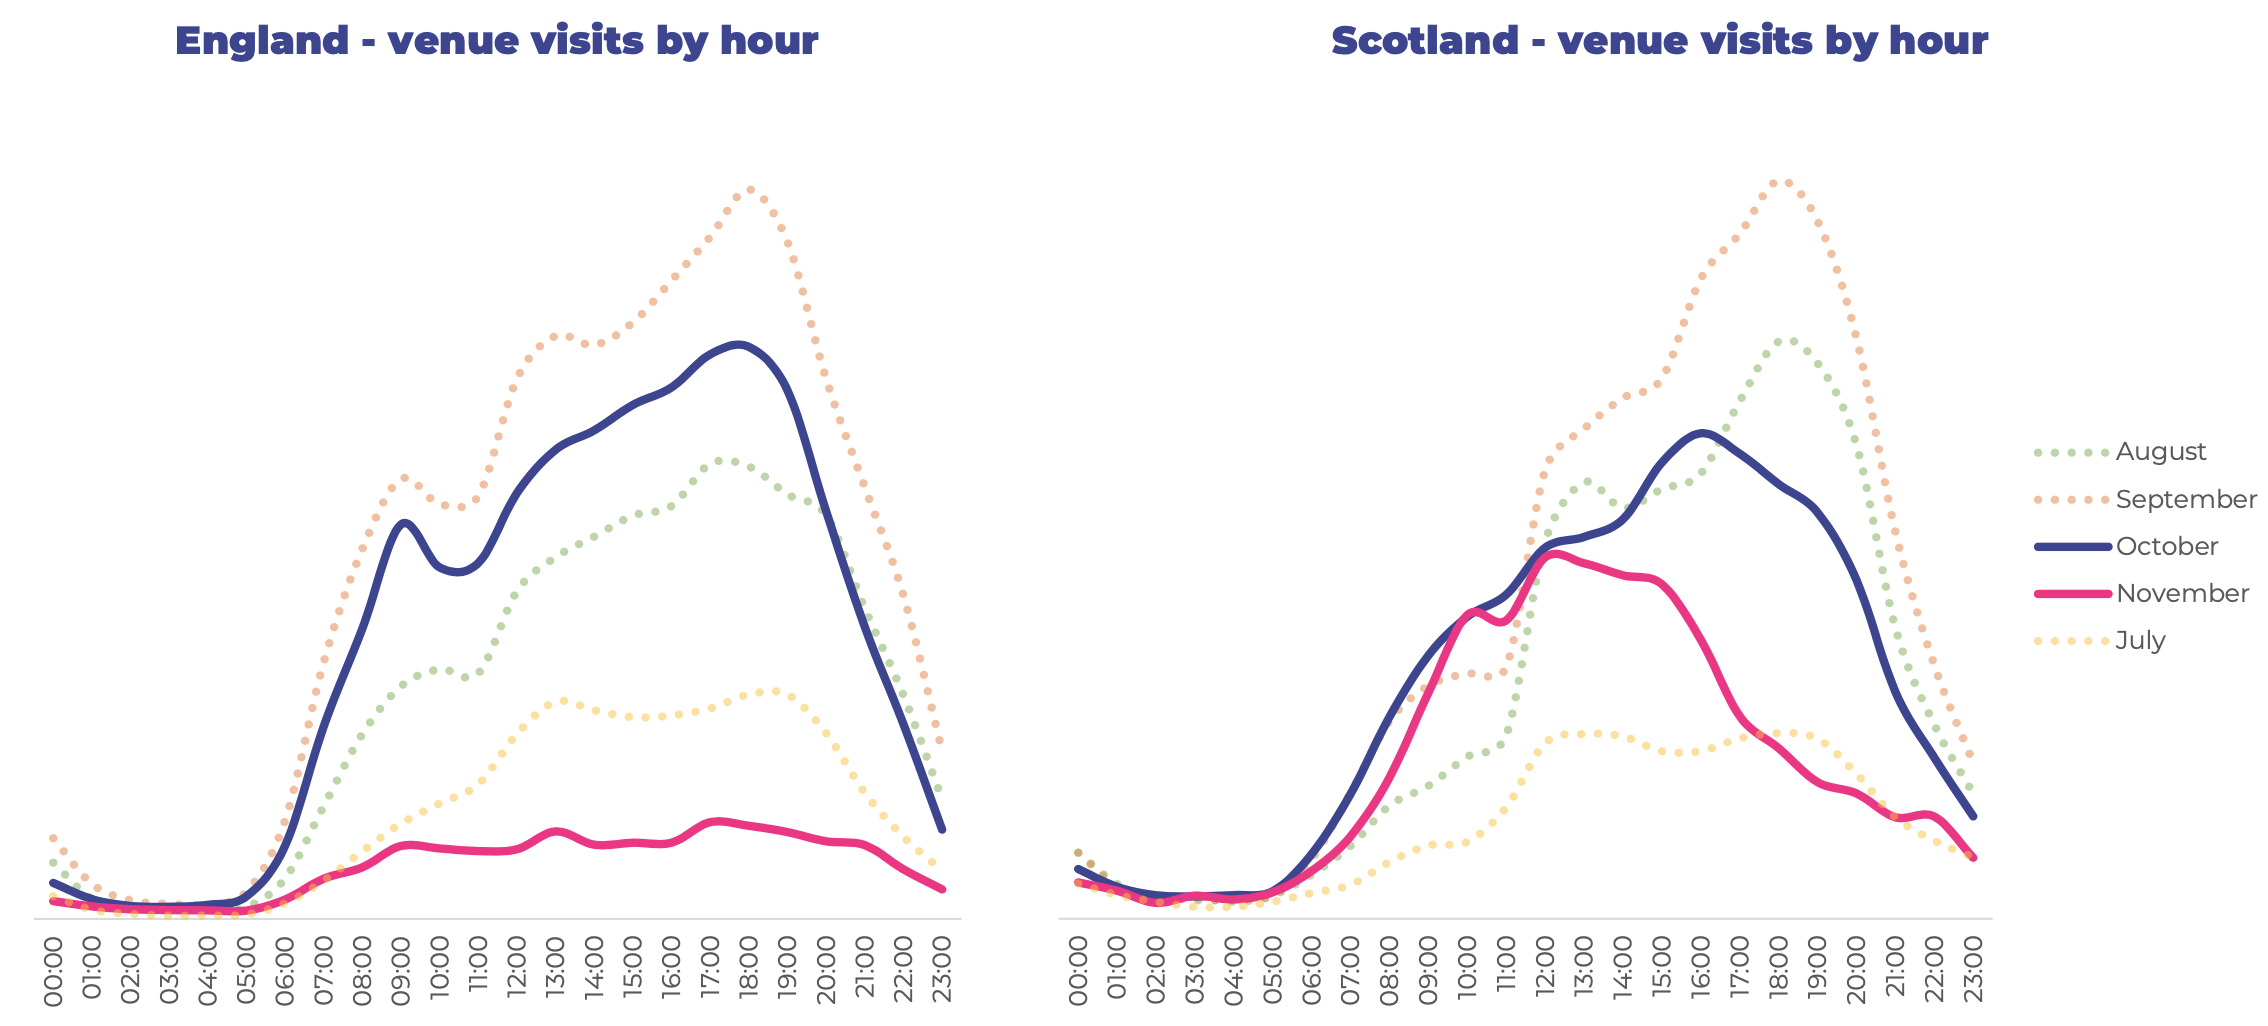
Trends by the hour
Post-lockdown, people in the UK went to the pub earlier and venues saw steeper visitor peaks around 5pm-6pm. Late evening numbers fall sharply in 2020 even prior to the introduction of the 10pm curfew. It appears as though restrictions on group sizes / socialisation had more of an impact on when people went to the pub and how long they stayed vs the subsequent introduction of a 10pm curfew. The data suggests that people were choosing to drink more responsibly and limiting late night drinking sessions long before the curfew.
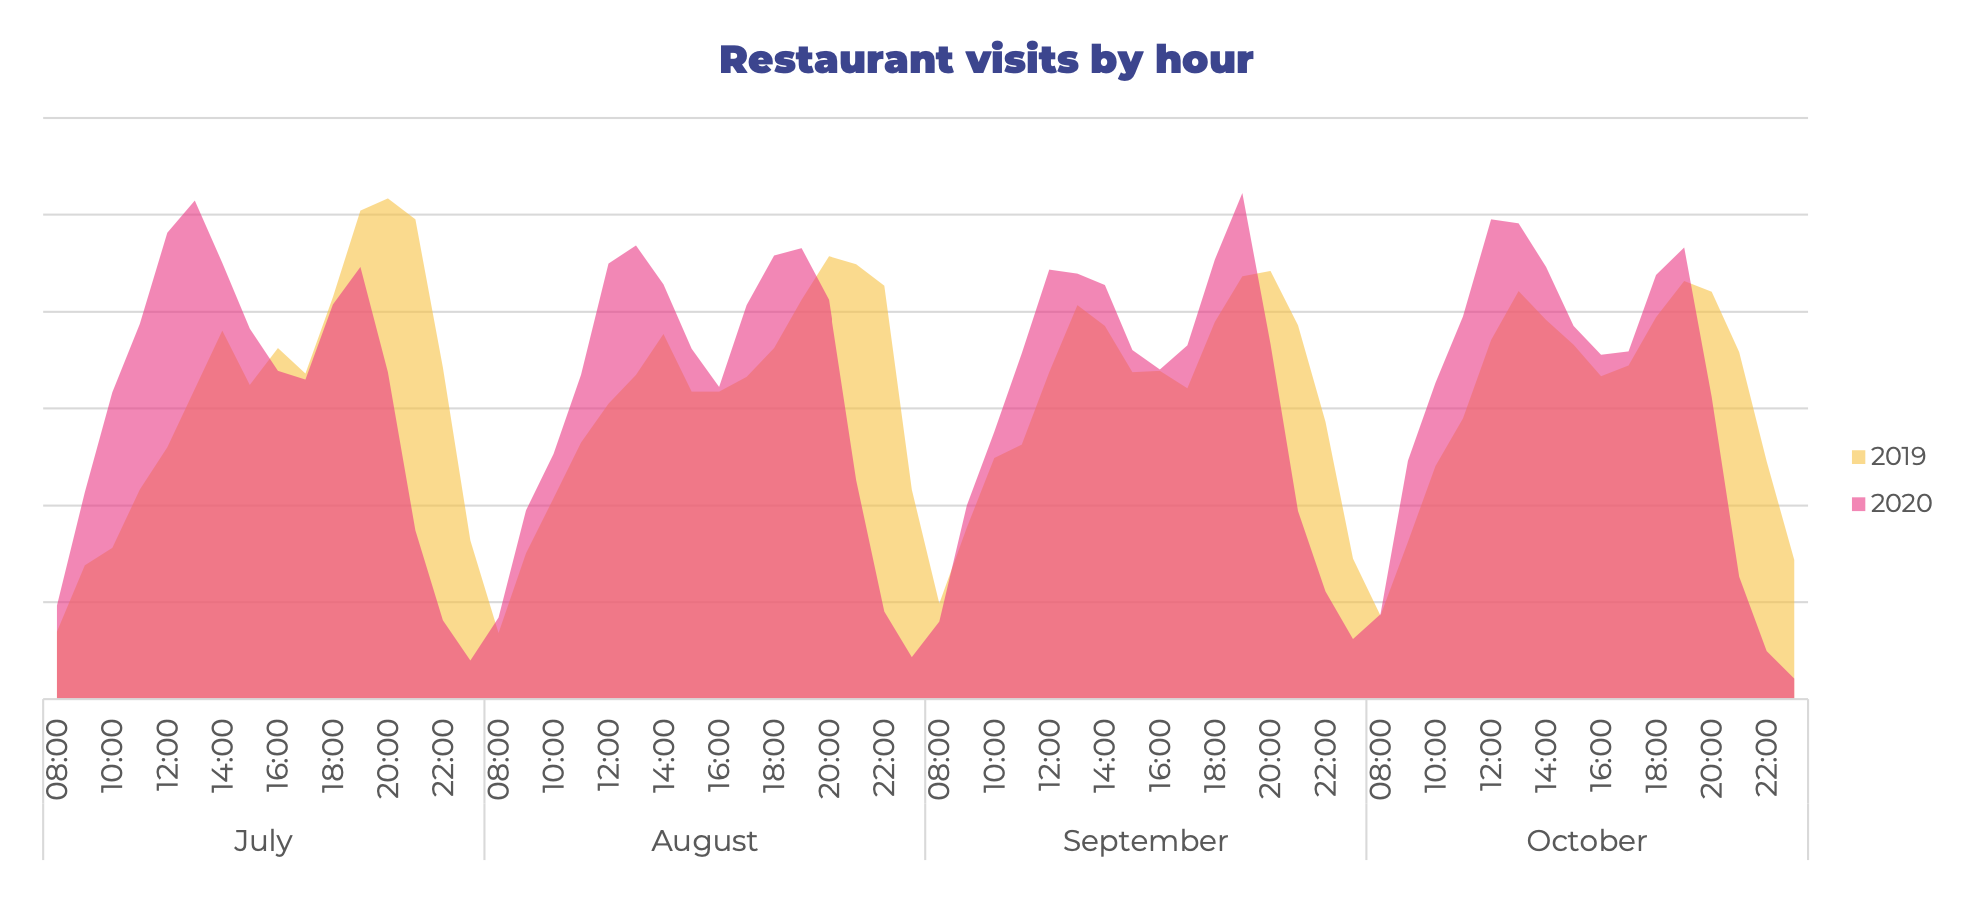
Restaurants also saw a similar trend, of earlier, sharper peaks in 2020 and a pronounced drop off of visitors around 9pm. Again, this was a trend long before the curfew was introduced.
A greater proportion of customers are dining out for breakfast and lunch in 2020 compared to 2019. In 2019, dinner is nearly always the peak time for restaurants, but in 2020 there are more spikes around midday. This is likely due to a combination of behavioural changes and new health and safety rules. For instance, restrictions on the number of customers restaurants can allow in their venues means dinner and lunch numbers could be more similar – since many venues would hit “maximum capacity” twice a day. It may also be that, with more people working from home and not commuting, they were able to meet with friends and family more often during the day.
Regional trends
You can instantly see the impact of regional lockdowns in Scotland and England by comparing time of visits by month for both countries. September and July are virtually identical in both countries, but all the other months demonstrate the effects of regional lockdowns. English hospitality businesses were especially busy in October (even more so than August when you factor in pubs, bars and cafes in addition to restaurants). Scotland sees much lower figures due to the two-week circuit breaker introduced in parts of Scotland halfway through the month. The trend is reversed in November, by far the quietest month in England, when venues were only available for takeaway food and drink. Scotland diverged from the UK restrictions in November and its venues were significantly busier as a result, albeit mostly during the day.
Independence Day
On the 4th July, the hospitality sector reopened in England, which was promptly celebrated as an “Independence Day” of sorts. Our data shows a spike of new pub/bar customers on the 4th July, one of the highest numbers recorded in the month – but it was not as wild as some feared/reported at the time.
Country-by-country, it appears as though EOTHO was slightly more popular in England vs Scotland, as evidenced by the percentage of people dining Mon-Weds in August.
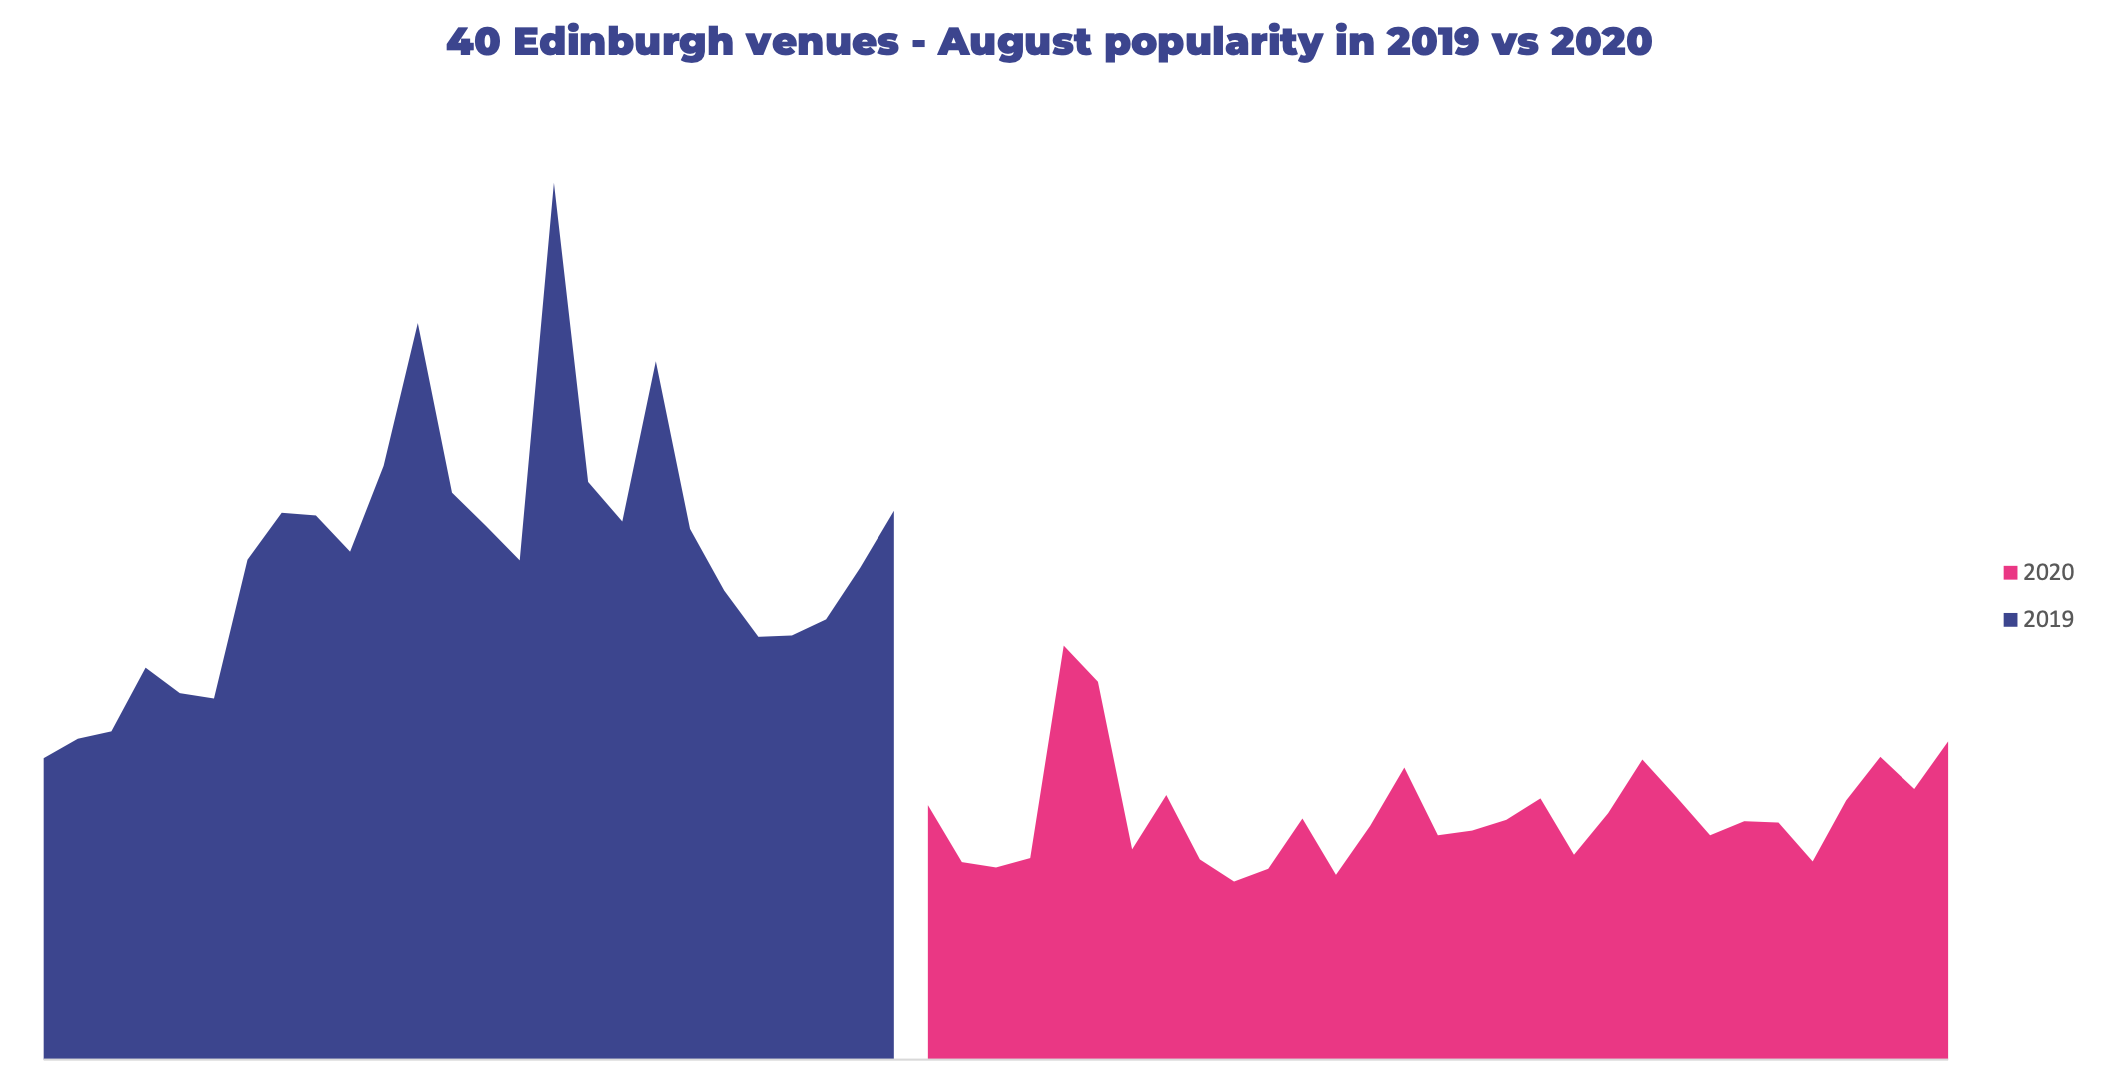
Edinburgh without the Festival
We compared 50 Stampede customers in Edinburgh to see the impact of COVID restrictions and the cancelled Fringe festival. We found that customer visits were down by half in August 2020 compared to 2019, although it’s highly likely that many venues would’ve suffered much greater hits to their revenue – namely bars in the city centre hosting gigs and hotels. It’s also likely that the regulars and locals visiting hospitality venues in the city during this time would not have spent as much or stayed as long as tourists and festival goers. Edinburgh buzzing in August
Repeat business and hospitality digitisation
For hospitality businesses to get back to pre-COVID levels of profitability, they need to create returning business, even when people are free to travel to see friends and family once again. We wanted to understand the degree to which venues are seeing new vs returning customers post-lockdown.
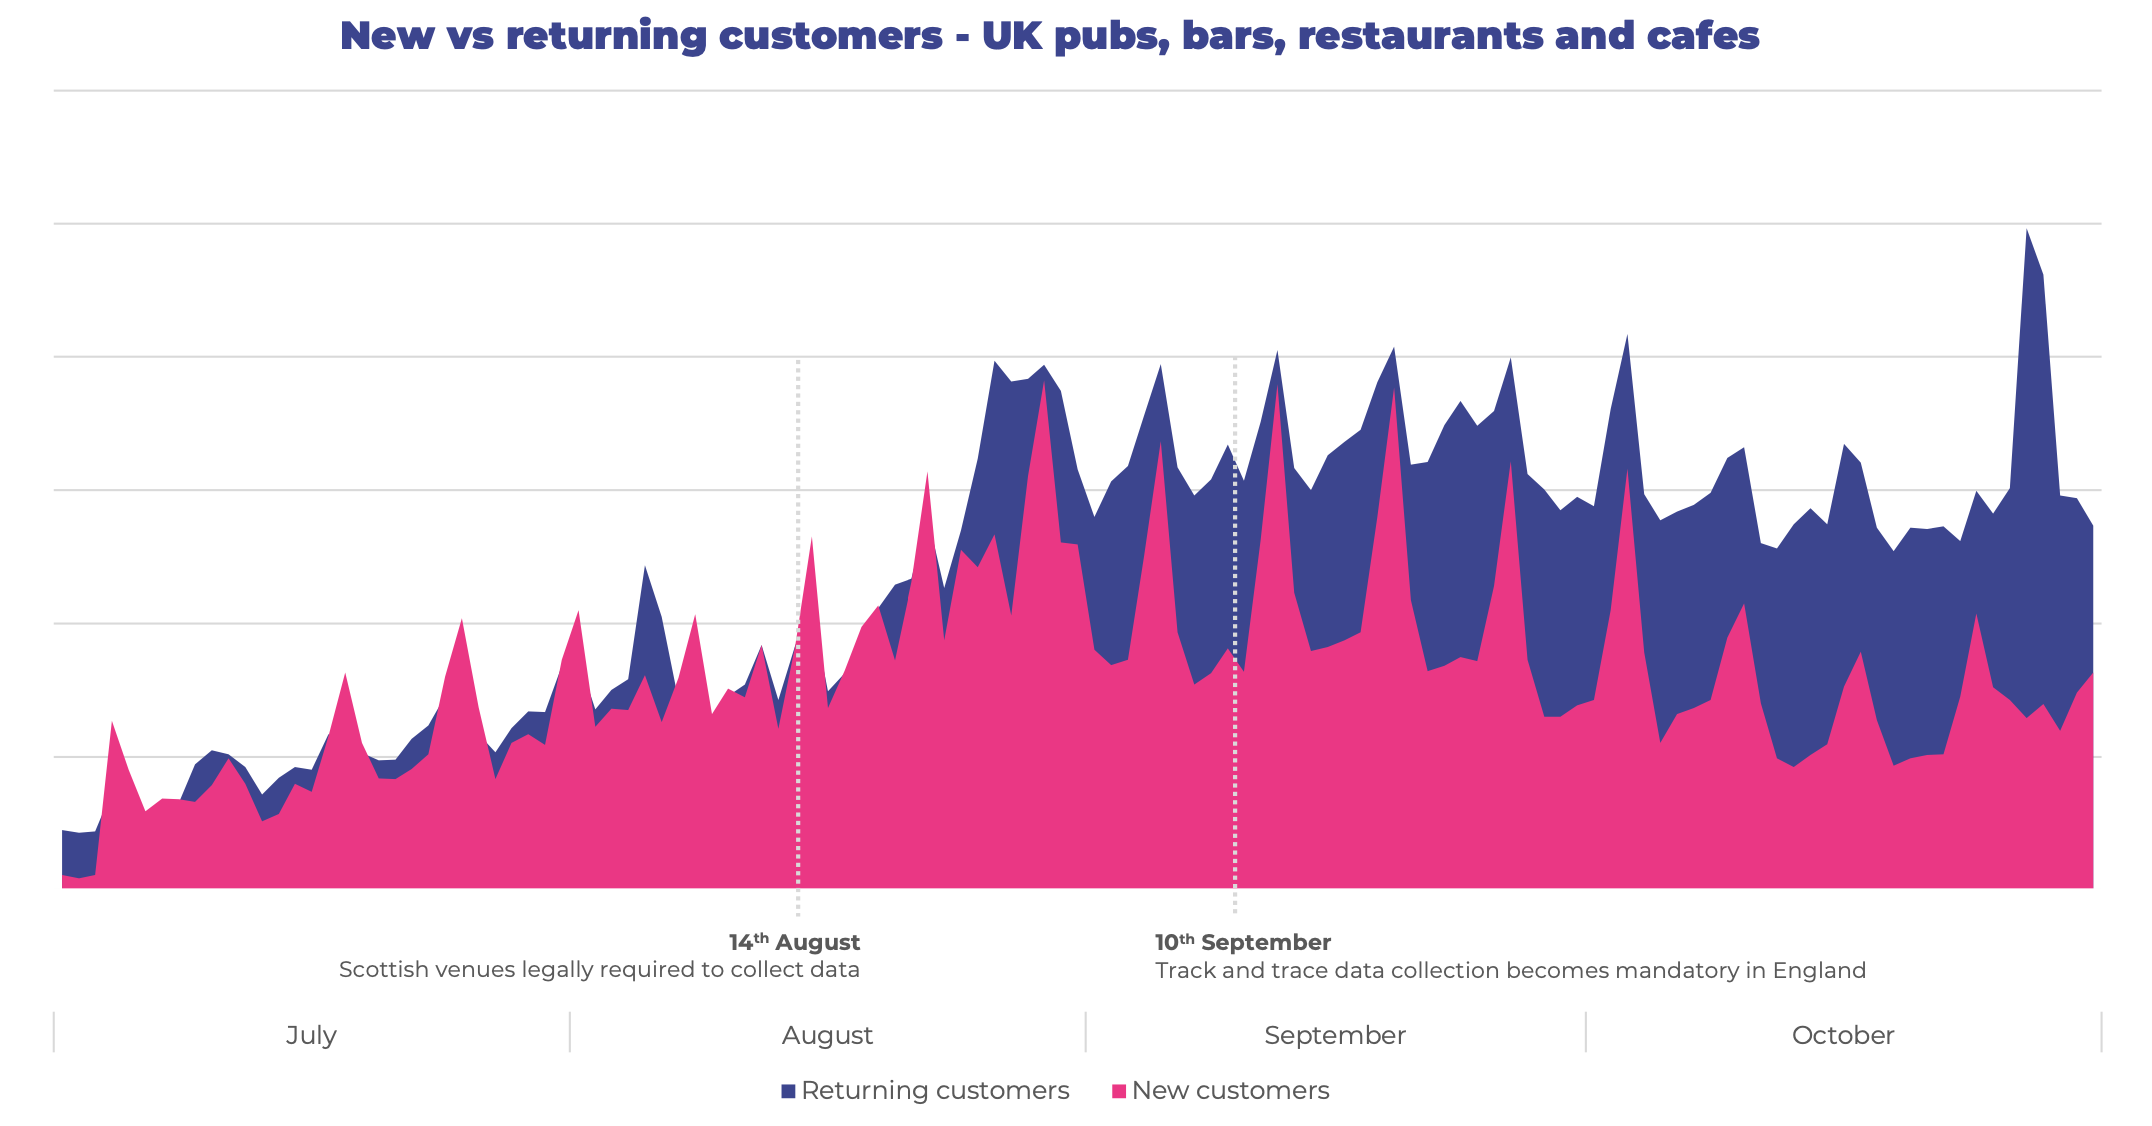
The data clearly shows that, prior to lockdown, venues saw a roughly equal split of new customers vs regulars. However, since late August the data has skewed massively towards repeat customers as venues become more reliant on repeated, local trade. We see two main factors driving this trend:
- Limited travel – Due to travel restrictions and a lack of tourism/holidays, it’s no surprise that people stayed closer to home and visited the same venues time and time again. Major UK cities and hubs for tourism like Edinburgh and London have sorely missed tourism trade
- Pub digitisation – With more venues encouraging customers to use track and trace, and order drinks at the table via app, the in-venue experience is becoming increasingly digitised. As such, more customers are logging into WiFi, scanning QR codes and generally obliging to opt in to register their details with more businesses. “Stickiness” may also be a factor, when people get used to how a venue works, how to log in, how to order food/drinks etc. Rather than exploring lots of different venues and downloading lots of new apps, some people may prefer to stay with one or two chosen venues.
In this chart, it’s important to note that Scotland introduced new data collection rules in mid-August and England introduced mandatory track and trace measures in England from the 10th September. Our data shows that behaviour changed weeks in late August and did not change again after the 10th September. UK pubs reacted to COVID amazingly and were using technology to reopen safely and responsibly of their own volition, not because it became law.
Weekday vs weekend trade
In addition to the general trend of repeat customers being on the rise post-lockdown, zooming in on the previous chart also underscores how the number of returning customers fluctuates at the weekend. Venues bring in far more new customers at the weekend, while a far greater proportion of weekday trade comes from regulars. The ratio of new to returning customers can range from 48/52 at the weekend to 37/63 on a weekday (figures from 17th and 14th September).
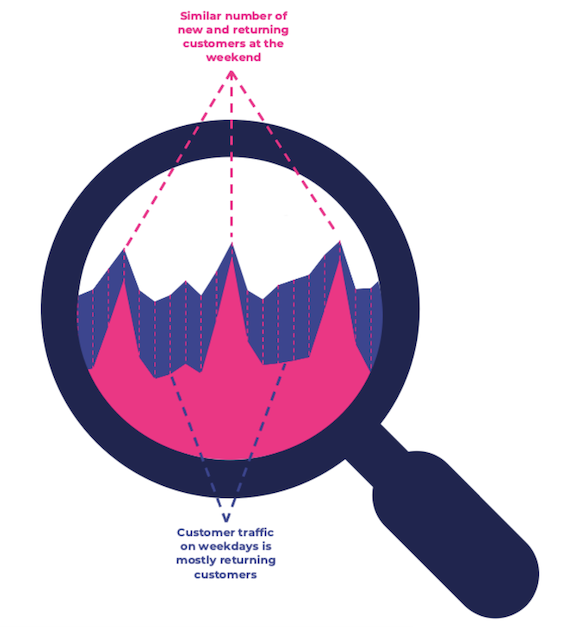
This may be common- sense, but it’s important data for operators and many venues do not have this kind of insight into customer trends. As the sector digitises further, this is the kind of data that all hospitality businesses should have for their own venues. Having this kind of real-time insight means they can create new promotions to attract new customers on weekdays if numbers are low, ensure new weekend customers come back again, and tweak their promotions/events to ensure that they have larger and longer spikes.
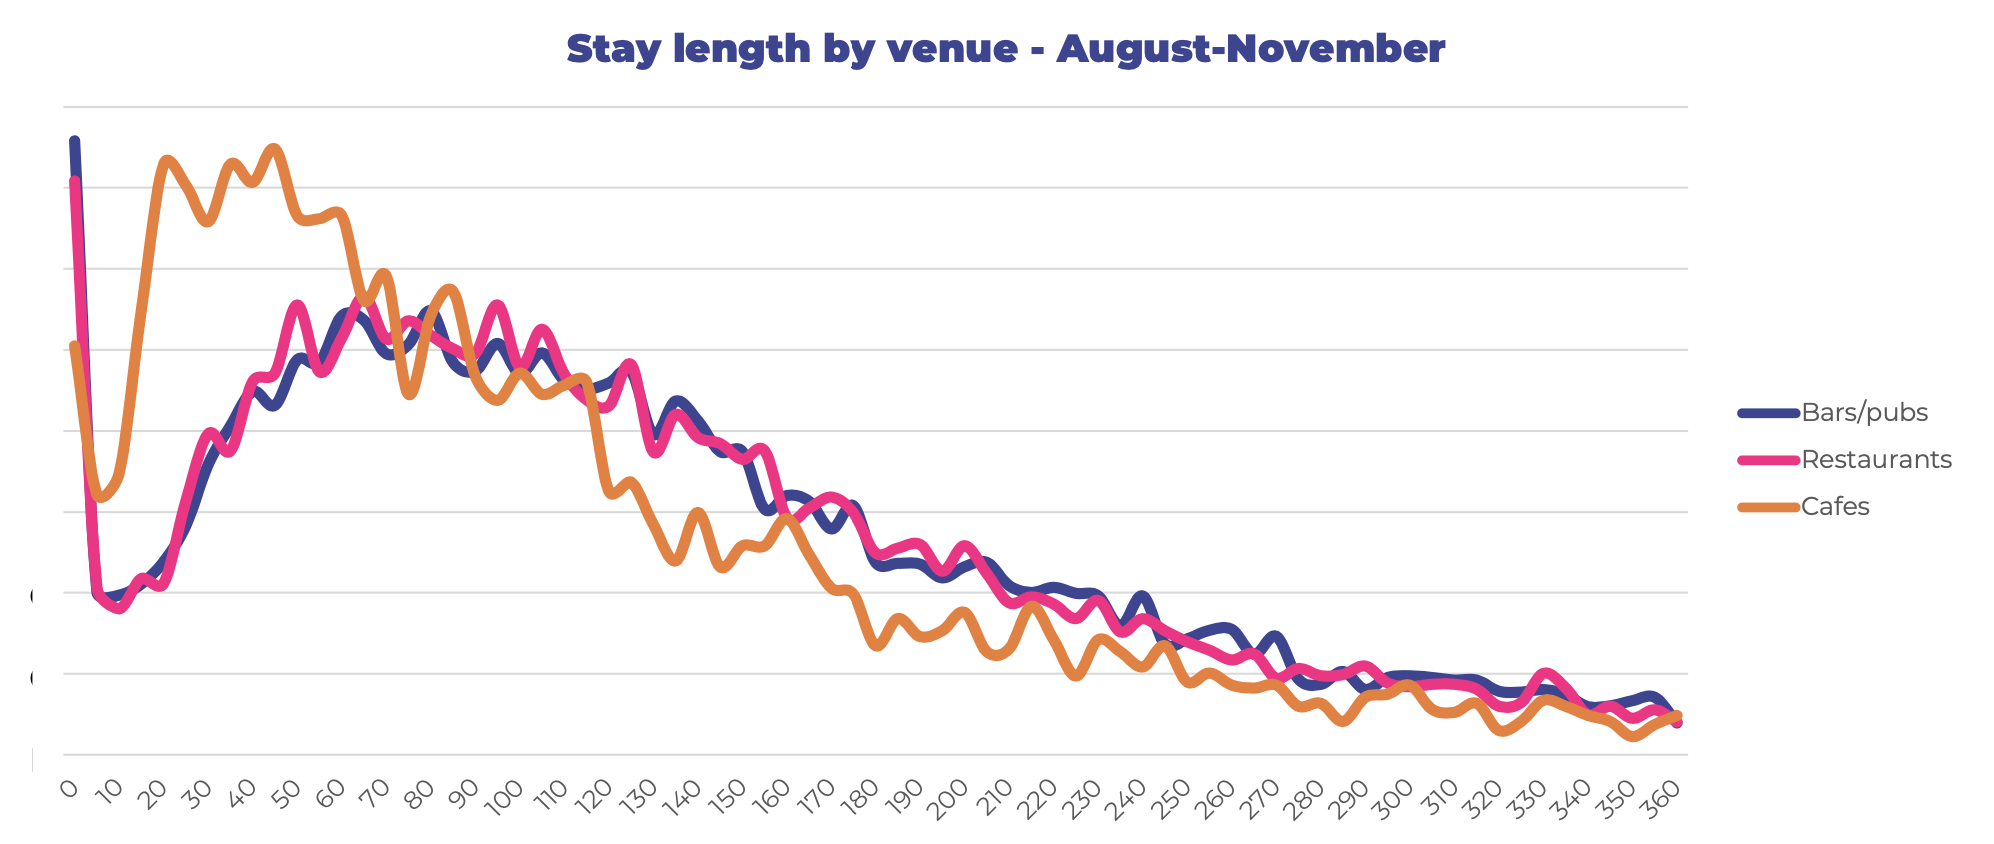
Stay length
Operators should also try to understand customer dwell times, and use this data to improve their services. As you can see from the chart below, the average stay in a restaurant or bar post-lockdown was 50-110 minutes. For cafés it is considerably shorter at 20-45 mins. Venues should aim to get this data for their own venues as a means of better understanding their customers and during which days/events they stay longest. For pubs, they can use this data to maximise stay lengths and use promotions to keep people in their venue for longer. For cafes, it may be a case of doing the opposite, learning on which days/during which shifts they are able to maintain a high turnover of customers. Experimenting with services/offers/policies/products/staff to see how they impact this metric.
For more information on this data, or to learn about gather data like this for your own business, you can reach us on 0131 510 7008 or contact@stampede.ai.
Click here to download all the charts in this report in a .ZIP file. (2.6Mb)