All in all, 2021 was a reasonable year. While the bond indices didn’t show much strength, our hard work paid off and we had a good year. As we look into 2022, we expect another challenging year, but we are prepared for it. We are positioning our portfolios to take advantage of the opportunities and avoid potential problems.
We have created a quick, focused review and outlook at the link below. For those who want the really quick version, migrate to quality, avoid the coming volatility and have a great 2022!
Happy Holidays! We wish you all the best in the New Year!
– Peter Baden, CFA, Chief Investment Officer
On the Horizon
- Vaccine distribution and variants present challenges: Winter is Coming
- Inflation is here and the Fed is on the job
- Will rising short term rates and high inflation translate to higher long-term rates?
- Will an activist Fed cause a recession?
- Can we dismiss Modern Monetary Theory now?
- Perspectives: High Inflation
Check out our year end outlook and update for insights and answers to the above questions.
Final Thoughts
- 2021 showed continued recovery, but stoking consumer demand without a healthy supply chain caused inflation to spike
- The Fed is signally they are on the job and the market believes it
- Growth should continue in 2022, but the possibility of policy mistakes cloud 2H2022 and 2023
- Municipal bonds continue to have strong demand and new issue supply should moderate
- IG Credit spreads are widening from historic lows, focus on improving credits, watch out for companies financial engineering stock returns at the expense of bond holders
- HY spreads are widening. Higher short-term interest rates is not good news for leveraged borrowers
Disclosures
The U 3 unemployment rate tracks the number of unemployed persons as a percentage of the labor force (the total number of employed plus unemployed
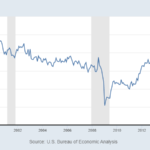
Gross domestic product ( is the total monetary or market value of all the finished goods and services produced within a country’s borders in a specific time period As a broad measure of overall domestic production, it functions as a comprehensive scorecard of a given country’s economic health This is seasonally in the chart shown Seasonal adjustment is a statistical technique designed to even out periodic swings in statistics or movements in supply and demand related to changing seasons Seasonal adjustments provide a clearer view of nonseasonal changes in data that would otherwise be overshadowed by the seasonal differences.
Year over year ( is a method of evaluating two or more measured events to compare the results at one period with those of a comparable period on an annualized basis.
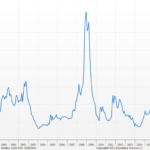
US CPI Urban Consumers Less Food Energy YoY NSA Consumer prices ( are a measure of prices paid by consumers for a market basket of consumer goods and services The yearly (or monthly) growth rates represent the inflation rate.
Core PCE Price Index is a measure of the prices that people living in the United States, or those buying on their behalf, pay for goods and services.
The Federal Funds Rate is the target interest rate set by the Federal Open Market Committee ( at which commercial banks borrow and lend their excess reserves to each other overnight.
The 5 year breakeven inflation rate is the difference between the 5 Year Treasury Constant Maturity Rate and the yield on an inflation protected security with 5 years remaining to maturity.
Yield to Maturity describes the rate of return an investor will receive if a long term, interest bearing security, such as a bond, is held to its maturity date.
A yield spread is the difference between yields on differing debt instruments of varying maturities, calculated by deducting the yield of one instrument from the other.
Tenor refers to the length of time remaining before a financial contract expires.
The FedWatch tool calculates unconditional probabilities of Federal Open Market Committee ( meeting outcomes given the trading levels of the contracts to generate a binary probability tree.
See: https://www.cmegroup.com/education/demos-and-tutorials/fed-funds-futures-probability-tree-calculator.html
Genoa Asset Management, LLC (“GAM“) is an investment adviser registered under the Investment Advisers Act of 1940 Registration as an Investment Adviser is no indication of any level of skill or training The information presented here in the material is general in nature and is not designed to address your investment objectives, financial situation or particular needs Prior to making any investment decision, you should assess or seek advice from a professional regarding whether any particular transaction is relevant or appropriate to your individual circumstances.
The information contained herein has been prepared solely for informational purposes and is not an offer to buy or sell or a solicitation of an offer to buy or sell any security The opinions expressed herein are those of GAM and may not come to pass This presentation does not intend to be a complete overview of the topic stated, nor is it meant to be a comprehensive discussion or analysis of the strategies discussed Investing involves risk, including the possible loss of principal As an investor, you should consider the investment objectives, risks, and fees carefully before investing The data available at the time of the presentation may be subject to change depending on current market conditions Although taken from reliable sources, Genoa cannot guarantee the accuracy of information received from third parties The information is current as of the date of this presentation and is subject to change at any time, based on market or other conditions.
The mention of specific securities and sectors illustrates the application of our investment approach only and is not to be considered a recommendation by Genoa There is no assurance that the securities purchased remain in the portfolio or that the securities sold have not been repurchased Charts, diagrams, and graphs, by themselves, cannot be used to make investment decisions.
Historical performance was affected by material market and economic conditions that were independent of and not controlled by F/m Investments, LLC or Genoa and may be different in the future.
Performance attribution characteristics along with Sectors and Holdings listed are taken from a representative or model account and may not mirror performance of your account Actual results of individual accounts and products, as well as account holdings, may vary due to client cash flows, timing of implementation, different custodians, the availability of underlying securities, regulation, and other factors Small accounts may underperform other accounts due to the potentially greater impact of transaction costs.
An index is a portfolio of specific securities, the performance of which is often used as a benchmark in judging the relative performance of certain asset classes Indexes are unmanaged portfolios and investors cannot invest directly in an index An index does not charge management fees or brokerage expenses, and no such fees or expenses were deducted from the performance shown.
All securities investing involves the risk of loss, including loss of principal Past performance is no guarantee of future results.