U.S. Cities With the Biggest Increase in Construction Jobs [2021 Edition]
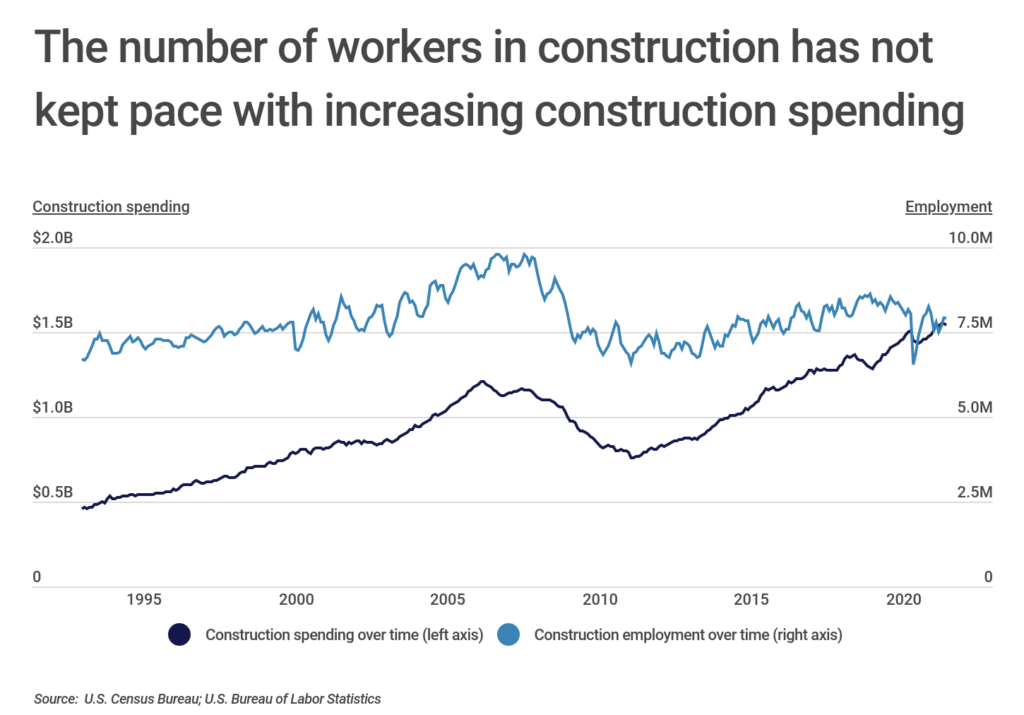
While the potential for trillions of dollars of new infrastructure spending looms on the horizon, America’s construction industry is struggling to even keep pace with current demand for new homes, businesses, roads, and bridges. A shortage of supplies and employees has created ongoing challenges for construction firms and their customers.
“The home building industry faces a major shortage of skilled workers. This persistent challenge endangers the affordability and availability of housing and hinders a robust economic recovery,” said Ed Brady, president and CEO of the Home Builders Institute (HBI), which recently released a report detailing the extent of the worker shortage. At the start of 2021, 60% of builders were experiencing a labor shortage, and the industry was in need of more than 300,000 additional workers, according to HBI. Even more recently, the trade association Associated Builders and Contractors estimated 430,000 additional workers would need to be hired in 2021.
While the construction labor shortage has been exacerbated by recent economic conditions, it is a trend that predates the COVID-19 pandemic. The longer-term issue stems from a decades-long decline in trade education and a lack of interest among younger workers, many of whom perceive employment in the construction industry as a last resort.
The construction labor shortage is most severe for framing crews and carpenters, where about 25% of firms reported a serious shortage and nearly another 50% reported moderate labor shortages, the HBI report noted. Other trades facing significant labor shortages included bricklayers, masons, concrete workers, painters, and plumbers.
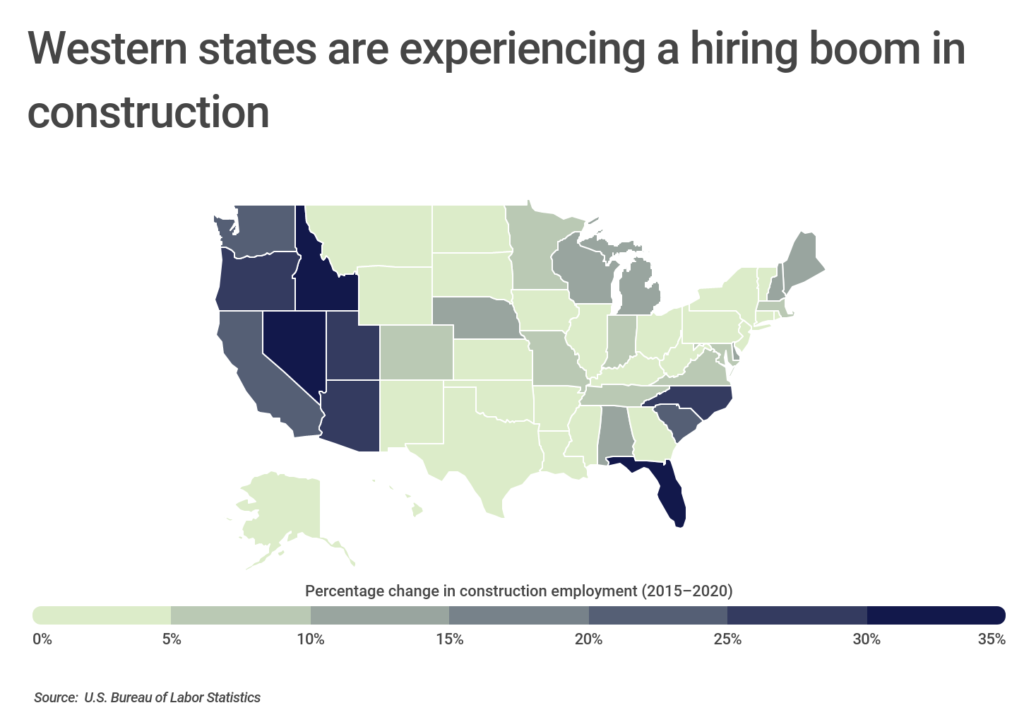
Despite short- and long-term labor shortages at the national level, states where population growth has been hottest are also where construction hiring has boomed in recent years. From 2015 to 2020, the Bureau of Labor Statistics recorded about 35% growth in construction employment in Idaho and Nevada, as well as about 30% growth in Florida, Arizona, Oregon, and North Carolina. In contrast, states in the Mid-Atlantic and Midwest regions have seen construction jobs stagnate or even decline over the past five years.
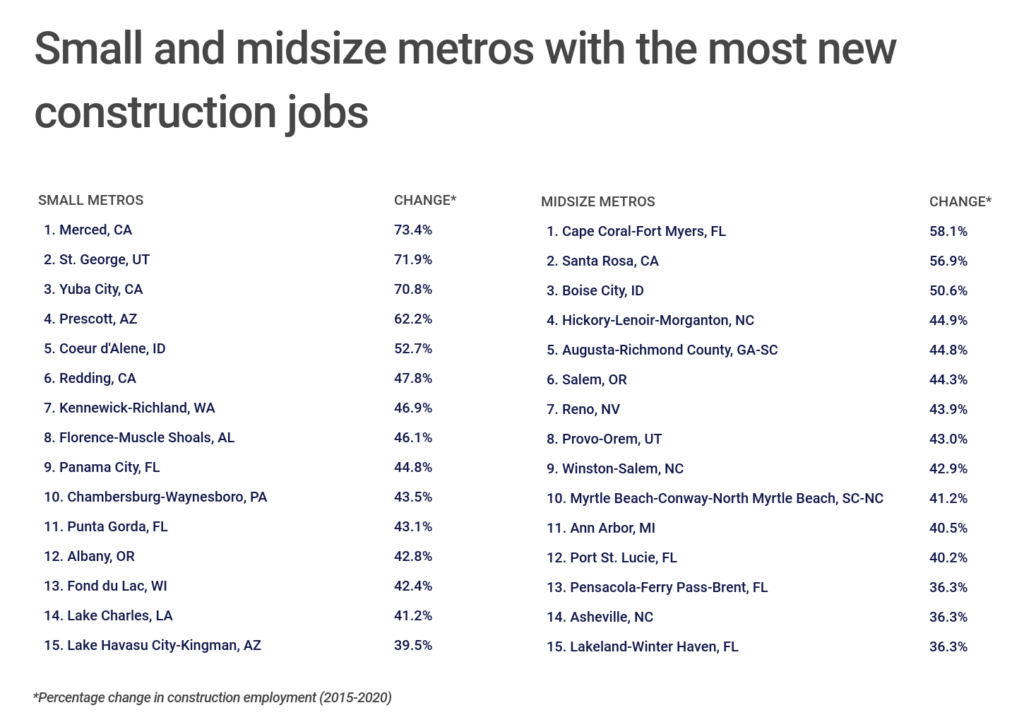
To find which metropolitan areas have added the most construction jobs over the same time period, researchers at Construction Coverage analyzed BLS data between 2015 and 2020, calculated the percentage change in construction employment, and ranked all metros of 100,000 residents or more based on that growth.
Here are the metropolitan areas that added the most construction jobs over the past five years.
RELATED
When starting a new construction business, choosing the right insurance is critical. Two often overlooked policies are commercial truck insurance for your vehicles and commercial building insurance for your office, warehouse, or storage space.
Large Metros With the Most New Construction Jobs
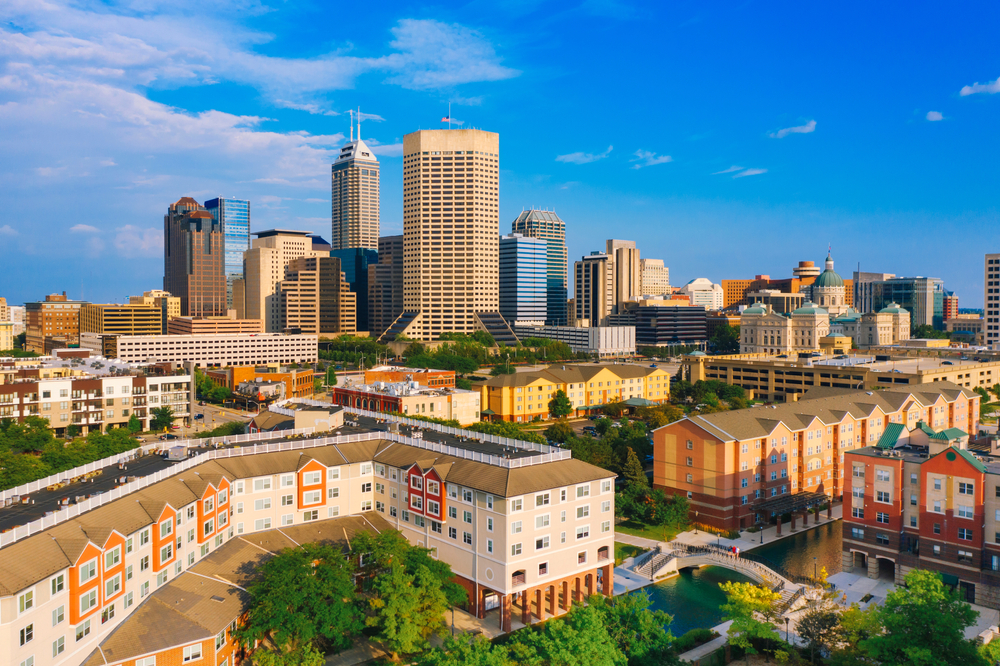
Photo Credit: Agnieszka Gaul / Shutterstock
15. Indianapolis-Carmel-Anderson, IN
- Percentage change in construction employment (2015-2020): 20.1%
- Percentage change in total employment (2015-2020): 2.7%
- Total change in construction employment (2015-2020): 6,950
- Total construction employment (2020): 41,580
- Median annual wage for construction workers (2020): $48,360

Photo Credit: Sean Pavone / Shutterstock
14. Raleigh, NC
- Percentage change in construction employment (2015-2020): 22.1%
- Percentage change in total employment (2015-2020): 10.1%
- Total change in construction employment (2015-2020): 5,100
- Total construction employment (2020): 28,180
- Median annual wage for construction workers (2020): $43,340
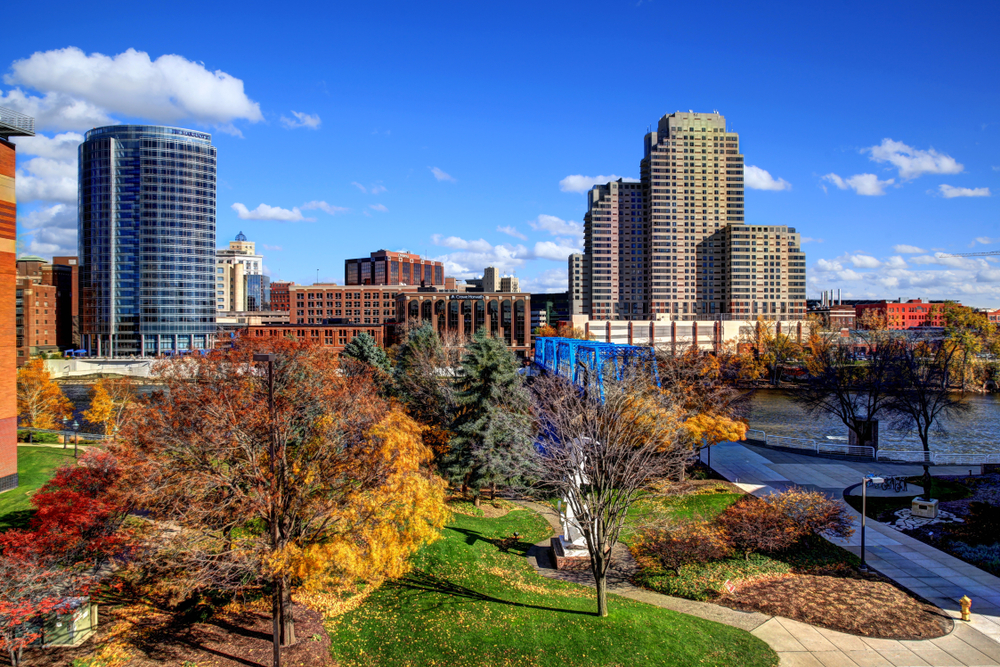
Photo Credit: Photosbykaity / Shutterstock
13. Grand Rapids-Wyoming, MI
- Percentage change in construction employment (2015-2020): 24.2%
- Percentage change in total employment (2015-2020): No significant change
- Total change in construction employment (2015-2020): 3,770
- Total construction employment (2020): 19,320
- Median annual wage for construction workers (2020): $46,190

Photo Credit: Songquan Deng / Shutterstock
12. Orlando-Kissimmee-Sanford, FL
- Percentage change in construction employment (2015-2020): 25.5%
- Percentage change in total employment (2015-2020): 6.6%
- Total change in construction employment (2015-2020): 11,850
- Total construction employment (2020): 58,230
- Median annual wage for construction workers (2020): $39,670

Photo Credit: Maciej Bledowski / Shutterstock
11. Salt Lake City, UT
- Percentage change in construction employment (2015-2020): 27.2%
- Percentage change in total employment (2015-2020): 10.4%
- Total change in construction employment (2015-2020): 8,370
- Total construction employment (2020): 39,130
- Median annual wage for construction workers (2020): $48,060

Photo Credit: Just dance / Shutterstock
10. Miami-Fort Lauderdale-West Palm Beach, FL
- Percentage change in construction employment (2015-2020): 28.5%
- Percentage change in total employment (2015-2020): 3.0%
- Total change in construction employment (2015-2020): 23,080
- Total construction employment (2020): 103,950
- Median annual wage for construction workers (2020): $41,440

Photo Credit: Steve Minkler / Shutterstock
9. Riverside-San Bernardino-Ontario, CA
- Percentage change in construction employment (2015-2020): 29.6%
- Percentage change in total employment (2015-2020): 13.7%
- Total change in construction employment (2015-2020): 19,100
- Total construction employment (2020): 83,650
- Median annual wage for construction workers (2020): $52,580
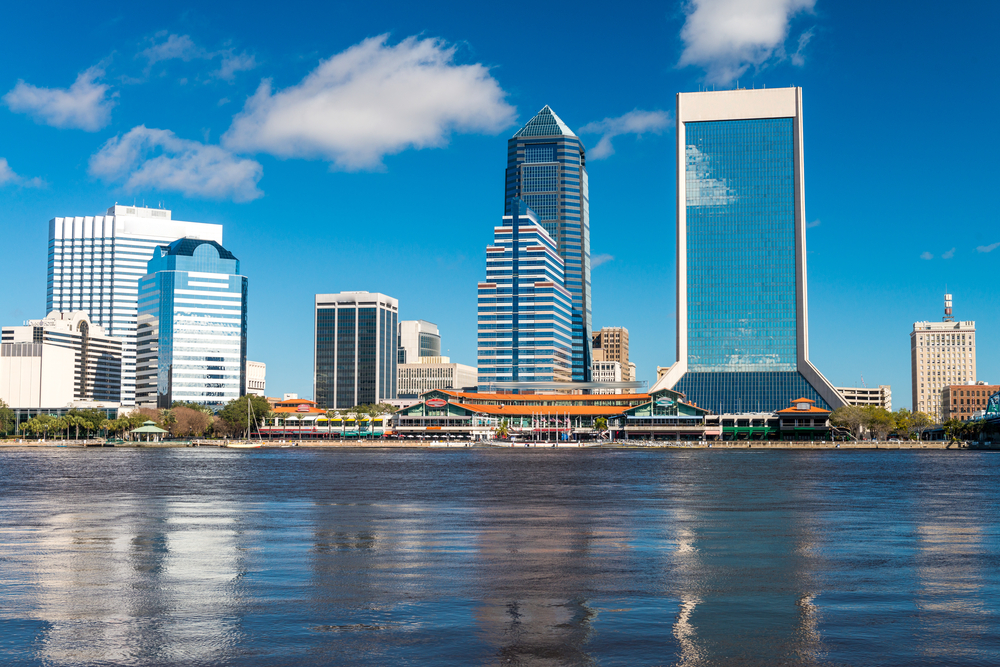
Photo Credit: GagliardiPhotography / Shutterstock
8. Jacksonville, FL
- Percentage change in construction employment (2015-2020): 29.8%
- Percentage change in total employment (2015-2020): 9.8%
- Total change in construction employment (2015-2020): 7,800
- Total construction employment (2020): 33,970
- Median annual wage for construction workers (2020): $38,450

Photo Credit: Jon Bilous / Shutterstock
7. Portland-Vancouver-Hillsboro, OR-WA
- Percentage change in construction employment (2015-2020): 30.9%
- Percentage change in total employment (2015-2020): 4.9%
- Total change in construction employment (2015-2020): 13,360
- Total construction employment (2020): 56,580
- Median annual wage for construction workers (2020): $59,390

Photo Credit: Mihai_Andritoiu / Shutterstock
6. Nashville-Davidson–Murfreesboro–Franklin, TN
- Percentage change in construction employment (2015-2020): 31.3%
- Percentage change in total employment (2015-2020): 9.3%
- Total change in construction employment (2015-2020): 8,210
- Total construction employment (2020): 34,470
- Median annual wage for construction workers (2020): $41,810

Photo Credit: Bonnie Fink / Shutterstock
5. Tampa-St. Petersburg-Clearwater, FL
- Percentage change in construction employment (2015-2020): 32.2%
- Percentage change in total employment (2015-2020): 7.2%
- Total change in construction employment (2015-2020): 14,570
- Total construction employment (2020): 59,860
- Median annual wage for construction workers (2020): $38,870

Photo Credit: Mark Skalny / Shutterstock
4. Phoenix-Mesa-Scottsdale, AZ
- Percentage change in construction employment (2015-2020): 33.3%
- Percentage change in total employment (2015-2020): 12.4%
- Total change in construction employment (2015-2020): 25,900
- Total construction employment (2020): 103,640
- Median annual wage for construction workers (2020): $47,030

Photo Credit: Virrage Images / Shutterstock
3. Las Vegas-Henderson-Paradise, NV
- Percentage change in construction employment (2015-2020): 34.1%
- Percentage change in total employment (2015-2020): No significant change
- Total change in construction employment (2015-2020): 13,320
- Total construction employment (2020): 52,340
- Median annual wage for construction workers (2020): $49,140
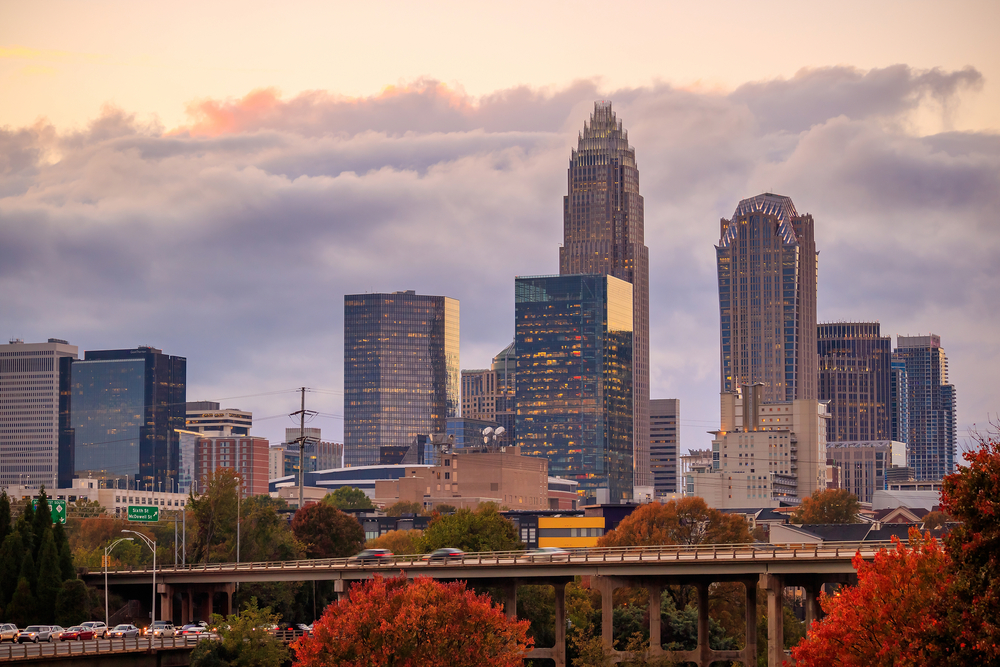
Photo Credit: f11photo / Shutterstock
2. Charlotte-Concord-Gastonia, NC-SC
- Percentage change in construction employment (2015-2020): 37.9%
- Percentage change in total employment (2015-2020): 8.7%
- Total change in construction employment (2015-2020): 15,270
- Total construction employment (2020): 55,580
- Median annual wage for construction workers (2020): $41,270
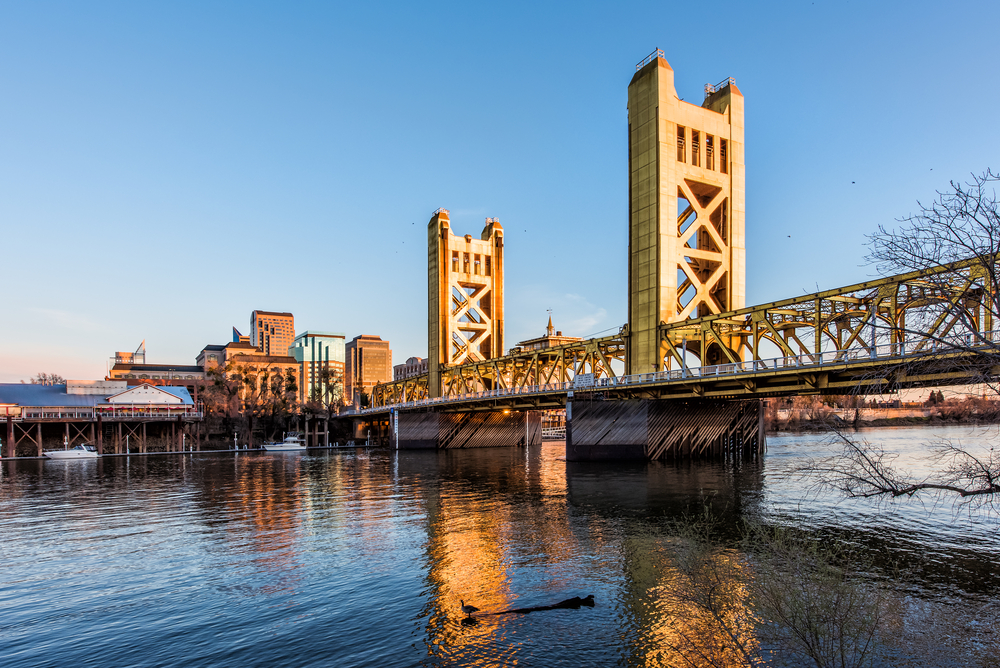
Photo Credit: Andriy Blokhin / Shutterstock
1. Sacramento–Roseville–Arden-Arcade, CA
- Percentage change in construction employment (2015-2020): 48.8%
- Percentage change in total employment (2015-2020): 10.7%
- Total change in construction employment (2015-2020): 17,510
- Total construction employment (2020): 53,370
- Median annual wage for construction workers (2020): $55,250
Methodology & Detailed Findings
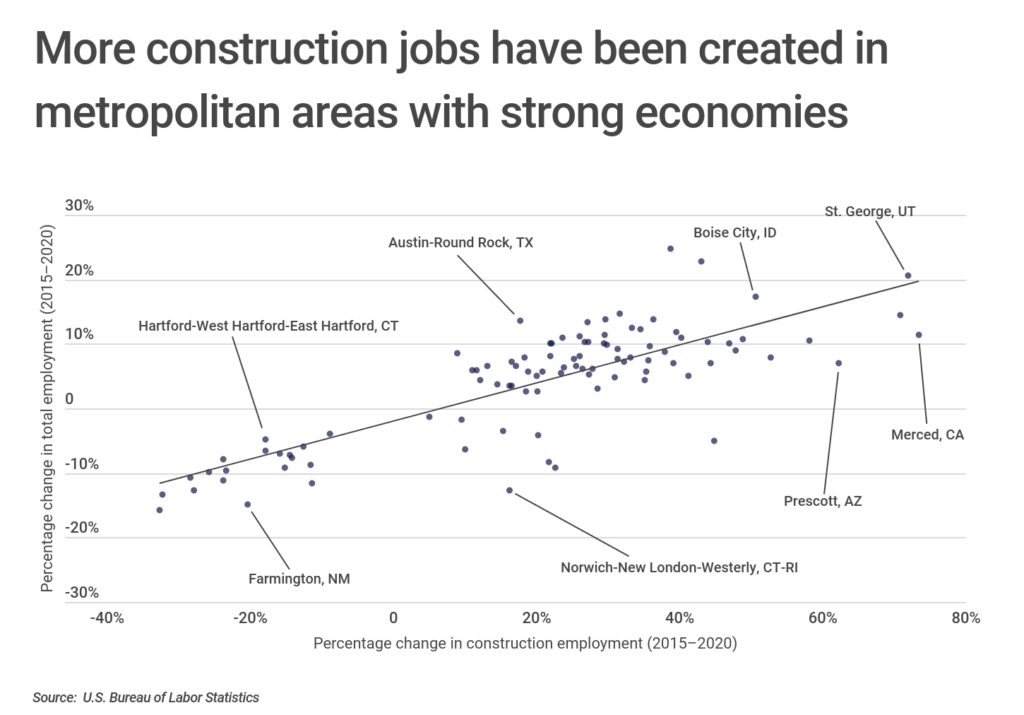
There is a strong positive correlation between the overall health of the local economy and construction-specific job growth. In general, locations with the most total employment growth were more likely to have strong construction job growth, while metros suffering from job losses were more likely to have cut back on construction hiring. These trends highlight the fact that job growth tends to reinforce itself. When a city adds more workers in one part of the economy, it must also create more homes, office space, and services to accommodate them, which helps create more jobs in other parts of the economy as well.
Employment and wage statistics are from the U.S. Bureau of Labor Statistics. To identify which locations have experienced the biggest increase in construction jobs, researchers calculated the percentage change in construction employment between 2015 and 2020. Only changes which are statistically significant at the 10% level are reported. All metropolitan areas from the U.S. Bureau of Labor Statistics with at least 100,000 people were included in the analysis. Additionally, to improve relevance, metropolitan areas were grouped into cohorts based on population size: small (100,000-349,999), midsize (350,000-999,999), and large (1,000,000 or more).
Each company featured in our guides has been independently selected and reviewed by our research team. If you select one of these companies and click on a link, we may earn a commission.
By clicking on these links, you may be taken to one of our insurance partners. The specific company listed here may or may not be included in our partner’s network at this time.