
Less likely to be tied down by family and mortgages, young people tend to be more mobile than their older counterparts. Cheaper cities where young people can afford to rent or own a home are especially attractive to those who may still be saddled with student loans or are just starting out in their careers. Nationally, people under age 30 account for about 38% of the population, according data from the U.S. Census Bureau. While the U.S. population is aging as a whole, and many cities are grappling with the effects of having stagnant or declining young populations, some more affordable cities and states have become especially popular among younger age groups.
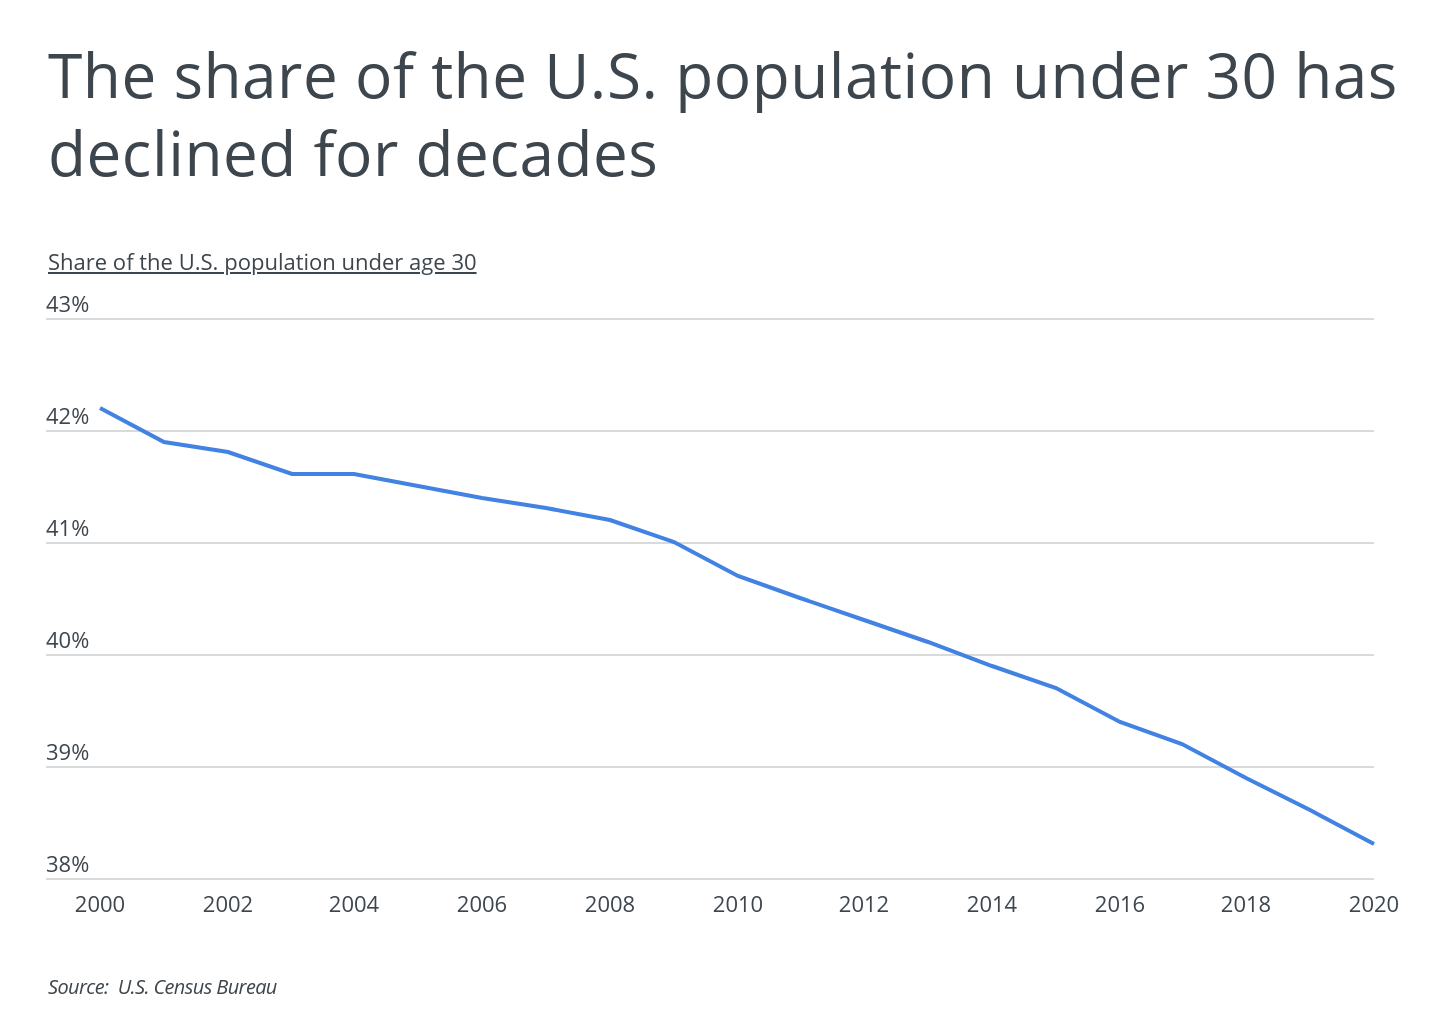
The initial releases of the 2020 Decennial Census confirmed several important demographic trends that present growing challenges for U.S. policymakers. These trends include reduced geographic mobility, an unprecedented decline in population growth, and a rapidly aging society. In 2000, over 42 percent of the U.S. population was under 30. By 2020, that figure had dropped to slightly over 38 percent. Conversely, Americans over 65 accounted for 12.4% of the population in 2000, but now represent nearly 17% of total. One major contributing factor is that the U.S. fertility rate has dropped for six consecutive years, and the number of births in 2020 was at the lowest level since 1979.
The effects of these changes will have long-lasting consequences throughout the country. According to an analysis by the Brookings Institute, it is projected that all states and metropolitan areas will continue to experience growth in their populations over 55. This will lead to rising healthcare costs and declining tax revenues, among other challenges. However, for younger age groups—with declining population shares nationally—it will largely be migration that will determine which locations experience gains or losses. And according to the National Association of Realtors, affordability is more important to under-30-year-olds than any other age cohort.
Recent Census data shows consistency with these trends—namely, that locations with below-average living costs tend to attract more young people. At the state level, Utah and Texas have the largest young populations, where 48.2% and 42.8% of the population is under 30, respectively. Both of these states offer costs of living that are 3.5% lower than average. Texas, in particular, stands out as being among the top states for total population growth, net migration, and growth in its young population over the past 10 years. These trends have only accelerated during the pandemic, which sparked an increased number of individuals, families, and businesses to relocate to Texas from high-cost states like California in search of lower taxes, more affordable housing, and fewer government restrictions.

TRENDING
A new perimeter fence can do wonders for the look of your home. Fences come in many shapes and sizes, and some are more affordable than you might think. Use our fence cost calculator to help you plan your next fence installation project.
To find the cheapest cities with large young populations, researchers at Porch analyzed the latest data from the U.S. Census Bureau, the Bureau of Economic Analysis, and the Department of Housing and Urban Development. The researchers ranked locations according to the share of the population under age 30. Researchers also calculated the total population under age 30, the cost of living (compared to the national average), the median cost of a one-bedroom rental, and median earnings for full-time workers under 30. Only metros with lower than average costs of living were included in the analysis.
To improve relevance, only metropolitan areas with at least 100,000 people were included in the analysis. Additionally, metro areas were grouped into the following cohorts based on population size:
- Small metros: 100,000–349,999
- Midsize metros: 350,000–999,999
- Large metros: 1,000,000 or more
Here are the cheapest metros with the largest young populations.
Cheapest Large Metros With the Most Young People

Photo Credit: Farid Sani / Shutterstock
15. Raleigh-Cary, NC
- Share of population under 30: 39.6%
- Total population under 30: 569,275
- Cost of living (compared to average): -3.9%
- Median 1-bedroom rental: $1,134
- Median earnings for full-time workers under 30: $36,000

Photo Credit: aceshot1 / Shutterstock
14. Cincinnati, OH-KY-IN
- Share of population under 30: 39.6%
- Total population under 30: 841,529
- Cost of living (compared to average): -9.4%
- Median 1-bedroom rental: $754
- Median earnings for full-time workers under 30: $35,000
RELATED
If you need to replace baseboards in your home because of water damage or just to upgrade the look of your home, check out our comprehensive baseboard installation guide, complete with FAQs and detailed cost estimates.

Photo Credit: Jon Bilous / Shutterstock
13. Virginia Beach-Norfolk-Newport News, VA-NC
- Share of population under 30: 39.7%
- Total population under 30: 623,612
- Cost of living (compared to average): -3.6%
- Median 1-bedroom rental: $1,045
- Median earnings for full-time workers under 30: $32,000

Photo Credit: Sean Pavone / Shutterstock
12. Kansas City, MO-KS
- Share of population under 30: 39.7%
- Total population under 30: 863,399
- Cost of living (compared to average): -7.2%
- Median 1-bedroom rental: $919
- Median earnings for full-time workers under 30: $35,000

Photo Credit: Mihai_Andritoiu / Shutterstock
11. Nashville-Davidson–Murfreesboro–Franklin, TN
- Share of population under 30: 39.9%
- Total population under 30: 830,190
- Cost of living (compared to average): -5.6%
- Median 1-bedroom rental: $1,114
- Median earnings for full-time workers under 30: $33,900

Photo Credit: Gregory E. Clifford / Shutterstock
10. Phoenix-Mesa-Chandler, AZ
- Share of population under 30: 40.3%
- Total population under 30: 1,963,911
- Cost of living (compared to average): -1.3%
- Median 1-bedroom rental: $1,111
- Median earnings for full-time workers under 30: $33,000

Photo Credit: Jonathannsegal / Shutterstock
9. Omaha-Council Bluffs, NE-IA
- Share of population under 30: 40.6%
- Total population under 30: 416,902
- Cost of living (compared to average): -8.3%
- Median 1-bedroom rental: $852
- Median earnings for full-time workers under 30: $36,000

Photo Credit: ESB Professional / Shutterstock
8. Atlanta-Sandy Springs-Alpharetta, GA
- Share of population under 30: 40.6%
- Total population under 30: 2,415,139
- Cost of living (compared to average): -2.1%
- Median 1-bedroom rental: $1,126
- Median earnings for full-time workers under 30: $34,300

Photo Credit: Agnieszka Gaul / Shutterstock
7. Columbus, OH
- Share of population under 30: 40.7%
- Total population under 30: 812,243
- Cost of living (compared to average): -8.4%
- Median 1-bedroom rental: $886
- Median earnings for full-time workers under 30: $33,600

Photo Credit: Agnieszka Gaul / Shutterstock
6. Indianapolis-Carmel-Anderson, IN
- Share of population under 30: 40.7%
- Total population under 30: 833,857
- Cost of living (compared to average): -8.9%
- Median 1-bedroom rental: $831
- Median earnings for full-time workers under 30: $35,000

Photo Credit: Roschetzky Photography / Shutterstock
5. Austin-Round Rock-Georgetown, TX
- Share of population under 30: 40.9%
- Total population under 30: 921,268
- Cost of living (compared to average): -0.7%
- Median 1-bedroom rental: $1,309
- Median earnings for full-time workers under 30: $37,000
TRENDING
Is it time to upgrade your kitchen? Find out what it would cost to install kitchen cabinets and improve the resale value of your home.

Photo Credit: Sean Pavone / Shutterstock
4. Memphis, TN-MS-AR
- Share of population under 30: 41.2%
- Total population under 30: 507,768
- Cost of living (compared to average): -10.4%
- Median 1-bedroom rental: $836
- Median earnings for full-time workers under 30: $30,000

Photo Credit: Sean Pavone / Shutterstock
3. Oklahoma City, OK
- Share of population under 30: 42.0%
- Total population under 30: 611,458
- Cost of living (compared to average): -10.2%
- Median 1-bedroom rental: $785
- Median earnings for full-time workers under 30: $31,300

Photo Credit: Sean Pavone / Shutterstock
2. San Antonio-New Braunfels, TX
- Share of population under 30: 42.6%
- Total population under 30: 1,035,508
- Cost of living (compared to average): -6.7%
- Median 1-bedroom rental: $981
- Median earnings for full-time workers under 30: $30,000

Photo Credit: Sean Pavone / Shutterstock
1. Salt Lake City, UT
- Share of population under 30: 45.0%
- Total population under 30: 575,620
- Cost of living (compared to average): -1.4%
- Median 1-bedroom rental: $1,073
- Median earnings for full-time workers under 30: $33,000
Detailed Findings & Methodology
With 45% of its population under age 30, the Salt Lake City metro area has the largest share of young people under 30 among large metros in the country. Salt Lake City’s cost of living is 1.4% lower than average, and the median rent for a one-bedroom apartment is slightly less than the national median rent of $1,096. Among the cheapest large metros with the youngest people, median one-bedroom rent ranges from $754 in Cincinnati to $1,309 in Austin. While rentals in Austin are more expensive than in the other metros, full-time workers there earn more than the national median – and Austin is also roommates friendly, making it easier to share rent burden.
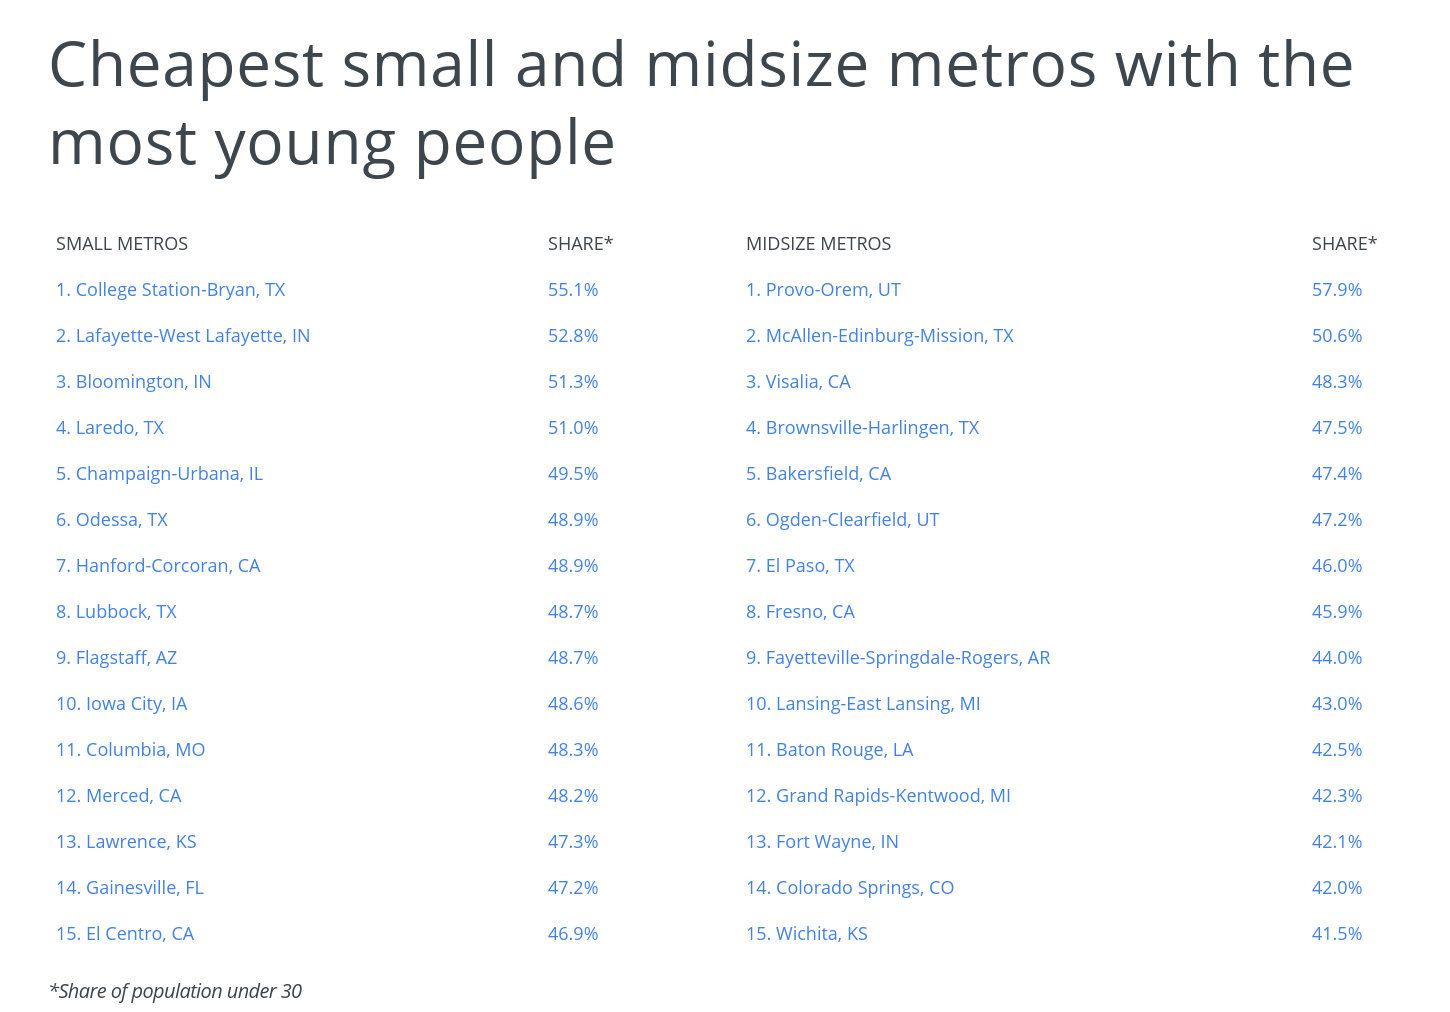
In some of the cheapest small and midsize metros, young people under 30 make up a majority of the population. Young people under 30 account for about 58% of the population in Provo-Orem, UT and 55% in College Station, TX. Rent for a one-bedroom apartment is highly affordable in both these metros, at $874 and $817, respectively.
To find the cheapest cities with large young populations, researchers at Porch analyzed the latest data from the U.S. Census Bureau’s 2019 American Community Survey Public Use Microdata Sample, the Bureau of Economic Analysis’s 2019 Regional Price Parities, and the Department of Housing and Urban Development’s 50th Percentile Rent Estimates. The researchers ranked locations according to the share of the population under age 30. In the event of a tie, the metro with the greater number of residents under age 30 was ranked higher. Researchers also calculated the cost of living (compared to average), the median cost of a one-bedroom rental, and median earnings for full-time workers under 30. Only locations with below-average living costs were included in the analysis.
To improve relevance, only metropolitan areas with at least 100,000 people were included in the analysis. Additionally, metro areas were grouped into the following cohorts based on population size:
- Small metros: 100,000–349,999
- Midsize metros: 350,000–999,999
- Large metros: 1,000,000 or more
!function(e,i,n,s){var t=”InfogramEmbeds”,d=e.getElementsByTagName(“script”)[0];if(window[t]&&window[t].initialized)window[t].process&&window[t].process();else if(!e.getElementById(n)){var o=e.createElement(“script”);o.async=1,o.id=n,o.src=”https://e.infogram.com/js/dist/embed-loader-min.js”,d.parentNode.insertBefore(o,d)}}(document,0,”infogram-async”);


