Datastream
The Global Chip Shortage Impact on American Automakers


The Briefing
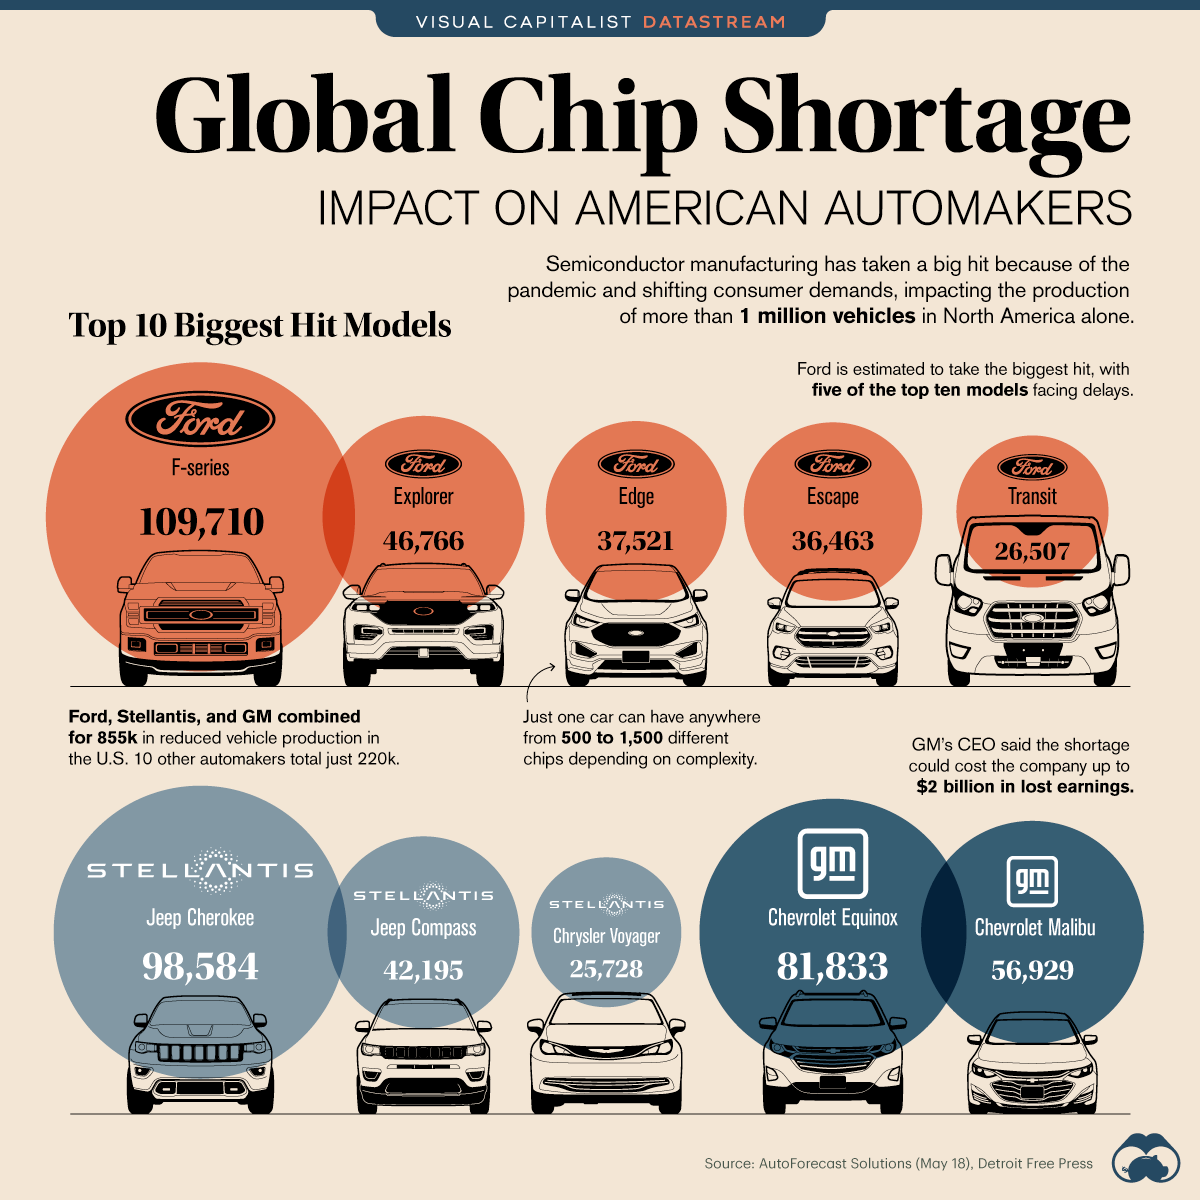
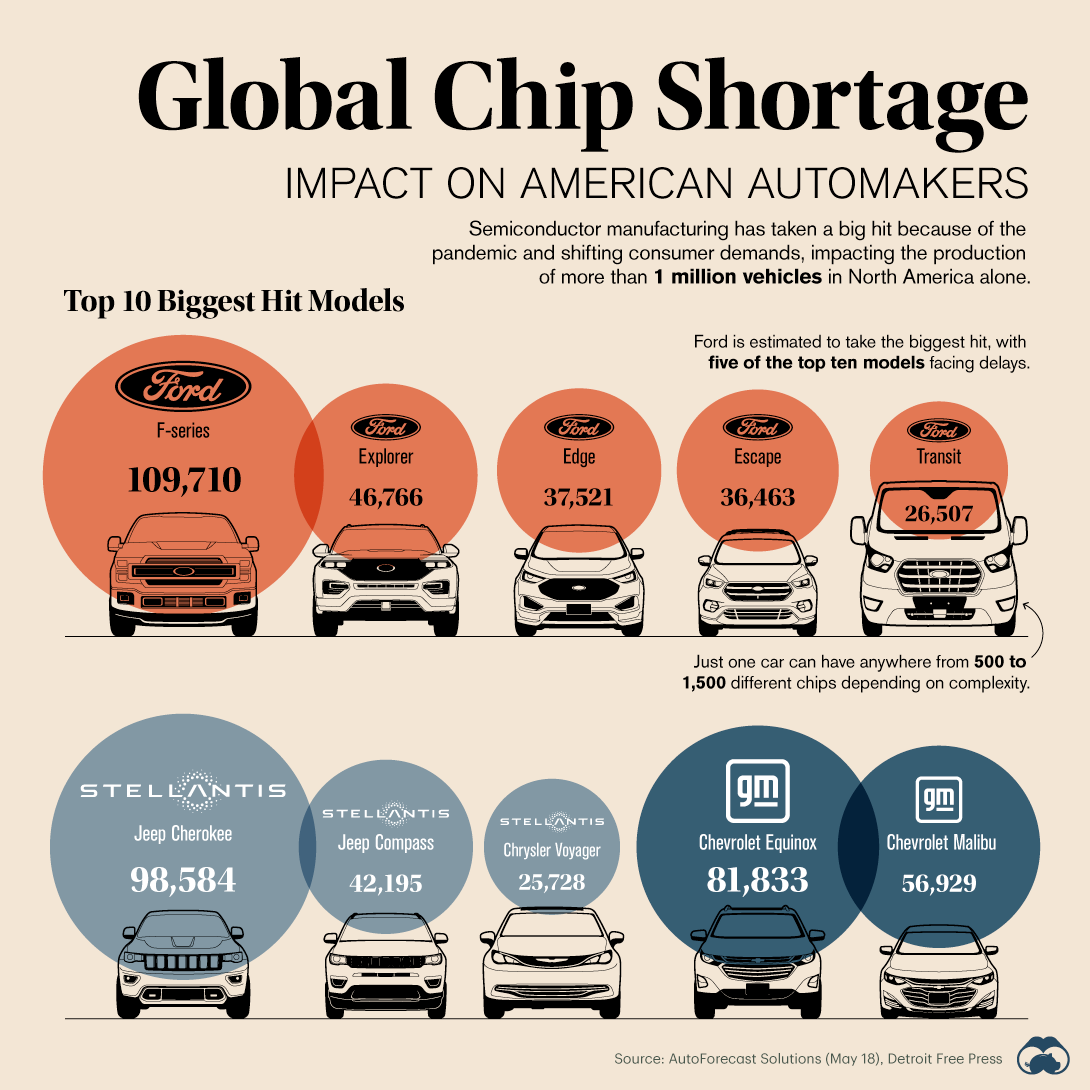
- Delays in semiconductor (chip) manufacturing are hitting vehicle production, with more than 1 million vehicles delayed in North America alone.
- American-based manufacturers Ford, Stellantis and GM are taking the hardest hit, combining for a delay of 855,000 vehicles.
- Modern cars are built with anywhere between 500-1,500 different chips.
The Global Chip Shortage Impact on American Automakers
Chips, or semiconductor devices, are behind all of the world’s increasingly complex electrical and digital devices.
That includes well-known items like computers and smartphones, but also other products that are becoming “smarter” including appliances, watches, and especially cars.
The automotive industry accounts for a large share of global chip consumption, with modern cars having smart and complex entertainment systems, navigation, and sensors. A modern car can have anywhere from 500-1,500 different chips powering its different functions.
But when the COVID-19 pandemic hit in 2020, shifting consumer demands and a slowing economy called for a reduction in semiconductor manufacturing. And unfortunately, it can take the supply chain a long time to come back online, as much as 1.5 years.
American Manufacturers Take the Biggest Hit
As the global economy has started to bounce back and demand for digital devices has increased, the chip manufacturing supply chain has become strained on its still-low supply.
And unfortunately for automakers, cars are taking the brunt of the hit.
| Manufacturer | Model | Estimated Volume Impact (10k+) |
|---|---|---|
| Ford | Ford F-Series | 109,710 |
| Stellantis | Jeep Cherokee | 98,584 |
| GM | Chevrolet Equinox | 81,833 |
| GM | Chevrolet Malibu | 56,929 |
| Ford | Ford Explorer | 46,766 |
| Stellantis | Jeep Compass | 42,195 |
| Ford | Ford Edge | 37,521 |
| Ford | Ford Escape | 36,463 |
| Ford | Ford Transit | 26,507 |
| Stellantis | Chrysler Voyager | 25,728 |
| Subaru | Subaru Outback | 23,882 |
| Stellantis | Chrysler Pacifica | 19,601 |
| GM | GMC Terrain | 18,417 |
| GM | Chevrolet Express | 18,268 |
| Volkswagen | Volkswagen Jetta | 18,044 |
| GM | Chevrolet Colorado | 15,153 |
| Stellantis | Ram 1500 | 14,793 |
| Stellantis | Jeep Grand Cherokee | 14,731 |
| GM | Chevrolet Blazer | 14,418 |
| Stellantis | Dodge Charger | 13,492 |
| GM | Cadillac XT4 | 12,233 |
| Ford | Ford Mustang | 12,019 |
| Volkswagen | Volkswagen Tiguan | 12,010 |
| Toyota | Toyota Tundra | 11,411 |
| Ford | Lincoln Nautilus | 10,601 |
| Subaru | Subaru Ascent | 10,508 |
| GM | Chevrolet Camaro | 10,489 |
| Honda | Honda Civic | 10,206 |
Though most of the world’s major automakers have factory production in North America, American-based manufacturers are estimated to take the hardest hit.
Of the more than 1.1 million vehicles estimated to face production delays, Ford, Stellantis, and GM combine for 855,000. Ford specifically has five of the top 10 models facing delays, including the largest hit: the F-series at 109,710 delayed units.
| Manufacturer | Estimated Volume Impact |
|---|---|
| Ford | 324,616 |
| General Motors | 277,966 |
| Stellantis | 252,193 |
| Subaru | 45,272 |
| Volkswagen | 45,215 |
| Honda | 42,951 |
| Nissan | 41,928 |
| Toyota | 23,670 |
| Tesla | 6,418 |
| Mazda | 6,133 |
| COMPAS | 4,200 |
| Hyundai | 2,548 |
| Volvo | 1,287 |
Other automakers with less production based in North America are facing far softer impacts. Japanese automakers Honda, Nissan, and Toyota are estimated to take a collective hit of 108,549 delayed models, while companies like Hyundai and Volvo have less than 3,000 vehicles impacted.
The biggest reason for the discrepancy? Where each automaker sources and installs its chips. For American manufacturers in particular, the over-dependence on chips coming through China, Korea, and Taiwan has caused the current U.S. government to look for solutions, with the Senate recently approving $52 billion in subsidies for local chip manufacturing.
When the chip shortage will end is currently anybody’s guess, as manufacturers and countries are scrambling to increase capacity. Whether the financial influx from the U.S. will be enough, and how long it will take to affect a very-slow manufacturing process, remains up in the air.
Where does this data come from?
Source: AutoForecast Solutions, Detroit Free Press.


Datastream
Can You Calculate Your Daily Carbon Footprint?
Discover how the average person’s carbon footprint impacts the environment and learn how carbon credits can offset your carbon footprint.


The Briefing
- A person’s carbon footprint is substantial, with activities such as food consumption creating as much as 4,500 g of CO₂ emissions daily.
- By purchasing carbon credits from Carbon Streaming Corporation, you can offset your own emissions and fund positive climate action.
Your Everyday Carbon Footprint
While many large businesses and countries have committed to net-zero goals, it is essential to acknowledge that your everyday activities also contribute to global emissions.
In this graphic, sponsored by Carbon Streaming Corporation, we will explore how the choices we make and the products we use have a profound impact on our carbon footprint.
Carbon Emissions by Activity
Here are some of the daily activities and products of the average person and their carbon footprint, according to Clever Carbon.
| Household Activities & Products | CO2 Emissions (g) |
|---|---|
| 💡 Standard Light Bulb (100 watts, four hours) | 172 g |
| 📱 Mobile Phone Use (195 minutes per day)* | 189 g |
| 👕 Washing Machine (0.63 kWh) | 275 g |
| 🔥 Electric Oven (1.56 kWh) | 675 g |
| ♨️ Tumble Dryer (2.5 kWh) | 1,000 g |
| 🧻 Toilet Roll (2 ply) | 1,300 g |
| 🚿 Hot Shower (10 mins) | 2,000 g |
| 🚙 Daily Commute (one hour, by car) | 3,360 g |
| 🍽️ Average Daily Food Consumption (three meals of 600 calories) | 4,500 g |
| *Phone use based on yearly use of 69kg per the source, Reboxed | |
Your choice of transportation plays a crucial role in determining your carbon footprint. For instance, a 15 km daily commute to work on public transport generates an average of 1,464 g of CO₂ emissions. Compared to 3,360 g—twice the volume for a journey the same length by car.
By opting for more sustainable modes of transport, such as cycling, walking, or public transportation, you can significantly reduce your carbon footprint.
Addressing Your Carbon Footprint
One way to compensate for your emissions is by purchasing high-quality carbon credits.
Carbon credits are used to help fund projects that avoid, reduce or remove CO₂ emissions. This includes nature-based solutions such as reforestation and improved forest management, or technology-based solutions such as the production of biochar and carbon capture and storage (CCS).
While carbon credits offer a potential solution for individuals to help reduce global emissions, public awareness remains a significant challenge. A BCG-Patch survey revealed that only 34% of U.S. consumers are familiar with carbon credits, and only 3% have purchased them in the past.
About Carbon Streaming
By financing the creation or expansion of carbon projects, Carbon Streaming Corporation secures the rights to future carbon credits generated by these sustainable projects. You can then purchase these carbon credits to help fund climate solutions around the world and compensate for your own emissions.
Ready to get involved?
>> Learn more about purchasing carbon credits at Carbon Streaming

-

 Maps2 weeks ago
Mapped: Average Wages Across Europe
-

 Money1 week ago
Which States Have the Highest Minimum Wage in America?
-

 Real Estate1 week ago
Ranked: The Most Valuable Housing Markets in America
-

 Markets1 week ago
Charted: Big Four Market Share by S&P 500 Audits
-

 AI1 week ago
The Stock Performance of U.S. Chipmakers So Far in 2024
-

 Misc2 weeks ago
Almost Every EV Stock is Down After Q1 2024
-

 Money2 weeks ago
Where Does One U.S. Tax Dollar Go?
-

 Green2 weeks ago
Ranked: Top Countries by Total Forest Loss Since 2001