
Risk of Alzheimer’s Disease Following Influenza Vaccination: A Claims-Based Cohort Study Using Propensity Score Matching
Abstract
Background:
Prior studies have found a reduced risk of dementia of any etiology following influenza vaccination in selected populations, including veterans and patients with serious chronic health conditions. However, the effect of influenza vaccination on Alzheimer’s disease (AD) risk in a general cohort of older US adults has not been characterized.
Objective:
To compare the risk of incident AD between patients with and without prior influenza vaccination in a large US claims database.
Methods:
Deidentified claims data spanning September 1, 2009 through August 31, 2019 were used. Eligible patients were free of dementia during the 6-year look-back period and≥65 years old by the start of follow-up. Propensity-score matching (PSM) was used to create flu-vaccinated and flu-unvaccinated cohorts with similar baseline demographics, medication usage, and comorbidities. Relative risk (RR) and absolute risk reduction (ARR) were estimated to assess the effect of influenza vaccination on AD risk during the 4-year follow-up.
Results:
From the unmatched sample of eligible patients (n = 2,356,479), PSM produced a sample of 935,887 flu–vaccinated-unvaccinated matched pairs. The matched sample was 73.7 (SD, 8.7) years of age and 56.9% female, with median follow-up of 46 (IQR, 29–48) months; 5.1% (n = 47,889) of the flu-vaccinated patients and 8.5% (n = 79,630) of the flu-unvaccinated patients developed AD during follow-up. The RR was 0.60 (95% CI, 0.59–0.61) and ARR was 0.034 (95% CI, 0.033–0.035), corresponding to a number needed to treat of 29.4.
Conclusion:
This study demonstrates that influenza vaccination is associated with reduced AD risk in a nationwide sample of US adults aged 65 and older.
INTRODUCTION
The current estimate of Alzheimer’s disease (AD) prevalence in the US exceeds 6 million people [1]. While some evidence suggests the incidence of dementia may be decreasing due to improvements in average cardiovascular health, the number of affected individuals is growing because of our aging population [1, 2]. This increasing prevalence has wide-ranging implications for patients with AD, their families, and the health care system as a whole. The majority of treatments currently approved offer limited symptomatic relief. As such, the identification of modifiable factors that prevent or delay AD onset is critical [1, 2].
Mounting evidence indicates that systemic im-mune responses can have lasting effects on the brain and can influence AD risk and/or progression [3, 4]. A diverse range of microorganisms and infectious diseases have been associated with an increased risk and/or rate of cognitive decline, particularly among older adults, including influenzal respiratory infections [5, 6], pneumonia [4, 7], herpes infections [7], chronic periodontitis [8], urinary tract infections [4], gastrointestinal infections [9], sepsis [4], and most recently COVID-19 [10]. Prevention or attenuation of microbe-related inflammation may therefore represent a rational strategy to delay or reduce the risk of neurodegenerative disease. Consistent with this hypothesis, studies have found a decreased risk of dementia associated with prior exposure to various adulthood vaccinations, including those for tetanus, diphtheria, pertussis (Tdap) [11–13]; poliomyelitis [11]; tuberculosis [14, 15]; herpes zoster (i.e., shingles) [6, 13, 16, 17]; and influenza [11, 18–21].
Past studies of the association between influenza vaccination and the incidence of AD have been limited by small sample sizes; demographic homogeneity that is not representative of the general US population; and/or study populations with specific chronic health conditions (e.g., chronic kidney disease or chronic obstructive pulmonary disease) [11, 18–20, 22]. Additionally, all but one of these five studies examined the association between influenza vaccination and dementia of any cause; the only study that examined the association with AD-specific dementia used a relatively small sample (n = 3,865) of older adults in Canada. A recent meta-analysis of these studies (aggregated sample size of 292,157 patients) found that influenza vaccination mitigated the risk of dementia [21].
In conclusion, current evidence suggests that in-fluenza vaccination lowers the risk of dementia, but a study of influenza vaccination and risk of AD specifically in a large sample that is representative of the general US population has not been reported. We therefore sought to examine the relation between influenza vaccination and AD risk in a large, nationally distributed study population of insured 65-and-older adults in the US. We tested the hypothesis that influenza vaccination reduces the risk of AD in older adults.
METHODS
Data source and study period
The database population was obtained from the Optum® Clinformatics® Data Mart (CDM). The CDM contains medical claims, pharmacy claims, administrative claims, and laboratory result data for privately insured or Medicare Advantage with Part D enrollees who have both medical and prescription-drug coverage. Claims data are verified, adjudicated, adjusted, and de-identified prior to inclusion in CDM. Mortality data derived from hospital discharge claims and from external linkage to the Social Security Administration Death Master File is appended to the CDM prior to de-identification. CDM data available for this study spanned September 2009 through September 2019.
The look-back period was defined as September 1, 2009, through August 31, 2015; the follow-up period spanned September 1, 2015, through August 31, 2019. A look-back duration of 6 years was used in response to a recent study that found a statistically significant relationship between influenza vaccination and incident dementia only after≥6 influenza vaccinations [20]. As explained in the Statistical Methods subsection, the current study’s primary analysis examined influenza vaccination during the follow-up period as a binary exposure (i.e., zero versus≥1 influenza vaccinations). In contrast, the secondary analysis considered the total number of flu vaccinations received during the look-back period, so the threshold effect found by Wiemken et al. [20] was particularly relevant to the secondary analysis. The number of medically indicated influenza vaccinations during a given period is defined by the number of annual flu seasons during that period; therefore, the look-back duration was set at 6 years.
Sample selection
Figure 1 illustrates the following sample selection methodology. Patients were eligible for inclusion if they had≥1 record with an ICD code during the look-back period and≥2 records with an ICD code during the follow-up period. Patients were excluded if their age at the start of follow-up was less than 65 years, if they had a diagnosis of mild cognitive impairment (MCI), encephalopathy, or dementia of any cause during the look-back period, or if they filled a prescription for a medication indicated for AD (i.e., donepezil, galantamine, rivastigmine, or memantine) during the look-back period. Patients younger than 65 at the start of follow-up were excluded because this is the age at which AD incidence becomes appreciable [1]. The ICD codes and drug names used for the exclusion criteria are provided in Supplementary Table 1.
Fig. 1
Flowchart of Sampling Methodology. AD, Alzheimer disease; CDM, Clinformatics Data Mart; ICD, International Classification of Diseases. aAD diagnoses included dementia due to AD, unspecified dementia, and “senile” dementia. bAD medications were donepezil, galantamine, rivastigmine, and memantine. cExclusionary diagnoses were mild cognitive impairment, encephalopathy, and dementia (of any cause).
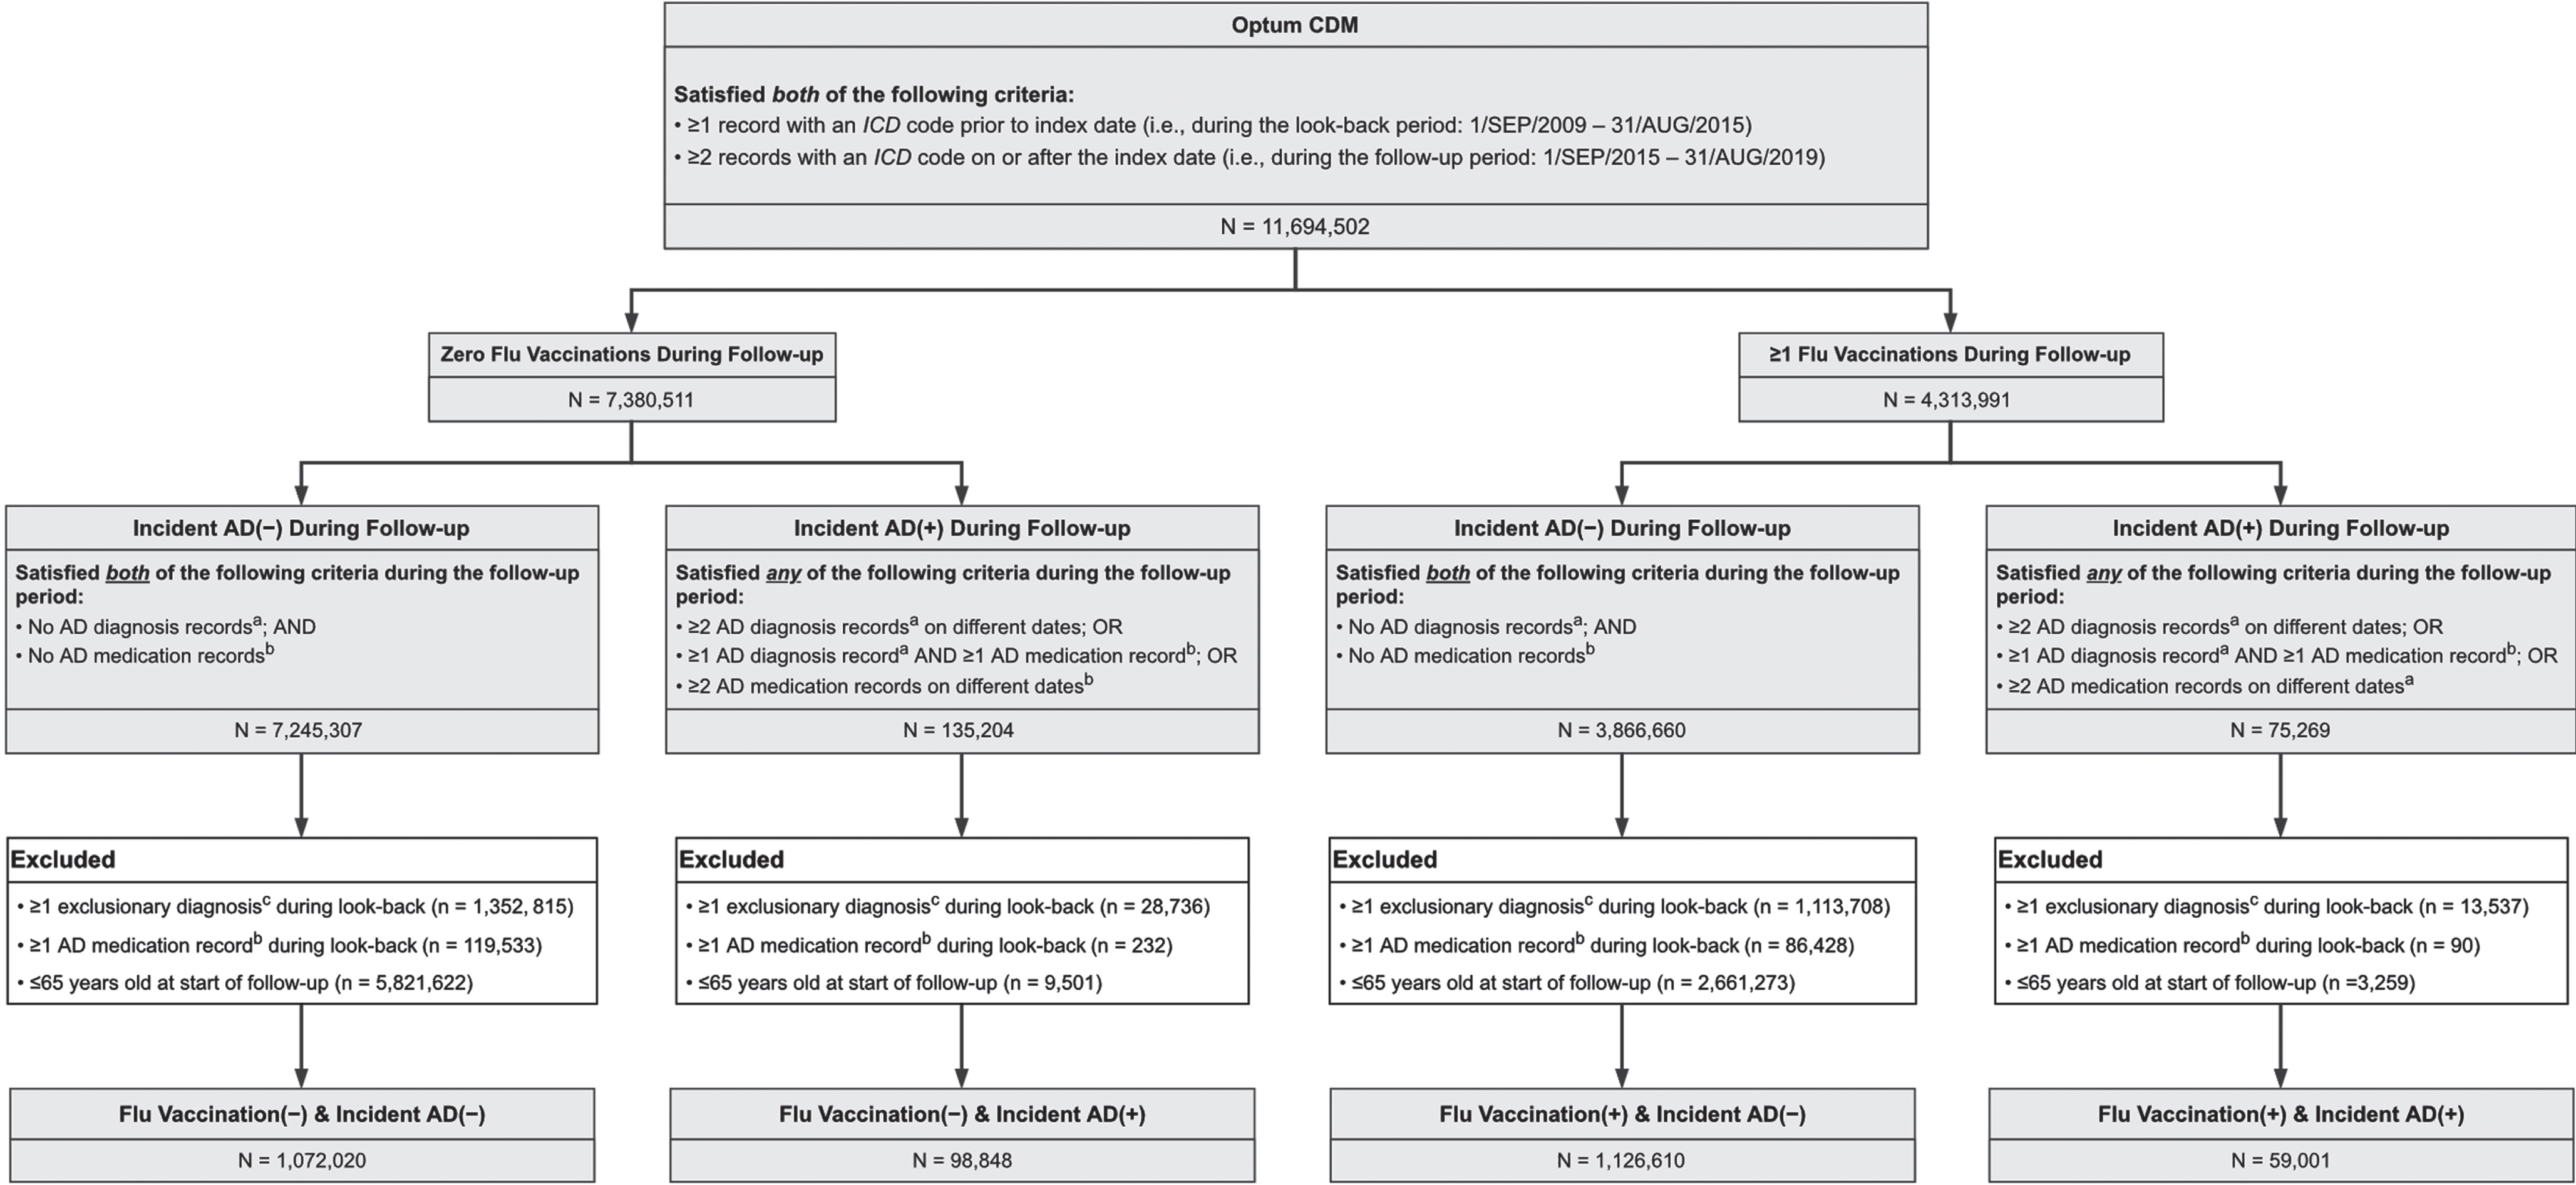
Table 1
Comparison of Primary and Secondary Analysis Methodologies
| Sample used | Period during which influenza vaccinations were measured (i.e., the exposure period) | Exclusion criteria (in addition to those described in Fig. 1) | Model covariates | |
| Primary Analysis: ATT Estimation Using PSM | Propensity-score matched | Follow-up | •Excluded patients if any of the following variables were missing from the data set: geographic region, race, or sex. The number of patients missing each of these variables is provided in Table 2. | The propensity score model included all covariates shown in Table 2. |
| Secondary Analysis: Time-to-Event Model | Unmatched | Look-back | •Excluded patients if any of the following variables were missing from the data set: geographic region (n = 1,934), race (n = 212,757), or sex (n = 197). | The competing-risks time-to-event model included all covariates shown in Table 2 except for the following: |
| •Excluded patients who received more than 6 influenza vaccinations during the 6-year look-back period (n = 31). | •Geographic region •Number of health care visits during the look-back period | |||
| •Excluded patients who received zero influenza vaccinations during the look-back period but≥1 influenza vaccinations during the follow-up period (n = 587,726). | •Number of routine “well visit” examinations during the look-back period |
Methods that did not differ between the primary and secondary analyses (i.e., outcome and covariate measurements) are not shown in this table. ATT, average treatment effect in the treated; PSM, propensity score matching.
Exposure measurement
The period in which influenza vaccinations were counted differed between the primary and secondary analyses. For the primary analysis, influenza vaccinations were measured during the follow-up period and were counted only if they preceded the date of AD onset, censoring, or the end of the follow-up period, whichever occurred first. For the secondary analysis, influenza vaccinations were measured during the look-back period.
Intranasal vaccine formulations were not counted in this study because the intranasal formulation is only indicated for patients 2 to 49 years old and because its mechanism of action (i.e., live attenuated) is significantly different from those of the intramuscular influenza vaccines (i.e., inactivated or recombinant) [23]. The drug names and administrative codes (e.g., CPT codes) used to identify intramuscular influenza vaccinations are provided in Supplementary Table 1.
Outcome measurement
Incident AD was defined as two or more AD-related records (either an AD diagnosis code or a pharmacy claim for any of the four medications primarily indicated for AD) in a 12-month period. The date of AD onset was defined as the date of the first record in the 12-month period. The case-identification algorithm for incident AD required at least two AD-related records in order to reduce misclassification caused by clerical error.
The specific ICD codes used to define incident AD are provided in Supplementary Table 1. Although AD empirically accounts for nearly 80% of all dementia cases among persons 65 and older [1], studies of administrative datasets have found that the proportion of dementia cases with AD-specific diagnostic codes is far lower than expected and that nonspecific dementia codes (e.g., for unspecified or “senile” dementia) are the most common dementia-related diagnostic codes in these datasets [24–27]. For example, a study of the entire Medicare fee-for-service beneficiary population from 2011 to 2013 found that, among beneficiaries with≥1 ICD code for dementia, 46.1% had≥1 code for nonspecific dementia but no codes for a specific dementia subtype (e.g., AD), 29.0% had a code for nonspecific dementia and a code for AD, and only 4.5% had≥1 AD code and zero nonspecific dementia codes [27]. Therefore, we included the ICD codes for nonspecific dementias in the case-identification algorithm for incident AD.
Covariate measurement
For each covariate, the last measurement within the look-back period was used as the baseline value. Covariates included demographics, physical and psychiatric comorbidities, sustained use of medications potentially related to probability of influenza vaccination and/or incident AD (either directly as an effect of the medication or indirectly as an indicator of a relevant comorbidity), number of routine well visits during the look-back period, and total number of health care encounters during the look-back period (as a proxy for overall healthcare utilization rate); detailed variable definitions with relevant codes are provided in Supplementary Table 1. These specific covariates mirror those used in a recent study of influenza vaccination and dementia incidence in a US Veterans Affairs (VA) cohort [20]; use of similar covariates between that study and ours facilitated a comparison of findings.
Statistical methods
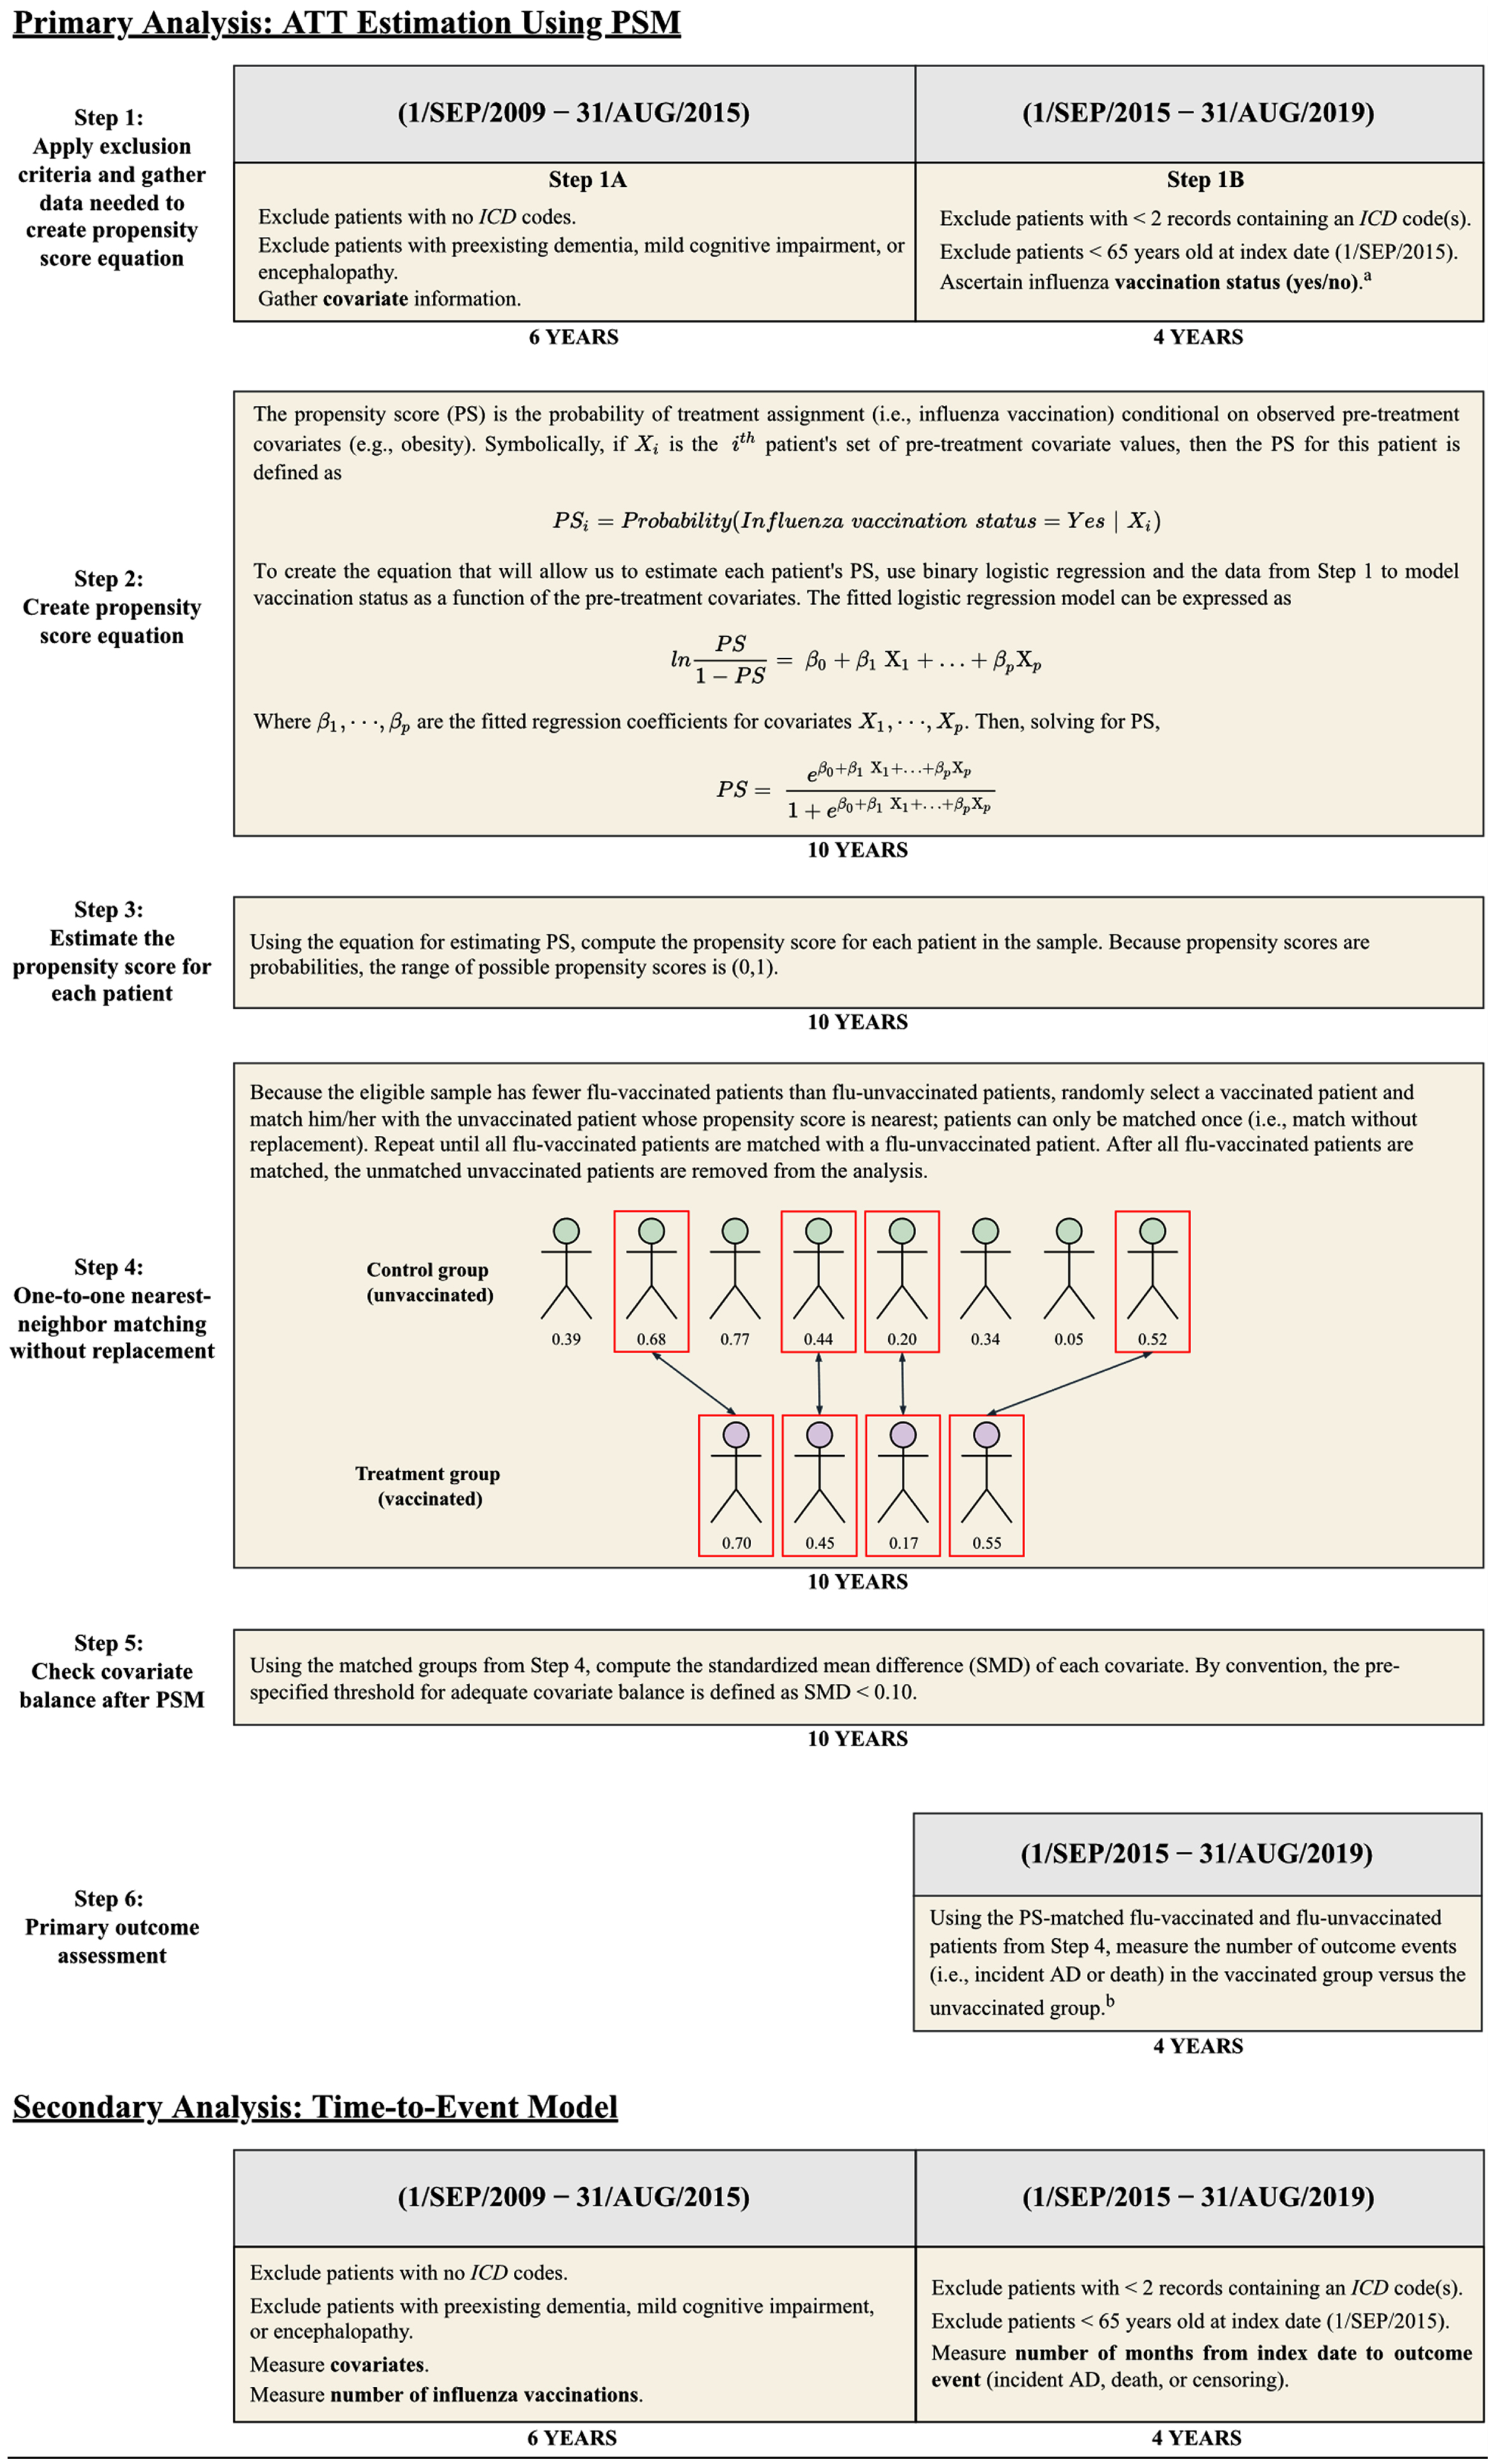
For the primary analysis, we estimated the average treatment effect in the treated (ATT) of flu vaccination on AD risk using propensity-score-matched cohorts. As a secondary analysis, we performed a time-to-event analysis using the unmatched sample. Table 1 and Fig. 2 provide an overview of the primary and secondary analyses. For each analysis, E-values for the point estimates and confidence intervals were computed to assess the magnitude of unmeasured confounding that would be necessary to fully explain the observed association between influenza vaccination and AD risk [28, 29]. Tests of statistical significance were two-tailed with α = 0.05. Python v3.8.8 (Python Software Foundation) with package ‘causalML’ v0.11.1 [30] was used for data processing and the primary analysis. R v3.5.1 (R Core Team, 2018) with package ‘cmprsk’ v2.2-7 [31] was used for the secondary analysis.
Fig. 2
Overview of Primary and Secondary Analysis Designs. AD, Alzheimer disease; ATT, average treatment effect in the treated; ICD, International Classification of Diseases; PSM, propensity score matching. aVaccinations were not considered if preceded by a diagnosis code or medication record for AD. bThe results of Step 6 are shown in Table 3.
Primary analysis: ATT estimation using propensity score matching
To balance the distribution of measured baseline covariates between patients receiving and not receiving influenza vaccinations during the follow-up period, we estimated propensity scores for influenza vaccination based on all baseline covariates (see Supplementary Table 1 for variable definitions) using a logistic regression model [28.] Patients without data for geographic region, sex, or race were excluded prior to estimation of propensity scores; the number of patients missing each of these variables is provided in Table 2. Via one-to-one greedy nearest-neighbor matching without replacement, the estimated propensity scores were used to match each flu-vaccinated patient with a patient who did not receive an influenza vaccine during the follow-up period. A caliper width of 0.2 standard deviations of the logit of the propensity score was used for matching [32]. To assess adequate balancing of baseline covariates, the standardized mean difference (SMD) was calculated for each covariate before and after propensity score matching (PSM). By convention, SMD < 0.10 was used to identify well-balanced covariates [28].
Using the propensity-matched cohorts, the association between receipt of influenza vaccination and incident AD was assessed via estimation of relative risk (RR) and absolute risk reduction (ARR), and 95% confidence intervals were constructed using methods that account for the pairwise dependence of propensity-matched samples [33, 34].
Table 2
Baseline Characteristics of Patients With and Without Influenza Vaccination During the Follow-up Period, Before and After PSM
| Panel 1: before propensity score matching | Panel 2: after propensity score matching | |||||||||
| No flu vaccinations during follow-up (n = 1,170,868) | ≥1 flu vaccinations during follow-up (n = 1,185,611) | SMD | No flu vaccinations during follow-up (n = 935,887) | ≥1 flu vaccinations during follow-up (n = 935,887) | SMD | |||||
| Age in y, mean (SD) | 73.5 (6.3) | 73.6 (6.0) | –0.010 | 73.7 (6.3) | 73.7 (6.0) | –0.005 | ||||
| Sex | ||||||||||
| Unknown | 155 | 0.0% | 42 | 0.0% | 0.011 | NA | NA | NA | NA | NA |
| Female | 654,908 | 55.9% | 685,979 | 57.9% | –0.039 | 533,387 | 57.0% | 531,644 | 56.8% | 0.004 |
| Male | 515,805 | 44.1% | 499,590 | 42.1% | 0.039 | 402,500 | 43.0% | 404,243 | 43.2% | –0.004 |
| Race | ||||||||||
| Unknown | 104,390 | 8.9% | 108,367 | 9.1% | –0.008 | NA | NA | NA | NA | NA |
| Asian | 48,038 | 4.1% | 41,722 | 3.5% | 0.031 | 33,448 | 3.6% | 41,453 | 4.4% | –0.044 |
| Black | 112,278 | 9.6% | 98,902 | 8.3% | 0.044 | 93,670 | 10.0% | 86,405 | 9.2% | 0.026 |
| Hispanic | 132,946 | 11.4% | 88,556 | 7.5% | 0.133 | 100,921 | 10.8% | 90,949 | 9.7% | 0.035 |
| White | 773,216 | 66.0% | 848,064 | 71.5% | –0.119 | 707,848 | 75.6% | 717,080 | 76.6% | –0.023 |
| Geographic region | ||||||||||
| Unknown | 1,280 | 0.1% | 654 | 0.1% | 0.018 | NA | NA | NA | NA | NA |
| Northeast | 167,514 | 14.3% | 161,685 | 13.6% | 0.019 | 135,590 | 14.5% | 130,497 | 13.9% | 0.016 |
| North central | 274,550 | 23.5% | 278,747 | 23.5% | –0.002 | 232,144 | 24.8% | 222,573 | 23.8% | 0.024 |
| South | 404,059 | 34.5% | 462,133 | 39.0% | –0.093 | 328,614 | 35.1% | 368,816 | 39.4% | –0.089 |
| West | 323,465 | 27.6% | 282,392 | 23.8% | 0.065 | 239,539 | 25.6% | 214,001 | 22.9% | 0.064 |
| No. of healthcare visits during look-backa, mean (SD) | 46.5 (57.0) | 47.0 (48.9) | –0.010 | 47.7 (55.4) | 47.7 (49.8) | –0.001 | ||||
| No. of routine “well visit” examinations, mean (SD) | 1.5 (2.2) | 1.7 (2.1) | –0.092 | 1.6 (2.2) | 1.6 (2.1) | –0.004 | ||||
| Comorbidities | ||||||||||
| Asthma | 117,412 | 10.0% | 130,876 | 11.0% | –0.033 | 98,715 | 10.6% | 99,272 | 10.6% | –0.002 |
| Atrial fibrillation or flutter | 131,648 | 11.2% | 128,386 | 11.4% | 0.013 | 104,695 | 11.2% | 104,673 | 11.2% | 0.000 |
| B12 deficiency | 65,802 | 5.6% | 71,077 | 6.0% | –0.016 | 55,246 | 5.9% | 55,266 | 5.9% | –0.001 |
| Congestive heart failure | 130,923 | 11.2% | 104,514 | 8.8% | 0.079 | 93,664 | 10.0% | 93,861 | 10.0% | –0.001 |
| COPD | 188,080 | 16.1% | 176,394 | 14.9% | 0.033 | 146,477 | 15.7% | 146,107 | 15.6% | 0.001 |
| Hyperlipidemia | 851,922 | 72.8% | 936,251 | 79.0% | –0.146 | 719,735 | 76.9% | 718,331 | 76.8% | 0.000 |
| Hypertension | 855,740 | 73.1% | 893,509 | 75.4% | –0.052 | 702,418 | 75.1% | 700,488 | 74.9% | 0.005 |
| Ischemic heart disease | 290,796 | 24.8% | 285,539 | 24.1% | 0.018 | 233,308 | 24.9% | 233,304 | 24.9% | –0.001 |
| Obesity | 210,346 | 18.0% | 215,614 | 17.6% | 0.011 | 167,640 | 17.9% | 167,349 | 17.9% | 0.001 |
| Traumatic brain injury | 9,100 | 0.8% | 8,563 | 0.7% | 0.006 | 7,133 | 0.8% | 7,139 | 0.8% | 0.000 |
| Type II diabetes | 333,821 | 28.5% | 327,184 | 27.6% | 0.021 | 265,516 | 28.4% | 265,227 | 28.3% | 0.007 |
| Stroke | 60,353 | 5.2% | 49,507 | 4.2% | 0.046 | 43,867 | 4.7% | 43,838 | 4.7% | 0.000 |
| Alcohol use disorder | 21,939 | 1.9% | 16,519 | 1.4% | 0.041 | 14,400 | 1.5% | 14,273 | 1.5% | 0.001 |
| Anxiety disorderb | 201,814 | 17.2% | 203,499 | 17.2% | 0.002 | 163,547 | 17.5% | 163,481 | 17.5% | 0.000 |
| Depression | 141,211 | 12.1% | 139,616 | 11.8% | 0.009 | 113,280 | 12.1% | 113,073 | 12.1% | 0.001 |
| Substance use disorderc | 19,358 | 1.7% | 13,754 | 1.2% | 0.042 | 12,343 | 1.3% | 12,247 | 1.3% | 0.001 |
| Tobacco use | 203,758 | 0.8% | 202,909 | 17.1% | 0.008 | 164,059 | 17.5% | 164,106 | 17.5% | 0.000 |
| Medications (sustained used) | ||||||||||
| Anticholinergics | 70,077 | 6.0% | 75,400 | 6.4% | –0.016 | 58,009 | 6.2% | 60,333 | 6.5% | –0.010 |
| Antihypertensives | 37,597 | 3.2% | 32,355 | 2.7% | –0.080 | 28,149 | 3.0% | 27,923 | 3.0% | 0.001 |
| Antivirals | 30,715 | 2.6% | 34,875 | 2.9% | –0.019 | 26,078 | 2.8% | 26,243 | 2.8% | –0.001 |
| Glucocorticoids | 190,126 | 16.2% | 237,827 | 20.1% | –0.099 | 170,030 | 18.2% | 170,929 | 18.3% | –0.003 |
| Metformin | 148,573 | 12.7% | 159,701 | 13.5% | –0.023 | 123,363 | 13.2% | 123,219 | 13.2% | 0.005 |
| NSAIDs | 220,128 | 18.8% | 241,972 | 20.4% | –0.041 | 184,875 | 19.8% | 188,464 | 20.1% | –0.010 |
| Statins | 466,550 | 39.9% | 567,610 | 47.9% | –0.162 | 405,127 | 43.1% | 403,448 | 43.1% | 0.004 |
| Sulfonylureas | 91,881 | 7.9% | 87,800 | 7.4% | 0.017 | 72,776 | 7.8% | 72,947 | 7.8% | 0.003 |
Frequency and percentage (of the column sample size) are provided for categorical variables; mean and standard deviation are provided for continuous variables. Summary statistics for the “unknown” level of geographic region, race, and sex are absent from Panel 2 because patients lacking any of those variables were excluded prior to propensity-score matching. See eTable 1 for complete variable definitions. COPD, chronic obstructive pulmonary disease; NSAIDs, nonsteroidal anti-inflammatory drugs; SD, standard deviation; SMD, standardized mean difference. aNumber of outpatient or inpatient health care encounters during the look-back period. bComposite of post-traumatic stress disorder, panic disorder, anxiety disorder not otherwise specified, obsessive compulsive disorder, social phobia, and generalized anxiety disorder. cComposite of substance use disorders involving any of the following: opioids; cannabis; sedatives, hypnotics, or anxiolytics; cocaine; amphetamines or other stimulants; hallucinogens; inhalants; and/or other psychoactive substances, including polysubstance use. d“Sustained use” was defined as≥2 prescription claims in any 6-month period during the look-back period.
As a sensitivity analysis, another set of RR and ARR estimates was obtained after the ICD codes for nonspecific and “senile” dementias were removed from the case-detection algorithm; similarly, a third set of estimates was obtained after expanding the outcome of interest from AD to the broader category of AD and related dementias (ADRD) [35]. The specific ICD codes used for each sensitivity analysis are provided in Supplementary Table 1.
Furthermore, to examine whether the ATT of influenza vaccination on AD risk varied by length of follow-up or age at the start of follow-up, we performed three ad-hoc study designs with a look-back duration of 2 years (and therefore a follow-up duration of 8 years) and/or age≥75 years at the start of follow-up. The sample selection, PSM, and ATT estimation processes described above were repeated for each of these ad-hoc designs.
Secondary analysis: Time-to-event model
A competing-risk regression model was used to estimate the effect of the number of influenza vaccinations on the rate of incident AD during follow-up. In contrast to the primary analysis in which influenza vaccination was defined dichotomously (i.e., zero versus≥1 flu vaccinations during follow-up), the time-to-event model defined influenza vaccination as a discrete variable equal to the number of flu vaccinations received during the 6-year look-back period. Because treatment (i.e., influenza vaccination) and baseline covariates were both measured during the look-back period in the time-to-event model, use of propensity-matched groups was conceptually impermissible; therefore, the unmatched sample was used for this analysis.
In addition to the exclusion criteria described in the “Sample Selection” subsection, two other eligibility criteria were applied for the time-to-event analysis. Firstly, because influenza vaccination is indicated once per annual flu season, patients who received more than 6 influenza vaccines during the 6-year look-back period were excluded; this exclusion criterion is consistent with a recent study of flu vaccination and dementia risk in a large VA cohort [20]. Secondly, following a per-protocol approach, patients were excluded if they had zero influenza vaccinations during the look-back period but≥1 influenza vaccinations during the follow-up period.
The competing-risks analysis used a Cox-type proportional subdistribution hazard model, with time–to–incident-AD diagnosis as the outcome of interest and death as the competing-risk event. Because the objective was to assess the effect of the number of flu vaccinations on the cumulative incidence function (CIF) for AD, we focused on the subdistribution hazard instead of the cause-specific hazard [36]. The model included the covariates listed in Table 2 except for geographic region, number of “well visits” during look-back, and overall number of healthcare visits during look-back, which were excluded due to a lack of a priori association with AD risk. Collinearity among the included independent variables was assessed through examination of the pairwise correlation matrix (Supplementary Figure 1), which revealed 3 sets of highly correlated covariates: hyperlipidemia and statins; type 2 diabetes, metformin, and sulfonylurea; and anxiety and depression. Therefore, to reduce collinearity, a binary indicator variable was created for each of these sets. Each indicator variable was coded “yes” if any of its constituent variables was coded “yes.”
The proportional-hazards assumption was as-sessed for each covariate via examination of the scaled Schoenfeld residuals over time. For any covariate demonstrating a time-dependent pattern on the Schoenfeld residuals plot, a time-covariate interaction term was added to the regression model. Estimates of the subdistribution hazard ratio (sHR) and 95% CI for the effect of influenza vaccination on time-to-AD diagnosis were computed from the final model.
Ethics approval
The Committee for the Protection of Human Subjects (CPHS), the IRB of UTHealth, reviewed and deemed this study non-human subjects research because it used deidentified retrospective claims data. CPHS therefore approved the study with a HIPAA waiver and waiver of informed consent.
Data availability
The authors cannot make data and study materials available to other investigators due to licensing restriction; however, interested parties can license the CDM by contacting Optum.
RESULTS
Baseline characteristics
1,185,611 flu-vaccinated and 1,170,868 flu-un-vaccinated patients were identified after application of the eligibility criteria in Fig. 1. Summary statistics for the baseline characteristics of flu-vaccinated and flu-unvaccinated patients before and after PSM are shown in Table 2. After matching, SMDs for all covariates were < 0.10, thereby satisfying the prespecified criterion for adequate balancing between the treated and untreated cohorts.
ATT estimation using PSM
After PSM, the vaccinated and unvaccinated cohorts each consisted of 935,887 patients. The median follow-up time prior to incident AD, death, or censoring in the propensity-matched sample was 46 (IQR, 29–48) months. Table 3 shows the frequency of incident AD among the propensity-score-matched flu-vaccinated and flu-unvaccinated cohorts. The ARR over the 4-year follow-up was 0.034 (95% CI, 0.033–0.035), corresponding to a number needed to treat of 29.4 patients. The RR was 0.60 (95% CI, 0.59–0.61). E-values for the point estimate and CI were 2.71 and 2.67, respectively.
Table 3
Frequency of Incident AD Among Propensity-Score-Matched Vaccinated and Unvaccinated Patients
| Incident AD (+) | Incident AD (+) | |
| ≥1 flu vaccinations during follow-up | 47,889 | 887,998 |
| No flu vaccinations during follow-up | 79,630 | 856,257 |
For the sensitivity analyses, exclusion of the nonspecific and “senile” dementia codes from the case-detection algorithm for incident AD resulted in an ARR of 0.016 (95% CI, 0.015–0.017) and an RR of 0.65 (95% CI, 0.64–0.66); expansion of the case-detection algorithm to include all ADRD diagnostic codes resulted in an ARR of 0.033 (95% CI, 0.032–0.034) and RR of 0.60 (95% CI, 0.59–0.61). Results of the three ad-hoc ATT analysis designs (i.e., using a 2-year look-back duration and/or age≥75 at the start of follow-up) are shown in Supplementary Table 2.
Time-to-event model
Supplementary Figure 2 shows the frequency distribution of influenza vaccinations during the look-back period in the unmatched sample used for the time-to-event analysis. The median follow-up time in the unmatched sample was 46 (IQR, 25–48) months. Upon initial construction of the regression model, examination of the Schoenfeld residual plots revealed that 20 variables violated the proportional-hazards assumption (see Supplementary Table 3); therefore, time-covariate interaction terms for these variables were added to the regression model.
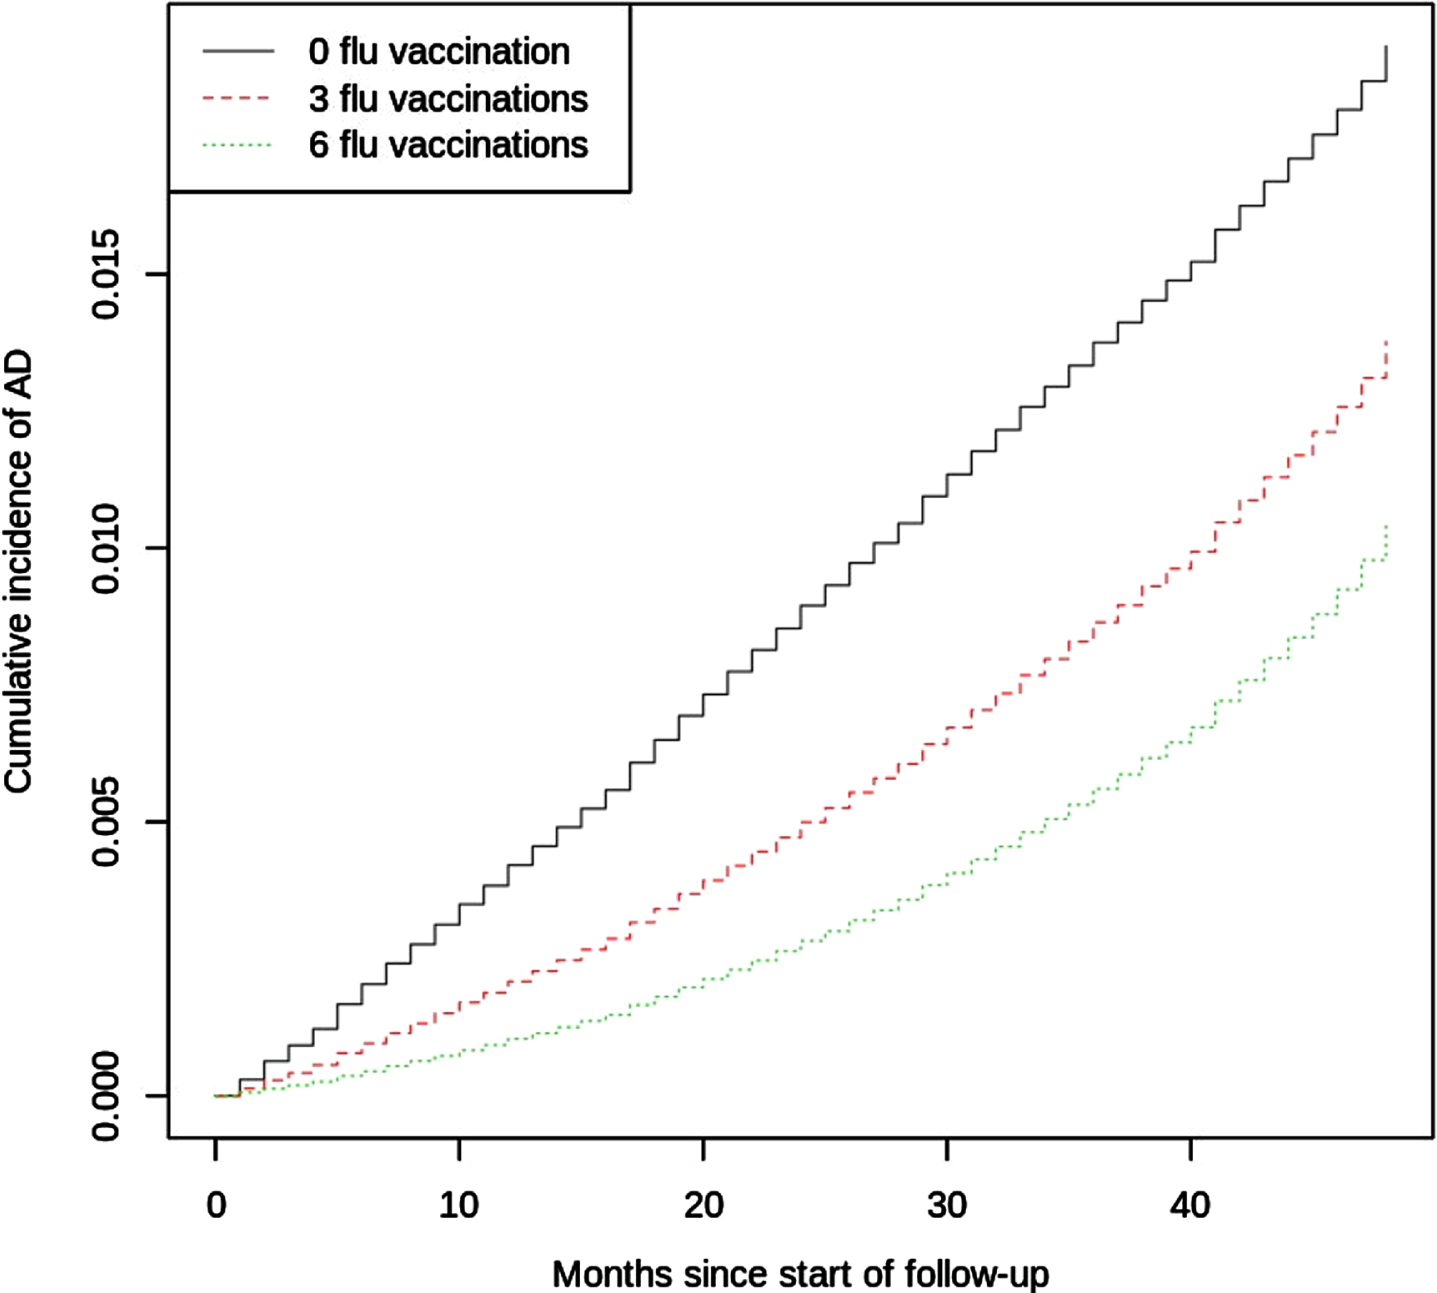
The CIF curve of AD by number of influenza vaccinations is shown in Fig. 3. The regression coefficient, sHR, and 95% CI for each covariate and its time-covariate interaction term (when applicable) are shown in Supplementary Table 3. The sHR associated with the number of influenza vaccinations was 0.76 (95% CI, 0.74–0.79); E-values for the point estimate and CI were 1.96 and 1.86, respectively. Because the sHR for the time–influenza-vaccination interaction term was 1.006 (95% CI, 1.003–1.009), the time-adjusted sHR for influenza vaccinations is given by sHR(t) = exp(–0.275 + 0.006*t), where t is the number of months since the index date. This equation illustrates that the effect of influenza vaccinations on AD incidence diminished (i.e., became less protective) during the 4-year follow-up period.
Fig. 3
Estimated CIF Curve of Incident AD by Number of Influenza Vaccinations. Quantitative results from the regression model are presented in Supplementary Table 3.
DISCUSSION
This retrospective cohort study using the Optum CDM revealed that in adults age≥65 without dementia, MCI, or encephalopathy, patients who received at least one influenza vaccine were 40% less likely than their non-vaccinated peers to develop incident AD during the 4-year follow-up period. To account for potential bias related to confounding by indication or the healthy-vaccinee effect [37], this study used baseline demographic, medication, and comorbidity data to match patients according to propensity for influenza vaccination. Similar to the ATT analysis, the time-to-event analysis using the unmatched sample found that prior influenza vaccination was negatively associated with AD risk. E-values were computed for both the primary and secondary analyses to estimate robustness of these findings to unmeasured confounders. For example, the E-value of 2.71 for the primary analysis’s point estimate indicates that, in order to render the results statistically insignificant, an unmeasured confounder would need to have a relative risk association of≥2.71 with both influenza vaccination and incident AD while controlling for the covariates used in this study.
Hypothesized mechanism(s)
The mechanisms underlying the apparent protective effects of influenza vaccination on AD risk merit further investigation. These mechanisms—and those underlying the effects of adulthood vaccinations on all-cause dementia risk in general—can be grouped into at least three broad, non-exclusive categories: 1) influenza-specific mechanisms, including mitigation of damage secondary to influenza infection and/or epitopic similarity between influenza proteins and AD pathology; 2) non–influenza-specific training of the innate immune system; and 3) non–influenza-specific changes in adaptive immunity via lymphocyte-mediated cross-reactivity.
The apparent effect of influenza vaccination on AD risk may be secondary to influenza-specific immunity conferred by the vaccine. CNS injury during influenza infection can occur from direct viral invasion of nervous tissues or as collateral damage from the systemic immune response to peripheral infection [38, 39]. Neurologic complications associated with influenza infection can occur in the absence of overt CNS inflammation (e.g., lack of pleocytosis or detectable virus in cerebrospinal fluid) and comprise a range of manifestations including headache, encephalopathy, demyelination, and long-term neuropsychiatric sequelae such as depression and persistent cognitive impairment [38, 39]. Complications are especially concerning in patients 65 or older, who are at a significantly higher risk for severe infections. During the 2018–2019 flu season, adults age≥65 constituted 57% of influenza-related hospitalizations and 75% of influenza-related deaths [40]. An association between flu infection and AD risk is supported by mouse studies demonstrating that peripheral infection of wild-type mice with non-neurotropic influenza strains induces excessive microglial activation and subsequent alteration of neuronal morphology, particularly in the hippocampus, that persists after infection resolution [38, 41]; in APP/PS1 transgenic mice, peripheral influenza infection also induces persistent elevations of amyloid-β (Aβ) plaque burden [42]. However, in contrast to these mouse studies, a case-control study of 38,926 older adults found no association between the number or severity of past influenza infections and AD risk [43]. Another influenza-specific mechanism potentially underlying the effects of influenza vaccination on AD risk is epitopic similarity between an influenza protein(s) and AD pathology. This hypothesis is supported by significant structural and peptide-sequence similarities between the fusion domain of influenza hemagglutinin and the 42-residue monomeric Aβ peptide [44].
Long-term, non–influenza-specific alteration of the innate immune system presents another class of mechanisms potentially underlying influenza vaccination’s apparent effect on AD risk. Several vaccines, including the influenza vaccine, are associated with non-specific protective effects via long-term reprogramming of innate immune cells, a process termed “trained immunity” [45, 46]. Manifestations of vaccine-induced non–antigen-specific trained immunity include alterations of cytokine levels in the periphery and CNS as well as upregulation of pattern recognition receptors (PRRs) among an array of immunologic cell lineages, particularly natural killer cells and monocytes [45–47]. The molecular mechanisms driving the changes in cytokine signaling and PRR expression following vaccination include “epigenetic reprogramming” [47] of immune cells through processes such as DNA methylation, histone modification, or post-transcriptional miRNA targeting of regulatory sequences related to cytokine or PRR expression [45, 46, 48]. Several studies have shown that the innate-related changes in peripheral cytokines associated with vaccination can directly affect microglial activity, including the efficiency of microglia in clearing Aβ aggregates [3, 49, 50]. Another mechanism related to innate immunity that potentially underlies the association between flu vaccination and AD is alteration of the sustained low-grade systemic elevation of proinflammatory cytokines referred to as “inflammaging” that is commonly observed among older adults [51]. Regardless of the exact mechanism, the relevance of innate immune training is supported by the growing literature that other adulthood vaccines (including those for tetanus and diphtheria, zoster, and tuberculosis) are associated with reduced dementia risk [6, 11–21]. Of particular interest are studies from the US and Israel that found a lower risk of AD in patients with bladder cancer who had received intravesical immunotherapy with BCG, a vaccine for tuberculosis, compared to those who had not undergone BCG immunotherapy [14, 15]. Because the prevalence of tuberculosis is low in the US [52], the association of BCG exposure with lowered dementia risk argues against an avoidance-of-infection mechanism and instead supports a non–microbe-specific mechanism such as trained immunity.
Vaccine-induced changes in the adaptive immune system may also have a role in the flu vaccine’s apparent effect on AD risk through mechanisms such as vaccine-induced heterologous adaptive immunity, a phenomenon associated with a variety of vaccines [47, 53]. Moreover, studies of senescent T cells have found an apparent age-related convergence between the adaptive and innate immune systems. While immune senescence has known implications for the effectiveness of vaccines in conferring immunity to infection among older adults [54, 55], the interaction between immune senescence and the non–microbe-specific effects of vaccines merits further investigation.
Strengths and limitations
Strengths of this study include the large sample size afforded by the CDM; even after PSM, the matched sample had 935,887 pairs. In comparison, a recent meta-analysis of the association between flu vaccination and dementia had an aggregate sample size of 292,157 [21]. Secondly, the CDM is more representative of US insured older adults than datasets previously used to investigate influenza vaccinations and dementia risk. Third, although the CDM captures influenza vaccinations billed through insurance regardless of whether administration occurs in a clinic or a pharmacy, vaccinations not billed through insurance (e.g., due to out-of-pocket payment or receipt from a free vaccination source such as employer-sponsored vaccination programs) would not be captured in this dataset. While the frequency of out-of-pocket payments for influenza vaccinations is presumably low in the CDM given that medical and pharmacy coverage are required for inclusion in this dataset, the proportion of patients in the CDM receiving influenza vaccinations from free sources is unknown. Finally, the temporal separation of exposure and outcome via use of distinct multiyear look-back and follow-up periods, in tandem with the reduction of treatment-selection bias provided by PSM, allows for cautious inferences regarding causal treatment effects [28].
There are several limitations that must be considered. First, the CDM includes only patients with both medical and prescription coverage. Although the database includes patients with private insurance or Medicare Advantage with Part D, it lacks patients without medical or prescription coverage and patients with traditional Medicare plans, thereby limiting the generalizability of these findings to the entire 65-and-older US population.
Second, the CDM is a retrospective database of routinely collected health data. Because the relationship between influenza vaccination and AD was not the main purpose of this data, there is risk of outcome misclassification (e.g., due to underdiagnosis or clerical error). This study attempted to reduce outcome misclassification due to clerical errors by requiring that incident AD cases have≥2 AD-related records and that control patients have zero AD-related records. Third, this study counted cases of incident “senile” or unspecified dementia as incident AD; although 60–80% of these patients empirically have AD, the actual percentage in the CDM is unknown.
Fourth, we chose not to include influenza infections in our analyses because of concerns surrounding influenza infection misclassification in retrospective studies of administrative data [56]. Similar to the authors of a recent study investigating the flu vaccine’s association with dementia risk in a VA cohort [20], we concluded that the potential bias from frequent misclassification of infection status outweighed the potential benefits of including this factor in the analysis. Fifth, it is possible that cognitive decline could prompt patients to seek medical attention more often, thereby increasing the probability that these patients received flu vaccinations; however, we attempted to minimize the possibility of such reverse causality by excluding patients with MCI during the look-back period.
Finally, although PSM was used to control for confounding by measured covariates, unobserved confounders remain an important consideration in any observational study, especially for claims data that was not generated for this analysis. Factors that are known to be associated with both likelihood of influenza vaccination and AD risk but that were not examined in this study include social factors such as social support and level of education [2, 57]. Access to health care may partially underlie the association of these social factors with AD risk and rate of influenza vaccination; however, because the CDM only includes patients with both medical and pharmaceutical coverage, confounding mediated by access to health care is less likely to be an issue in this study. Other potentially important factors that were not included are non-influenzal adulthood vaccinations such as those for herpes zoster or tetanus and diphtheria. The rate of influenza vaccination among adults is likely correlated with the rates of other vaccinations. Because studies have found an association between these other adult vaccinations and dementia of any cause [6, 11–17], it is possible that the current study’s findings regarding influenza vaccination and AD risk are at least partially confounded by one of the other adulthood vaccination(s). However, the other adulthood vaccines are not as frequently indicated as the influenza vaccine, and hence it seems unlikely that they contributed significantly here. Nonetheless, to provide an estimate of robustness to unmeasured confounders, this study included E-values for point estimates and confidence intervals.
Next steps
Several lines of future investigation are warranted. A follow-up study using a prospective cohort design would provide more robust reduction of confounding. Studies with longer follow-up periods are particularly desirable given that AD pathology begins decades before symptom onset [1]. Animal studies will be crucial in elucidating the relative contributions of the aforementioned mechanisms in the association between flu vaccination and AD risk. Moreover, animal studies can help to address whether the association between vaccination and AD risk is secondary to changes in AD-specific pathology, modulation of non–AD–specific inflammatory processes such as inflammaging, or both. Additionally, given mounting evidence that training of the innate immune system can alter neurodegeneration [3, 45, 47, 49, 55], future studies should explore whether vaccine adjuvants moderate the association between flu vaccination and AD risk. Similarly, emerging evidence suggests that the gut microbiome influences vaccine efficacy [58, 59]; studies should therefore investigate whether microbiota profiles modify the association between influenza vaccination and AD risk. Future investigations should also explore whether flu vaccination affects the rates of MCI-to-AD conversion or of clinical and/or pathological progression in patients with symptomatic AD.
Concluding remarks
This study found that, through an uncertain mechanism, influenza vaccination was associated with a 40% decrease in the 4-year risk of developing AD in patients 65 years or older. Although this study used a large sample, the limited follow-up duration and retrospective cohort design prevent strong conclusions regarding causation. It will be critical for future investigations to clarify which mechanisms underlie the apparent effect of flu vaccination on AD risk, whether age at vaccination moderates the vaccine’s association with AD risk, and whether influenza vaccination also affects rate of progression in patients with MCI or AD.
ACKNOWLEDGMENTS
Xiaoqian Jiang is funded by Christopher Sarofim Family Professorship, the CPRIT RR180012 award, UT Stars award, and NIH grants R01GM114612 and U01TR002062. Paul E. Schulz is funded by the McCord Family Professorship in Neurology, the Umphrey Family Professorship in Neurodegenerative Disorders, multiple NIH grants, and several foundations; serves as a consultant for Eli Lilly, Biogen, and Acadia Pharmaceuticals; and has contracts with multiple pharmaceutical companies to perform clinical trials.
The authors would also like to thank Kristofer T. Harris for his help with figure design.
Authors’ disclosures available online (https://www.j-alz.com/manuscript-disclosures/22-0361r1).
SUPPLEMENTARY MATERIAL
[1] The supplementary material is available in the electronic version of this article: https://dx.doi.org/10.3233/JAD-220361.
REFERENCES
[1] | ((2021) ) 2021 Alzheimer’s disease facts and figures. Alzheimers Dement 17: , 327–406. |
[2] | Livingston G , Huntley J , Sommerlad A , Ames D , Ballard C , Banerjee S , Brayne C , Burns A , Cohen-Mansfield J , Cooper C , Costafreda SG , Dias A , Fox N , Gitlin LN , Howard R , Kales HC , Kivimaki M , Larson EB , Ogunniyi A , Orgeta V , Ritchie K , Rockwood K , Sampson EL , Samus Q , Schneider LS , Selbaek G , Teri L , Mukadam N ((2020) ) Dementia prevention, intervention, and care: 2020 report of the Lancet Commission. Lancet 396: , 413–446. |
[3] | Webers A , Heneka MT , Gleeson PA ((2020) ) The role of innate immune responses and neuroinflammation in amyloid accumulation and progression of Alzheimer’s disease. Immunol Cell Biol 98: , 28–41. |
[4] | Muzambi R , Bhaskaran K , Smeeth L , Brayne C , Chaturvedi N , Warren-Gash C ((2021) ) Assessment of common infections and incident dementia using UK primary and secondary care data: A historical cohort study. Lancet Healthy Longev 2: , e426–e435. |
[5] | Bornand D , Toovey S , Jick SS , Meier CR ((2016) ) The risk of new onset depression in association with influenza –a population-based observational study. Brain Behav Immun 53: , 131–137. |
[6] | Scherrer JF , Salas J , Wiemken TL , Hoft DF , Jacobs C , Morley JE ((2021) ) Impact of herpes zoster vaccination on incident dementia: A retrospective study in two patient cohorts. PLoS One 16: , e0257405. |
[7] | Ou YN , Zhu JX , Hou XH , Shen XN , Xu W , Dong Q , Tan L , Yu JT ((2020) ) Associations of infectious agents with Alzheimer’s disease: A systematic review and meta-analysis. J Alzheimers Dis 75: , 299–309. |
[8] | Dominy SS , Lynch C , Ermini F , Benedyk M , Marczyk A , Konradi A , Nguyen M , Haditsch U , Raha D , Griffin C , Holsinger LJ , Arastu-Kapur S , Kaba S , Lee A , Ryder MI , Potempa B , Mydel P , Hellvard A , Adamowicz K , Hasturk H , Walker GD , Reynolds EC , Faull RLM , Curtis MA , Dragunow M , Potempa J ((2019) ) Porphyromonas gingivalis in Alzheimer’s disease brains: Evidence for disease causation and treatment with small-molecule inhibitors. Sci Adv 5: , eaau3333. |
[9] | Fink A , Doblhammer G , Tamguney G ((2021) ) Recurring gastrointestinal infections increase the risk of dementia. J Alzheimers Dis 84: , 797–806. |
[10] | Taquet M , Geddes JR , Husain M , Luciano S , Harrison PJ ((2021) ) 6-month neurological and psychiatric outcomes in 236 379 survivors of COVID-19: A retrospective cohort study using electronic health records. Lancet Psychiatry 8: , 416–427. |
[11] | Verreault R , Laurin D , Lindsay J , De Serres G ((2001) ) Past exposure to vaccines and subsequent risk of Alzheimer’s disease. CMAJ 165: , 1495–1498. |
[12] | Scherrer JF , Salas J , Wiemken TL , Jacobs C , Morley JE , Hoft DF ((2021) ) Lower risk for dementia following adult tetanus, diphtheria, and pertussis (Tdap) vaccination. J Gerontol A Biol Sci Med Sci 76: , 1436–1443. |
[13] | Wiemken TL , Salas J , Morley JE , Hoft DF , Jacobs C , Scherrer JF ((2021) ) Comparison of rates of dementia among older adult recipients of two, one, or no vaccinations. J Am Geriatr Soc 70: , 1157–1168. |
[14] | Klinger D , Hill BL , Barda N , Halperin E , Gofrit ON , Greenblatt CL , Rappoport N , Linial M , Bercovier H ((2021) ) Bladder cancer immunotherapy by BCG is associated with a significantly reduced risk of Alzheimer’s disease and Parkinson’s disease. Vaccines (Basel) 9: , 491. |
[15] | Kim JI , Zhu D , Barry E , Kovac E , Aboumohamed A , Agalliu I , Sankin A ((2021) ) Intravesical bacillus calmette-guérin treatment is inversely associated with the risk of developing Alzheimer disease or other dementia among patients with non–muscle-invasive bladder cancer. Clin Genitourin Cancer 19: , e409–e416. |
[16] | Lophatananon A , Mekli K , Cant R , Burns A , Dobson C , Itzhaki R , Muir K ((2021) ) Shingles, Zostavax vaccination and risk of developing dementia: A nested case–control study—results from the UK Biobank cohort. BMJ Open 11: , e045871. |
[17] | Lehrer S , Rheinstein PH ((2021) ) Herpes zoster vaccination reduces risk of dementia. In Vivo 35: , 3271–3275. |
[18] | Liu JC , Hsu YP , Kao PF , Hao WR , Liu SH , Lin CF , Sung LC , Wu SY ((2016) ) Influenza vaccination reduces dementia risk in chronic kidney disease patients: A population-based cohort study. Medicine (Baltimore) 95: , e2868. |
[19] | Luo CS , Chi CC , Fang YA , Liu JC , Lee KY ((2020) ) Influenza vaccination reduces dementia in patients with chronic obstructive pulmonary disease: A nationwide cohort study. J Investig Med 68: , 838–845. |
[20] | Wiemken TL , Salas J , Hoft DF , Jacobs C , Morley JE , Scherrer JF ((2021) ) Dementia risk following influenza vaccination in a large veteran cohort. Vaccine 39: , 5524–5531. |
[21] | Veronese N , Demurtas J , Smith L , Michel JP , Barbagallo M , Bolzetta F , Noale M , Maggi S ((2022) ) Influenza vaccination reduces dementia risk: A systematic review and meta-analysis. Ageing Res Rev 73: , 101534. |
[22] | Lee CY , Chang CC , Lin CS , Yeh CC , Hu CJ , Wu CZ , Chen TL , Liao CC ((2020) ) Risk of dementia in patients with periodontitis and related protective factors: A nationwide retrospective cohort study. J Clin Periodontol 47: , 1428–1436. |
[23] | FluMist Quadrivalent [Package Insert], U.S. Food and Drug Administration, https://www.fda.gov/media/83072/download, Accessed January 10, 2022. |
[24] | Albrecht JS , Hanna M , Randall RL , Kim D , Perfetto EM ((2019) ) An algorithm to characterize a dementia population by disease subtype. Alzheimer Dis Assoc Disord 33: , 118–123. |
[25] | Butler D , Kowall NW , Lawler E , Michael Gaziano J , Driver JA ((2012) ) Underuse of diagnostic codes for specific dementias in the Veterans Affairs New England healthcare system. J Am Geriatr Soc 60: , 910–915. |
[26] | Fujiyoshi A , Jacobs DR Jr , Alonso A , Luchsinger JA , Rapp SR , Duprez DA ((2017) ) Validity of death certificate and hospital discharge ICD codes for dementia diagnosis: The multi-ethnic study of atherosclerosis. Alzheimer Dis Assoc Disord 31: , 168–172. |
[27] | Goodman RA , Lochner KA , Thambisetty M , Wingo TS , Posner SF , Ling SM ((2017) ) Prevalence of dementia subtypes in United States Medicare fee-for-service beneficiaries, 2011-2013. Alzheimers Dement 13: , 28–37. |
[28] | Ross RD , Shi X , Caram MEV , Tsao PA , Lin P , Bohnert A , Zhang M , Mukherjee B ((2021) ) Veridical causal inference using propensity score methods for comparative effectiveness research with medical claims. Health Serv Outcomes Res Methodol 21: , 206–228. |
[29] | Haneuse S , VanderWeele TJ , Arterburn D ((2019) ) Using the E-value to assess the potential effect of unmeasured confounding in observational studies. JAMA 321: , 602–603. |
[30] | Chen H , Harinen T , Lee JY , Yung M , Zhao Z ((2020) ) CausalML: Python Package for Causal Machine Learning. |
[31] | Gray B ((2014) )cmprsk: Subdistribution Analysis of Competing Risks. Estimation, testing and regression modeling of subdistribution functions in competing risks, as described in Gray (1988), A class of K-sample tests for comparing the cumulative incidence of a competing risk, Ann. Stat. 1916:1141–1154, and Fine JP and Gray RJ (1999), A proportional hazards model for the subdistribution of a competing risk, JASA 94:1496–1509. URL: https://mran.microsoft.com/snapshot/2016-02-26/web/packages/cmprsk/index.html, Access Date: January 11, 2022 |
[32] | Austin PC ((2011) ) Optimal caliper widths for propensity-score matching when estimating differences in means and differences in proportions in observational studies. Pharm Stat 10: , 150–161. |
[33] | Austin PC ((2010) ) The performance of different propensity-score methods for estimating differences in proportions (risk differences or absolute risk reductions) in observational studies. Stat Med 29: , 2137–2148. |
[34] | Austin PC ((2009) ) Type I error rates, coverage of confidence intervals, and variance estimation in propensity-score matched analyses. Int J Biostat 5: , doi: 10.2202/1557-4679.1146 |
[35] | Motheral B , Brooks J , Clark MA , Crown WH , Davey P , Hutchins D , Martin BC , Stang P ((2003) ) A checklist for retrospective database studies–report of the ISPOR Task Force on Retrospective Databases. Value Health 6: , 90–97. |
[36] | Scrucca L , Santucci A , Aversa F ((2010) ) Regression modeling of competing risk using R: An in depth guide for clinicians. Bone Marrow Transplant 45: , 1388–1395. |
[37] | Remschmidt C , Wichmann O , Harder T ((2015) ) Frequency and impact of confounding by indication and healthy vaccinee bias in observational studies assessing influenza vaccine effectiveness: A systematic review. BMC Infect Dis 15: , 429. |
[38] | Bohmwald K , Galvez NMS , Rios M , Kalergis AM ((2018) ) Neurologic alterations due to respiratory virus infections. Front Cell Neurosci 12: , 386. |
[39] | Davis LE , Koster F , Cawthon A ((2014) ) Neurologic aspects of influenza viruses. Handb Clin Neurol 123: , 619–645. |
[40] | Estimated Flu-Related Illnesses, Medical visits, Hospitalizations, and Deaths in the United States —2018–2019 Flu Season,Center for Disease Control and Prevention, https://www.cdc.gov/flu/about/burden/2018-2019.html, Accessed February 7, 2022. |
[41] | Hosseini S , Wilk E , Michaelsen-Preusse K , Gerhauser I , Baumgartner W , Geffers R , Schughart K , Korte M ((2018) ) Long-term neuroinflammation induced by influenza A virus infection and the impact on hippocampal neuron morphology and function. J Neurosci 38: , 3060–3080. |
[42] | Hosseini S , Michaelsen-Preusse K , Schughart K , Korte M ((2021) ) Long-term consequence of non-neurotropic H3N2 influenza A Virus infection for the progression of Alzheimer’s disease symptoms. Front Cell Neurosci 15: , 643650. |
[43] | Imfeld P , Toovey S , Jick SS , Meier CR ((2016) ) Influenza infections and risk of Alzheimer’s disease. Brain Behav Immun 57: , 187–192. |
[44] | Crescenzi O , Tomaselli S , Guerrini R , Salvadori S , D’Ursi AM , Temussi PA , Picone D ((2002) ) Solution structure of the Alzheimer amyloid beta-peptide (1-42) in an apolar microenvironment. Similarity with a virus fusion domain. Eur J Biochem 269: , 5642–5648. |
[45] | Debisarun PA , Gossling KL , Bulut O , Kilic G , Zoodsma M , Liu Z , Oldenburg M , Ruchel N , Zhang B , Xu CJ , Struycken P , Koeken V , Dominguez-Andres J , Moorlag S , Taks E , Ostermann PN , Muller L , Schaal H , Adams O , Borkhardt A , Ten Oever J , van Crevel R , Li Y , Netea MG ((2021) ) Induction of trained immunity by influenza vaccination - impact on COVID-19. PLoS Pathog 17: , e1009928. |
[46] | Netea MG , Joosten LA , Latz E , Mills KH , Natoli G , Stunnenberg HG , O’Neill LA , Xavier RJ ((2016) ) Trained immunity: A program of innate immune memory in health and disease. Science 352: , aaf1098. |
[47] | Benn CS , Netea MG , Selin LK , Aaby P ((2013) ) A small jab - a big effect: Nonspecific immunomodulation by vaccines. Trends Immunol 34: , 431–439. |
[48] | Kleinnijenhuis J , Quintin J , Preijers F , Joosten LA , Ifrim DC , Saeed S , Jacobs C , van Loenhout J , de Jong D , Stunnenberg HG , Xavier RJ , van der Meer JW , van Crevel R , Netea MG ((2012) ) Bacille Calmette-Guerin induces NOD2-dependent nonspecific protection from reinfection via epigenetic reprogramming of monocytes. Proc Natl Acad Sci U S A 109: , 17537–17542. |
[49] | Yang Y , He Z , Xing Z , Zuo Z , Yuan L , Wu Y , Jiang M , Qi F , Yao Z ((2020) ) Influenza vaccination in early Alzheimer’s disease rescues amyloidosis and ameliorates cognitive deficits in APP/PS1 mice by inhibiting regulatory T cells. J Neuroinflammation 17: , 65. |
[50] | Tejera D , Mercan D , Sanchez-Caro JM , Hanan M , Greenberg D , Soreq H , Latz E , Golenbock D , Heneka MT ((2019) ) Systemic inflammation impairs microglial Aβ clearance through NLRP 3 inflammasome. EMBO J 38: , e101064. |
[51] | Franceschi C , Campisi J ((2014) ) Chronic inflammation (inflammaging) and its potential contribution to age-associated diseases. J Gerontol A Biol Sci Med Sci 69: (Suppl 1), S4–S9. |
[52] | Deutsch-Feldman M , Pratt RH , Price SF , Tsang CA , Self JL ((2021) ) Tuberculosis - United States, 2020. MMWR Morb Mortal Wkly Rep 70: , 409–414. |
[53] | Agrawal B ((2019) ) Heterologous immunity: Role in natural and vaccine-induced resistance to infections. Front Immunol 10: , 2631. |
[54] | Pereira B , Xu XN , Akbar AN ((2020) ) Targeting inflammation and immunosenescence to improve vaccine responses in the elderly. Front Immunol 11: , 583019. |
[55] | Pereira BI , Akbar AN ((2016) ) Convergence of innate and adaptive immunity during human aging. Front Immunol 7: , 445. |
[56] | Skowronski DM , De Serres G , Orenstein WA ((2019) ) Caution required in the use of administrative data and general laboratory submissions for influenza vaccine effectiveness estimation. Clin Infect Dis 69: , 1084–1085. |
[57] | Jain A , van Hoek AJ , Boccia D , Thomas SL ((2017) ) Lower vaccine uptake amongst older individuals living alone: A systematic review and meta-analysis of social determinants of vaccine uptake. Vaccine 35: , 2315–2328. |
[58] | Oh JZ , Ravindran R , Chassaing B , Carvalho FA , Maddur MS , Bower M , Hakimpour P , Gill KP , Nakaya HI , Yarovinsky F , Sartor RB , Gewirtz AT , Pulendran B ((2014) ) TLR5-mediated sensing of gut microbiota is necessary for antibody responses to seasonal influenza vaccination. Immunity 41: , 478–492. |
[59] | Lynn DJ , Benson SC , Lynn MA , Pulendran B ((2022) ) Modulation of immune responses to vaccination by the microbiota: Implications and potential mechanisms. Nat Rev Immunol 22: , 33–46. |

