The latest news and research from our partners. Subscribe to our mailing list for more.
April 20, 2023 – Before SVB Collapse, Nancy Davis Warned of “Short Fixed-Income Volatility Exposure” on CNBC

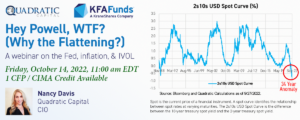
April 3, 2023 – Has the US Fed Put Inflation Aside to Focus on the Banking Crisis?
March 27, 2023 – CNBC: Nancy Davis on 25bps Bump and IVOL

March 21, 2023 – Investing Strategy: Banking, Financial Crisis, Rate Hikes, SVB, Recession, Crash
IVOL is a first-of-its-kind ETF which is designed to hedge the risk of an increase in fixed income volatility and/or an increase in inflation expectations. It also seeks to profit from a steepening of the yield curve, whether that occurs via rising long-term interest rates or falling short term interest rates, which are historically associated with large equity market declines.
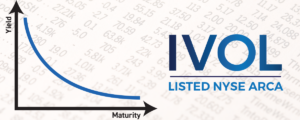
What makes IVOL unique is that it is long interest rate volatility via its access to the OTC fixed income options market. No other active or passive ETF has provided its investors access to this market before. This access is the key to IVOL’s many applications and allows it to potentially benefit from normalization of the yield curve while seeking to provide inflation-protection.
IVOL also provides inflation-protected income.
| 30-day SEC Yield | 1.58% |
30-day SEC Yield (Subsidized/Unsubsidized) is a standard yield calculation developed by the U.S. Securities and Exchange Commission (SEC) that allows for fairer comparisons of bond funds. It is based on the most recent 30-day period covered by the fund's filings with the SEC. It includes any TIPS principal adjustment from inflation as income. An exceptionally high 30-day SEC yield may be attributable to a rise in the inflation rate, which may not be repeated. Unsubsidized yield does not adjust for any fee waivers and/or expense reimbursements in effect.


The Growth of $10,000 chart reflects an initial investment of $10,000 on the day prior to the selected time period and assumes reinvestment of dividends and capital gains. For the growth of $10,000 chart since inception, the initial investment of $10,000 is instead made on the inception date of the Fund. Fund expenses, including management fees and other expenses were deducted. The growth of a $10,000 investment in the fund is hypothetical and for illustration purposes only. Fund performance data used in this chart is based on Fund NAV and represents past performance. Past performance does not guarantee future results.
| Rank | Name | % of Net Assets | Ticker | Identifier | Type | Shares Held | Market Value($) |
| 1 | SCHWAB U.S. TIPS ETF | 78.99% | SCHP | US8085248701 | Mutual Fund | 10,232,705 | 525,142,421 |
| 2 | Cash | 7.73% | – | – | Cash | 51,409,016 | 51,409,016 |
| 3 | USD CMS 2-10 04/08/2026 5 | 2.99% | – | – | Option | 500,000 | 19,892,219 |
| 4 | USD CMS 2-10 04/14/27 20 | 1.83% | – | – | Option | 300,000 | 12,169,084 |
| 5 | USD CMS 2-10 07/15/26 10 | 1.82% | – | – | Option | 300,000 | 12,095,410 |
| 6 | USD CMS 2-10 09/17/25 08 | 1.60% | – | – | Option | 350,000 | 10,654,889 |
| 7 | USD CMS 2-10 01/28/2026 3 | 1.44% | – | – | Option | 250,000 | 9,598,368 |
| 8 | USD CMS 2-10 12/09/26 28 | 1.07% | – | – | Option | 200,000 | 7,108,113 |
| 9 | USD CMS 2-10 11/13/24 30 | 0.93% | – | – | Option | 1,075,000 | 6,214,173 |
| 10 | USD CMS 2-10 03/13/25 27 | 0.84% | – | – | Option | 400,000 | 5,600,787 |
Holdings are subject to change.
Hyperlinks on this website are provided as a convenience and we disclaim any responsibility for information, services or products found on the websites linked hereto.
Click here to continueYou are now leaving KFAFunds.com. Hyperlinks on these websites are provided as a convenience and we disclaim any responsibility for information, services or products found on the websites linked hereto.