The College Readiness of ACT-tested
High School Graduates
Each year, ACT releases its annual snapshot of the ACT-tested graduating class. Of the more than 17 million students tested between 2014 and 2023, the class of 2023 – the COVID cohort – faced unique challenges due to the COVID-19 pandemic, affecting the ways in which they learned for their entire high school experience. Use the data visualization tool and resources below to examine students’ college and career readiness relative to the ACT College Readiness Standards and Benchmarks.
U.S. High School Class of 2023 Graduating Class Data
The graduating class of 2023’s entire high school experience was disrupted by the COVID-19 pandemic. This “COVID cohort” of students experienced significant disruption as they learned in online and hybrid environments throughout their high school experience, distinguishing them from prior graduating classes.
Each year, ACT releases graduating class data aimed at helping educators and district and state leaders make informed decisions to better serve students and families. This reliable historical data, along with ACT’s holistic approach, offers essential context in planning for future student cohorts.
Key Findings From This Year’s Data
- Roughly 1.4 million high school seniors took the ACT test, an increase over the 2022 graduating class.
- The average Composite score declined by 0.3 points, from 19.8 in 2022 to 19.5 in 2023.
- Between 2022 and 2023, average English scores declined 0.4 points (from 19.0 to 18.6), average mathematics scores declined 0.3 points (from 19.3 to 19.0), average reading scores declined 0.3 points (from 20.4 to 20.1), and average science scores declined 0.3 points (from 19.9 to 19.6).
- The percentage of students meeting all four benchmarks dropped 1.3 percentage points, from 22.1% of students in 2022 to 20.8% of students in 2023, whereas the percentage of students meeting no benchmarks increased by 1.7 percentage points, from 41.6% in 2022 to 43.3% in 2023.
- Participation in the ACT State and District Testing program continued to grow in the 2022-2023 academic year. For the 2023 graduating class, 60% of students tested at least once through the program. The ACT State and District Testing program provides students the opportunity to earn college-reportable ACT scores by taking the test in their own classrooms during regular school hours.
COVID Cohort
Learn more about what the COVID cohort told ACT about their high school experiences, including their views on how the pandemic influenced college and career choices, as well their perceptions of the unexpected challenges they faced in the midst of the pandemic. This research on the COVID cohort’s experiences during the pandemic provides critical insights into the unique challenges faced by the class of 2023. For instance, nearly 50% of these students indicated that the pandemic affected their future education or career plans and 85% reported that their academic performance suffered due to pandemic disruptions.

Data Visualization Tool
The data visualization tool contains data for ACT-tested high school graduates from 2014 through 2023 — more than 17 million students. The tool allows users to view measures of the college readiness of ACT-tested students summarized by state and graduating class. Regional and national summaries for each measure of college readiness are also provided for additional context.
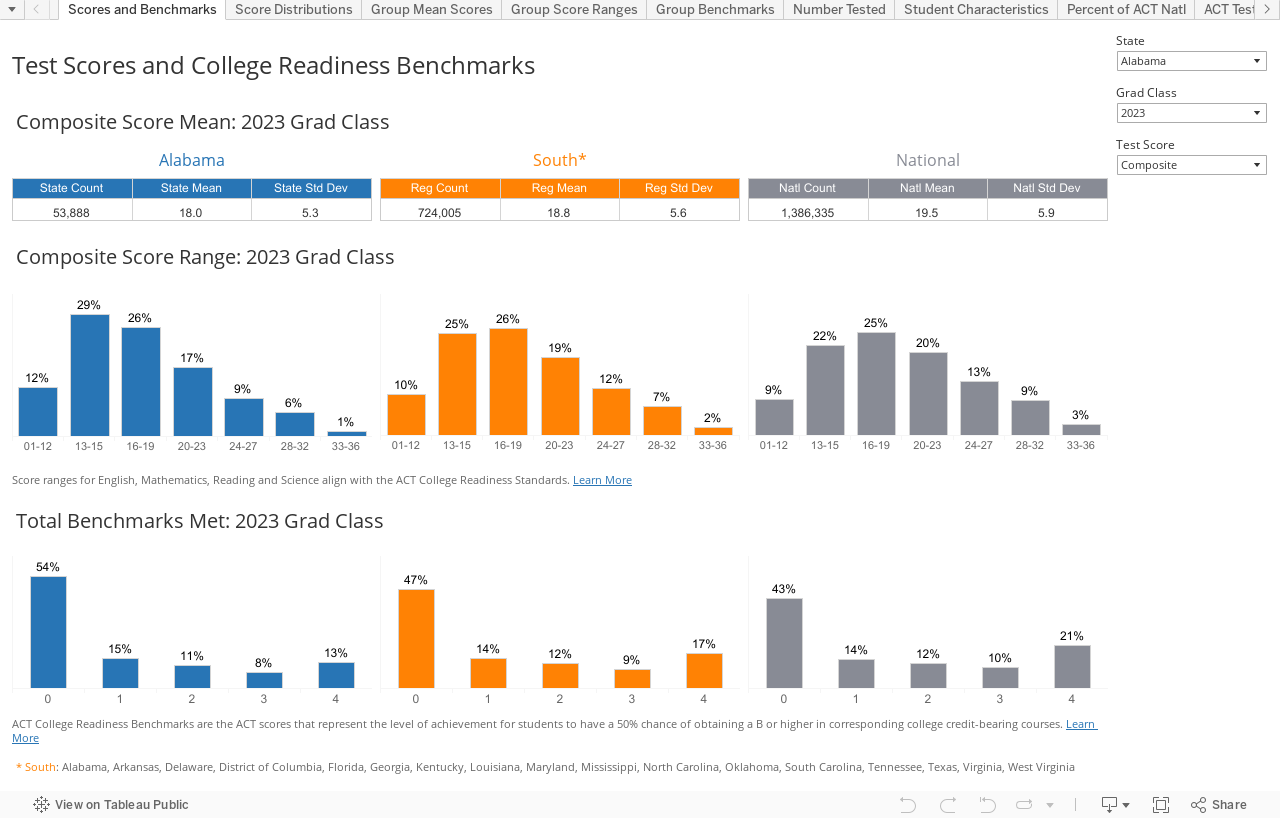
The interactive tool contains multiple views for exploring the data, using the tabs at the top. The ‘Scores and Benchmarks’ tab provides the mean and standard deviation for each ACT test score, the distribution of students across score ranges that align with the ACT College Readiness Standards, and the share of students meeting the respective ACT College Readiness Benchmark. The ‘Score Distributions’ tab provides the number and share of students scoring at each point on the score scale for each ACT test score. The ‘Group Mean Scores,’ ‘Group Score Ranges,’ and ‘Group Benchmarks’ tabs provide the same summary information found in the ‘Scores and Benchmarks’ tab by various student characteristics. Select a state, graduating class year, ACT test score and student characteristic (if applicable) to get started.
Interpretation of these summary measures of the college readiness of ACT-tested graduates by geographic entity and by graduation year will differ by the number, share, and composition of high school graduates taking the ACT. To assist users with interpretation, the tool also contains comparative information on the number, share, and characteristics of ACT-tested high school graduates over time. See the ‘Number Tested,’ ‘Student Characteristics,’ ‘Percent of ACT Natl,’ ‘ACT Test Rate,’ and ‘Mean Score by Test Rate’ tabs for this additional context.
For information about accessing and navigating this tool using a keyboard, please see the dashboard help page.
Note: ACT advises discretion when comparing dissimilar populations. Learn about nuances for interpreting the data.
Explore Additional Datasets
- Year-to-year average ACT Composite score changes.
- ACT Composite and ACT Superscore score distributions.
- Career pathway opportunities.
- Industry sector benchmarks and wages.
- Enrollment, retention, and transfer behaviors.