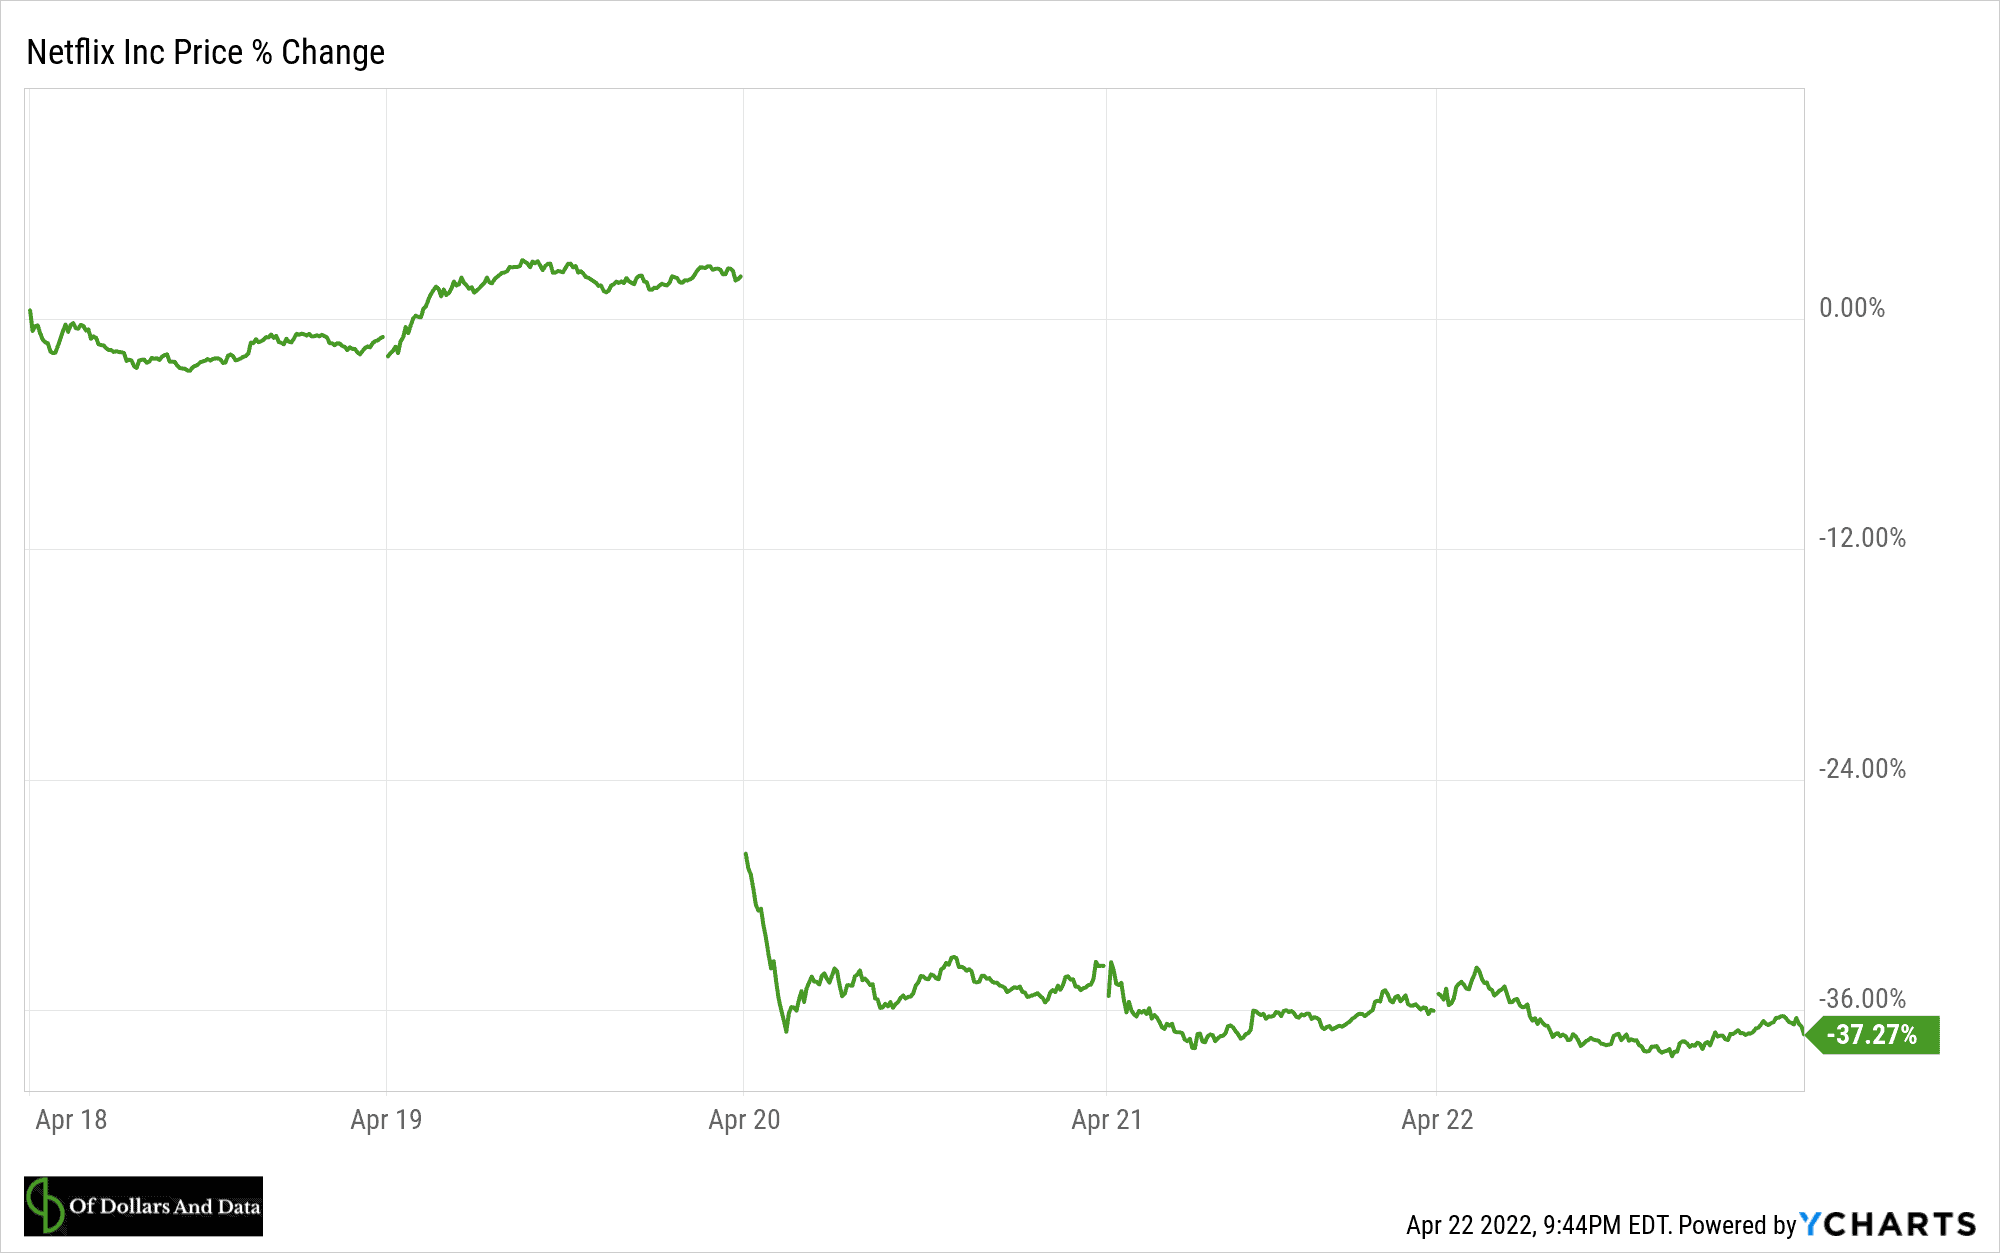
Last week Netflix’s share price fell 37% after reporting its first loss in subscribers in more than a decade:
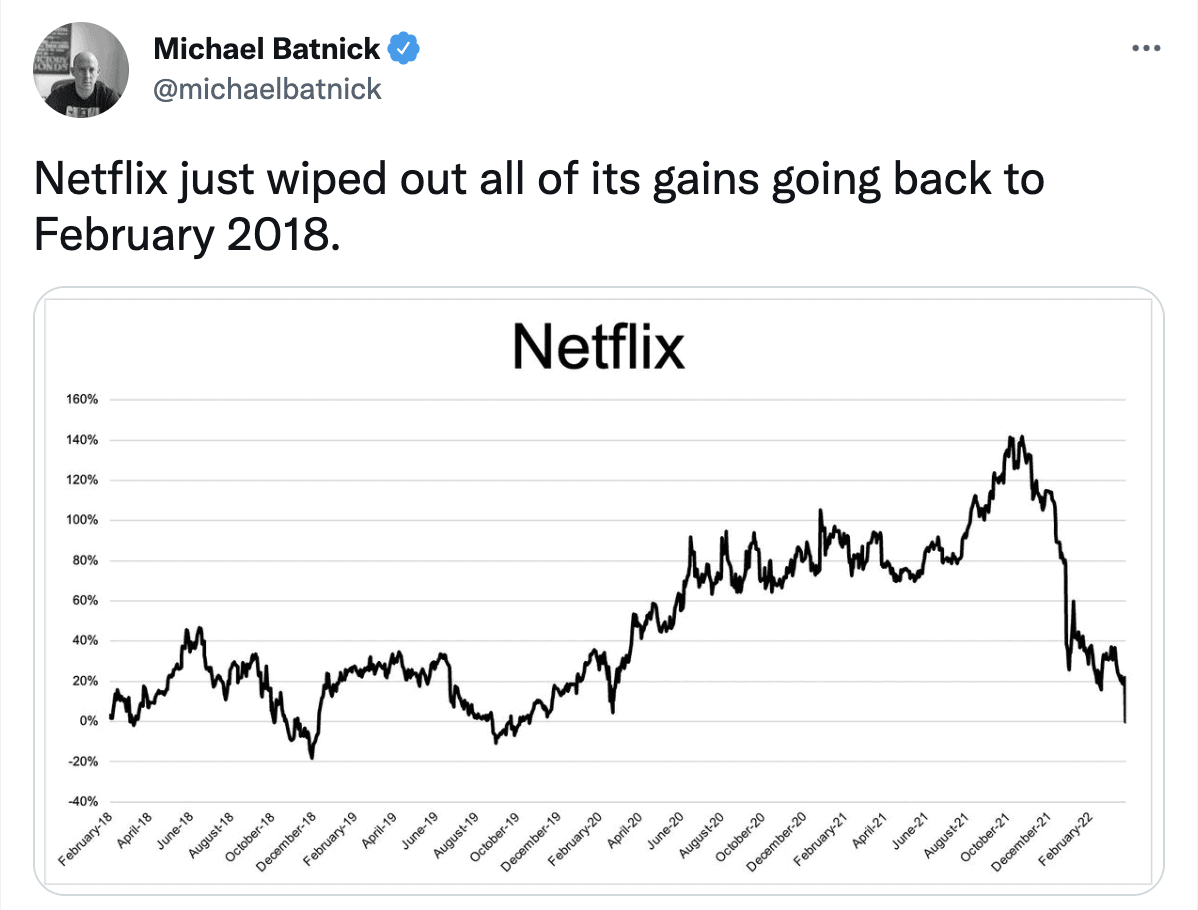
As Michael Batnick tweeted, this erased all of Netflix’s gains going back to February 2018:
With the stock nearly 40% off its highs, a few readers have asked me: is now the right time to buy?
Rather than discuss the merits and risks of Netflix in particular, I thought it would be more useful to turn this into a broader discussion of understanding why buying an individual stock while it’s down bad isn’t the same as buying an index that’s down bad.
As I’ve written about previously, when it comes to buying an asset or basket of assets following a large decline, you only need two pieces of information to determine whether you should buy: (1) the percentage gain needed to reach a new all-time high, and (2) an estimate for how long it will take to reach those new highs.
In Netflix’s case, the stocks is down about 39% today. Therefore, to reach new all-time highs, it will need to increase by roughly 64% [Note: 1/(1-0.39) – 1 = 1/.61 – 1 ~ 0.64]. So, if you think Netflix will take 1 year to reach these new highs, buying today means expecting a 64% return over the next year. If you think Netflix will take two years to reach new highs, buying today would get you a 28% annualized return. And so forth.
But here is where things break down between buying an individual company that has declined a lot and buying an index that has declined a lot—there is no guarantee that the individual company will ever recover. Netflix may never get back to its old highs. It may slowly decline into the graveyard of market history.
However, with an index fund like the S&P 500 this is unlikely to occur. Though there are exceptions to this rule (i.e. Japan since 1989, Greece since 2008, etc.), the probability of the S&P 500 never recovering from a crash is quite low.
Why? Because, unlike an individual company, the S&P 500 is always changing. To demonstrate this, consider Morgan Housel’s tweet showing the growth of $1 invested in U.S. stocks since 1871 (from the Shiller data):
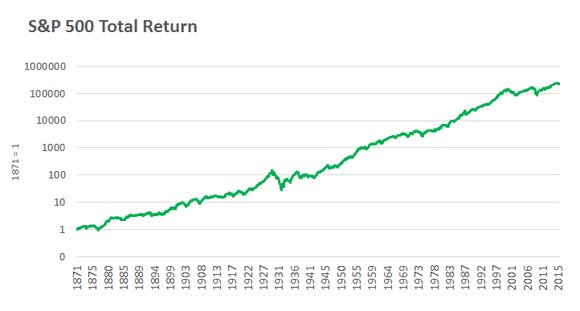
Looking at this you might think that you could have invested $1 in 1871 and just waited to get rich. Unfortunately, it’s not that simple. The companies that represented U.S. stocks in 1871 are very different from the companies that represented U.S. stocks in 1971 and in 2021. Though the line has gone up and to the right, what that line represents has changed dramatically over the decades.
How so? With economic and technological development over time, new companies have been brought into the index and old companies have been kicked out. As Geoffrey West stated in Scale: The Universal Laws of Life, Growth, and Death in Organisms, Cities, and Companies:
Of the 28,853 companies that traded on U.S. markets since 1950, 22,469 (78 percent) had died by 2009. Of these 45 percent were acquired by or merged with other companies, while only about 9 percent went bankrupt or were liquidated; 3 percent privatized, 0.5 percent underwent leveraged buyouts, 0.5 percent went through reverse acquisitions, and the remainder disappeared for “other reasons.”
West’s research shows that public companies in the U.S. are in a constant state of flux. Based on his analysis, roughly half of all public U.S. companies in existence today won’t be in existence a decade from now. They will either merge, be acquired, go bankrupt, or find some other way out of the market. Because of this, what we call “the market” changes from year to year.
More importantly, this rate of change might actually be accelerating. As the chart below (from this Innosight study) illustrates, the average longevity of a company in the S&P 500 index has been on a gradual decline over the past few decades:
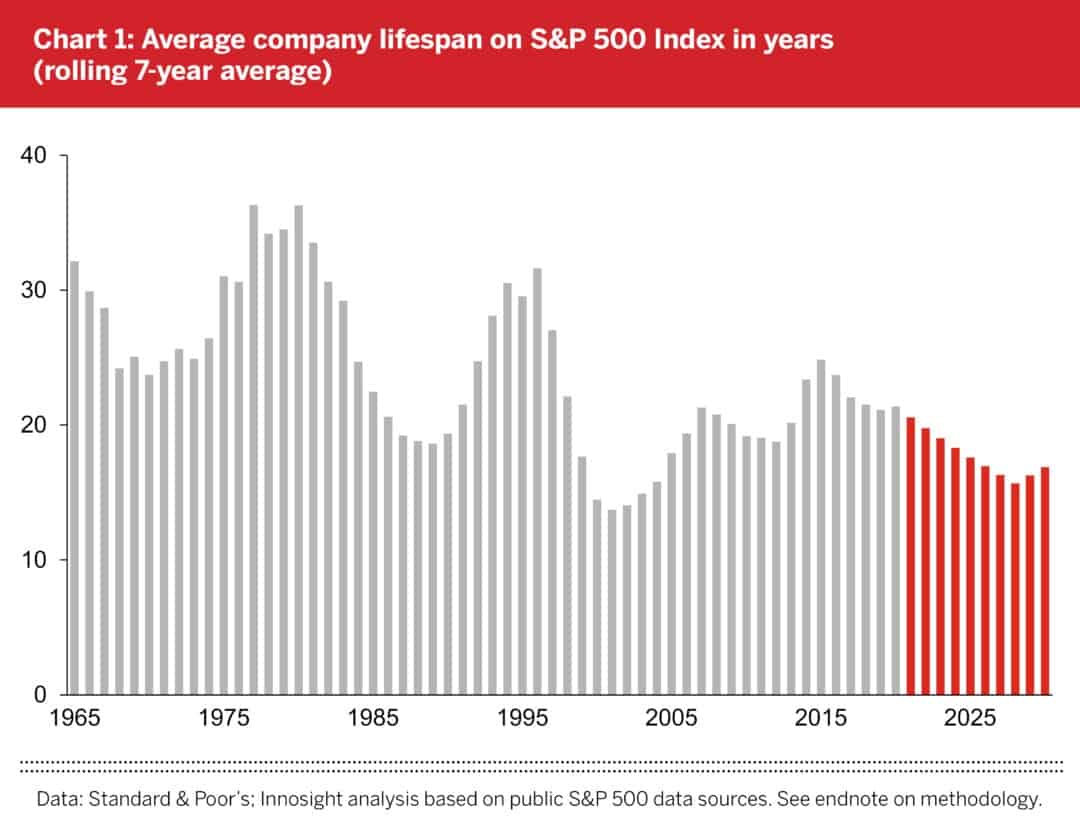
In 1965 the average company tenure in the S&P 500 was 33 years, but today it’s closer to 20 years. While this metric isn’t a perfect measure of creative destruction among U.S. stocks, it suggests that companies in the S&P 500 are being replaced at a faster rate than in the past.
Regardless of how quickly companies are moving in and out of the index, you can see that owning an index is fundamentally different than owning a basket of individual stocks. While your basket of individual stocks will remain the same over time, the index will not.
For example, if you own an S&P 500 index fund, your underlying holdings will change based on the work done by Standard and Poor’s research teams. If they decide to add or remove a company from the index, you will automatically add or remove that company from your holdings as well. In this way, owning a passive index fund, such as the S&P 500, is like owning a momentum strategy where the biggest risers are added and the biggest laggards are dropped out of the index over time.
But this isn’t the only way in which a stock is different than an index. The returns are far better in indices as well. As I stated in Chapter 18 of Just Keep Buying:
If you look at the universe of individual stocks in the U.S. going back to 1963, the median one-year return is 6.6%, including dividends. This means that if you grabbed an individual stock at random at any point in time since 1963, you would’ve earned roughly 6.6% over the next year. However, if you did the same thing with the S&P 500, you would’ve earned 9.9% instead.
Of course, many of you reading this know a lot of this already. “A stock isn’t an index? No sh*t Nick.” Yes, I know you know this.
But what you may not realize is the benefits that this provides to index investors. Think about it. We get a list of which companies to own and in which percentages to own them and we don’t have to pay for any of it. Other market participants do all the work for us. They spend their time, money, and energy setting prices and figuring out what we should invest in. And we don’t have to lift a finger.
Because of this, we can set our portfolios and do something more productive with our time. But what makes this situation even better is that we are likely to beat 70-80% of other active investors simply by buying and holding this list of companies! It’s the biggest free lunch in investing and there is no close second.
So, if you want to buy the Netflix dip, be my guest. You may be rewarded handsomely for doing so.
But if you want to join the rest of us “passively” getting rich, you know what to do.
Thank you for reading!
If you liked this post, consider signing up for my newsletter.
This is post 291. Any code I have related to this post can be found here with the same numbering: https://github.com/nmaggiulli/of-dollars-and-data

