
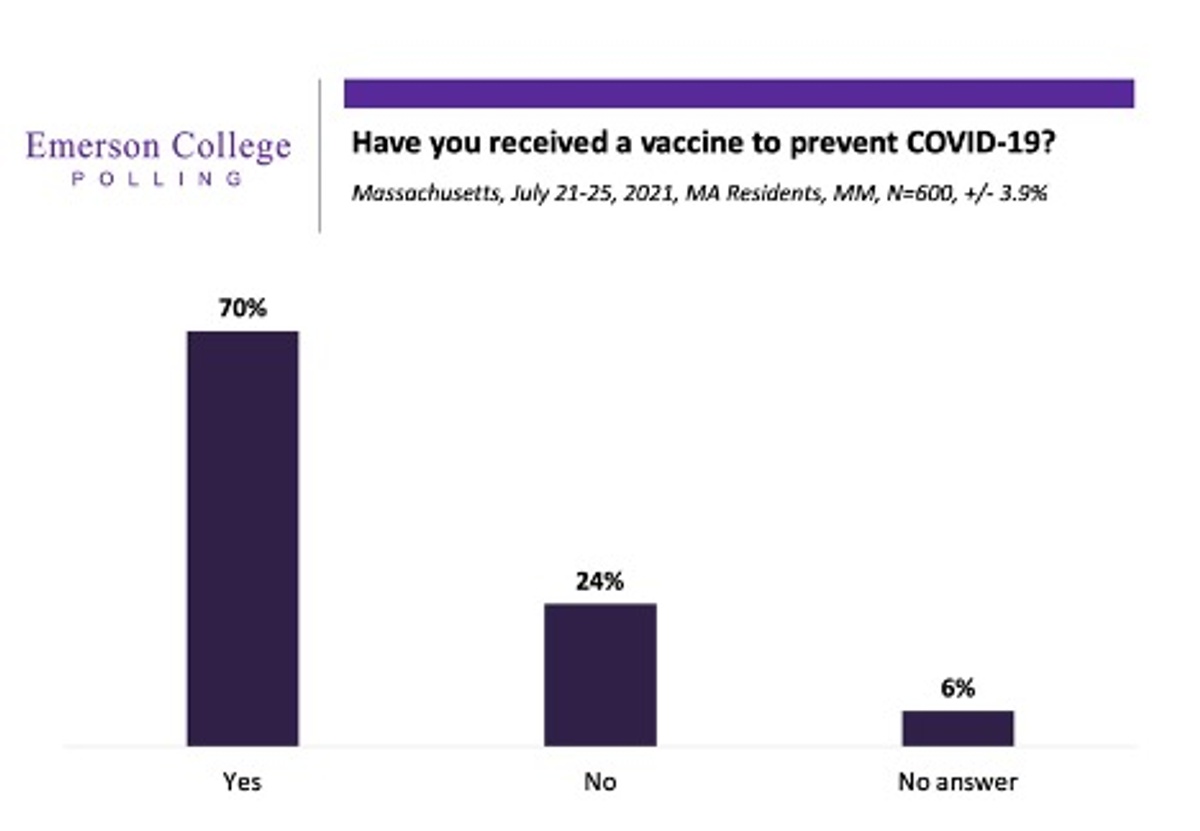
Have you received a vaccine to prevent COVID-19?
Over two-thirds (70%) of respondents indicated that they have received a Covid-19 vaccine, while 24% said they have not, and 6% preferred not to answer.
Those with a college degree were more likely to be vaccinated (73% yes/ 21% no) than those who did not receive a college degree (68% yes/ 27% no). Women in Massachusetts are also slightly more likely to be vaccinated (74% yes/ 22% no) than men (66% yes/ 28% no).
Hispanics in the state had lower vaccination rates than the average, with 46% being vaccinated and 38% not.
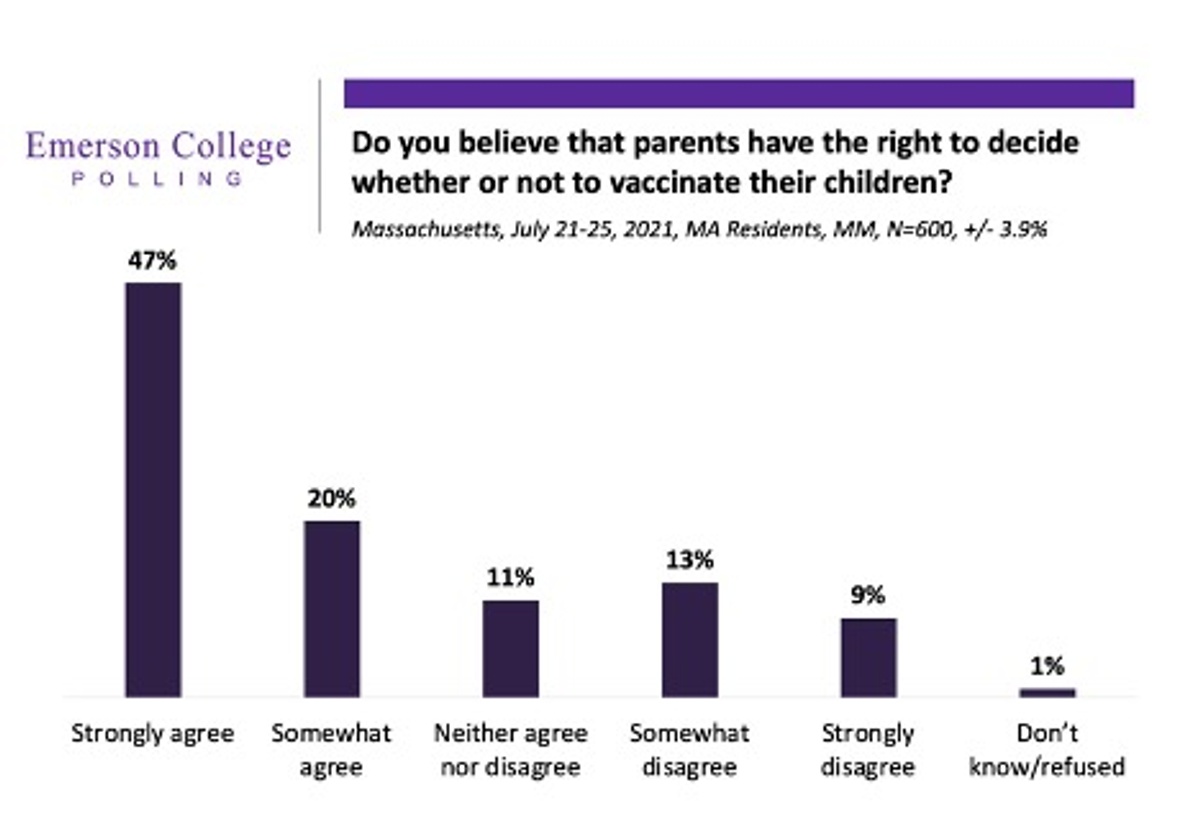
Do you believe that parents have the right to decide whether or not to vaccinate their children?
Two-thirds of respondents (67%) agree that parents should have the right to decide whether or not to vaccinate their children with a plurality (47%) agreeing strongly while an additional 20% somewhat agree. Thirteen percent (13%) somewhat disagree, and 9% strongly disagree. Eleven percent (11%) neither agree nor disagree, and 1% said they don’t know.
There are significant differences on this question in different age groups; those aged 18-34 are much more likely to disagree with this statement, at 31% somewhat or strongly disagree, compared to 24% of those 45-54, 22% of those aged 55-64, 13% of those 35-44, and 10% of those 65 and older.
Those who have not gotten a Covid-19 vaccine are stronger in their support for the parent’s right to decide, at 72% strongly agree.
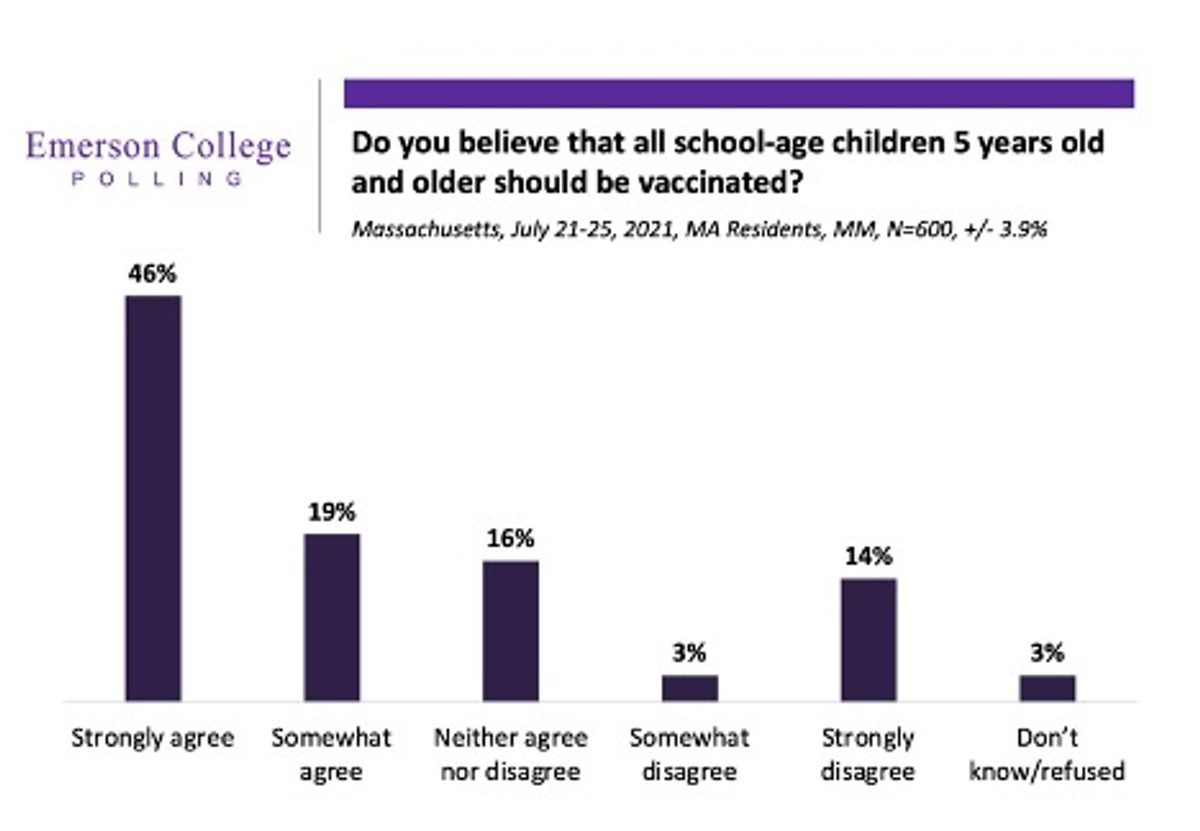
Do you believe that all school-age children 5 years old and older should be vaccinated?
Despite a plurality believing that parents should have the right to choose with vaccination, a plurality (46%) also believe that all school-age children 5 years old and older should be vaccinated, while an additional 19% somewhat agree. A combined 17% disagree (3% somewhat/ 14% strongly), while 3% don’t know and 16% neither agree nor disagree.
White respondents (69% agree/ 15% disagree) were the most likely to agree with the statement, followed by Asian respondents (69% agree/20% disagree) and Black respondents(61% agree/ 26% disagree). Hispanic respondents (45% agree/ 23% disagree) were the most split on opinion.
Those without a college degree were more likely to disagree (60% agree/18% disagree) than those with a college degree (70% agree/15% disagree).
A plurality (43%) of those who have not received a Covid-19 vaccination disagreed either strongly or somewhat.
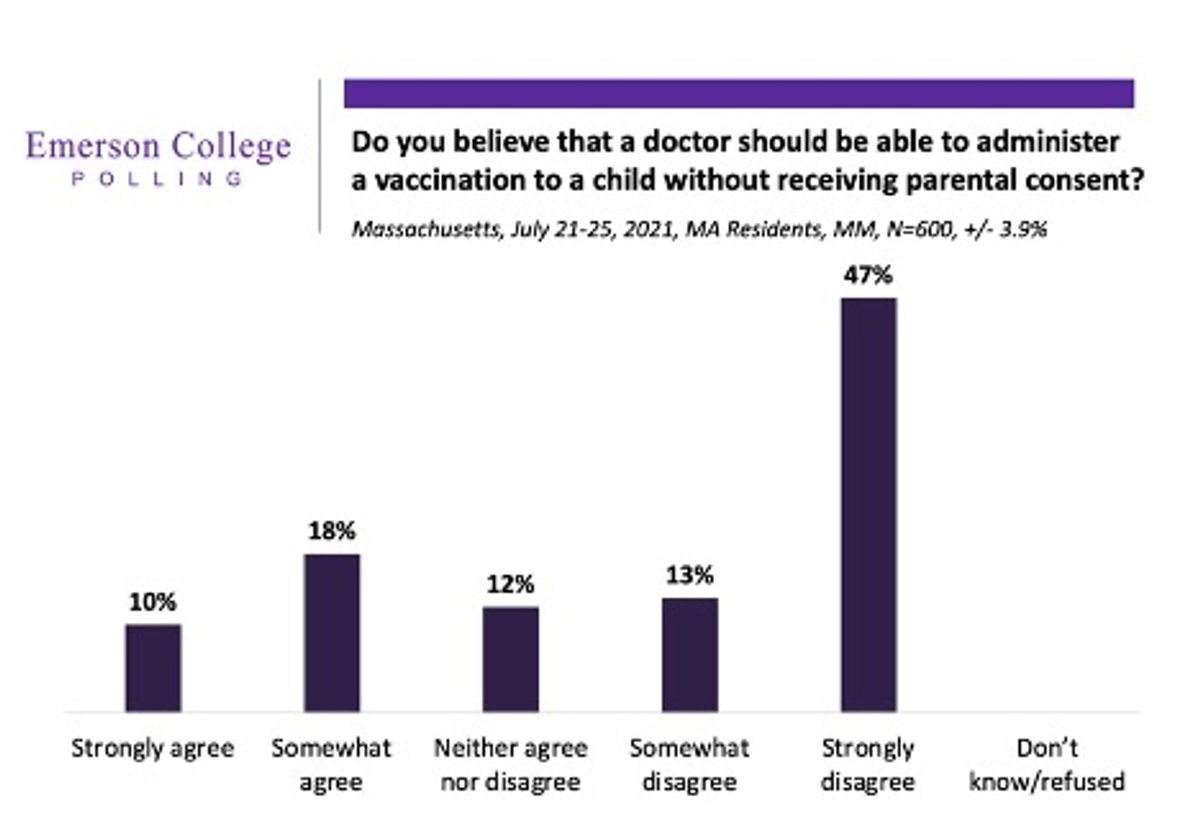
Do you believe that a doctor should be able to administer a vaccination to a child without receiving parental consent?
A strong majority (60%) either strongly (47%) or somewhat (13%) disagree that doctors should be able to administer a vaccination to children without parental consent. Twenty-eight percent (28%) either strongly (10%) or somewhat (18%) agree, while 12% neither agree nor disagree.
Men are much more likely to agree (33% strongly or somewhat) than women (24% strongly or somewhat).
Groups that have the strongest disagreement with such a policy are those who have not received a Covid-19 vaccine (75% strongly disagree), those aged 35-44 (59% strongly disagree), and those aged 55-64 years (55% strongly disagree).
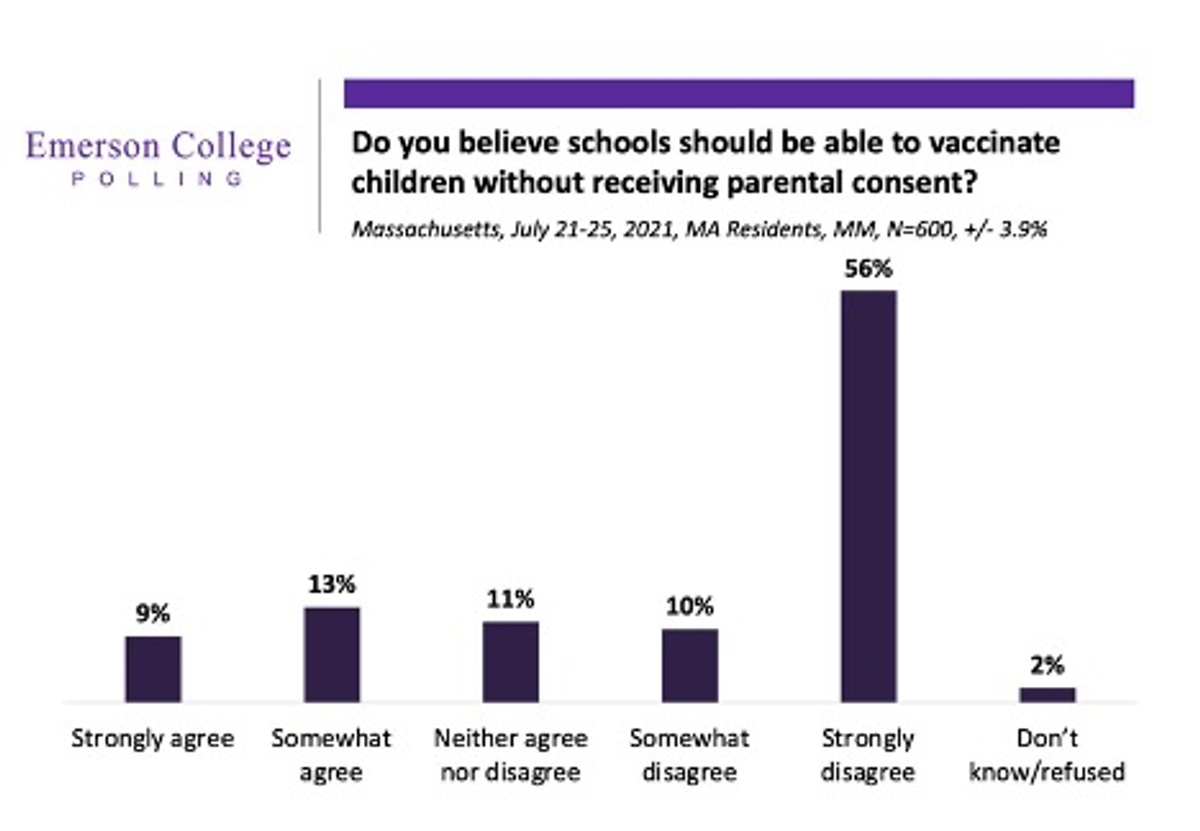
Do you believe schools should be able to vaccinate children without receiving parental consent?
An even stronger majority (64%) oppose schools vaccinating children without parental consent, with 56% strongly opposed and 10% somewhat opposed. In comparison, 22% either strongly (9%) or somewhat (13%) agree that schools should be able to, while 11% neither agree nor disagree, and 2% don’t know.
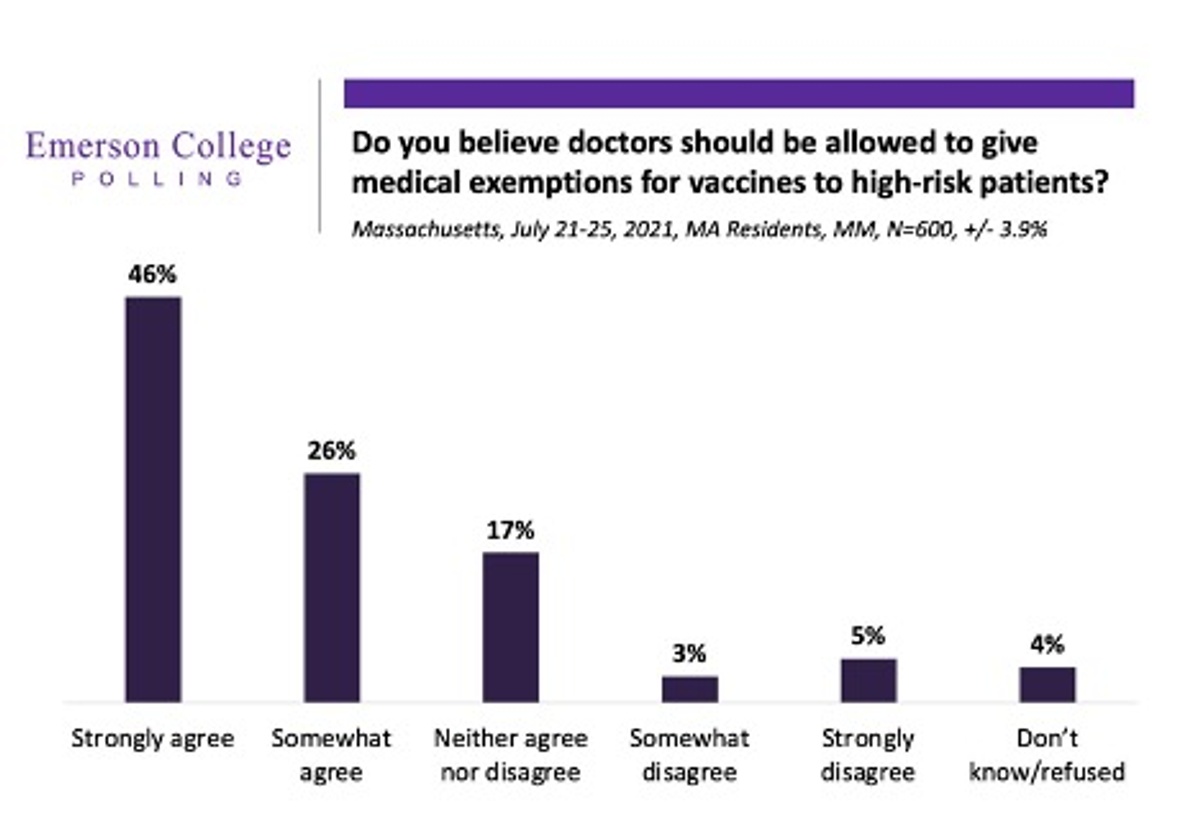
Do you believe doctors should be allowed to give medical exemptions for vaccines to high-risk patients?
Support for medical exemptions is very strong (72%) with a plurality (46%) strongly agreeing that high-risk patients should be allowed to obtain medical exemptions for vaccines, while an additional 26% somewhat agree. Seventeen percent (17%) neither agree nor disagree, and 4% don’t know. Only 9% either somewhat (3%) or strongly (5%) disagree.
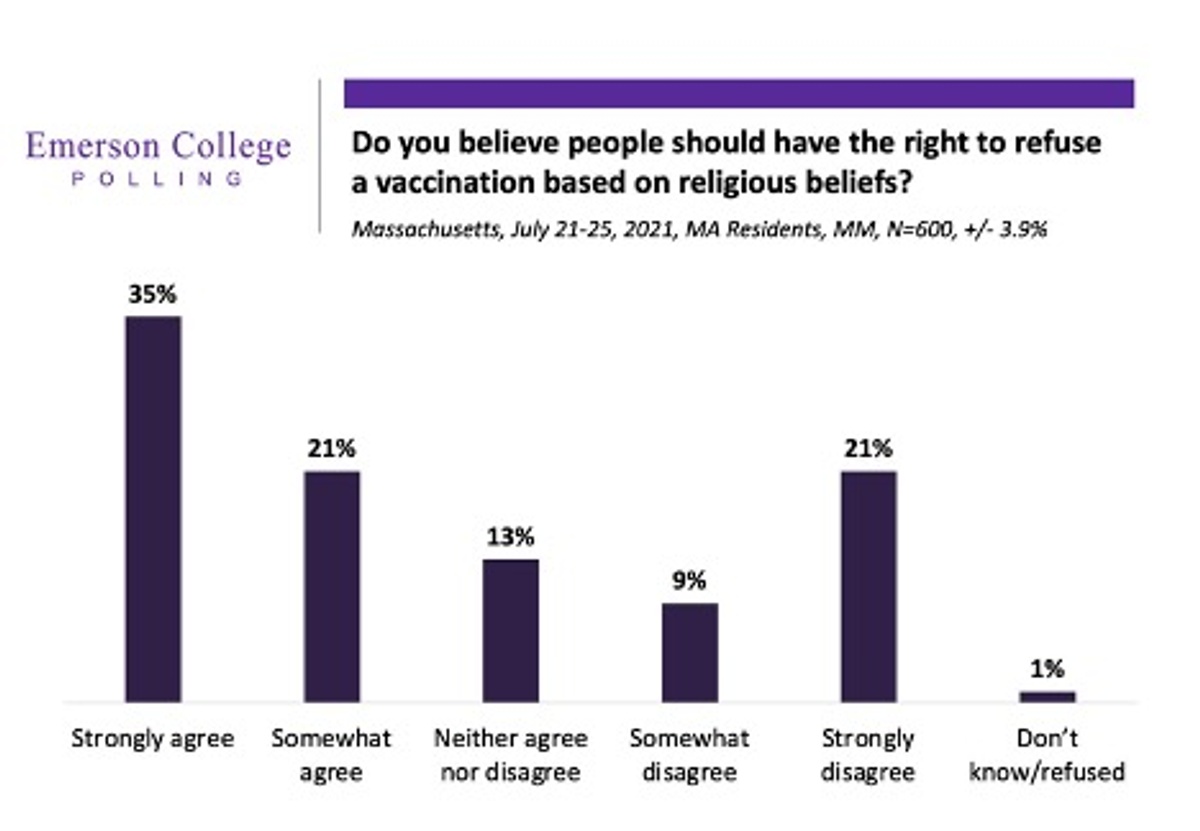
Do you believe people should have the right to refuse a vaccination based on religious beliefs?
Massachusetts residents support the right to refuse vaccines based on religious beliefs, with 56% either strongly (35%) or somewhat (21%) agreeing. Twenty-two percent (21%) strongly disagree with this right, while an additional 9% somewhat disagree. Thirteen percent (13%) neither agree nor disagree, and 1% don’t know.
The largest difference lies between educational attainments, as those without a college degree are more in favor of the right to refuse vaccination based on religious beliefs (63% agree/26% disagree), while those with a college degree are more split (47% agree/35% disagree).
Men are slightly more likely to agree on the right to refuse based on religious beliefs (58% agree/32% disagree) than women (55% agree/30% disagree).
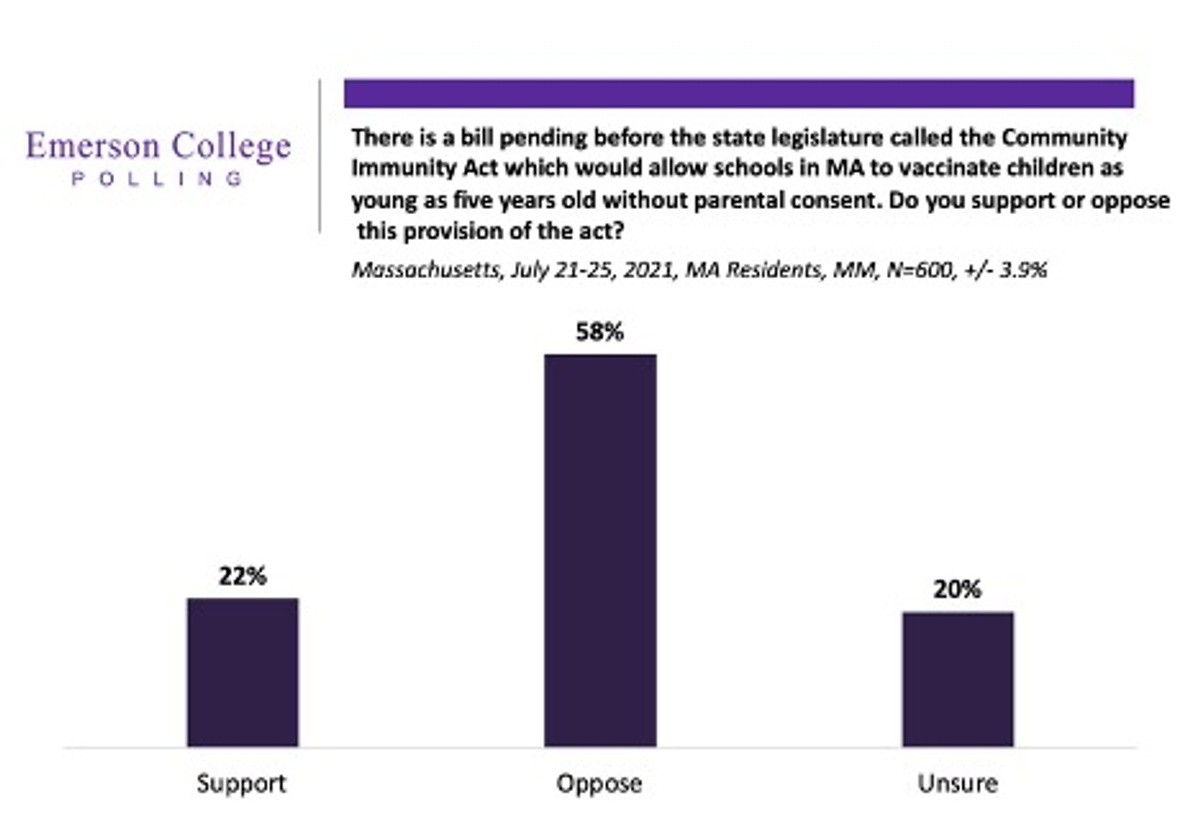
There is a bill pending before the state legislature called the Community Immunity Act which would allow schools in Massachusetts to vaccinate children as young as five years old without parental consent. Do you support or oppose this provision of the act?
A majority (58%) oppose the provision in the Community Immunity Act that would allow for vaccinations without parental consent. Twenty-two percent (22%) of respondents support the provision, and the remaining 20% are unsure.
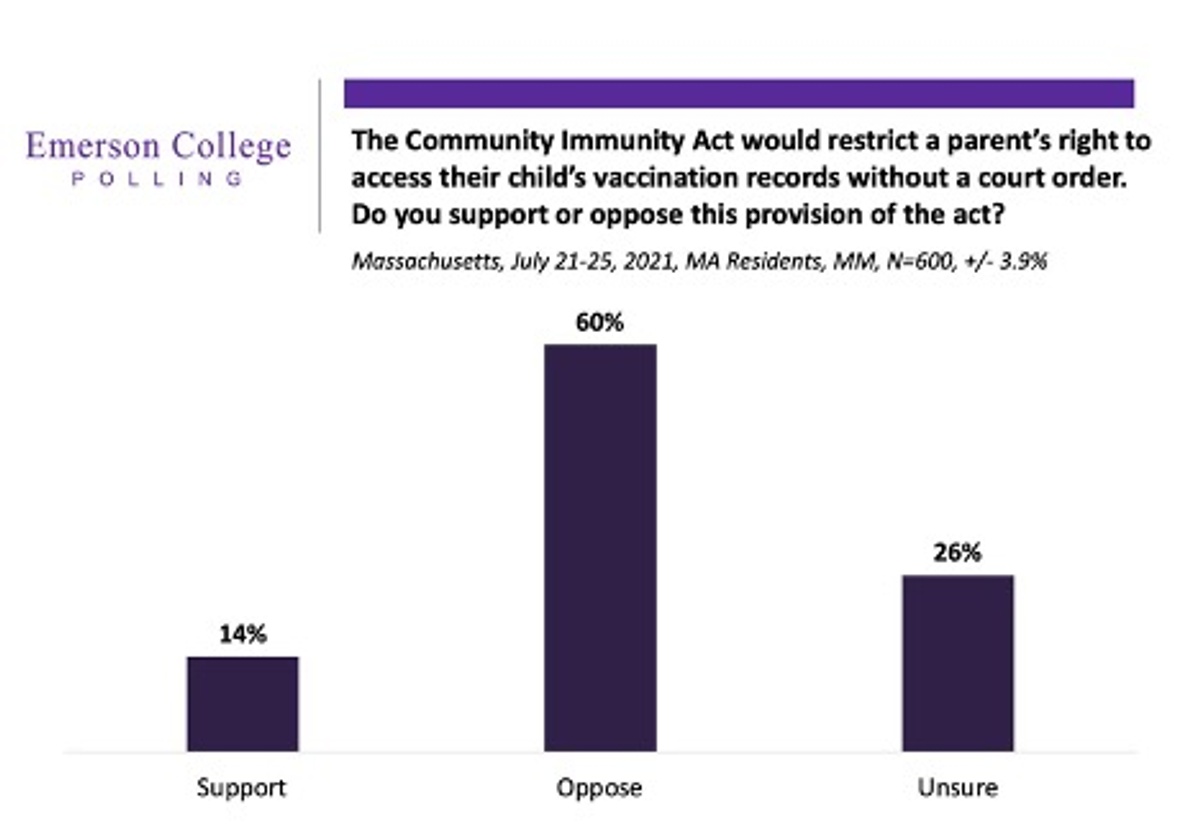
The Community Immunity Act would restrict a parent’s right to access their child’s vaccination records without a court order. Do you support or oppose this provision of the act?
A similar majority (60%) oppose the provision in the Community Immunity Act that would restrict a parent’s right to access their child’s vaccination records without a court order. Only 14% support the provision, with the remaining 26% unsure.
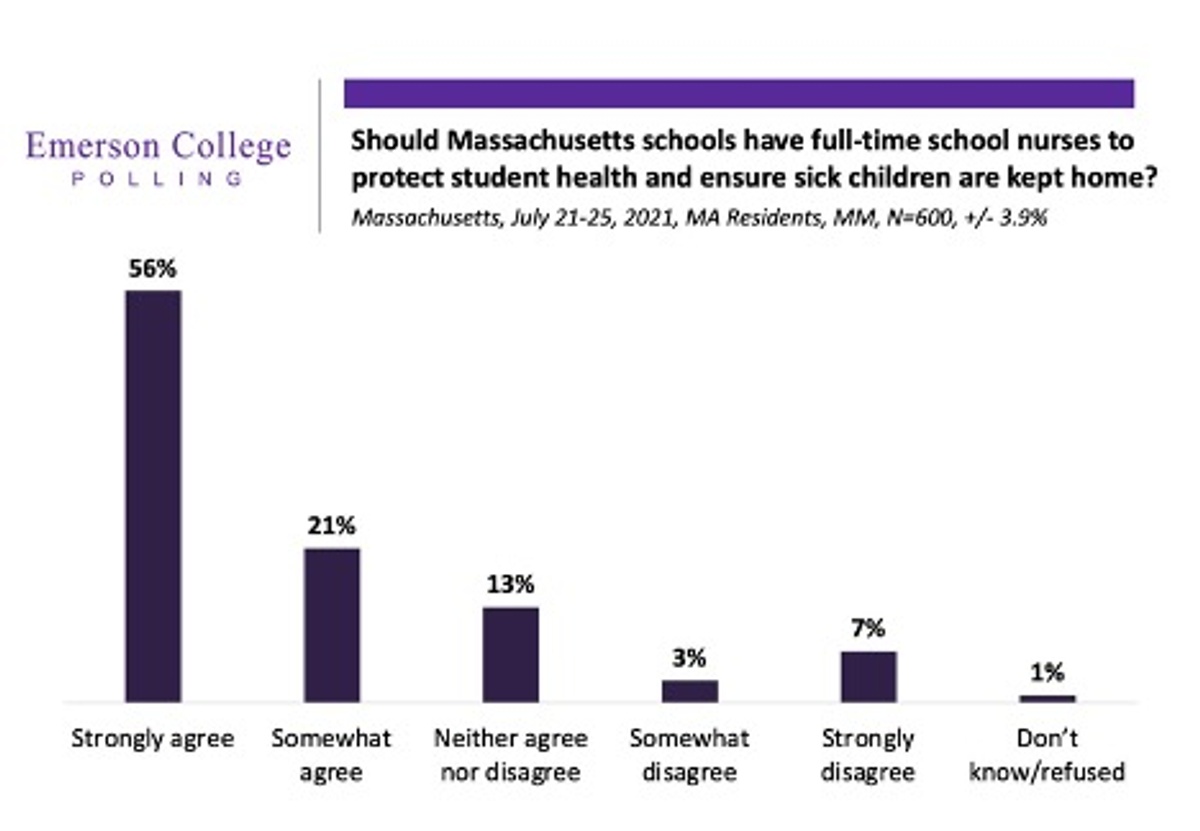
Should Massachusetts schools have full-time school nurses to protect student health and ensure sick children are kept home?
A strong majority (77%) either strongly (56%) or somewhat (21%) agree that MA schools should have full-time school nurses. Thirteen percent (13%) neither agree nor disagree, 1% don’t know, and 10% either strongly (7%) or somewhat (3%) disagree with this proposal.
Methodology
Emerson College Polling is pleased to present the findings from a survey of Massachusetts residents. This survey was commissioned by Coalition for Parental Choice. All respondents interviewed in this study were part of a fully representative sample using an area probabilistic sampling method of N=600 (sample size). The margin of error for the sample is +/- 3.9% in 19 of 20 cases.
The survey was administered by contacting landline telephones via IVR, cell phones via SMS-to-web, and online via a panel provided by Amazon MTurk, and was conducted between July 21-25, 2021.
The results presented in this report include univariate and bivariate analysis of the data. Frequency distributions for each item included on the questionnaire are shown in the tables. In all cases, cross-tabulation results are also shown. This type of bivariate analysis examines differences between sub-groups of the overall population. In the cases where cross tabulation results are presented, a chi-square test, an independent t-test for means, or a Z-test for independent percentages is shown.
A chi-square test is used in cases where comparisons are made for categorical variables. A t-test is used in cases where comparisons are made for measurement variables. A Z-test is used in cases where comparisons are made between independent population percentages.
The purpose of these statistical tests is to determine whether or not the observed difference between sub-groups in the sample is due to sampling error or whether it is due to a real difference in the population. When the results are statistically significant, it strongly suggests that the observed difference between sub-groups found in the sample is due to a real difference in the population, and not due to sampling error.
A chi-square significance level of .05 indicates significance at the 95 percent level. In other words, it is 95 percent likely that the results are due to a real difference between comparison groups. A chi-square significance level of .01 indicates significance at the 99 percent level.
