the Creative Commons Attribution 4.0 License.
the Creative Commons Attribution 4.0 License.
 | 05 Apr 2023
Observations of biogenic volatile organic compounds over a mixed temperate forest during the summer to autumn transition
Michael P. Vermeuel
Gordon A. Novak
Delaney B. Kilgour
Megan S. Claflin
Brian M. Lerner
Amy M. Trowbridge
Jonathan Thom
Patricia A. Cleary
Ankur R. Desai
Timothy H. Bertram
The exchange of trace gases between the biosphere and the atmosphere is an important process that controls both chemical and physical properties of the atmosphere with implications for air quality and climate change. The terrestrial biosphere is a major source of reactive biogenic volatile organic compounds (BVOCs) that govern atmospheric concentrations of the hydroxy radical (OH) and ozone (O3) and control the formation and growth of secondary organic aerosol (SOA). Common simulations of BVOC surface–atmosphere exchange in chemical transport models use parameterizations derived from the growing season and do not consider potential changes in emissions during seasonal transitions. Here, we use observations of BVOCs over a mixed temperate forest in northern Wisconsin during broadleaf senescence to better understand the effects of the seasonal changes in canopy conditions (e.g., temperature, sunlight, leaf area, and leaf stage) on net BVOC exchange. The BVOCs investigated here include the terpenoids isoprene (C5H8), monoterpenes (MTs; C10H16), a monoterpene oxide (C10H16O), and sesquiterpenes (SQTs; C15H24), as well as a subset of other monoterpene oxides and dimethyl sulfide (DMS). During this period, MTs were primarily composed of α-pinene, β-pinene, and camphene, with α-pinene and camphene dominant during the first half of September and β-pinene thereafter. We observed enhanced MT and monoterpene oxide emissions following the onset of leaf senescence and suggest that senescence has the potential to be a significant control on late-season MT emissions in this ecosystem. We show that common parameterizations of BVOC emissions cannot reproduce the fluxes of MT, C10H16O, and SQT during the onset and continuation of senescence but can correctly simulate isoprene flux. We also describe the impact of the MT emission enhancement on the potential to form highly oxygenated organic molecules (HOMs). The calculated production rates of HOMs and H2SO4, constrained by terpene and DMS concentrations, suggest that biogenic aerosol formation and growth in this region should be dominated by secondary organics rather than sulfate. Further, we show that models using parameterized MT emissions likely underestimate HOM production, and thus aerosol growth and formation, during early autumn in this region. Further measurements of forest–atmosphere BVOC exchange during seasonal transitions as well as measurements of DMS in temperate regions are needed to effectively predict the effects of canopy changes on reactive carbon cycling and aerosol production.
- Article
(6523 KB) -
Supplement
(3016 KB) - BibTeX
- EndNote


Terrestrial ecosystems provide the largest source of reactive carbon to the global atmosphere, with emissions estimated to exceed 1000 Tg yr−1 (Guenther et al., 1995, 2012), greater than those of methane (∼550 Tg yr−1) (Saunois et al., 2016) and all anthropogenic volatile organic compounds (VOCs) (∼200 Tg yr−1) (Huang et al., 2017). More than half of emitted biogenic VOCs (BVOCs) are in the form of reactive terpenes (isoprene, C5H8; monoterpenes, MTs, C10H16; sesquiterpenes, SQTs, C15H24), which control oxidant loadings as well as the production rate of secondary organic aerosol (SOA) in select regions (Curci et al., 2009; Johnson and Marston, 2008; Lee et al., 2006b). The oxidation of terpenes generates highly oxygenated organic molecules (HOMs) that can nucleate to form new particles or contribute to the growth of existing particles (Bianchi et al., 2019; Ehn et al., 2014; Fuentes et al., 2016; Jimenez et al., 2009). A second class of BVOCs that can also contribute to aerosol growth and formation is reduced sulfur compounds (e.g., dimethyl sulfide, DMS, C2H6S) (Lamb et al., 1987; Staubes et al., 1989; Fall et al., 1988; Kanda et al., 1995; Berresheim and Vulcan, 1992; Brown et al., 2015). DMS can be oxidized to SO2 and then terminated as H2SO4 (Barnes et al., 2006), which can contribute to aerosol production. Although DMS is emitted and detected in low quantities in forests, only small steady-state concentrations of H2SO4 (∼1 pptv) are required to generate significant particle nucleation rates (Kirkby et al., 2011) and new particle formation (NPF) events.
These organic and inorganic aerosol nucleation and condensation routes impact climate both directly by interacting with incoming solar radiation and indirectly by providing condensation nuclei that can alter cloud properties, and thus, Earth's albedo. Accurate estimates of BVOC emissions in chemical transport models (CTMs) are required to evaluate the impact of BVOCs on atmospheric chemistry. Emissions of BVOCs from plants are commonly calculated in CTMs using land-type-dependent emission factors, estimations of temperature and photosynthetically active radiation (PAR), and satellite-derived foliar density (Guenther et al., 1995, 2006, 2012). However, different plant species in the same land type can emit specific terpene molecules at varying rates (Benjamin et al., 1996; Geron et al., 2000), and stresses such as drought, enhanced UV irradiation, extreme heat, herbivory, oxidative stress, and enhanced air pollution, among others, can modify ecosystem-level BVOC emissions (Peñuelas and Staudt, 2010; Loreto and Schnitzler, 2010). Further, our understanding of the net exchange of BVOCs with soils and the forest floor remains limited (Trowbridge et al., 2020), although recorded magnitudes of soil and litter terpene flux are negligible compared to canopy-scale, plant-dominated fluxes (Greenberg et al. 2012). While emissions of DMS from soils in tropical and subtropical regions have been shown to contribute considerably to observed DMS (Brown et al., 2015; Yi et al., 2010), few observations exist in other latitudes (Goldan et al., 1987; Lamb et al., 1987).
The surface–atmosphere exchange of BVOCs in forested ecosystems is commonly measured during the growing season when leaf temperatures and foliar density (and thus emissions) are highest (Spirig et al., 2005; Acton et al., 2016; Isebrands et al., 1999; Laffineur et al., 2011; Janson, 1993). There are few studies that monitor BVOC exchange during seasonal transitions, particularly in northern temperate regions and mixed forests (Fuentes and Wang, 1999; Karl et al., 2003). Several seasonal studies have been conducted at the SMEAR II coniferous boreal forest site in Hyytiälä, Finland. These studies have shown that in some ecosystems the decomposition of needleleaf litter along with other emissions from the forest floor (e.g., soils) can contribute to sustained and enhanced MT emissions, along with a seasonal change in MT speciation (and thus reactivity) (Aaltonen et al., 2011; Hakola et al., 2000, 2003; Hellén et al., 2006; Mäki et al., 2019). Dal Maso et al. (2005) recorded peak aerosol formation and growth events occurring in May and September at the SMEAR II site, suggesting an enhancement in BVOC emissions during seasonal transitions. Autumn peaks in the emissions of acetone and acetaldehyde have been observed in a mixed hardwood forest in Michigan, which was attributed to both senescing and decaying biomass (Karl et al., 2003). Observations of VOC fluxes from a plantation site showed that during the onset of leaf senescence and shortly thereafter, four different species of the deciduous Populus genus (e.g., aspens, cottonwood) exhibited a burst of oxygenated VOC (OVOC) and MT emissions, while isoprene emissions ceased (Portillo-Estrada et al., 2020). Seasonal changes in vegetation can also influence the emission response to temperature as well as the speciation of emitted compounds. For example, over the course of 1 year, Helmig et al. (2013) observed seasonal deviations in both the MT profile and the temperature response factor of six coniferous species. Together, these studies suggest that environmental and phenological factors affecting northern temperate forests during the summer to autumn transition are likely modulating ecosystem-level BVOC dynamics in ways that are not accurately represented in current global models. Whether peak emissions occurring at the tree dormancy transition period are due to decaying, abscised leaves, or the senescence process of the attached leaf is unclear.
Here, we evaluate how seasonality affects the surface–atmosphere exchange of BVOC during the summer to autumn transition through a novel dataset, collected by a proton-transfer-reaction mass spectrometer (PTRMS) coupled to an online gas chromatograph (GC), of the mixing ratios, net ecosystem fluxes, and speciation of key BVOCs over a northern WI mixed temperate forest during September 2020. During this time, trees were exposed to a wide range of temperatures, accumulated precipitation, and sunlight, as well as a steep change in canopy condition and leaf developmental stage (mature leaves, leaf senescence, and leaf abscission), all of which have been shown to modulate the quantity, direction, and speciation of BVOC exchange. In addition, the mixed canopy allowed for concurrent observations of BVOC emissions from both coniferous species and deciduous species, with the potential to identify species-specific responses. Among the data collected are vertical fluxes and mixing ratios of key reactive terpenes (isoprene, MT, and SQT), C10H16O, a presumed monoterpene oxide (MTO), as well as mixing ratios of other MTOs and DMS. Net fluxes are compared to common temperature- and PAR-dependent parameterizations of BVOC emissions to assess the suitably of such parameterizations during this period. Additionally, we use this chemical dataset, along with field meteorological data, to constrain a photochemical box model to evaluate the impact of seasonal effects on BVOC concentrations and speciation and the production of HOMs (PHOM) and sulfuric acid () with implications for aerosol production.
This work focuses on understudied routes of BVOC emissions in a temperate mixed forest canopy during the summer to autumn transition to better improve our predictive capabilities of net ecosystem fluxes, concentrations of reactive carbon, and chemical rates that estimate the production of low-volatility oxidized products. Results from this study suggest that the physical changes in this forest can strongly modify the net exchange of important BVOCs and need to be considered to predict the contribution of reactive carbon to atmospheric composition and aerosol production.
2.1 Overview of measurements at the very tall tower at WLEF in Park Falls, WI
2.1.1 Site description
The PEcoRINO (Probing Ecosystem Responses Involving Notable Organics) study consisted of chemical and meteorological observations over the Chequamegon–Nicolet National Forest (CNNF) at the WLEF-TV very tall tower US-PFa Ameriflux site in Park Falls, WI (45.945∘ N, 90.273∘ W) (Davis et al., 2003), from 6–30 September 2020. The landscape surrounding the tower is composed of grasslands, woody wetlands, and deciduous and evergreen forests as determined from the National Land Cover Database (NLCD) 2016 (Dewitz, 2020). This location has been used for many eddy covariance (EC) studies concerning the role of surface heterogeneity in heat and carbon exchange (Desai et al., 2008, 2010, 2015; Xu et al., 2017; Bakwin et al., 1998), as well as a multi-institutional, intensive field campaign focused on the role of atmospheric boundary layer responses to scales of spatial heterogeneity in surface–atmosphere heat and water exchanges (Butterworth et al., 2021). Recently, this site has been used to investigate the exchange of O3 and formic acid and the role of in-canopy chemistry in observed fluxes (Vermeuel et al., 2021).
2.1.2 Meteorological and O3 measurements
For the PEcoRINO study, routine US-PFa site measurements of 10 Hz wind speed and temperature (Model K Style Probe; ATI, Inc.) at 30 m were used, along with relative humidity (HMP155, Vaisala) and solar irradiance (LI-190; LI-COR, Inc.) (Desai, 1996). Continuous 1 Hz measurements of O3 mixing ratios using a photometric analyzer (Model 49i; Thermo Fisher) were made at a sampling height of 30 m through an inlet composed of type 1300 Synflex ( i.d.), drawing 30 standard liters per minute (slpm) of ambient air. The photometric analyzer was calibrated by the generation of a calibration curve every 3 d using an O3 calibration source (Model 306 Ozone Calibration Source; 2B Technologies).
2.1.3 VOC measurements
A high-resolution proton-transfer-reaction time-of-flight mass spectrometer (HR-PTR-ToFMS) (Vocus; Aerodyne Research Inc. and Tofwerk AG) (Krechmer et al., 2018) made continuous 10 Hz measurements of VOCs at 30 m through a separate 45 m, i.d. perfluoroalkoxy alkane (PFA) inlet, drawing between 25–30 slpm of ambient air in order to maintain turbulent flow in the sampling line. The Vocus subsampled from the main inlet with a 5 slpm bypass through a PFA tee located immediately in front of the Vocus capillary inlet. The sample flow into the Vocus instrument was 100 sccm with the remaining bypass flow exiting to the pump. The sample inlet was constantly heated to 40 ∘C and was wrapped in aluminum foil throughout to avoid any potential inlet photochemistry. Attached to the front of the inlet was a PFA funnel wrapped in aluminum foil to avoid significant moisture draw during precipitation events. The focusing ion–molecule reactor (FIMR) of the Vocus was held at 1.5 mbar, and the FIMR's front and back were held at 400 and 35 V, respectively. The Vocus big segmented quadrupole (BSQ) ion guide was maintained at 215 V to allow for a higher transmission of lower-molecular-weight molecules such as methanol. Spectra with a mass range of 10–504 and a resolution of were collected, allowing for highly resolved determination of peaks in the mass spectrum. A total of 1474 peaks were integrated using the Igor-Pro-implemented (WaveMetrics, Inc.) Tofware software package (Aerodyne Research Inc. and Tofwerk AG). A three-point calibration curve using a non-methane VOC (NMVOC) standard (Apel Riemer Environmental, Inc.) and ultra-zero (UZ) air (AI UZ300, Airgas) was collected every 4 h to record dynamic in-field calibration factors for select compounds. Zeros were also performed during calibrations. Calibration standards and concentrations are presented in Table S1 in the Supplement. Calibrations were not added to the entire inlet but were rather introduced by overflowing the subsampling line. Calibration factors have been shown in lab studies to be insensitive to water content for the Vocus (Krechmer et al., 2018) and for this specific instrument (Kilgour et al., 2022). In the field the calibration factors were on average 900, 1500, 800, and 5000 cps ppbv−1 for isoprene, MT (α-pinene), SQT (β-caryophyllene), and acetone, respectively, with coefficients of variation of less than 10 % across species throughout the study.
A GC system designed for online atmospheric analysis (ARI GC; Aerodyne Research Inc.) was used to separate isomers of reactive compounds (e.g., MT) by coupling it to the Vocus to create a GC-ToF-MS system. A previous version of the instrument is described in detail in Claflin et al. (2021) but will be briefly described here. In the GC-ToF-MS system, sample air passes through a multi-stage thermal desorption preconcentration (TDPC) system (Aerodyne Research, Inc.) to collect and focus analyte species from ambient air before separation on the chromatographic column. The GC sample flow rate is controlled via a mass flow controller (MFC) and is held at 100 sccm for 10 min, resulting in a 1 L ambient sample per GC cycle. Before collection onto the TDPC, sample gases passed through a sodium sulfite (Na2SO3) oxidant trap to remove reactive gases, such as ozone, to reduce sampling artifacts that can occur at high mixing ratios (Helmig, 1997). After passing through the oxidant trap, the sample is then collected onto a multi-bed sorbent tube (Tenax TA/Graphitized Carbon/Carboxen 1000, Markes International), which is then forward-purged with zero gas for 2 min to reduce the level of trapped water. After the post-collection purge, the sample is then transferred to a multi-bed, narrow bore cold trap (Tenax TA/Carbopack X/Carboxen 1003, Markes International) for focusing before injection onto the GC column. Both the sample collection and focusing are conducted at sub-ambient (20 ∘C; optimized to avoid condensation) temperatures through the use of a Peltier thermoelectric cooler. After focusing, the flow is then injected onto a GC column, which then undergoes a programmed temperature ramp from 35–225 ∘C. The column used in this study resolves non- to mid-polarity VOCs including hydrocarbons, oxygenates, and some nitrogen- and sulfur-containing compounds (MXT-624, Restek). For this study, the ARI GC was used to resolve C5–C12 hydrocarbons, DMS, and some oxygen-containing VOCs. For the majority of this work, the total chromatograph times were 10 min, which allowed for the full resolution of all MT species at this site. A subset of 14 sets of chromatograms was collected with a 20 min chromatograph length to also speciate SQTs and larger isomers, although this was not used for routine analysis, as it was too time-demanding. Chromatogram peak areas were fitted using the Igor-implemented TERN software v2.2.9 (Aerodyne Research Inc.) (Isaacman-VanWertz et al., 2017, 2022), and the resulting values, in units of cts s per extraction where cts are signal counts, were multiplied by the ToF extraction rate (24.4 kHz) to calculate quantifiable cts.
In the field, the operation was divided between a 10 Hz ambient collection solely through the HR-ToF-MS and collection via the GC-ToF-MS system, herein referred to as real-time (RT)-Vocus and GC-Vocus sampling, respectively. The GC-Vocus collection routine is described in the Supplement .
2.2 Post-field calibrations of the RT- and GC-Vocus systems
Following the PEcoRINO study, experiments were performed to determine (1) the effect of the inlet on potential irreversible loss of VOCs to the inlet wall, (2) calibration factors for both the RT-Vocus and GC-Vocus, and (3) GC retention times for authentic standards. Experiments were performed under two conditions: one with standards added to the entire heated inlet line at a flow of 28 slpm and one with standards added to a clean PFA line ∼1 m in length. This allowed for comparison of the field inlet with a clean, short inlet, as well as determination of post-field calibration factors. Calibrations of the RT-Vocus and GC-Vocus systems were performed by staged dilutions of a VOC standard with a mixture of 80:20 ultra-high purity (UHP) N2:O2, herein referred to as synthetic ZA. GC sample collection times were maintained at 10 min. The experiments showed negligible (<5 %) loss of MT, SQT, isoprene, and acetone to the field inlet. Lab and field calibration factors of each system through the addition to the short, clean line were within experimental error (5 %) (Fig. S1 in the Supplement). Since calibration factors of DMS, methanol (CH3OH), and various monoterpene oxides (C9H14O, C10H14O, C10H16O, C10H16O2, and C10H16O3) were not collected in the field, post-field calibrations of DMS, methanol, nopinone (C9H14O), thymol (C10H14O), camphor (C10H16O), and cis-pinonic acid (C10H16O3) were performed to determine RT-Vocus calibration factors as 3900, 97, 1700, 1000, 5100, and 460 cps ppbv−1, respectively. The calibration factor for C10H16O3 was applied to C10H16O2 for the purposes of estimating concentrations in this study. The calibration factor of β-farnesene, the primary-observed on-site SQT, was determined to be 800 cps ppbv−1, which is the same as the field-determined β-caryophyllene. Field and laboratory determinations of GC-Vocus calibration factors were also consistent, with isoprene calibration factors of 5.4×10⁴ cts ppbv−1 (field) and 5.7×10⁴ cts ppbv−1 (post-field) and α-pinene calibration factors of 8.7×10⁴ cts ppbv−1 (field) and 7.5×10⁴ cts ppbv−1 (post-field). A comparison of RT-Vocus and GC-Vocus calibration factors shows the expected enhancement in sensitivity of nearly a factor of 60, which can be attributed to the sample collection time. Post-field GC calibrations of DMS show a similar enhancement factor, where the GC-Vocus calibration factor is 2.38×10⁵ cts ppbv−1.
To determine the retention time of potential isomers that were not included in the field NMVOC standard, qualitative experiments comprising direct, standard additions to the GC were performed (SI). The retention times (RTs) of the above-listed MTOs, β-farnesene, and DMS were determined following this method. The retention times of unverified isomers and peak positions of unknowns were estimated using Kovats retention indices (RIs). To do this, a library of known RTs were paired with their Kovats RIs acquired from the NIST database (Rostad and Pereira, 1986) to generate a curve of RTs and Kovats RIs. Non-calibrated compounds could then be estimated by pairing their observed RetT with their RI retrieved from the fit of RetT vs. RI (Fig. S2).
2.3 EC flux method data processing and quality control
Direct observations of trace gas fluxes were made using the eddy covariance (EC) method. As per the EC method, the vertical flux of a compound, C, can be calculated as the covariance of the signal of C with vertical wind, w, within a period of n measurements (Stull, 1988):
Fluxes were calculated by Reynold's averaging (Eq. 1) of 30 min blocks of 10 Hz C and w. Flux uncertainties were determined through calculation of the flux limit of detection (LoD) for each flux calculation period as described in Langford et al. (2015). LoD was calculated at the 95 % confidence level, 1.96σ (standard deviation) in the cross-covariance of the outer 20 points within a 400-point lag time window centered around the average campaign maxima. Spectral corrections were performed to account for the high-frequency attenuation due to sensor separation, inlet damping, and instrument response (Horst, 1997). This method is described in S2 and gave a 2 %–4 % flux correction, on average, which was below the flux and measurement uncertainty and was therefore not applied. Also included in S2 is the analysis of cospectra, calculations of cross-covariance to determine lags in response time, and measures of flux quality control to reject periods of low shear-driven turbulence, non-stationarity, and unphysical lag times (Horst, 1997; Wilczak et al., 2001; Foken and Wichura, 1996; Foken et al., 2004). Post-field quality control removed 51 % of measured flux periods.
2.4 Parameterizations for surface emissions of BVOCs
Estimates of BVOC emissions were performed based on parameterizations of the Model of Emissions of Gases and Aerosols from Nature (MEGAN) (Guenther et al., 2006, 2012). Briefly, emissions of isoprene (Eiso) are parameterized as
where ε is the emission factor (EF) which represents emissions of BVOCs at standard conditions, CL and CT are factors that account for deviations in photosynthetic photon flux density (PPFD) and leaf temperature from standard conditions, γLAI is a correction factor for leaf area index (LAI) where γLAI=1 at an LAI of 5, and ρ is a parameter that accounts for loss within the canopy. We approximate emissions of MT and SQT as
where LDF is the light-dependent fraction of emissions, γT,LIF is the light-independent temperature activity factor dependent only on T, γLDF is the light-dependent activity factor that depends on T and PPFD, and γP is the light activity factor. In Eq. (3c) β represents a temperature scaling factor, and Ts is the leaf temperature (here approximated as air temperature). Factors were calculated according to Guenther et al. (2012). While the results of these parameterizations can carry a considerable amount of error (upwards of 210 %), they are used in this analysis to directly compare relative magnitudes and diurnal profiles in observed emissions. In the analysis presented here, we compare parameterized emissions from Eq. (3) with the observed flux.
2.5 Box modeling
To derive chemical reaction rates and subsequent product formation from observations, a box model was constructed with the Framework for 0-D Atmospheric Modeling (F0AM) (Wolfe et al., 2016) using the Master Chemical Mechanism (MCM) v3.3.1 (Jenkin et al., 2015). The oxidation of camphene was added to MCM using rates from Gaona-Colmán et al. (2017) for OH and O3 oxidation and from Martínez et al. (1998) for NO3 oxidation. In this model, SQT chemistry was assumed to be dominated by β-farnesene due to a match in Kovats retention index and the likelihood of emission of this compound from primary conifer species in the region (Sect. 3.2). Rate constants for the OH- and O3-initiated oxidation of β-farnesene were taken from Kim et al. (2011). Since no published rate constants for the NO3-initiated oxidation of β-farnesene exist, we estimate this rate to follow that of β-caryophyllene, which already exists in MCM, although the value used is highly uncertain (factor of 5) based on the range of published SQT + NO3 reaction rate constants (Yonghui and Atkinson, 1995). The production of HOMs was calculated using lab yields of extremely low-volatility organic compounds (ELVOCs) from O3- and OH-initiated terpene oxidation (Jokinen et al., 2015, 2016). Since the HOM yields (YHOM) from the oxidation of β-farnesene are unknown, it is estimated in our model to be the same yields as β-caryophyllene. Table S2 lists the yields used for this model. Due to the absence of studies on HOM formation from camphene oxidation, it is assumed that YHOM for camphene is the same as β-pinene due to the presence of an exocyclic double bond in both compounds. It was also assumed that the YHOM from β-farnesene + OH was the same as α-pinene + OH. Since there is no existing YHOM from NO3-initiated oxidation of any of these species, we set this to a low value of 0.001 for all species. Based on the range of values in Table S2 the uncertainty on unknown YHOM can be up to an order of magnitude. Although we make assumptions for NO3 oxidation and subsequent HOM formation, it is expected that the range of uncertainty from these values has a small comparable effect on oxidation and products relative to O3 and OH. However, if there was a large on-site source of NOx (and thus NO3) or sustained county road emissions, then NO3-initiated oxidation in this region may have an impact on nocturnal BVOC oxidation and subsequent aerosol production. The chemistry of DMS and subsequent is evaluated using the mechanism employed in Vermeuel et al. (2020).
Meteorology (T, RH, pressure) and mixing ratios of DMS, O3, methanol, and acetone were constrained by measurements. Other unmentioned chemical initial conditions follow those in Vermeuel et al. (2020). Observed or parameterized fluxes were used to constrain MT, isoprene, and SQT concentrations depending on the model run. A model diel profile in OH based on published measurements in a northern temperate forest was used and scaled by observed solar radiation ([OH] molec cm−3) to account for lower net POH on cloudier days (Faloona et al., 2001). The model planetary boundary layer (PBL) height was based on a September 2019 diurnal profile from 40 km south of WLEF that peaks at 1.2 km during the day (Duncan et al., 2022). Emissions were divided by the PBL height to provide source rates. Model NOx mixing ratios followed typical diurnal cycles and had an average of 200 pptv, which is an estimate, but it is representative of prior autumnal temperate mixed forest measurements (Seok et al., 2013). The model was used to simulate chemistry for 6–30 September 2020, which included a model spinup of 1 d.
3.1 Observations at Park Falls, WI, in September 2020
3.1.1 Meteorology
The CNNF canopy experienced a variety of meteorological and physical (e.g., leaf stage, leaf area) conditions during the sampling period (Fig. S4). For example, there was a wide range of observed daytime maxima (7.9–26 ∘C) in ambient temperature (Fig. 1a). Wind speed (Fig. 1b) generally peaked in the late afternoon (13:00–16:00 CDT) with an average daytime value of 2.3 m s−1 (average daytime maximum of 2.8 m s−1) and a range in daytime maxima of 1.9–6 m s−1. Winds primarily originated from the west (Fig. 1c) with large, abrupt changes in wind direction (WD) concurrent with low wind speeds, indicative of periods of a stable boundary layer. There were many precipitation events throughout the study (Fig. 1d), with 24 September onward experiencing many rainy, misty, and cloudy days. Also shown in Fig. 1d is the LAI product from the Moderate Resolution Imaging Spectroradiometer (MODIS) sensor on board the NASA Terra satellite for the pixel over the WLEF-TV site (Savtchenko et al., 2004). Throughout September, we also observed a decrease in LAI from 4 to 0.8 m2 m−2, indicating loss of leaves or declining leaf greenness throughout the month, both of which may be crucial in controlling the exchange of BVOCs via surface area required for emissions and/or deposition and uptake. Measurements of PPFD (Fig. 1e) indicate an attenuation of solar radiation in the last week of the study, suggesting increased cloud cover at the site during that time.
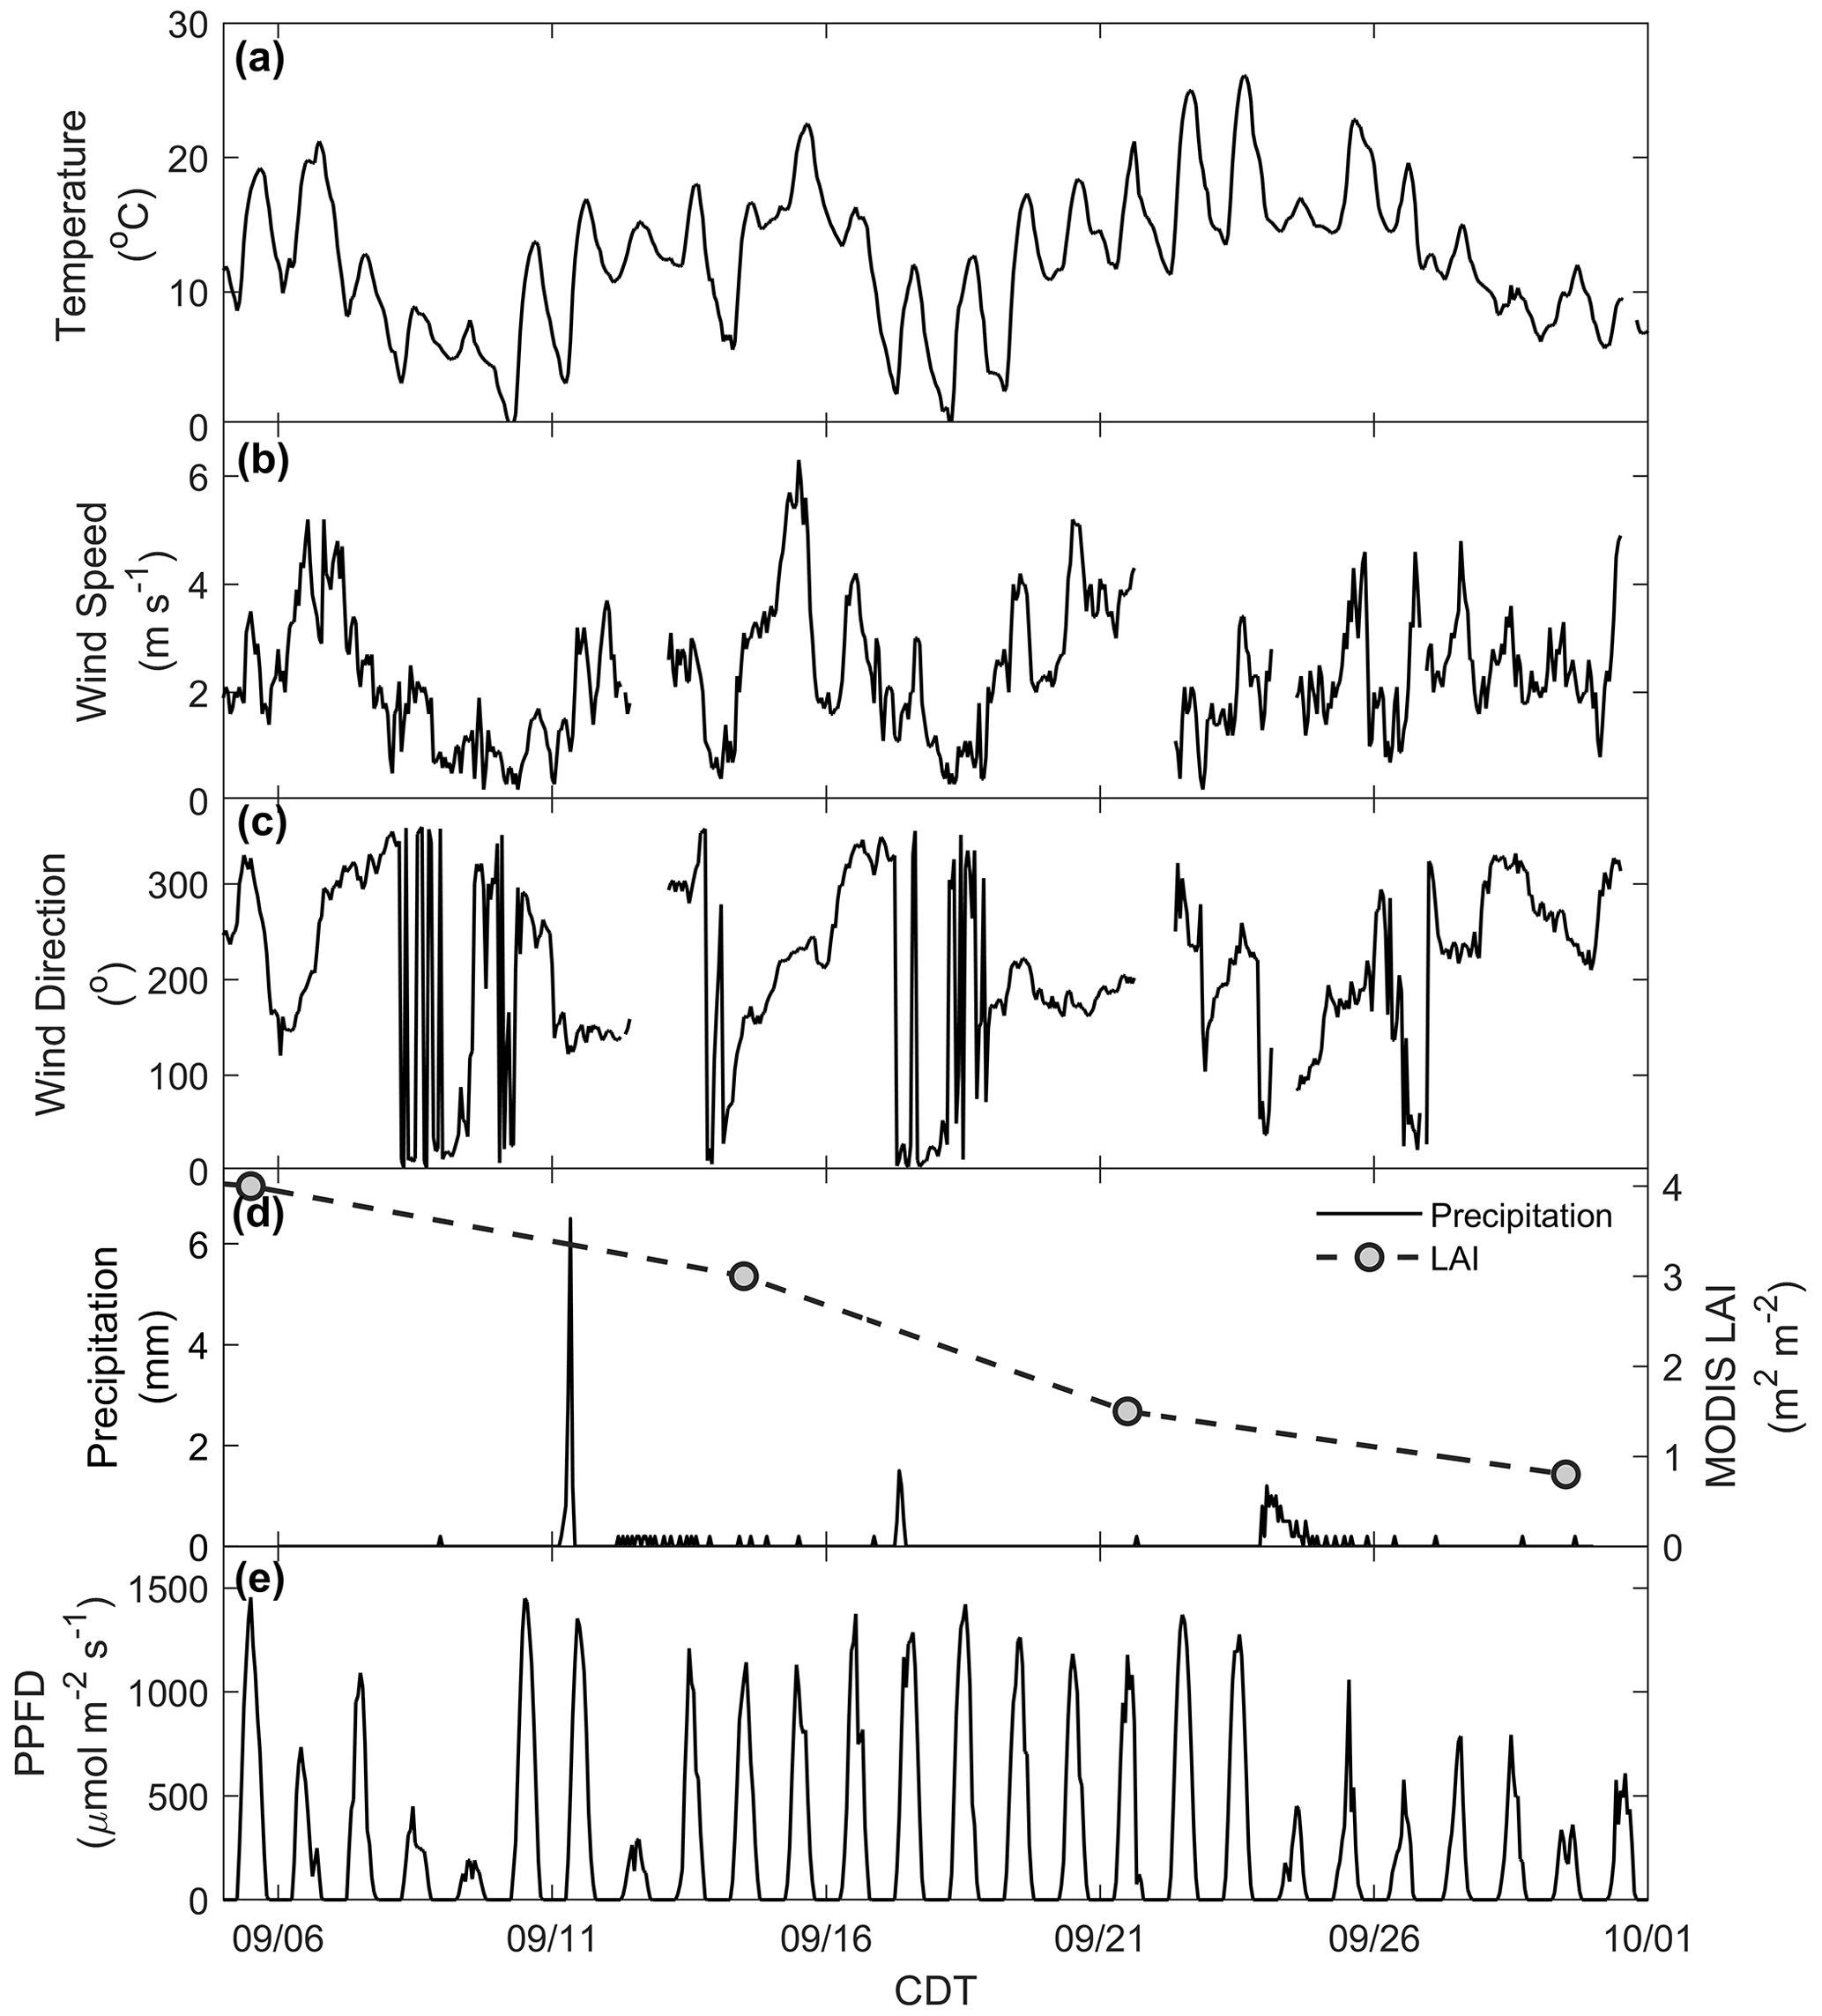
Figure 1Meteorology at the measurement site: (a) temperature, (b) wind speed, (c) wind direction, (d) precipitation (black line) and LAI (grey dots), and (e) photosynthetic photon flux density (PPFD).
3.1.2 Mixing ratios of ambient chemical species
We first examine the impact of physical and meteorological changes that occurred during this period on the mixing ratios of reactive terpenes (MT, SQT, and isoprene), DMS, and O3 (Fig. 2). Uncertainties for all mixing ratios are presented as shaded regions and were calculated by propagating the uncertainty from the fraction lost to the inlet (Fig. S1), accuracy in calibration standards and mass flow controllers, and the standard deviation (1σ) in field calibrations. This produced average uncertainties of 11.1 %, 29.0 %, 12.0 %, and 8.0 % for ΣMT, ΣSQT, DMS, and O3, respectively. The average isoprene uncertainty was 17.1 % during the day and 35.8 % at night and is further discussed in this section.
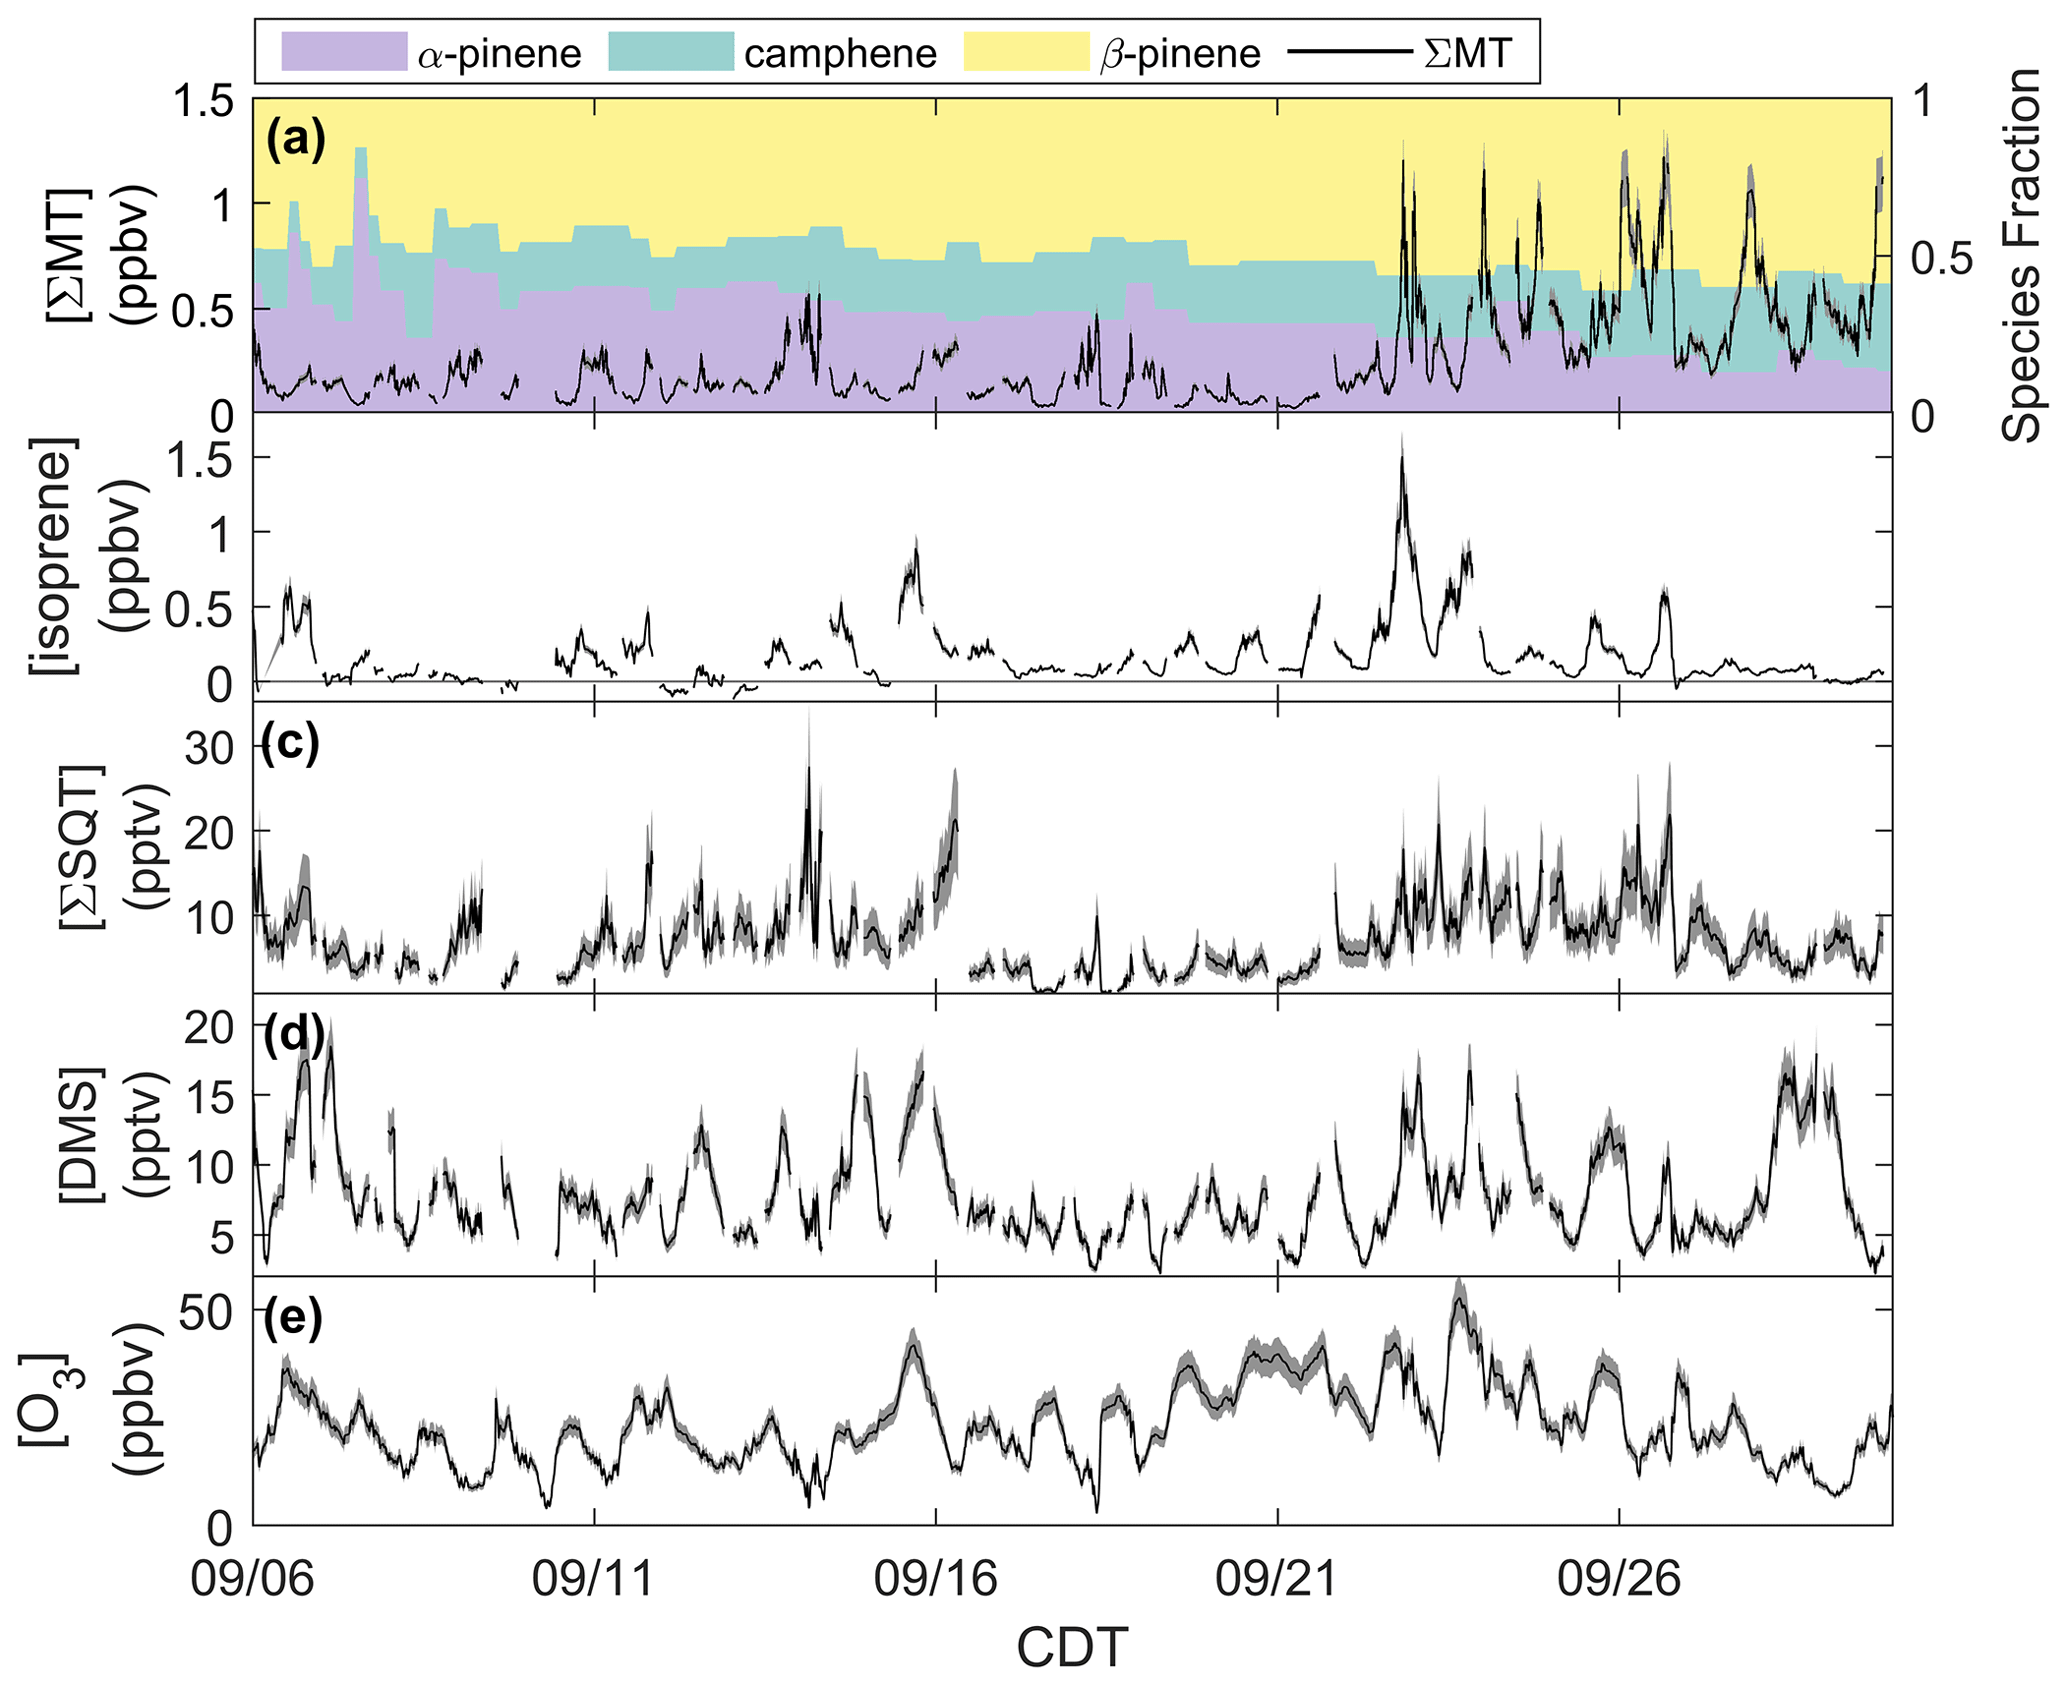
Figure 2Mixing ratios of (a) ΣMT, (b) isoprene, (c) ΣSQT, (d) DMS, and (e) O3 from 6–30 September 2020 with shaded uncertainties. Leaf senescence generally began around 16 September, and leaf abscission began around 21 September.
Figure 2a shows the time series of summed MT (ΣMT) (black line) as detected through the MH+ ion ( 137.1325). Concentrations of ΣMT peaked in the evening due to late-afternoon emissions and buildup thereafter due to reduced vertical mixing and oxidative removal. We observe an increase in ΣMT concentrations following 21 September, most likely due to senescing leaves, as we will discuss in Sect. 4.2. From on-site visual assessment, senescence defined by changes in deciduous leaf color (and thus the end of the growing season) in this region generally began around 16 September, and leaf abscission began around 21 September (Fig. S4). In addition, MODIS LAI decreased by more than half (from 4 to 1.5 m2 m−2) by 21 September, indicating a large portion of the region's leaf area losing greenness. Since this region is a mixed forest with species of varying lengths of developmental cycles, these assessments are approximations based on a few studied trees and may not be reflective of individual species that undergo mid- or late-autumn senescence. Following the beginning of leaf abscission of deciduous trees, higher concentrations of MT were observed. Prior to 21 September, peak daily mixing ratios were regularly below 0.5 ppbv but were above 1.0 ppbv following 21 September, peaking at 1.4 ppbv. Average concentration diel profiles for all species in Fig. 2 for periods before and after 21 September are presented in Fig. S5 to highlight these changes. The campaign-average [ΣMT] was 0.26 ppbv, which is close to autumn measurements of [ΣMT] at the SMEAR II station in a boreal coniferous forest in Hyytiälä, Finland (0.25 ppbv), where the latter would be expected to have a higher density of MT-emitting species (Hakola et al., 2003).
Data show that the speciation of MT changed throughout September (Fig. 2a). The colored regions in Fig. 2a show fractions of the major identified MT isomers using the GC-Vocus. Prior to senescence, α-pinene initially comprised on average ∼40 % of the total emissions, ∼32 % of the total MT emissions during senescence, and decreased to ∼20 % during abscission. β-pinene showed a slight increase in MT fraction throughout the month, increasing from 44 % to ∼57 % as leaves moved from the mature to abscission stages, respectively. Similarly, camphene also showed an increase in relative proportion, shifting from mature (16 %) to senescent (23 %) stages. Speciation from the GC-Vocus is described more in Sect. 3.2.
Figure 2b shows mixing ratios of isoprene, as determined by the ion ( 69.06988), throughout the month of September. The signal required correction due to the presence of n-aldehyde fragments in the chromatogram. Although some of the n-aldehyde contribution in the chromatogram was determined to be from reactions of ozone with the system sorbent tubes due to unconditioned Na2SO3 used in the oxidant trap (Sect. 3.2), n-aldehydes were also observed in RT-Vocus measurements, and the known fragmentation of these n-aldehydes to required a correction. Corrections were performed by taking advantage of the consistency in signal ratios of fragment ions to parent ions (M+) across the GC- and RT-Vocus (as in α-pinene, Fig. S6). To correct the for n-aldehydes, the peak area ratio of to M+ of heptanal, octanal, and nonanal were multiplied by the M+ RT-Vocus signal to get the corresponding n-aldehyde signal (Fig. S7). The sum of these n-aldehyde signals was then subtracted from the total signal to get an “isoprene-only” signal, which was then calibrated for isoprene from in-field calibrations. The contribution of n-aldehydes made up 36 % (148 ppt correction) and 59 % (140 ppt correction) of the daytime and nighttime signal, respectively. S3 describes this correction and associated uncertainties in more detail with uncertainties calculated from accuracies in calibrant standards and mass flow controllers, as well as 1σ uncertainty of isoprene calibration factors and the GC peak area to M+ ratio. The daily peak in isoprene concentrations was variable, ranging from 0.13–1.1 ppbv, and the campaign average was 0.16 ppbv, a value between year-averaged measurements of isoprene in a northern temperate forest in MI in 2001 and 2002 (0.1 and 0.5 ppbv, respectively) (Karl et al., 2003). The two forests may not serve as direct comparisons, but comparison to the MI forest range does show the high interannual variability of isoprene in mixed northern temperate forests. Figure 2c shows the mixing ratios of ΣSQT detected at ( 205.1951) and calibrated for β-caryophyllene. There is no clear diurnal cycle in ΣSQT, and the campaign average [ΣSQT] was 7.2 pptv, a value over a factor of 6 lower than late-summer observations in a primarily coniferous forest (∼44 pptv) where mixing ratios are expected to be higher and may serve as an upper bound (Bouvier-Brown et al., 2009).
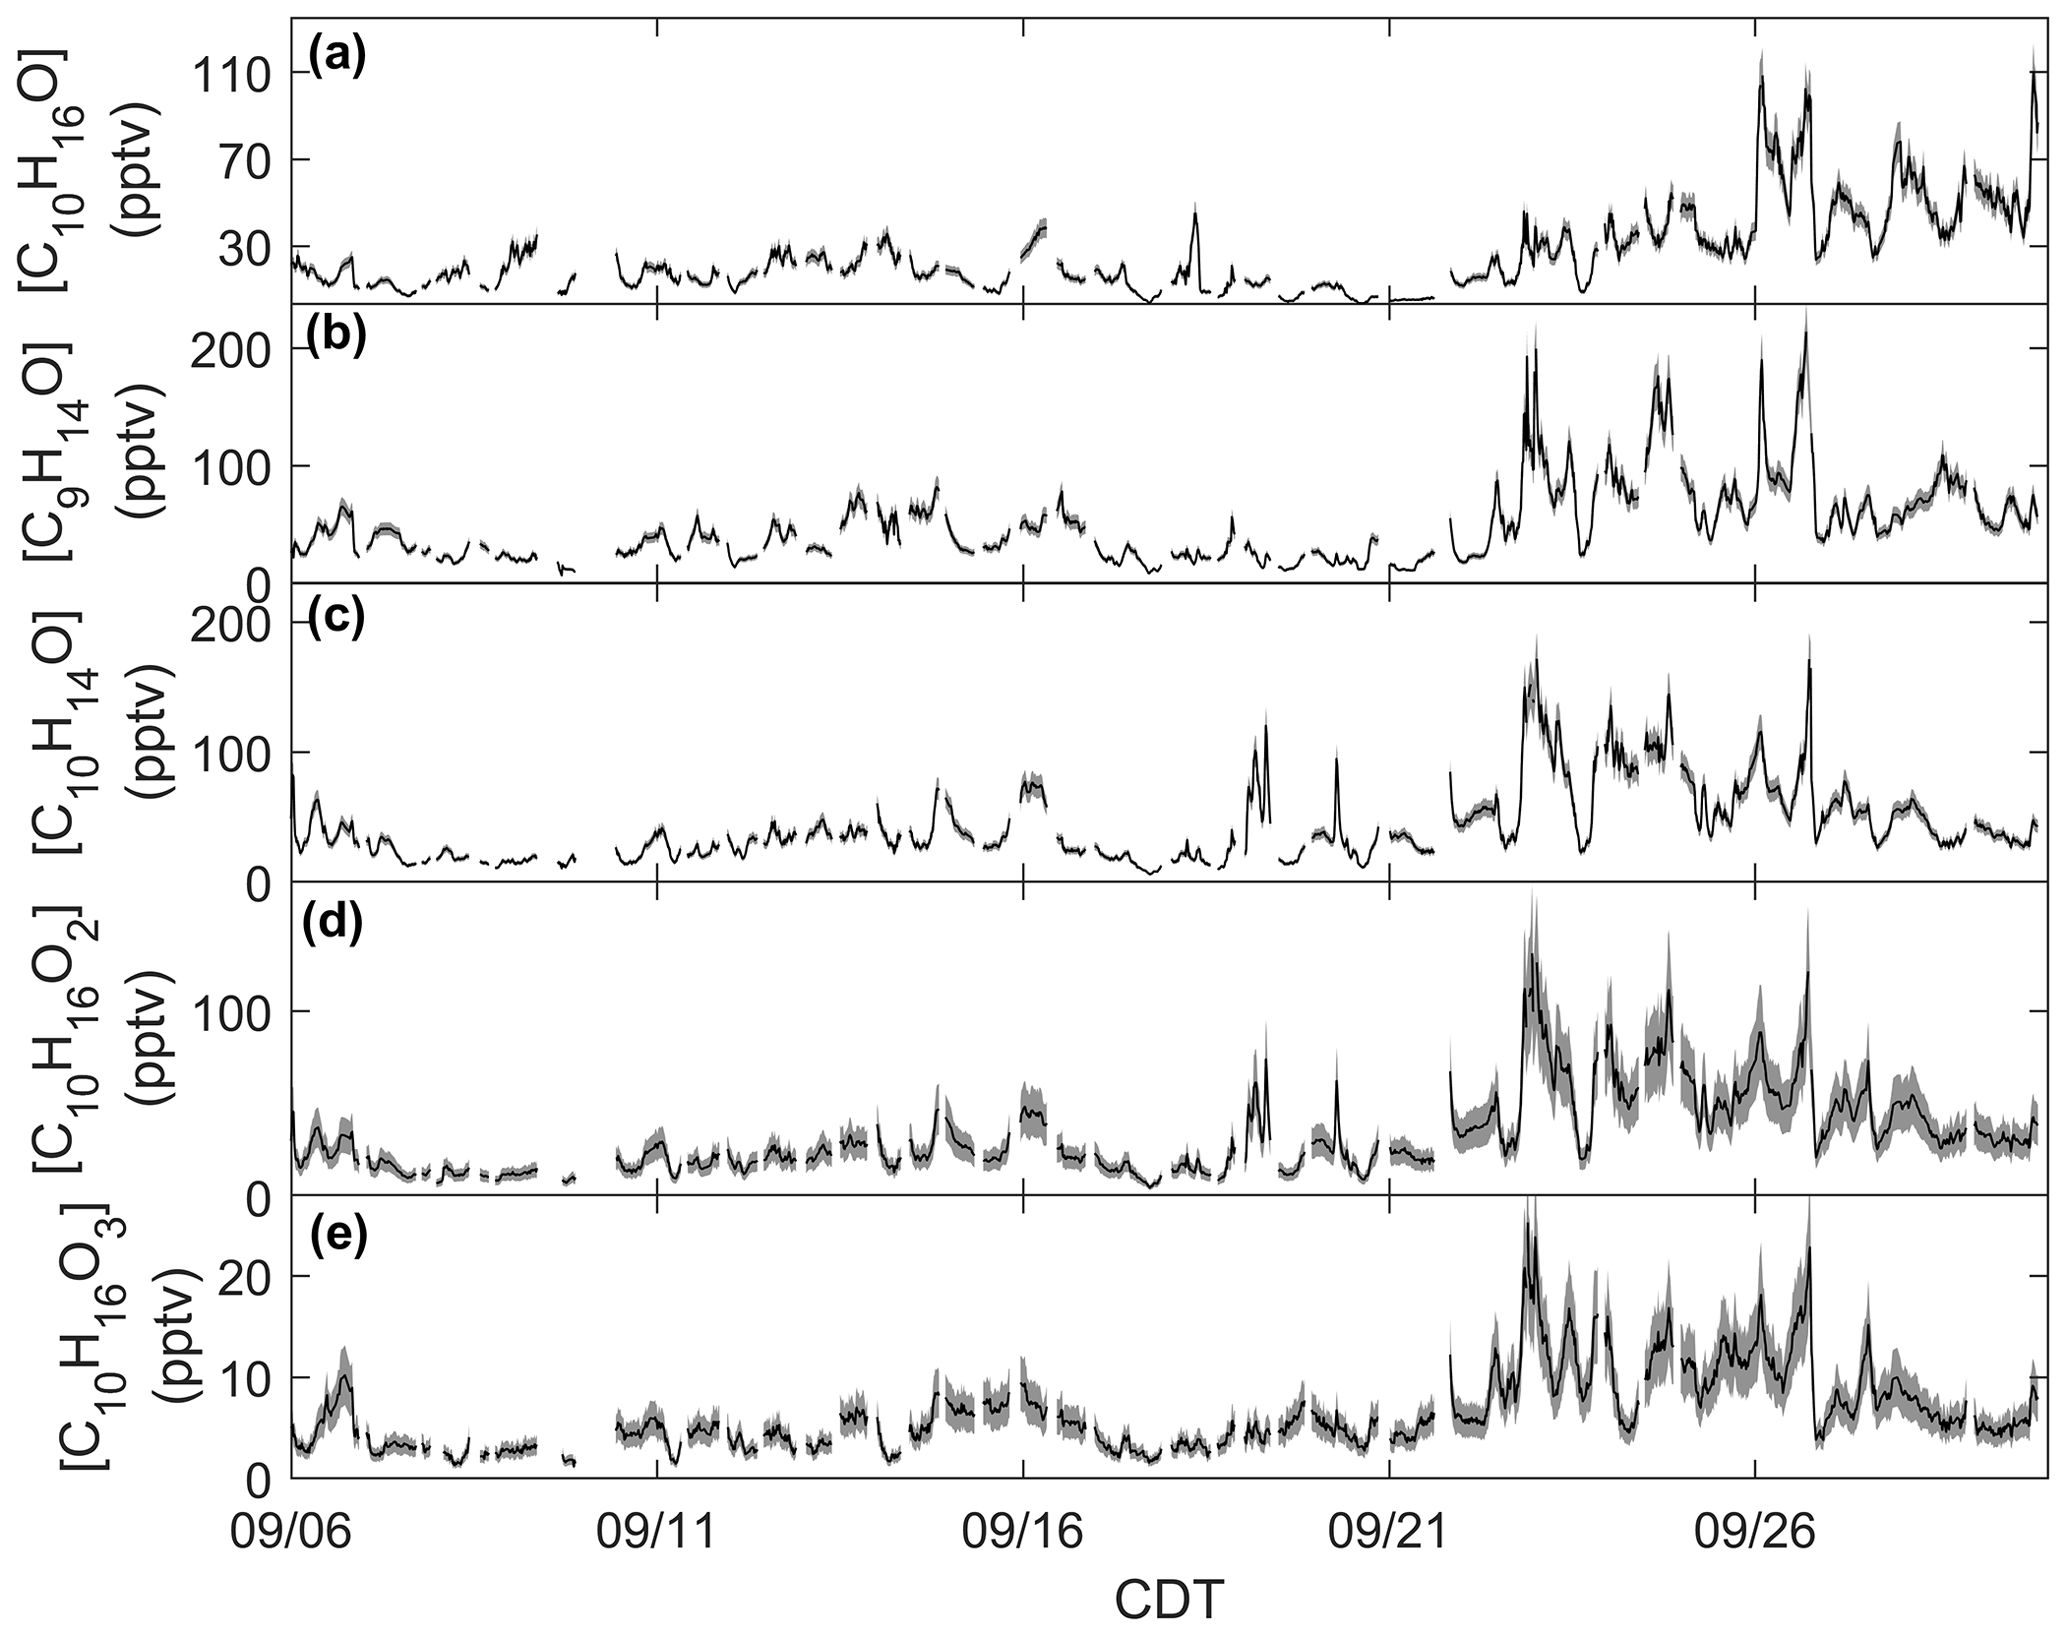
Figure 3Time series of monoterpene oxide concentrations: (a) C10H16O calibrated for camphor, (b) C9H14O calibrated for nopinone, (c) C10H14O calibrated for thymol, and (d) C10H16O2 and (e) C10H16O3 calibrated for cis-pinonic acid. Measurement uncertainties are presented as shaded regions.
Observations of DMS at CNNF, detected as C2H7S+ ( 63.0263) in the Vocus, are presented in Fig. 2d. The diel profile in DMS is consistent, displaying an evening maximum around 21:00 CDT and a minimum in the early morning (∼ 05:00–07:00 CDT). This profile of evening buildup is indicative of a compound that has a late-afternoon source that extends into the evening. The short lifetime of DMS in the early morning suggests removal due to boundary layer mixing or advection, since the lifetime of DMS against OH is too long to account for this loss (∼1 d). DMS at CNNF is low, with an average mixing ratio of 7.7 pptv for the entire observation period. There was no dependence of [DMS] on leaf stage or LAI, suggesting that DMS may not be sourced from plants or are from plants that did not show a change in LAI. Vertical mixing ratio profiles of terrestrial DMS have been recorded at an Amazon Forest between September 2010–January 2011, with mixing ratios < 160 pptv. In that study, there was a clear enhancement of [DMS] in the late afternoon and at warmer temperatures, and there was a strong nocturnal accumulation within the canopy and closer to the forest floor, indicative of light-independent soil emissions (Brown et al., 2015). Temperate coniferous ecosystems can have DMS sourced from trees. Vertical distributions of DMS in a loblolly pine forest near Atlanta, Georgia, also showed enhanced [DMS] closer to the forest floor and at night (∼12 pptv) compared to the day (∼4 pptv) (Berresheim and Vulcan, 1992), with abundances similar in magnitude to this study. The authors of the Georgia study attribute this distinction to reduced photooxidation at night and concluded that DMS emissions were from the pine trees. However, soil emissions, although highly dependent on microorganisms in the soil, have been proven to provide a small source in other ecosystems (Goldan et al., 1987; Banwart and Bremner, 1975; Yang, 1996) and can also explain the magnitude of observed mixing ratios at the site. Without leaf-level or soil chamber measurements of DMS we cannot definitively state whether DMS comes from the soils or trees.
Figure 2e shows half-hourly averaged mixing ratios for O3 as measured by the photometric analyzer. The average [O3] for the whole study was 23 ppbv, and the day with the highest measured [O3] was 23 September 2020, a day that also experienced the peak in ambient temperature (26 ∘C). There was a period of sustained [O3] maintaining >20 ppbv from 19–25 September, which correlates with periods of higher temperature in that time range.
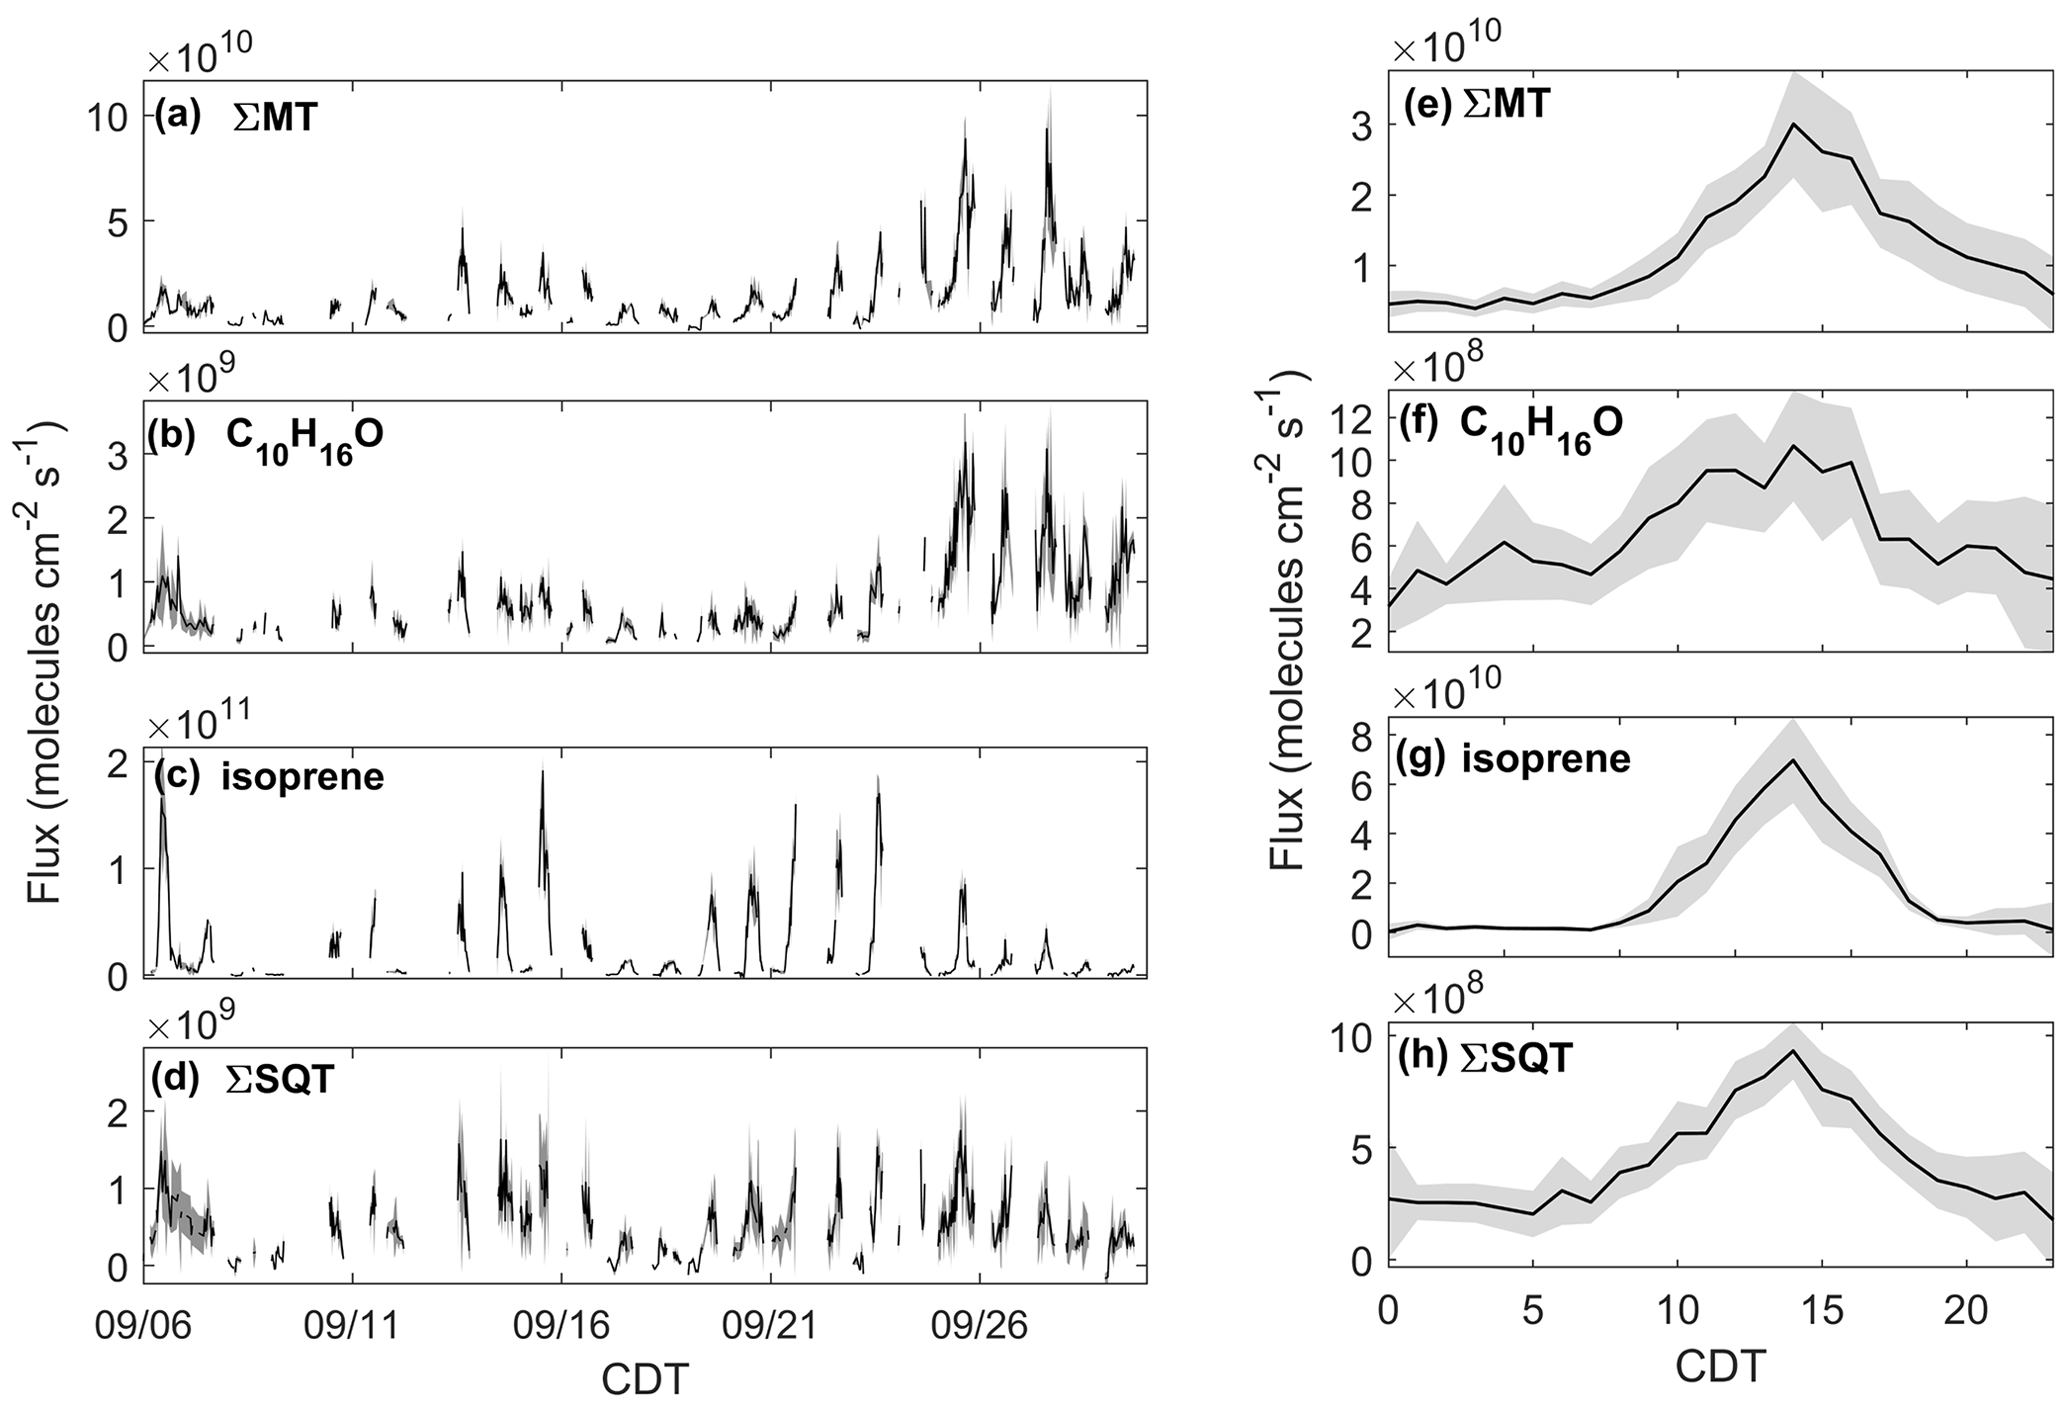
Figure 4Observed fluxes of (a) ΣMT, (b) C10H16O, (c) isoprene, and (d) ΣSQT from 6–30 September 2020 with shaded uncertainties. Also presented are diel profiles of (e) ΣMT, (f) C10H16O, (g) isoprene, and (h) ΣSQT. Diel profile shaded regions are 95 % confidence intervals.
Monoterpene oxides exhibited enhancements in ambient mixing ratio during the seasonal transition. Mixing ratios of the monoterpene oxide C10H16O, detected as C10H17O+ ( 153.1638) and calibrated for as camphor, exhibited a similar behavior as the time series of [ΣMT] (Fig. 3a). Following 21 September, mixing ratios are enhanced on average by over a factor of 2 compared to the period before 21 September. This suggests that C10H16O and ΣMT follow the same mechanisms of primary emissions and/or that C10H16O is an MT oxidation product. This type of observation from a mixed temperate forest has been published before: observations from a mixed forest in New England show that summertime emissions of C10H16O were closely related to those of ΣMT, although emissions were negligible by September (McKinney et al., 2011). A recent study using a Vocus PTR-ToF-MS system at the coniferous Landes Forest found the diel profile of MT to be consistent with C10H17O+, with an average evening [C10H16O]:[ΣMT] of 0.03, compared to 0.08 in this study. The authors suggested that C10H16O was partially sourced from directly emitted camphor or an MT oxidation product (Li et al., 2021), although at the CNNF site there are few species that directly emit camphor and those that do (north white cedar, white spruce) emit camphor in low amounts (Helmig et al., 1999). Figure 3 provides concentrations of MTOs measured with the RT-Vocus at a collection of other ions that were determined to be lightly oxidized products of MT oxidation (C9H15O+, C10H15O+, , ). Since there was no in-field calibration for monoterpene oxides, we approximate uncertainties for C9H15O+, C10H15O+, and C10H17O+ to have the same relative uncertainty as ΣMT and and to have the same relative uncertainty as ΣSQT based on assumptions of volatility. The C9H15O+ ion ( 139.1117) is commonly assigned as nopinone, one of the main products formed during β-pinene ozonolysis (Atkinson and Arey, 2003; Lee et al., 2006a). In this study the ion was calibrated for nopinone and the identity confirmed by GC observations (Sect. 3.2). Nopinone had the highest recorded concentration among the observed monoterpene oxides. Other common assignments of observed monoterpene oxides are the major α-pinene ozonolysis product pinonaldehyde (C10H16O2), which can appear as a parent ion ( 169.1223; ) or as a fragment ( 151.1118; C10H15O+), and pinonic acid ( 185.1172; ), a minor product of α- and β-pinene ozonolysis (Atkinson and Arey, 2003). The C10H15O+ ion was identified by GC measurements to be primarily thymol, but and could not be identified due to retention times outside of our collection window. All monoterpene oxides in Fig. 3 show an enhancement in concentrations following 21 September, suggesting either a similar physical mechanism in the enhancement of emissions or increases due to the oxidation of concurrently increased MT. Concentration diel profiles for these monoterpene oxides for periods before and after 21 September are presented in Fig. S8 to highlight changes due to the seasonal transition.
3.1.3 Eddy covariance fluxes of BVOCs
The effect of the seasonal transition on forest–atmosphere exchange of BVOCs is shown in Fig. 4, which presents the quality-controlled fluxes of ΣMT, C10H16O, ΣSQT, and isoprene. FΣMT (Fig. 4a) regularly exhibited daytime maxima less than 2.5×10¹⁰ molec cm−2 s−1 prior to 21 September (Fig. 4a). Following 21 September, emissions were enhanced (maximum 9.3×10¹⁰ molec cm−2 s−1) and were in agreement with observed mixing ratios during the same time period. There was no strong increase in temperature during this period (Fig. 1a), indicating that factors other than leaf temperature control emissions of ΣMT following leaf senescence. While there is a source area shift for FΣMT from the west half to primarily southwest for pre- and post-21 September, respectively, it is unclear if this shift caused emission enhancements, since both footprints overlap according to flux footprint prediction (FFP) parameterizations (Kljun et al., 2015) (Fig. S9). The diurnal profile of FΣMT (Fig. 4e) shows that emissions follow a temperature profile, with emissions peaking in the late afternoon (13:00–15:00 CDT). The only other measurement of FΣMT in this region was in July 1993 with values ranging from 0.46–9.1×10¹⁰ molec cm−2 s−1 based on leaf-level measurements and estimates of area foliage densities (Geron et al., 1994; Isebrands et al., 1999). Based on a synthesis of MT speciation in the US, a high-end estimate of FΣMT in northern WI would be 1.2×10¹¹ molec cm−2 s−1 (Geron et al., 2000).
The fluxes of ΣMT and C10H16O are closely related, with enhanced by nearly a factor of 2.5, on average, following 21 September (Fig. 4b). A regression of and FΣMT provides an r2 of 0.83 and a slope of 0.041 (, showing that the two processes are correlated (Fig. S10). Branch enclosure measurements of ponderosa pine trees at Manitou Forest in CO, USA, from 21 August–4 September 2008 showed consistent emission ratios of C10H16O:MT of ∼0.1 (Kim et al., 2010), suggesting direct emissions of C10H16O. The New England canopy-scale flux study over a mixed temperate forest recorded a summertime C10H16O:MT of ∼0.03 (McKinney et al., 2011). This highlights the observed range in this ratio potentially due to ecosystem differences or in-canopy loss of C10H16O. However, in the McKinney et al. (2011) study, and FΣMT were not correlated (r2=0.18).
Fisoprene exhibited high day-to-day variability (Fig. 4c; daytime maxima: 0.067–1.9×10¹¹ molec cm−2 s−1) and was not enhanced after 21 September, consistent with presumed cessation of in situ leaf synthesis. The variability in Fisoprene was partially controlled by ambient temperature, as observed by Fisoprene enhancement on warmer days (e.g., 6 September; 22–23 September) and suppression on colder days (e.g., 8–9 September). The diurnal cycle of Fisoprene (Fig. 4g) peaked with air temperature and was low or zero outside of daylight hours, implying that parameterizations of isoprene emissions based on sunlight and temperature are appropriate during this season. Since there was no measurable flux from the parent masses of heptanal, octanal, and nonanal, we are confident that there is minimal to no added error from corrections to the isoprene signal, since the aldehyde signals do not vary with w and therefore should not contribute to flux. Previous area-averaged fluxes in this region from the July 1993 study, where leaf temperatures reached 35 ∘C and caused high emissions, were 2.8×10¹¹ molec cm−2 s−1, providing an upper bound for the observations here.
Figure 4d presents, to our knowledge, the first canopy-scale fluxes of SQTs in a mixed temperate forest. Similar to Fisoprene and FΣMT, FΣSQT also demonstrated a diel temperature dependence, although the day-to-day variability was not as pronounced (Fig. 4d). In addition, the time series of FΣSQT was not dependent on leaf stage, and we did not observe an enhancement in emissions post-21 September. Daily maxima of FΣSQT ranged from 0.028–1.8×10⁹ molec cm−2 s−1. No measurements of FΣSQT have been performed near this site for comparison, although branch enclosure measurements of summertime north temperate pine suggest canopy-scale SQT emissions up to as much as 2.5×10¹⁰ (Holzke et al., 2006), providing an upper bound nearly 2 orders of magnitude larger than observations. Depending on the chemical lifetime of the dominant species in observed SQTs, the magnitude and profile of FΣSQT can be influenced by in-canopy ozonolysis. A study measuring above- and within-canopy ambient concentrations of SQTs in the Amazon showed that 46 %–61 % of SQTs by mass undergo in-canopy ozonolysis (Jardine et al., 2011), and a multi-layer gas dry deposition model using observations from the SMEAR II station showed that ∼70 % of SQTs are removed within the canopy due to chemical oxidation. We estimate the impact of within-canopy ozonolysis on FΣSQT in Sect. 4.1.
The error bars presented in Fig. 4a–d were determined through calculations of flux LoD (Sect. 2.3). The campaign average uncertainties for MT, C10H16O, isoprene, and SQT were 25 %, 33 %, 27 %, and 37 %, respectively. Table 1 provides a summary of observed mixing ratios and fluxes throughout the study.
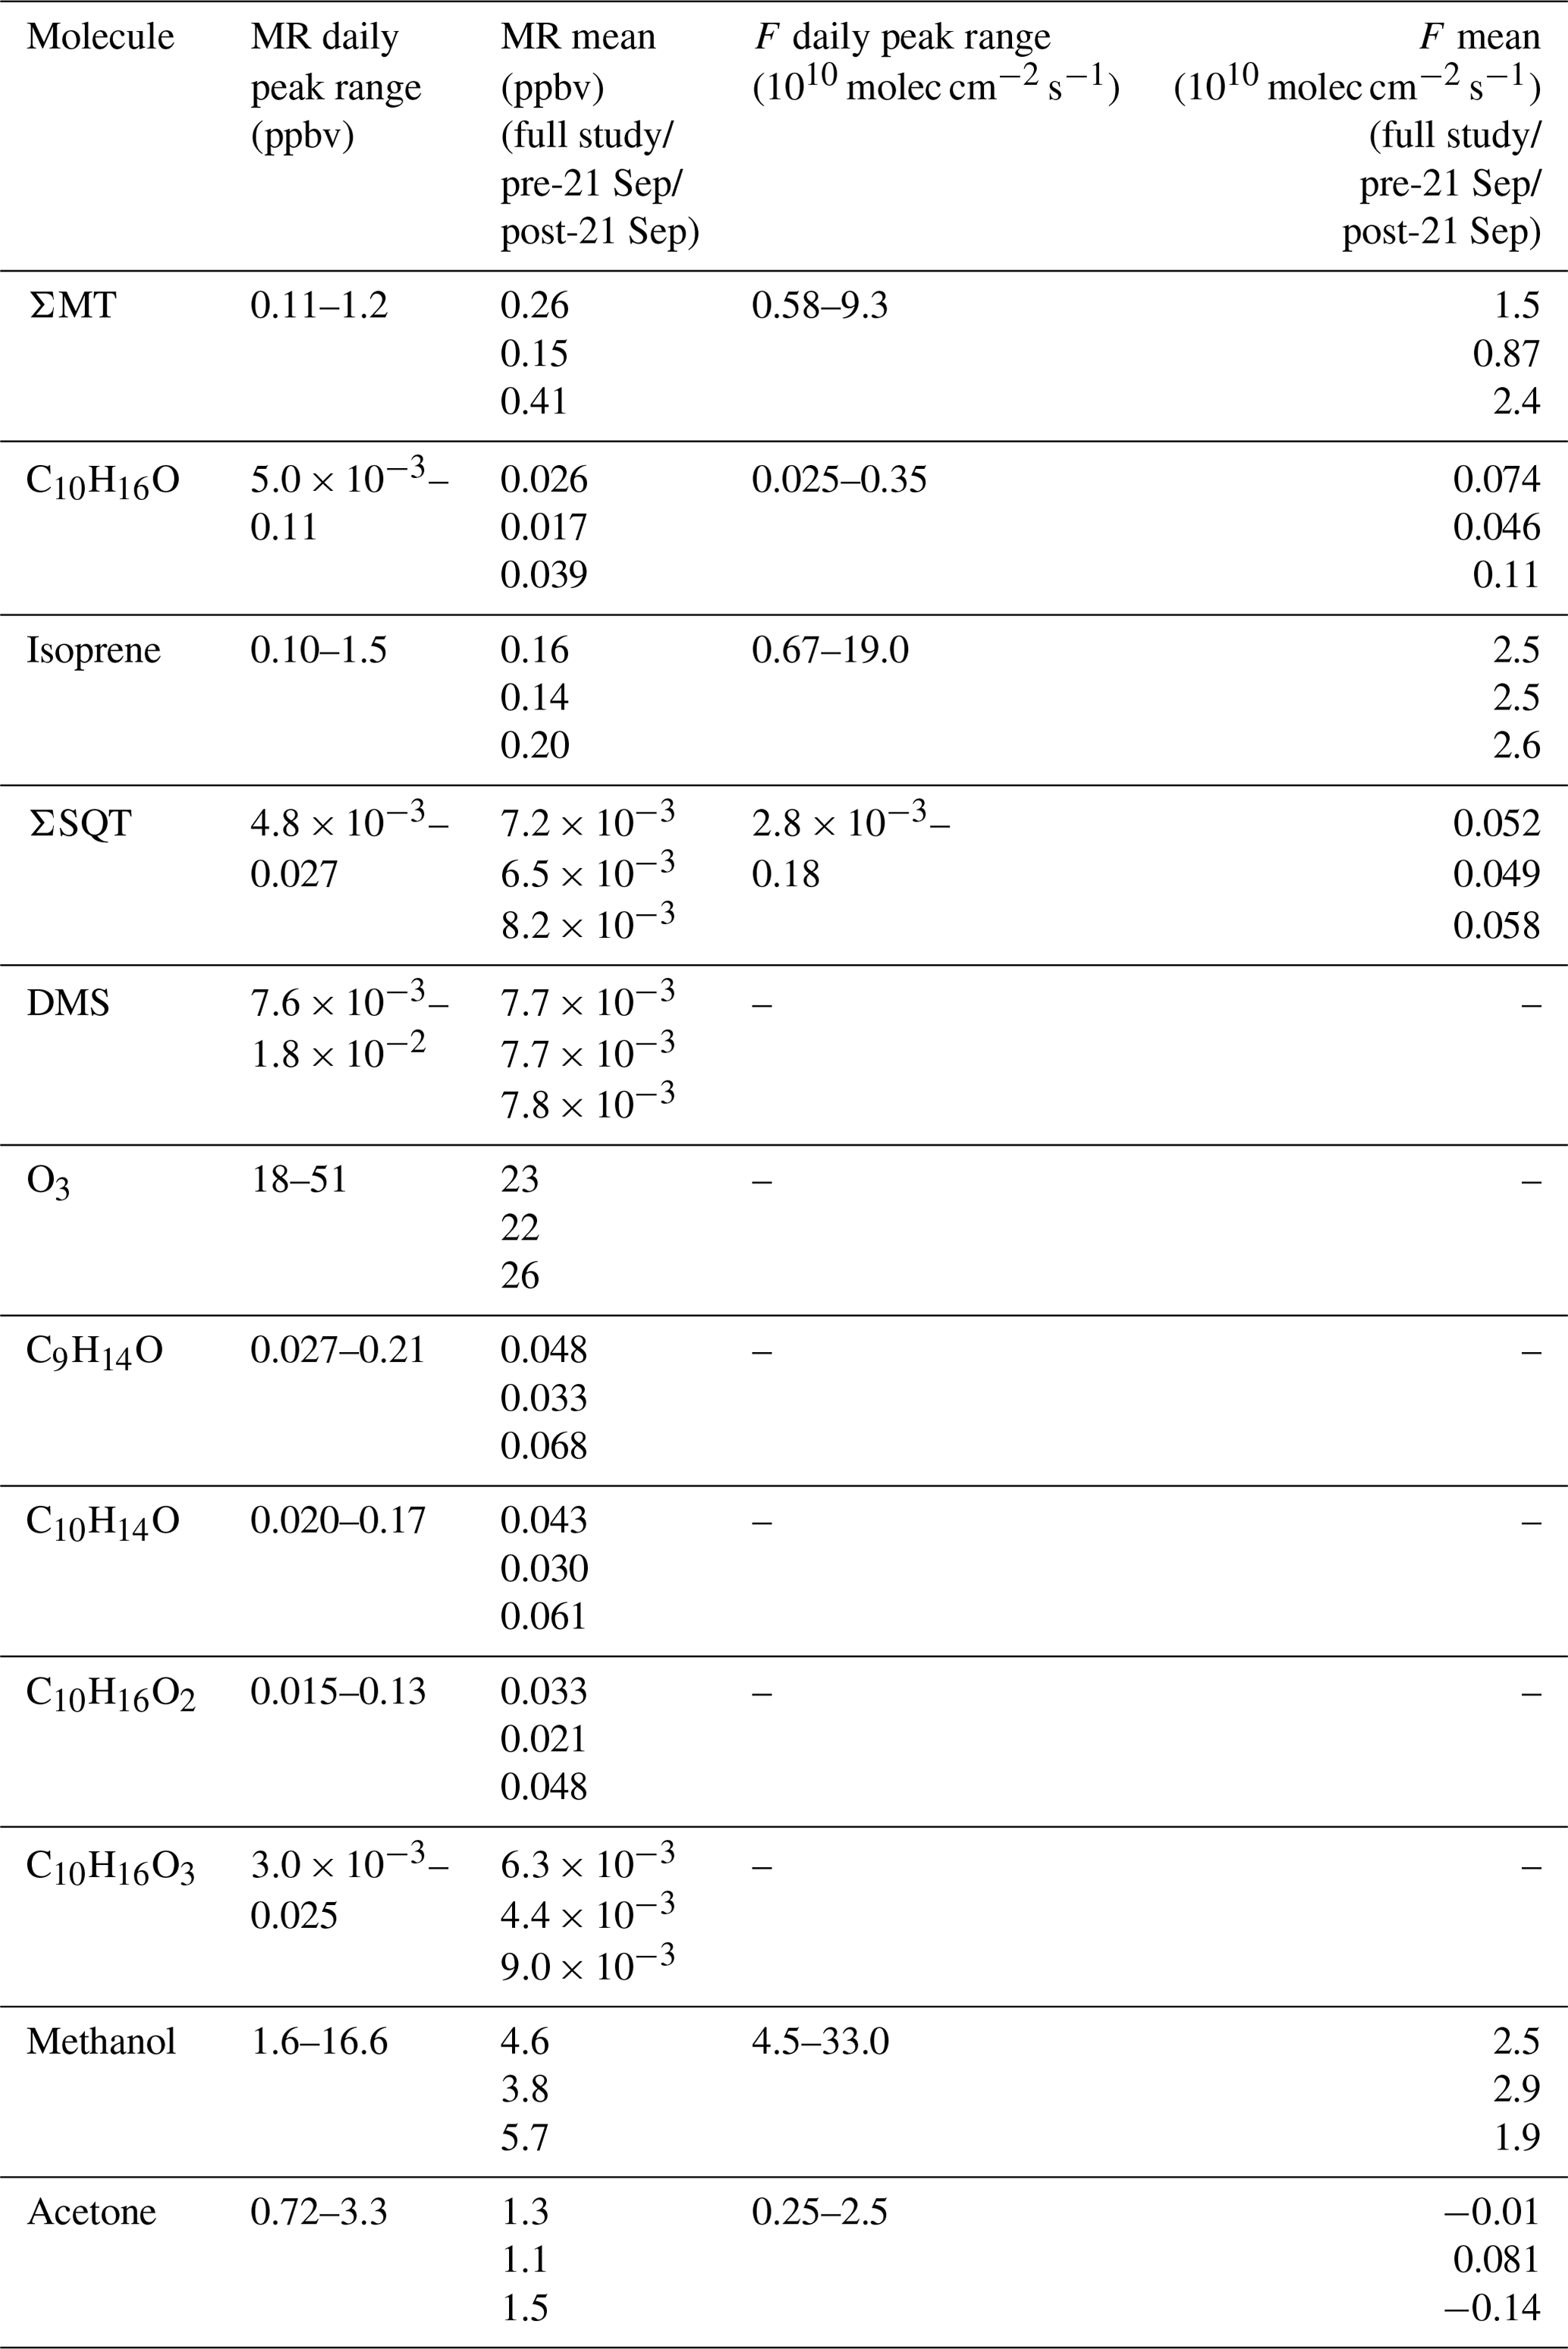
Table 1Summary of mixing ratios (MR) and fluxes (F) of select compounds during the PEcoRINO study.
3.2 GC-Vocus observations of BVOCs
Use of the GC-Vocus allowed for speciation of MS peaks into the isomers that contribute to the total signal of product ions. Throughout this section, GC field observations are compared to either the retention time (RetT) of field-calibrated compounds (Fig. S11) or retention indices (RIs) for compounds not directly calibrated in the field that required post-field calibrations (Fig. S12). Uncertainties in GC-Vocus mixing ratios were calculated using accuracy in calibration standards and mass flow controllers, as well as the 1σ in calibration factors, resulting in uncertainties of 29.6 % and 30.0 % for ΣMT and isoprene, respectively.
Figure 5a shows an example chromatogram of , the MT product ion. There were three major peaks in the chromatogram (Fig. 5a): α-pinene (RetT = 488 s, RI), camphene (RetT = 504 s, RI), and β-pinene (RetT = 523 s, RI), where RIobs. is the observed RI from the experimentally determined fit of RetT vs. RI. All other peaks in the chromatogram accounted for <5 % of the total peak area and were thus considered negligible. Due to the ubiquity of α-pinene and β-pinene from tree and forest floor emission data, we hypothesized that these compounds would be present at this forest. Camphene was expected, since it was observed from seven tree species common to CNNF at a site approximately 80 km southwest of Park Falls, WI, in Rhinelander, WI (Helmig et al., 1999). Figure 6a shows a regression of the RT-Vocus ΣMT (black line) and GC-Vocus ΣMT as the sum of α-pinene, camphene, and β-pinene peak areas. There is excellent agreement between the two methods (slope = 0.77, r2=0.85), highlighting that the three monoterpenes make up the majority of the at this site in September. Bootstrapped confidence intervals of the slope provide a range of 0.66 to 0.86. Since the RT-Vocus ΣMT was calibrated in the field using only α-pinene, we can suspect that the underreporting of RT-Vocus concentrations from is partially from higher fragmentation patterns of the other MT isomers.
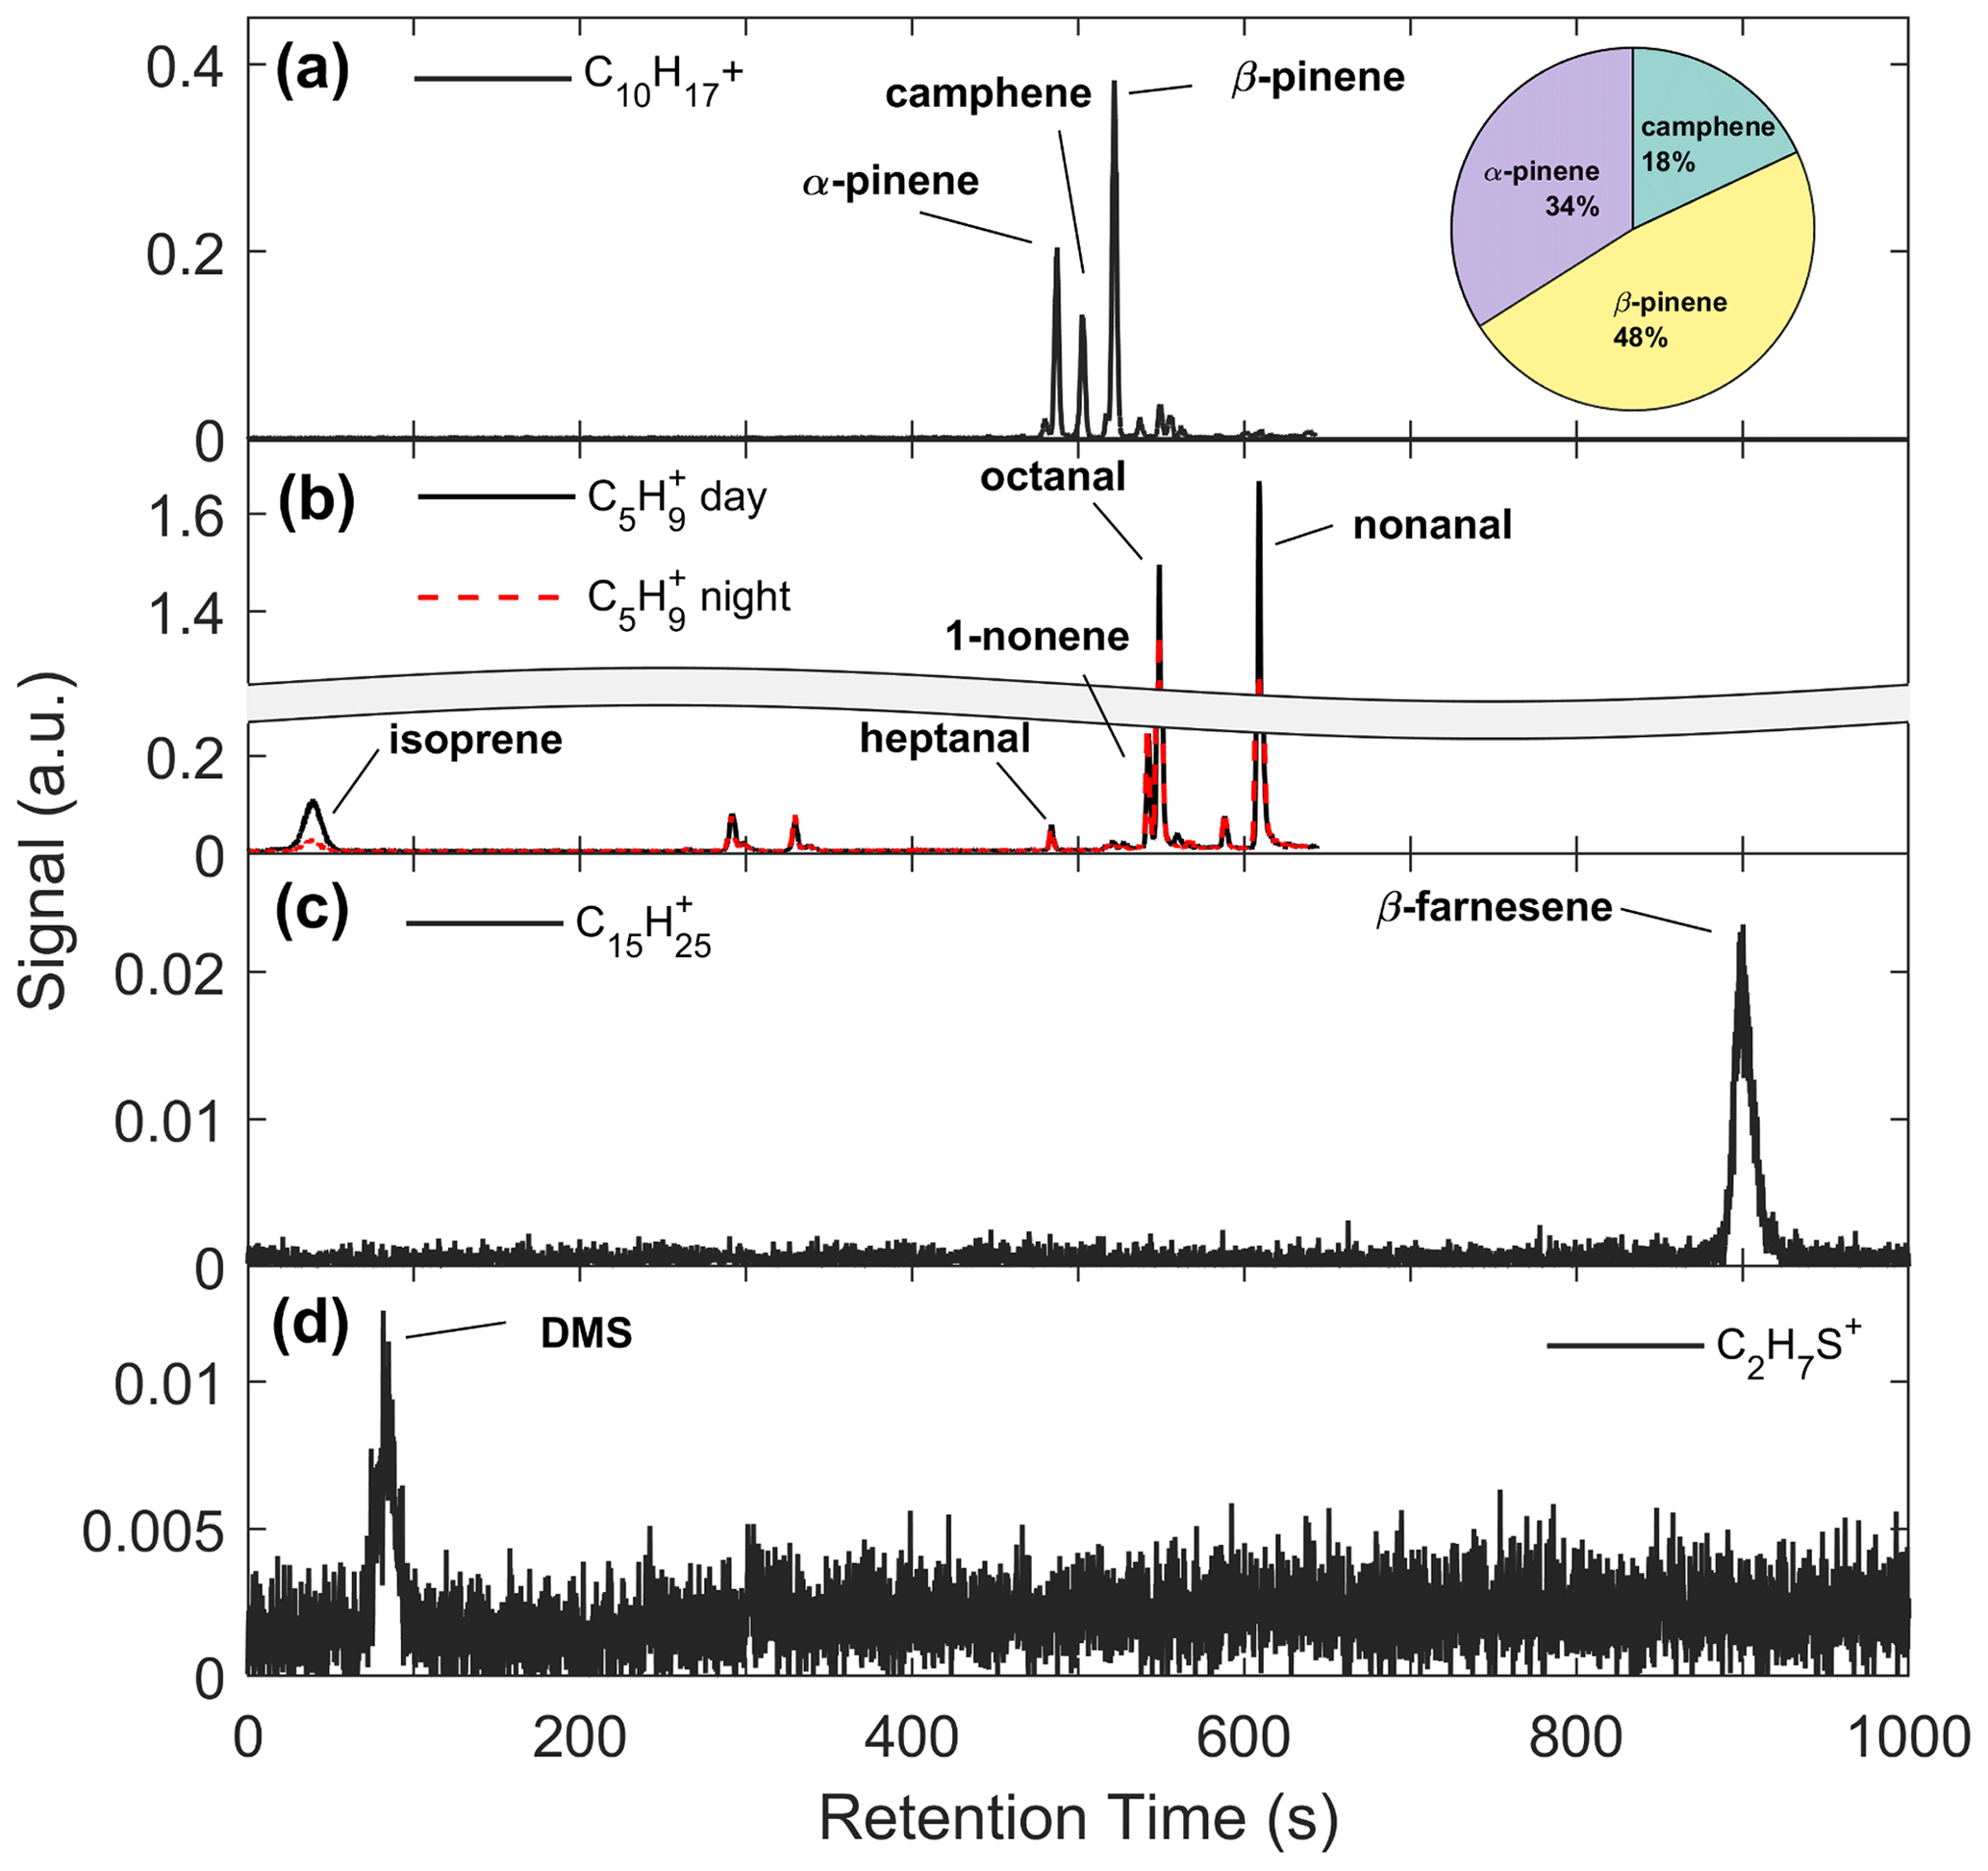
Figure 5Representative chromatograms of (a) , (b) , (c) , and (d) C2H7S+ with identified isomers.
Figure 5b shows the chromatogram of from representative daytime (solid black line) and nighttime (dashed red line) collections. Both day and night chromatograms show isoprene contributing to a small amount (<10 %) of the total signal, with major contributors being octanal (RetT = 549; RI; RIlit=1001) and nonanal (RetT = 609; RI; RIlit=1102) (Adams et al., 2006; Merle et al., 2004). However, there is a clear distinction between daytime and nighttime isoprene, while the other peaks remain relatively unchanged. This suggests the majority of the non-isoprene species contributing to the signal in this chromatogram are formed from reactions of the sorbent tube material with ambient O3, since these products are well known to form this way (J. H. Lee et al., 2006). Post-field laboratory experiments confirmed that n-aldehydes are produced from sample trap ozonolysis and depend on the age and condition of Na2SO3 in the oxidant trap (S4). Since we calculate some of the non-isoprene signal (Sect. 3.1), we conclude that there was a relatively small amount of non-isoprene species either produced in the gas phase or from surface-inlet reactions, but the majority of the GC non-isoprene signal is produced internal to the GC system. For future use of this GC-Vocus system, we suggest regularly replenishing the oxidant trap when enhanced n-aldehyde peaks are observed, using Na2SO3 conditioned just prior to use.
The regression of isoprene quantified by the RT-Vocus and the GC-Vocus is shown in Fig. 6b. There is good agreement between the data (r2=0.67, slope = 0.68), with bootstrapped confidence intervals of the slope providing a range of 0.57 to 0.84. This shows that our correction method is a viable solution for calculating only isoprene from and would be useful for other studies where fragments may contribute to a portion of a signal. Since it is expected that the delivered calibrant varies by ±30 %, the slope of RT- to GC-Vocus concentrations is within the uncertainty of our calibration.
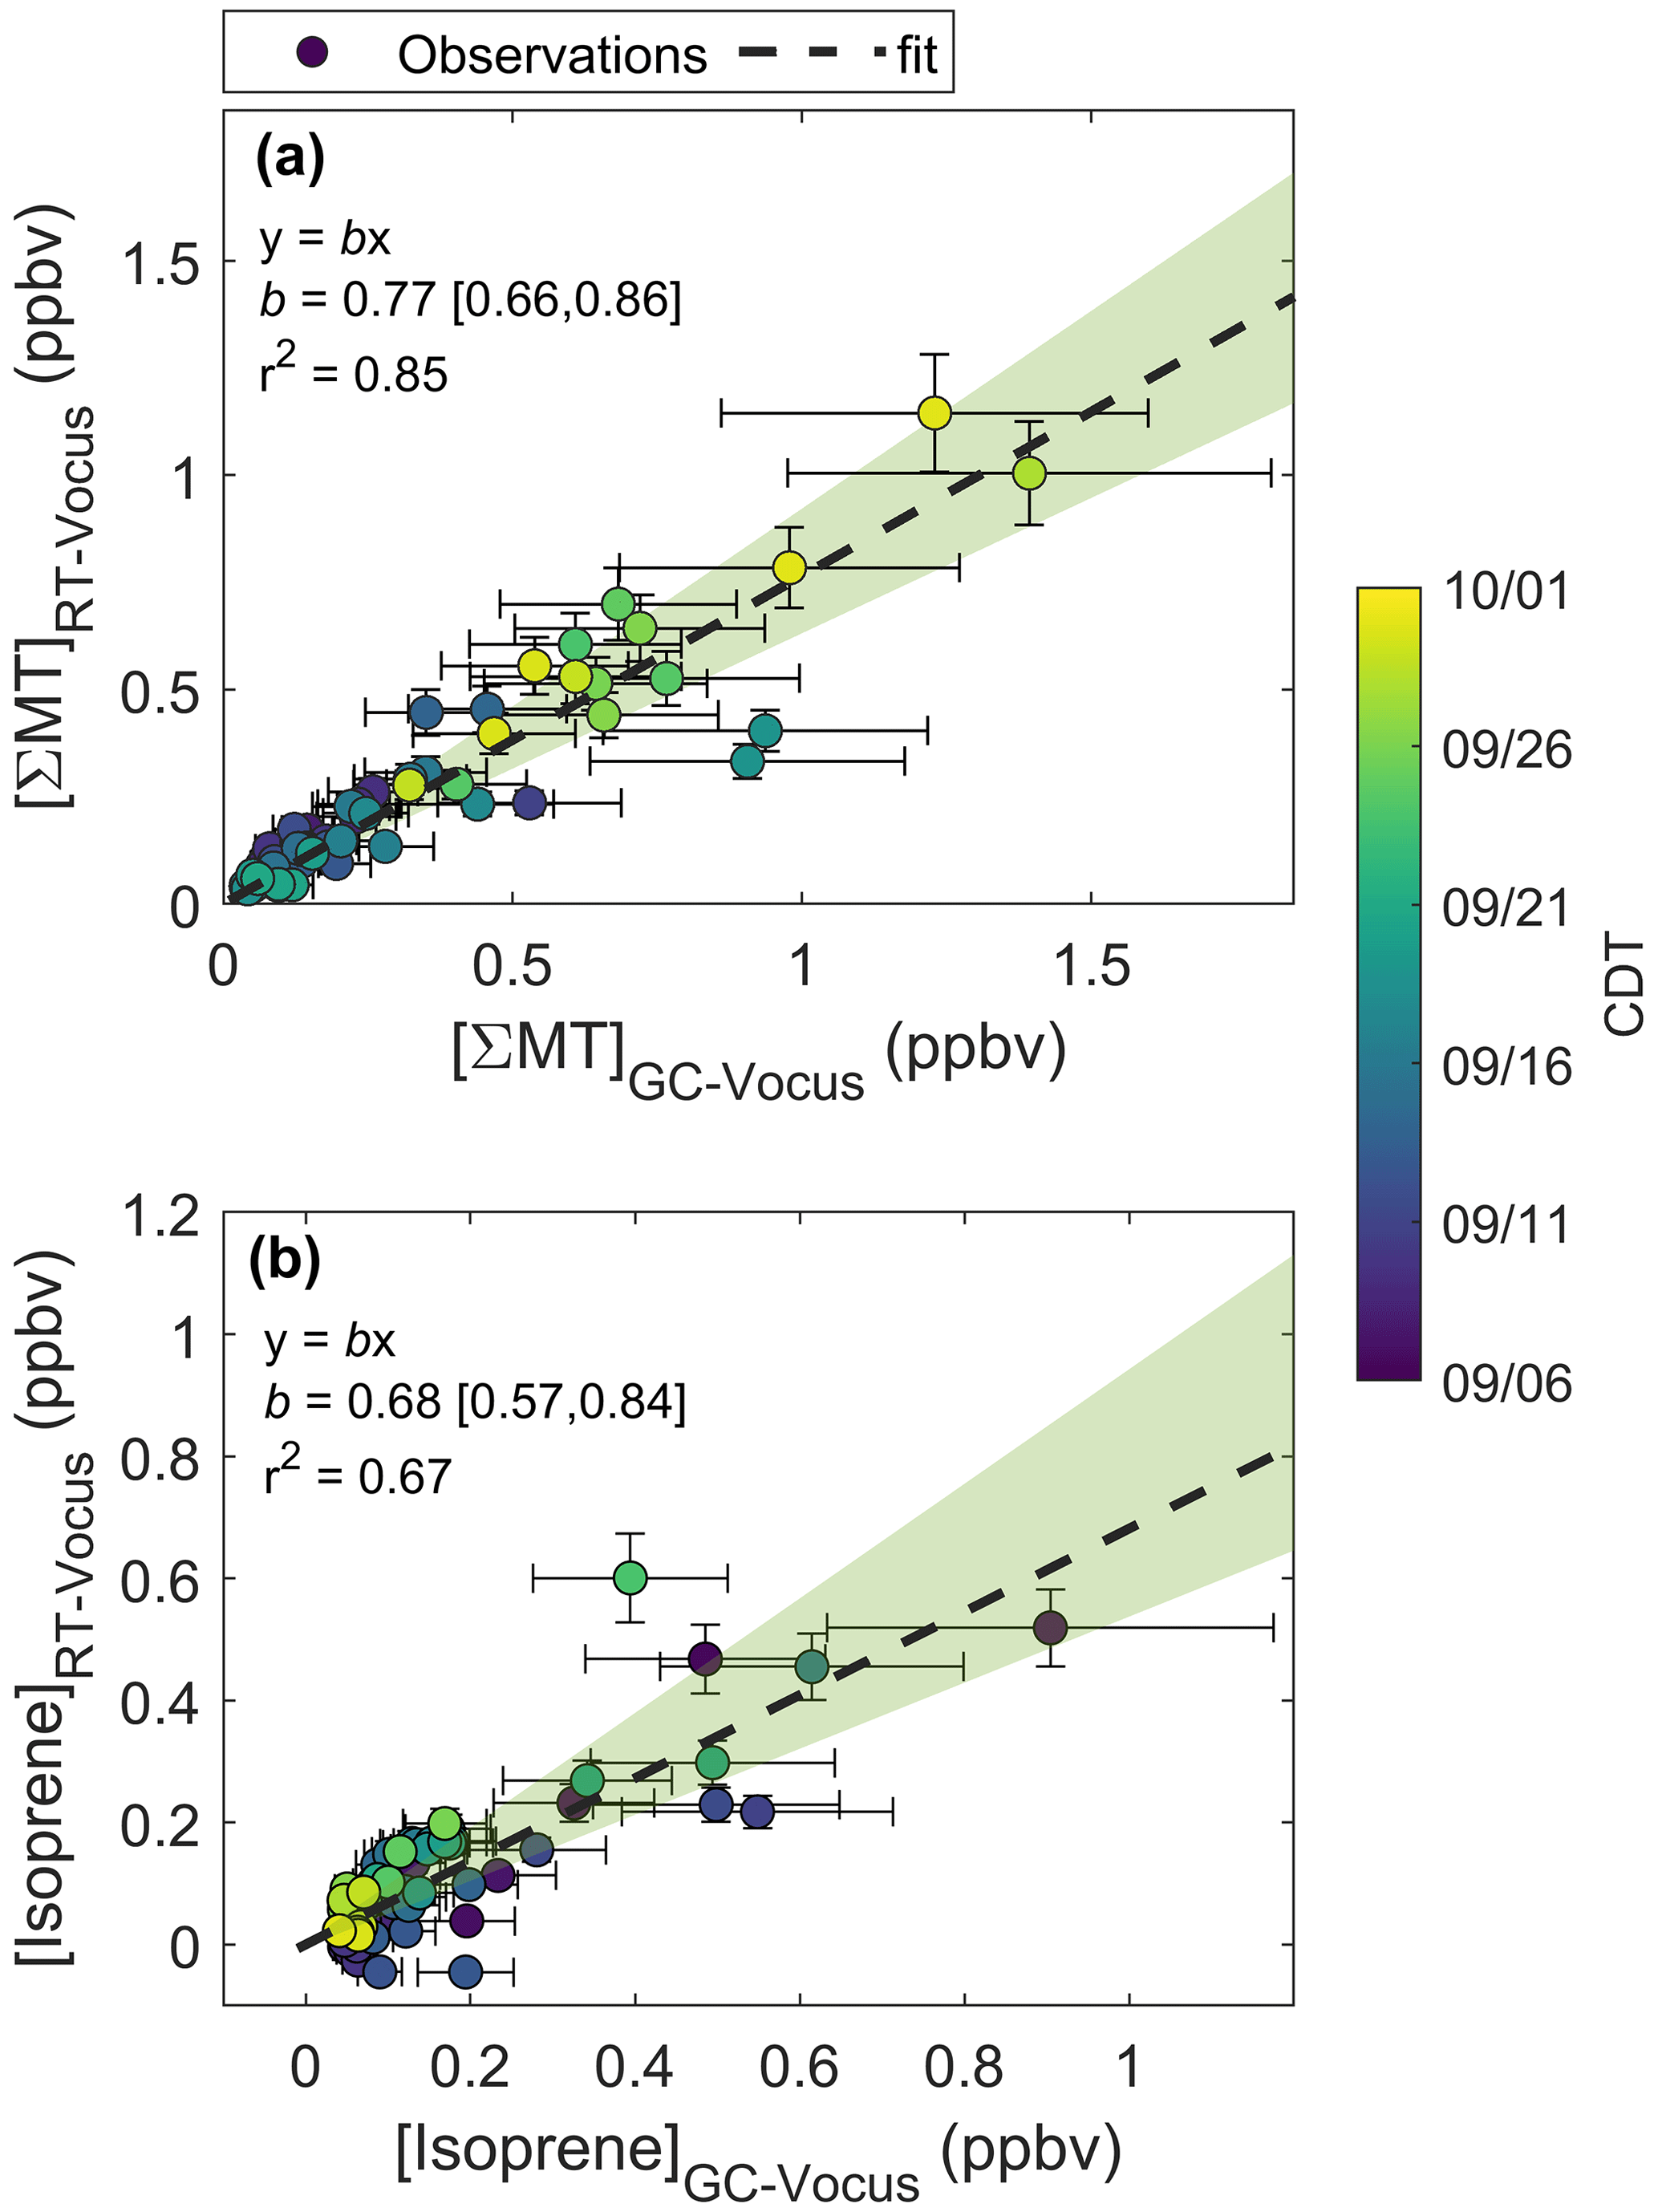
Figure 6Regressions of mixing ratios quantified by the RT-Vocus and GC-Vocus for (a) ΣMT and (b) isoprene. Fitted equations and parameters with associated 95 % bootstrapped confidence intervals are shown inset and plotted as dashed black lines. Error bars are propagated uncertainties in measurements and shaded green regions are the ranges in bootstrapped solutions.
We recorded one peak (RetT = 900 s) as β-farnesene in the chromatogram for (Fig. 5c). The lack of additional peaks may be due to four factors: (1) other SQT isomers in concentrations that are too low; (2) a low GC resolution at this retention time (FWHMβ-caryophyllene=9.5 s; FWHMα-pinene=2.4 s), where FWHM is the full width of the peak at half maximum; (3) isomers requiring elution times beyond the extended recording time of 20 min; or (4) condensation or irreversible loss of SQTs within the lines of the GC system. In-field calibrations show this peak overlapping with β-caryophyllene (Fig. S11), but the peak could also belong to α-cedrene, α-humulene, or β-farnesene based on matches in Kovats RI (RI, RI, RI, RI) (Yousefzadi et al., 2011; Medina et al., 2005). Based on the predominant conifer species at CNNF (red pine, white pine, and grey pine) (Haugen et al., 1998), it is not expected that β-caryophyllene, α-cedrene, or α-humulene would be abundant. Since β-farnesene makes up 41 % and 77 % of red and grey pine emissions, respectively, we assume it is the primary SQT isomer. We confirmed the peak RetT to be β-farnesene through lab additions of a mixture of farnesene isomers to the GC. There was a small, shifting background in the RetT = 890–910 s range (Fig. S15), although the magnitude of this peak was an order of magnitude lower than ambient collections. Since only 14 sets of 20 min collections were recorded, all prior to 21 September, we cannot conclude if there was a change in speciation in C15H24 following leaf senescence.
A representative chromatogram for C2H7S+ is presented in Fig. 5d. The major peak recorded in this chromatogram is DMS at an RetT of 90 s (RI), confirmed through post-field calibrations (Fig. S12), and a second minor peak is from peak-fitting contamination of ( 63.044; C2H7S+ 63.02), tentatively ethylene glycol, at 308 s. This is confirmed through overlap at this RetT with a corresponding peak at 308 s in in background chromatograms (Fig. S15), and the signals of C2H7S+ and are resolved for ambient Vocus collections and result in two distinct time series (Fig. S16). Based on the collected chromatogram window, we assume that only one isomer exists at C2H7S+, which is DMS, although the RT-Vocus overestimates concentrations by 50 % on average (Fig. S17). This overestimation may be due to larger, late-eluting species that fragment to C2H7S+ but are not detected within our chromatogram window or from species that cannot be resolved with the current column.
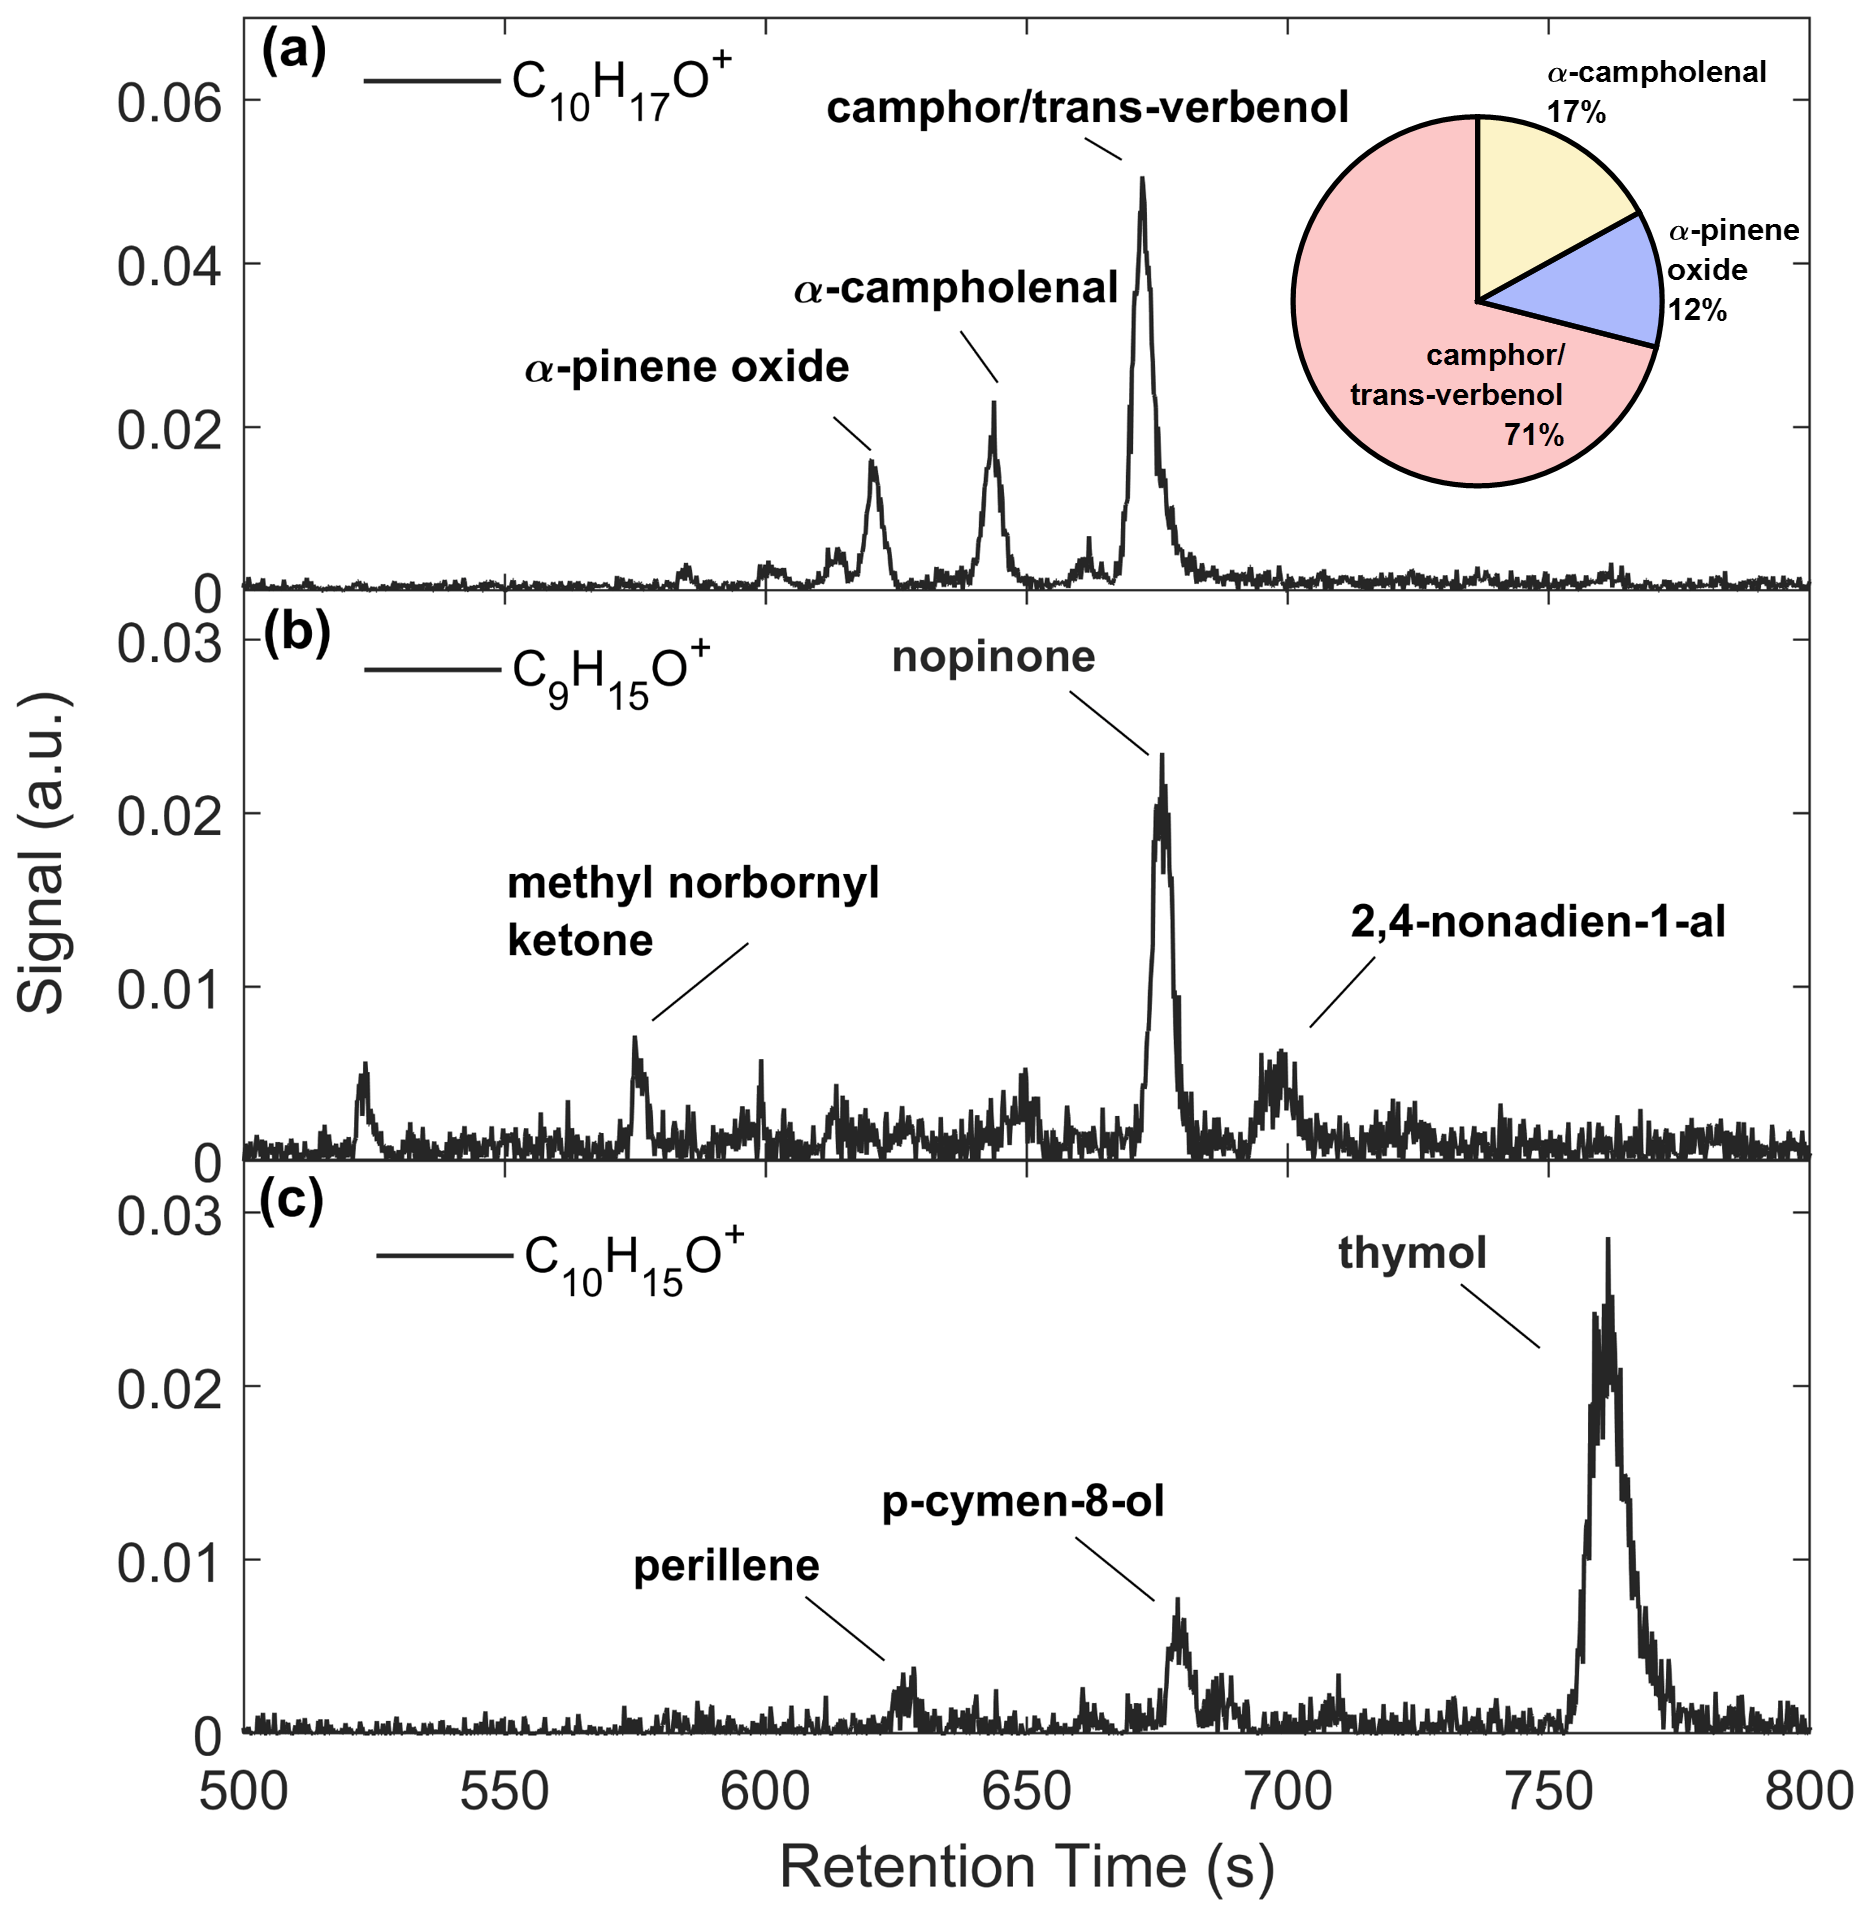
Figure 7 presents GC-ToF observations of monoterpene oxides. The C10H16O signal (Fig. 7a) was primarily composed of three isomers (RetT = 620.3, 643.7, 672.1), corresponding to RIobs. of 1091, 1120, and 1156. The first peak most closely matches to α-pinene oxide (RIlit=1095) (Adams, 2000a), an epoxide product of α-pinene ozonolysis (Alvarado et al., 1998), and was verified in the lab post-study (Fig. S12). The second peak matches in RI to α-campholenal (RIlit=1125) (Adams and Nguyen, 2005), an α-pinene oxidation product (Jaoui and Kamens, 2003). The third peak matches with trans-verbenol (RIlit=1147) (Lucero et al., 2006), a pheromone released by bark beetles (Lindgren and Miller, 2002) found in northern WI red pines (Pfammatter et al., 2015), and an α-pinene oxidation product found within the cells of Norway spruce (Vaněk et al., 2005). It is also likely that camphor (RIlit=1143) (Adams et al., 2006) makes up the peak preceding trans-verbenol, although uncertainties arise from the RI curve or differences in the published system vs. the GC-Vocus. The RI of camphor also matched post-study (Fig. S12), so we label both peaks as “camphor/trans-verbenol”. A GC study over a coniferous ecosystem recorded camphor and α-campholenal making up the majority of C10H16O compounds (Kallio et al., 2006) and attributed camphor and α-campholenal to the oxidation of camphene and α-pinene, respectively. The major peak in C9H15O+ (RetT = 675.9 s; RI = 1159) (Fig. 7b) was confirmed as nopinone (RIlit=1138) (Lucero et al., 2006) (Fig. S12), and a second peak was identified as 2,4 nonadien-1-al (RI, RIlit=1184) (Takeoka et al., 1996). The C10H15O+ chromatogram (Fig. 7c) is made up of perillene (RI, RIlit=1099) (Adams, 2000b), p-cymene-8-ol (RIobs=1170, RIlit=1183) (Adams et al., 2006), and thymol (RI), the latter confirmed through post-study calibrations. The p-cymene-8-ol compound comes from conversion of α-pinene by bacteria in soils (Amiri, 2012) and is found in watercress, a species invasive to Wisconsin found in wetlands (WDNR, 2010). Thymol is a phenol derivative of p-cymene found in various plants, the latter of which has been observed to be a product of α-pinene oxidation by OH, O3, and NO3 (Gratien et al., 2011). We cannot conclude if there was a change in speciation in any of the monoterpene oxides following leaf senescence, since the major peaks eluted after 10 min, and limited 20 min chromatograms were collected.
Background chromatograms for the molecules presented in Figs. 5 and 7 are presented in Figs. S15 and S18.
4.1 Controls of observed terpene emissions
Here we assess the physical factors that control BVOC exchange at this site and compare it to common parameterizations of emissions. Figure 8a shows a regression of FΣMT against temperature for the entire study (light grey circles). A portion of the data during the growing season (noted as periods before 21 September) are highlighted in dark grey circles and can be well fit by Eq. (3c). The pre-exponential factor (ϵ) from the fit (dashed red line) provides a light-independent emission factor of 2.7×10¹⁰ molec cm−2 s−1, and the fitted β parameter (0.11) is close to the MEGAN MT β (0.1), as well as experimentally determined β (0.13), of a ponderosa pine tree in late August 2009 (Helmig et al., 2013). This shows that the ecosystem emission profile of MT prior to senescence followed a typical, consistent profile exponentially dependent on leaf temperature. Here, we approximate leaf temperature as air temperature for both observations and parameterizations, although the temperature of the canopy is likely different than the ambient, with a recent study showing an average ratio of Tcanopy:Tair (in ∘C) of 1.03 and 1.07 for deciduous and evergreen species, respectively, at the temperate Harvard Forest (Still et al., 2022).
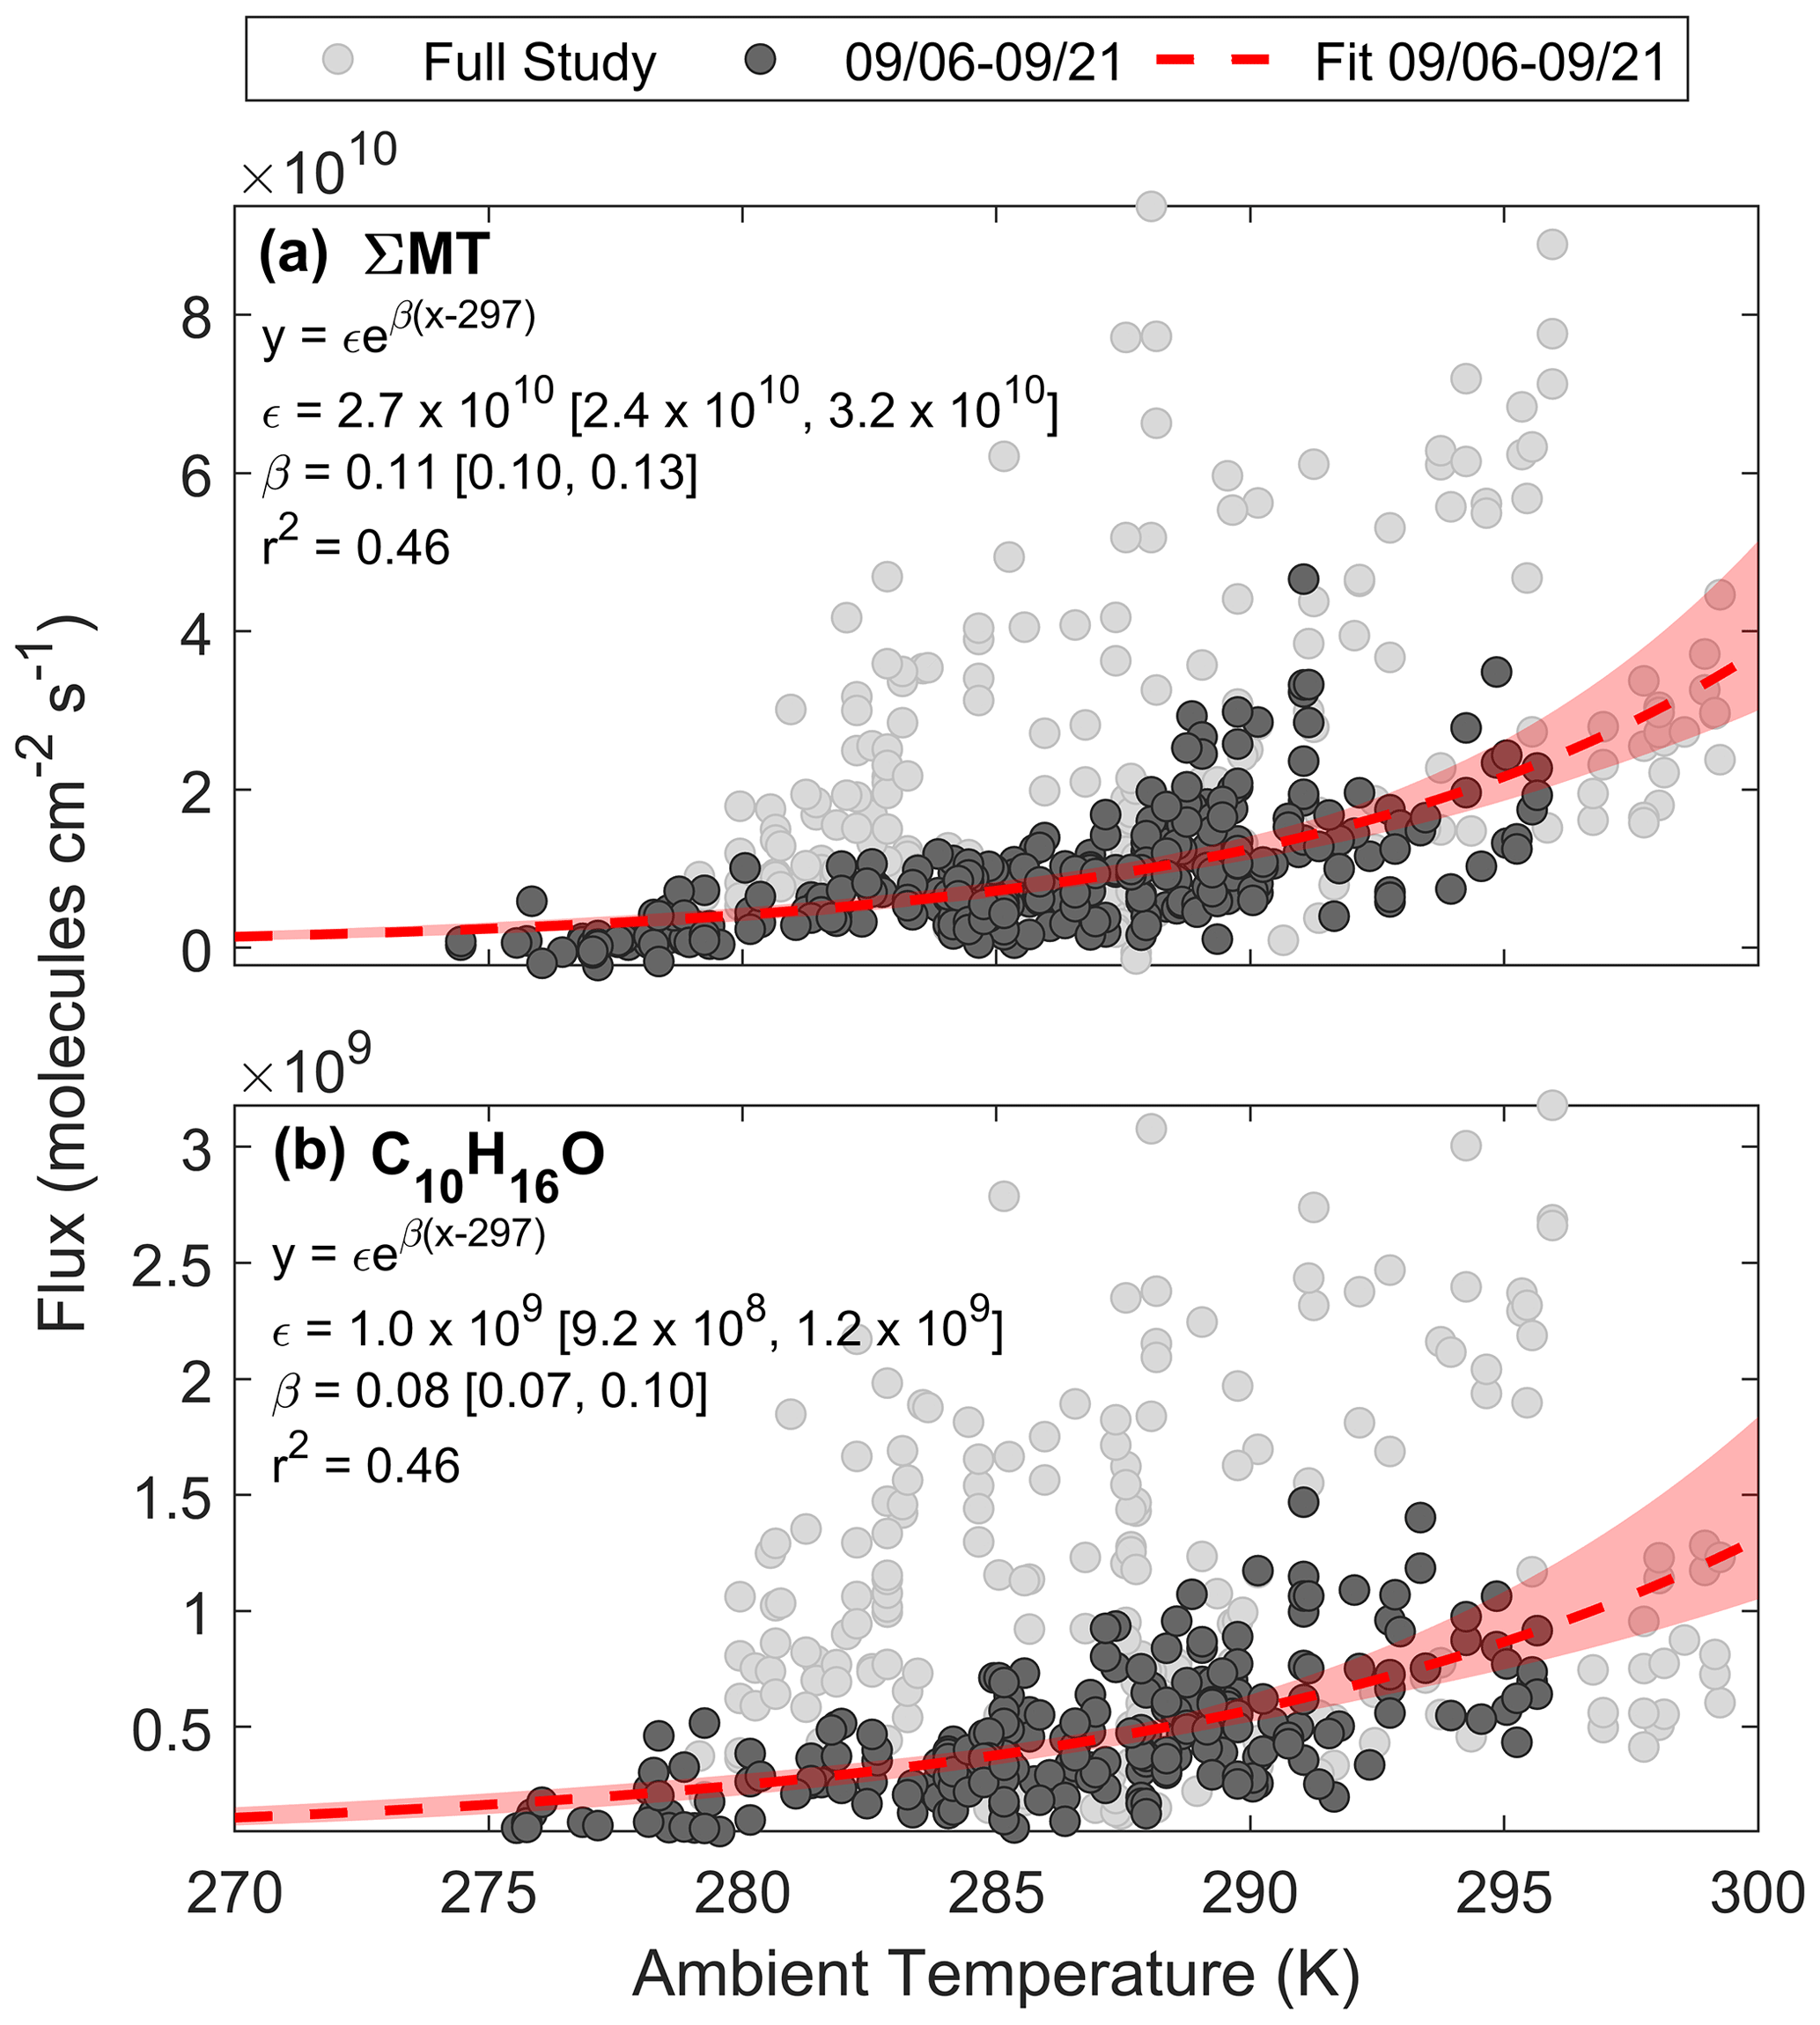
Figure 8Regressions of (a) FΣMT and (b) against ambient temperature for the entire PEcoRINO study (light grey circles) show different exponential dependences of observed fluxes on temperature across the study. Fitted equations and parameters with associated 95 % bootstrapped confidence intervals are shown inset and plotted as dashed red lines. Shaded red regions are the ranges in bootstrapped solutions.
This temperature dependence was also observed for , as shown in Fig. 8b. We derive an ϵ of 1.0×10⁹ molec cm−2 s−1 and a β of 0.08. The fitted β is close to the value used for the “other monoterpene” class in MEGAN (0.1) but deviates from the canopy-scale C10H16O-specific value measured over a coniferous forest in New England (0.21) (McKinney et al., 2011). In that same study the β MT was 0.1 (close to this study's value of 0.13), suggesting either that camphor and MT in the New England study were the result of different biochemical processes or that they were from separate trees. From the Helmig et al. (2013) study, the β of various terpenoids did not change significantly across six different pine species, so it is expected that the β of both MT and camphor would match other field studies if they were both derived from pine emissions; however this is not the case for C10H16O. This suggests either that in our observations C10H16O and MT emissions come directly from the same species and follow biochemical pathways that have the same temperature dependence or that C10H16O is a secondary ambient product of MT emissions (i.e., in-canopy oxidation or oxidation below the sensor).
Figure 9a–d present time series of parameterized (dashed red line) and observed (black line) fluxes of reactive terpenes. Figure 9e–h show regressions of observations against parameterizations for the two leaf stage periods, which are summarized in Table 2. We parameterized fluxes of MT and C10H16O using β and ϵ derived from the fits in Fig. 8. The parameterizations use observed β as a constraint and ϵ as an initial guess to best fit pre-21 September data to Eq. (3). For MT we used an LDF of 0.4, since it is the mean and median value among α-pinene (0.6), β-pinene (0.2), and the other monoterpene class (0.4) in MEGAN 2.1. For C10H16O an LDF of 0.4 was used, and for SQT we used an LDF of 0.5 and a β of 0.17 as per Table 4 of Guenther et al. (2012). Parameterized emission factors for isoprene (Eq. 2) and SQT (Eq. 3a) were based on best fits of the pre-21 September data. We use observed PPFD and T as well as satellite LAI as constraints for parameterizations. For terpenes other than SQT we apply an average loss factor within the canopy (ρ) of 0.95, a value used for this site in Vermeuel et al. (2021).
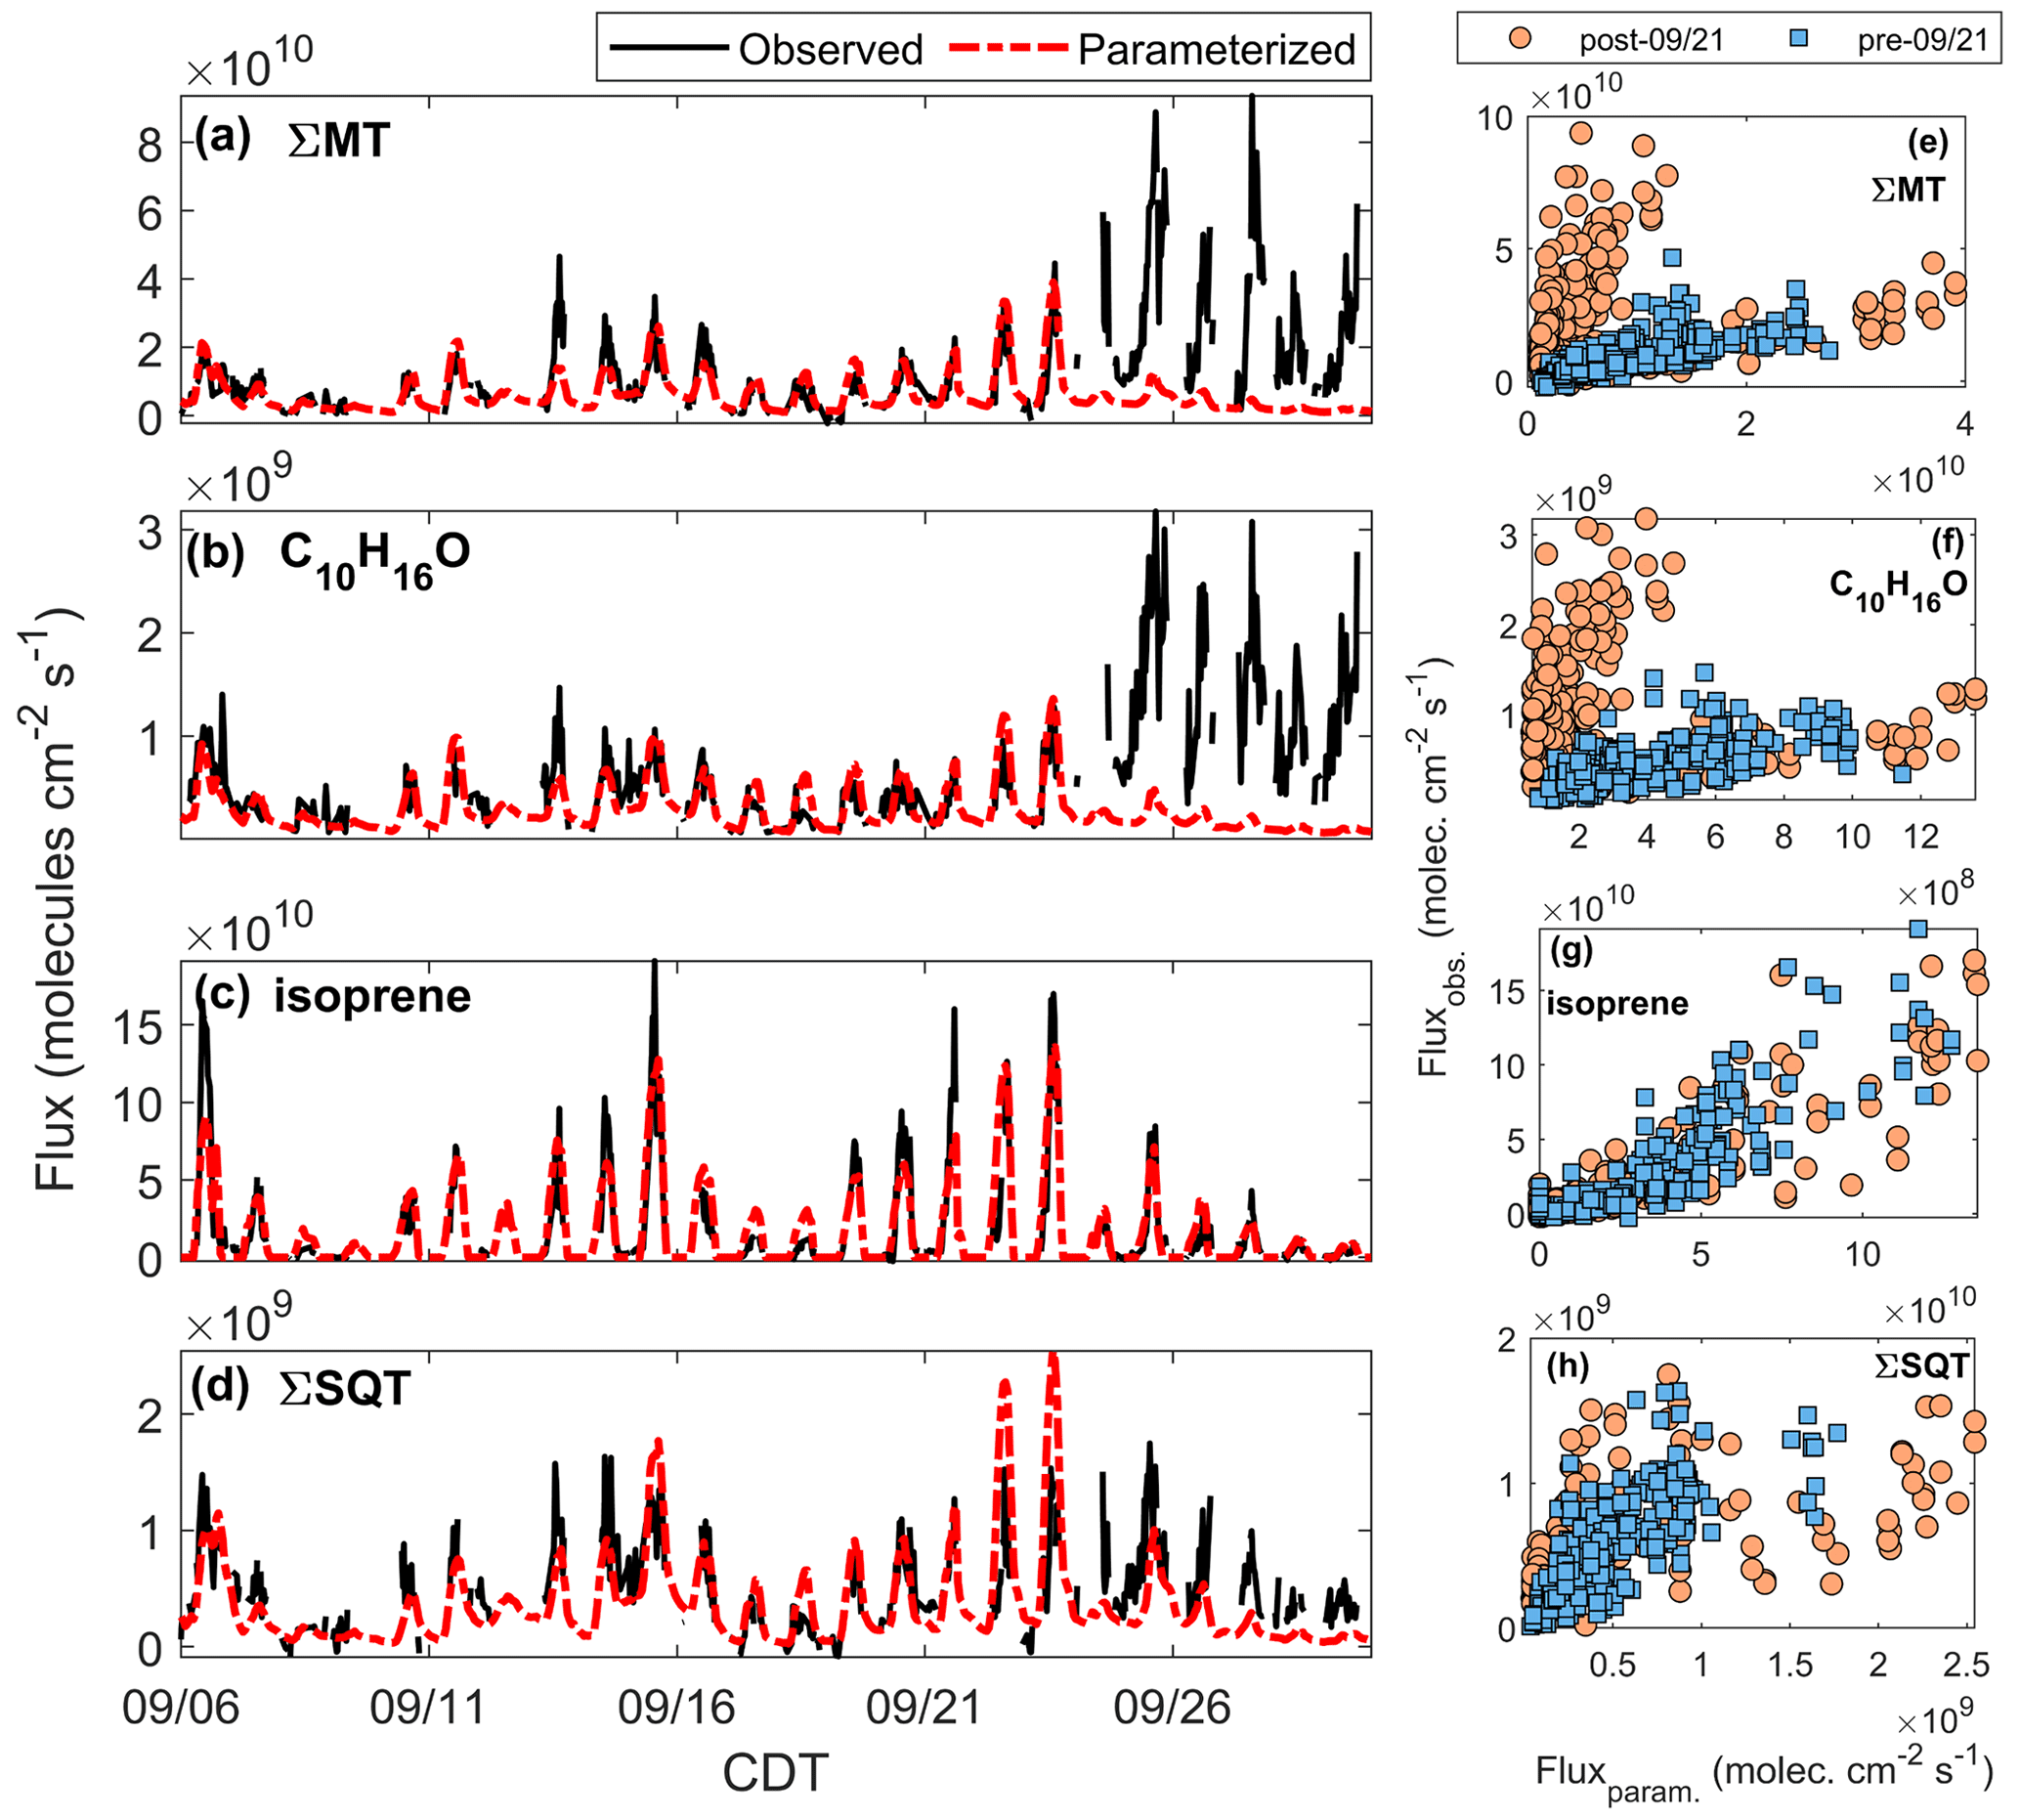
Figure 9Time series of observed (black line) and parameterized (red line) (a) FΣMT, (b) , (c) Fisoprene, and (d) FΣSQT. Panels (e–h): regressions of observed vs. parameterized fluxes for periods after (orange circles) and before (blue squares) 21 September.
Table 2Summary of correlation coefficients (r2) from Fig. 9e–h. All fits are through the origin. Included is the ratio of the averages of observed and parameterized fluxes during the pre- and post-21 September periods.
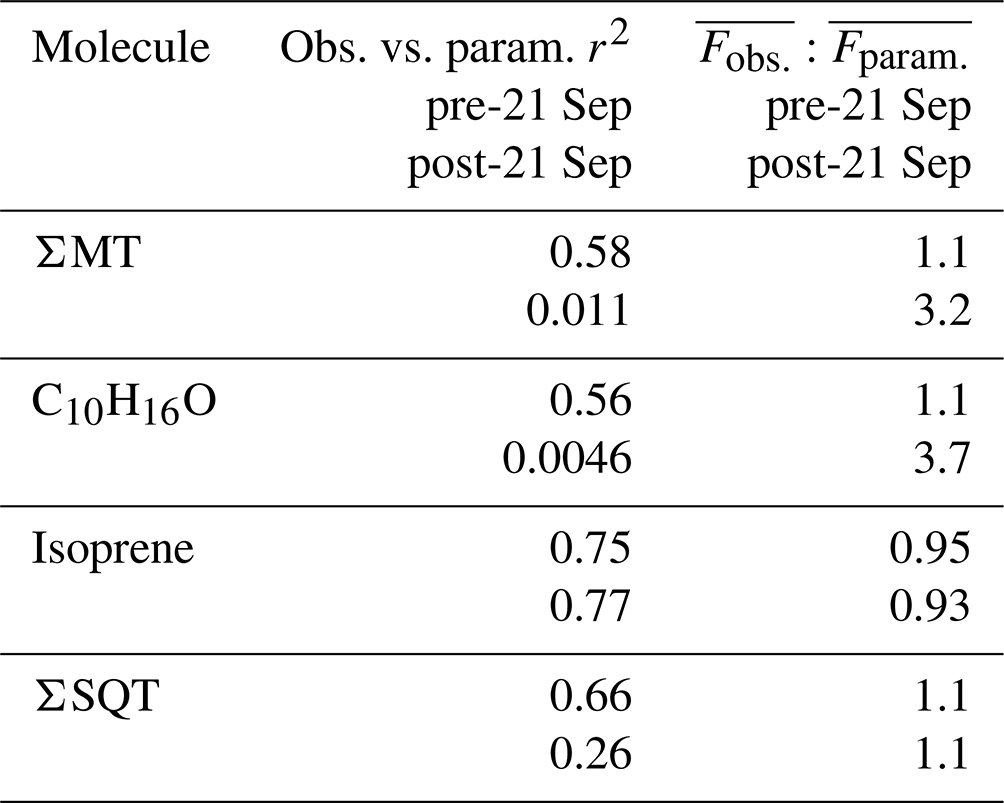
Figure 9a presents the time series of the parameterized FΣMT (red line) overlaid on observed FΣMT (black line). The MT EF used (4.5×10¹⁰ molec cm−2 s−1) is lower than the standard condition MEGAN 2.1 EF for the sum of α- and β-pinene (the majority of FΣMT) from a needleleaf evergreen temperate tree (9.8×10¹⁰ molec cm−2 s−1) and a broadleaf deciduous temperate tree (6.5×10¹⁰ molec cm−2 s−1) (Guenther et al., 2012). There is good agreement between the parameterized and observed data up until 24 September, primarily because emissions of MT can no longer be predicted by the temperature response curve and partially due to a weaker dependence of observations on LAI in late September. We observe the same behavior for parameterized (Fig. 9b), suggesting that C10H16O arrives from the same observed source as MT. The EF for C10H16O (1.6×10⁹ molec cm−2 s−1) is 8.0 % of the value used for the other monoterpenes group in Guenther et al. (2012) for a needleleaf evergreen temperate tree (2.0×10¹⁰ molec cm−2 s−1).
Figure 9c presents a time series of Fisoprene along with the parameterized emissions following Eq. (2). The data were best fit using a base emission factor of 2.0×10¹¹ molec cm−2 s−1. This range is closer to the MEGAN EF for needleleaf evergreen temperate trees (1.5×10¹¹ molec cm−2 s−1) but lower than that of a broadleaf deciduous temperate tree (2.5×10¹² molec cm−2 s−1). We achieve excellent agreement between modeled and measured isoprene fluxes (Fig. 9g, Table 2), showing that the measured flux of the ion is predominantly due to isoprene.
Emissions of SQT can be estimated by Eq. (3); however, the net flux of SQT may be underestimated due to in-canopy oxidation. Net emissions (Fnet) are calculated by applying Eq. (4) to the parameterized emissions (Femitted):
where koxidation is the bimolecular chemical rate constant for the oxidation reaction; Coxidant is the oxidant concentration; and τcanopy is the residence time of a parcel of air within the forest canopy, estimated as 5 min (Vermeuel et al., 2021). Figure 9d shows the result of the parameterized flux of β-farnesene (red line) using an optimized EF of 4.2×10⁹ molec cm−2 s−1, a value 9.8×10⁸ molec cm−2 s−1 higher than the EF of α-farnesene used in Guenther et al. (2012), which is corrected for in-canopy loss due to ozonolysis and OH-initiated oxidation. When calculating reactive loss, it is assumed the [O3] measured at 30 m was the same within the canopy and that [OH] followed the same profile as the modeled OH (Sect. 2.5). Accounting for in-canopy chemistry reduced the flux by 10 %, on average, for the whole study period. This parameterized and corrected Fβ-farnesene is in good agreement with observations prior to 21 September of the study (r2=0.66) and poor agreement following 21 September. This shows that although there is no observed enhancement of SQT emissions in the latter portion of the study, the leaf senescence period does show a deviation from what is expected based on parameterizations.
4.2 Potential mechanisms of BVOC enhancement during leaf senescence
The increased and sustained FΣMT and [ΣMT] throughout late September as well as the change in MT speciation suggest that the mechanism of MT emissions changes throughout the summer to autumn transition at this site. While the exact mechanism is still unknown, we provide a few potential reasons for this enhancement along with their likelihood of contribution. Briefly they are (1) a reduction in ambient oxidant loading that slows chemical loss, (2) increased contribution of MT from leaf litter or soils, and (3) physical changes to plants and modifications to terpene synthesis during senescence.
4.2.1 Changes in ambient oxidation chemistry
Reduction in gas-phase oxidant concentrations would reduce the rate of in-canopy oxidation and increase the net detected flux. To estimate how a change in in-canopy oxidation would impact measured FMT, we rearrange Eq. (4) to get the fraction of FMT,net to FMT,emitted, which can be used to assess in-canopy loss under different oxidant loadings:
Since O3 increases after 21 September, the concentration of OH would need to decrease after 21 September for this to increase the net emitted MT as observed. Using observed O3 concentrations and a high estimate of 1×10⁷ and 5×10⁶ molec cm−3 OH before and after 21 September, respectively, and a τcanopy of 5 min, the ratio of would achieve a 1.1× increase from 0.79 to 0.89 before and after 21 September, a modest increase. Since the parameterized FMT (Fig. 9a) is a factor of 1.5 higher in the period before 21 September relative to after, this change due to oxidation is small. Still, a reduction in OH from attenuated solar radiation in the latter parts of the month (Fig. 1e) has a small impact on sustained [ΣMT]. The approach used here is a simple parameterization and not a replacement for more comprehensive 1-D vertical models such as the Canopy Atmospheric Chemistry Emission model (Bryan et al., 2012) where changes in concentration with time are explicitly treated. However, since we use conservative estimates of τoxidation and a fixed τcanopy, we are directly comparing scenarios where in-canopy oxidation would have the strongest impact.
4.2.2 Contributions from soil and leaf litter
A potential explanation for the high observed FΣMT and [ΣMT] may be enhanced emissions from the forest floor. Throughout autumn, the forest floor can be a significant contributor to VOC flux from the decomposition of leaf litter (Isidorov et al., 2010; Greenberg et al., 2012) or from microbial activity in exposed soils (Mäki et al., 2019). Aaltonen et al. (2011) observed forest floor BVOC emissions in a boreal coniferous forest peaking in early summer and autumn with emissions of MT averaging 6.2×10⁸ molec cm−2 s−1 and containing primarily α-pinene, camphene, and Δ3-carene with a negligible contribution from isoprene and SQT. Hellén et al. (2006) recorded forest floor emissions from the same site, noting that the highest MT emissions occurred in the spring and autumn with values up to 4.6×10¹⁰ molec cm−2 s−1 composed of α-pinene, camphene, Δ3-carene, limonene, and β-pinene. However, this behavior has been observed primarily in boreal forests when needleleaf litter is high and may not be reflective of the CNNF at the observed stage in the needleleaf cycle during the PEcoRINO study. Bare soils can serve as a source of MT in temperate regions, although that contribution ( molec cm−2 s−1) is generally negligible (Trowbridge et al., 2020) compared to foliar and leaf litter emissions. Based on these studies we assume that decaying leaf litter and soils may provide a small contribution to the early-autumn rise in FΣMT and to the change in MT speciation during the summer to autumn transition. However, without soil and floor observations we cannot quantitatively conclude their impact on observed FΣMT. This study shows a need for measurements of forest floor emissions in temperate regions or in mixed forests that can confirm the magnitude and speciation of these emissions.
4.2.3 Leaf degradation or enhanced reactive carbon synthesis
A third explanation for elevated MT emissions is the leaf senescence process itself. During stages of senescence, changes in the biomechanical properties of the epidermis cuticle make diffusion of certain compounds easier through a degraded epidermal layer, which could lead to increased emissions of BVOCs, although this has been primarily recorded for hydrophilic species (Mozaffar et al., 2018). Degradation of plant structural components can also generate leaf wounds during senescence, which may enhance MT emissions if the lamina is wounded (Portillo-Estrada and Niinemets, 2018). In addition, the degradation of cells provokes desiccation of the lamina, driving the emission of volatile compounds stored within the cytosol or in specialized reservoir organs (Portillo-Estrada et al., 2020). These two processes have been witnessed in trees of the genus Populus, including aspen, which make up 25 % of the acreage of CNNF as of 1996 (Haugen et al., 1998).
A study measuring VOC emissions via the eddy covariance method over a poplar plantation of 12 different genotypes observed a peak in the emissions of 25 VOCs at the beginning of September and the onset of senescence (Portillo-Estrada et al., 2020), with increases in OVOCs of 1–2 orders of magnitude and modest increases in MT. The authors also observed a cessation of isoprene flux beginning with the onset of leaf senescence. This agrees with observations at CNNF with increases in FΣMT and coincident with sharp drops in Fisoprene near to 21 September. Still, if aspens within the flux footprint were controlling BVOC emissions it would be expected that other OVOCs such as methanol or acetone would present an enhancement in emissions (Portillo-Estrada et al., 2020). However, observed fluxes of methanol and acetone post-21 September exhibited a net sink (Fig. S19). It is possible that the net flux of those OVOCs was controlled by other enhanced routes of deposition, such as uptake to water films or biotic processes (Laffineur et al., 2012; Fulgham et al., 2020), making it difficult to assess changes in the gross source of methanol and acetone.
A final but most speculative enhancement route related to the senescence process may be due to the increased synthesis of, and the need to mitigate, reactive oxygen species (ROS) within leaves. During senescence, ROS are generated in response to stress, which depletes antioxidants and damages cells (Jajic et al., 2015). To reduce ROS, plants may increase synthesis of reactive carbon (Affek and Yakir, 2002). Monoterpenes serve as ROS scavengers during senescence (Chen and Cao, 2008), and production of MT in response to increased oxidative stress has been shown in the leaves of evergreen oak (Quercus ilex) (Loreto et al., 2004). Although there are no studies confirming enhanced MT synthesis in senescing plants at this site, there is the possibility for this biochemical pathway to be upregulated during this phenological stage, and future studies aimed at assessing plant reactive carbon synthesis in response to senescence and oxidative stress would be invaluable.
4.3 Photochemical box model calculations of HOM and H2SO4 production
The seasonal enhancement of MT at this site raises the question of how well models using common emission parameterizations predict aerosol production. Further, in the presence of DMS, we need to consider whether MT or DMS is the dominant sources of biogenic aerosol precursors. To address this, we use the 0-D box model described previously to evaluate PHOM and , with model solutions presented in Fig. 10.
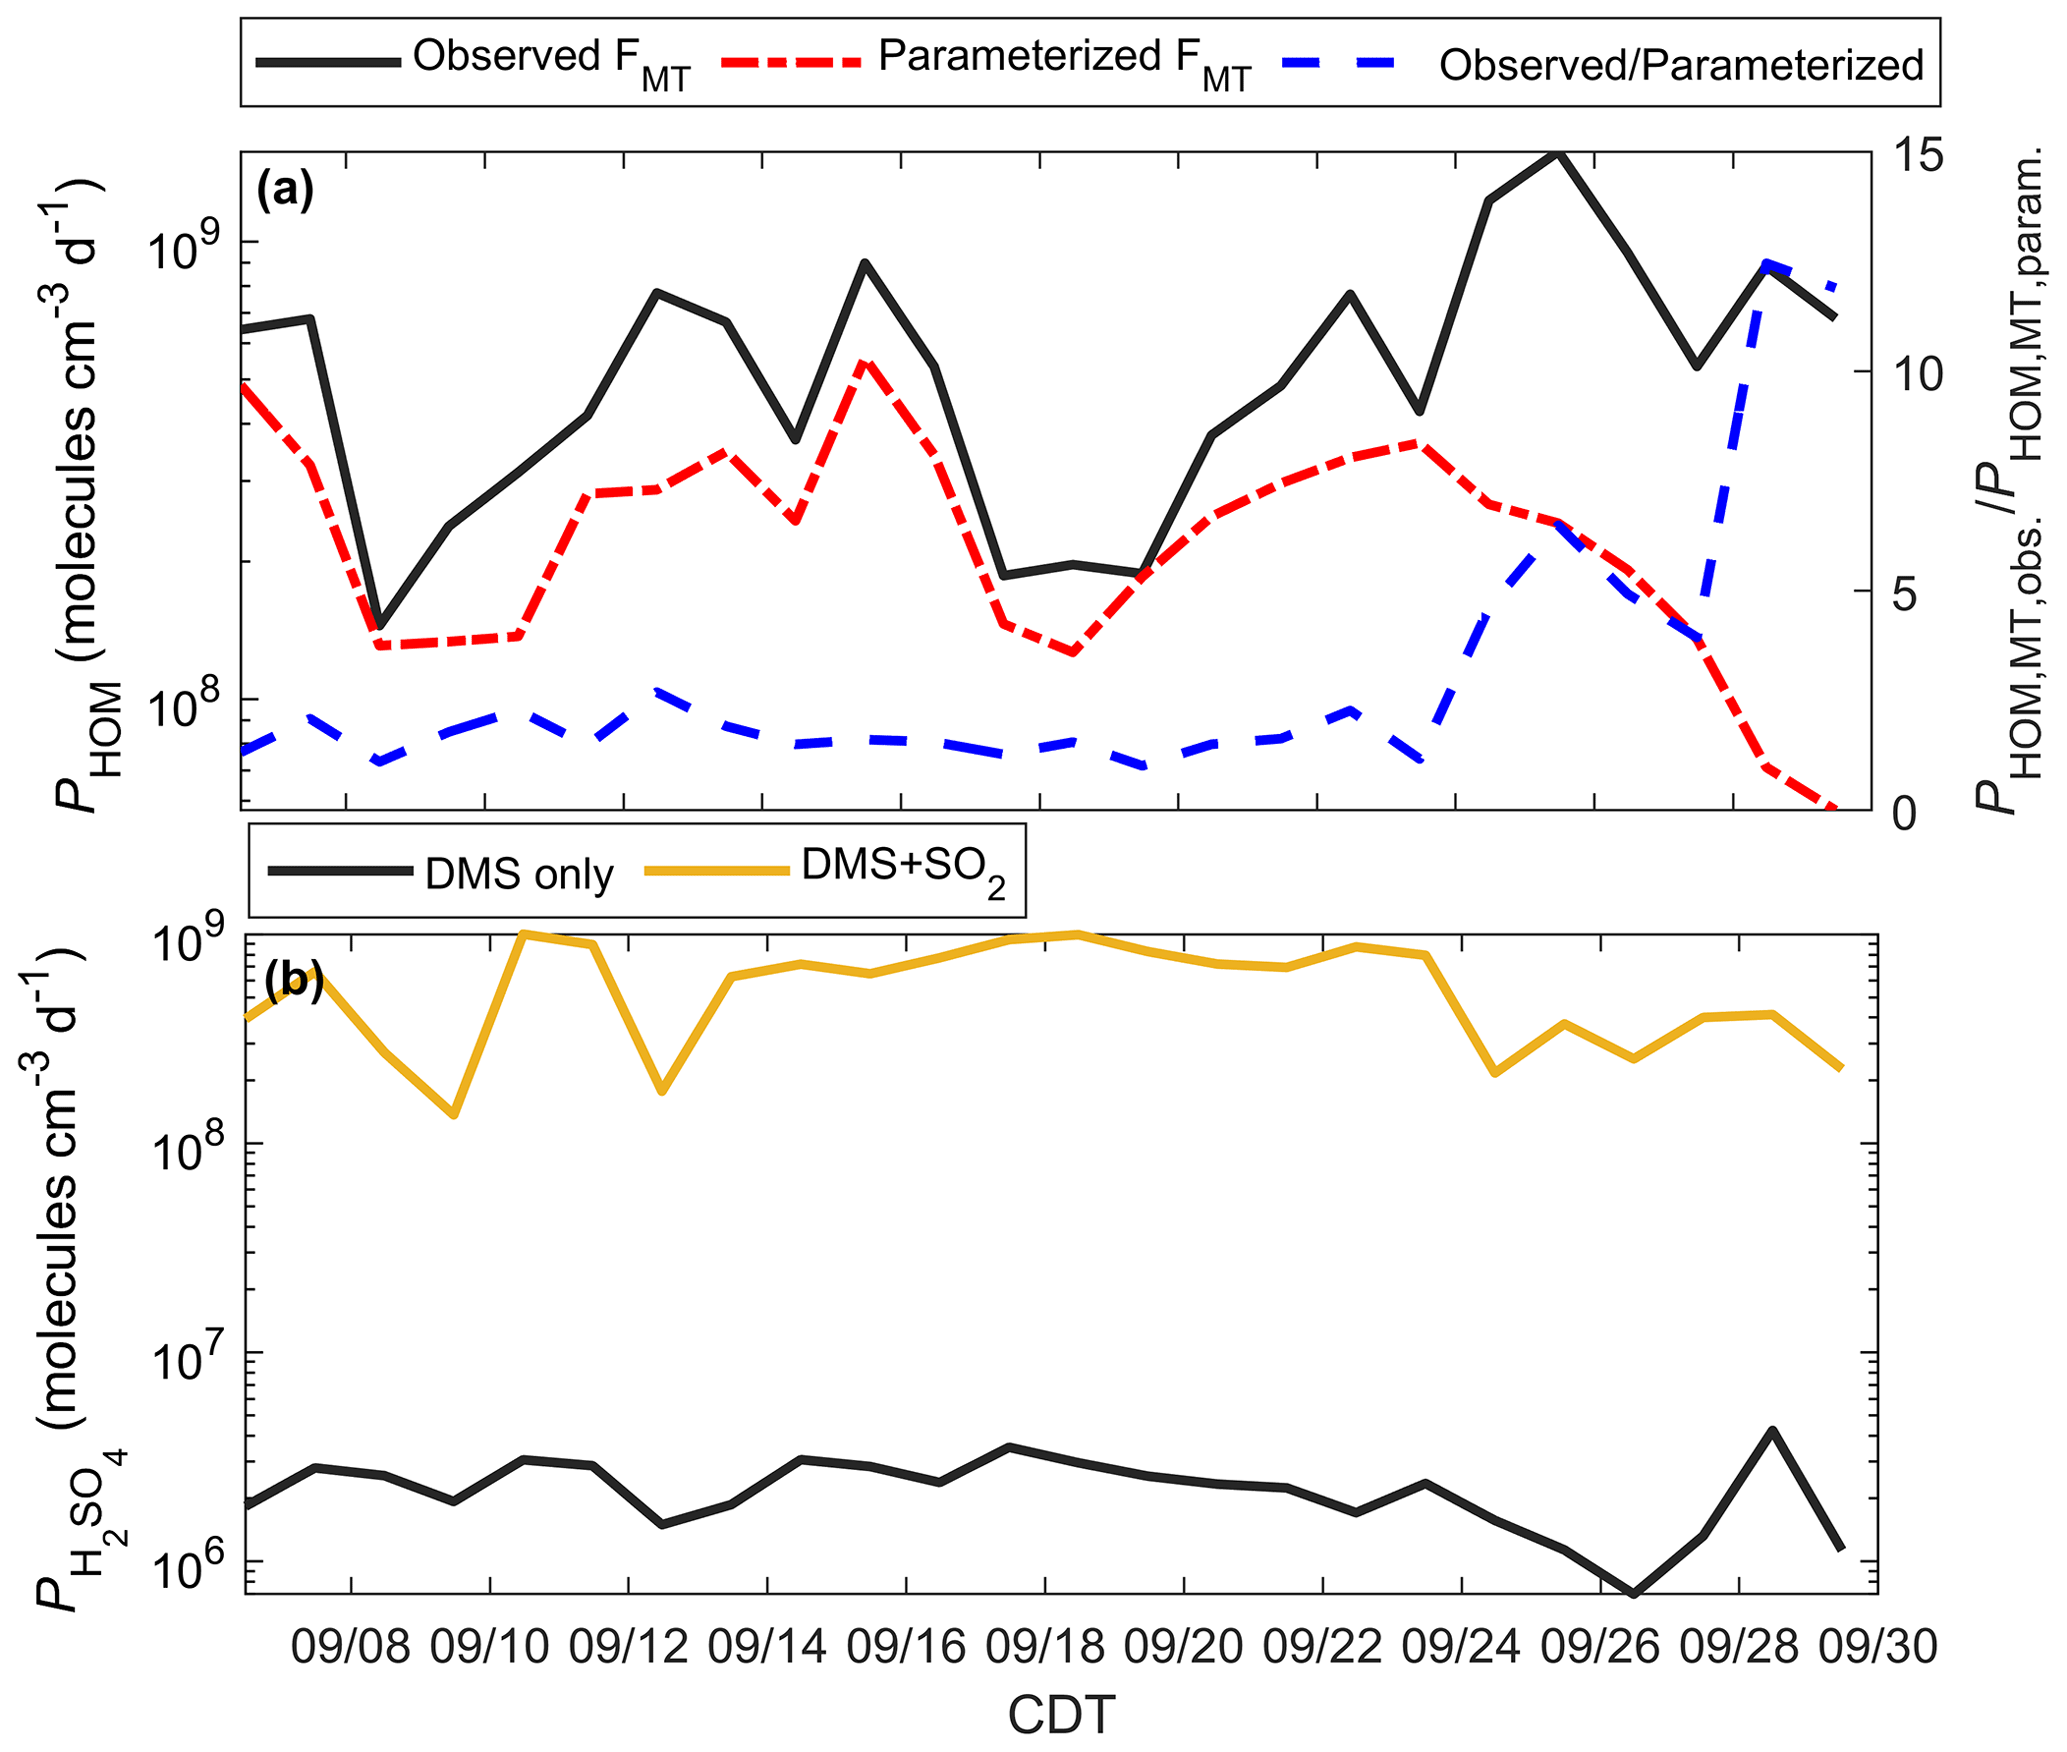
Figure 10Modeled HOMs and H2SO4 during the PEcoRINO study. (a) Calculated PHOM using observed FMT (black line) and parameterized FMT (dash-dotted red line) shows that PHOM is underestimated on average by a factor of 5.5 post-21 September (dashed blue line). (b) as determined from DMS only (black line) and DMS and regional SO2 (gold line). The addition of 250 pptv SO2 increases by over an order of magnitude, making comparable to PHOM.
Figure 10a shows PHOM calculated from observed FΣMT (black line) and parameterized FΣMT. The daily ratio of PHOM using observed and parameterized FΣMT (dashed blue line) post-21 September is on average 5.5 and up to 12.5. The PHOM value can be used as a proxy for the mass transfer of gas to a transition regime particle and thus the production of organic aerosol mass (and aerosol growth) if it is assumed that the mass accommodation of HOMs to particles is always unity and the average particle radius is similar throughout the study (Fuchs and Sutugin, 1971). Therefore, there is a significant underestimation of estimated organic aerosol mass during the onset and continuation of the senescing canopy if a model uses a common parameterization for MT emissions.
Figure 10b shows from a model run that considers DMS as the only source of H2SO4 (black line), as well as a model run with DMS and estimated SO2 (gold line) from a regional EPA SO2 monitor. from DMS only does not change significantly throughout the study, with a study average of 2.3×10⁶ molec cm−3 d−1. Since the observed [DMS] is very low (<10 pptv), some days may experience outsourced SO2 that controls on-site . We simulate this by running the model with [SO2] = 250 pptv (as a lower end from the EPA monitor), giving a study average of 5.9×10⁸ molec cm−3 d−1. These results imply that outsourced plumes intersecting the CNNF site, rather than local DMS, would primarily control H2SO4 production.
Table S4 outlines model solutions of PHOM and . For the DMS-only case, PHOM as constrained by observations is more than a factor of 250 higher than on average. For the DMS + SO2 case, PHOM and are the same value (5.9×10⁸ molec cm−3 d−1) on average.
From these modeled estimates we can conclude that biogenic particle formation and growth in this region are largely controlled by HOM production, specifically by MT oxidation. This analysis provides the first step to approximating the impact of BVOCs on particle nucleation or growth from gas-phase HOM production, although detailed conclusions cannot be made without actual aerosol measurements that allow for a more complete calculation of nucleation and condensation rates. Future measurements should include monitoring of particle size and number to determine the specific rate of mass transfer of gaseous HOMs and H2SO4 to the particle phase, as well as ambient SO2 and OH to better calculate H2SO4 production and to validate the employed mechanism of DMS oxidation. Further, having more comprehensive plant trait data that correlate with different stages of senescence in combination with empirical knowledge of BVOC emissions during senescent phases is key for improving estimates of organic aerosol production.
Northern temperate forests experience a steep change in physical canopy conditions throughout the summer to autumn transition that can make predictions of canopy-mediated BVOC exchange difficult. This study measured dominant BVOCs throughout the month of September to assess the response of the forest canopy in mediating reactive carbon to a wide range of meteorological conditions and multiple stages of the leaf life cycle. Results from this study showed enhanced concentrations and emissions of MT and a monoterpene oxide (C10H16O) during senescence. Using qualitative assumptions of the leaf and forest floor stage, as well as estimations of the ambient oxidative environment, we propose possible causes to be (1) the senescence process that degrades leaves and potentially increases antioxidative reactive carbon, (2) emissions of the forest floor or freshly decomposing leaf litter, and/or (3) a decrease in the oxidants that remove MT (e.g., O3, OH, NO3) within or above the canopy. The flux of C10H16O is primarily from direct emissions, although a small fraction could be from in-canopy oxidation of MT. Multiple monoterpene oxides were observed on-site, and GC confirmed their identities to be a combination of MT oxidation products and directly emitted compounds. The observed flux of MT can be well parameterized following an exponential temperature dependence up to the estimated start of leaf abscission (around 21 September), indicating that global models can well replicate the diurnal cycle and relative magnitudes of MT emissions during the growing season but may fail to do so during leaf senescence and onward. In this region emissions of isoprene exceed those of MT and can be well replicated following a common parameterization based on light and temperature and scaled by LAI, suggesting that most of the leaves lost were isoprene-emitting while living. Speciation of MT via GC showed that MT was primarily composed of α- and β-pinene, and the change in season shifted the distribution of MT to a β-pinene majority. This shift in speciation may be driven by some MTs being removed from the collective profile due to senescence, allowing other coniferous compounds that are sustained to now become relatively more dominant. To our knowledge, we present the first recorded canopy-scale fluxes of SQTs in a mixed temperate forest, with the main isomer identified as β-farnesene. DMS was also observed on-site in low quantities (∼10 pptv) with no dependence on the time of the month.
A box model incorporating measured terpenoid flux and DMS and O3 concentrations, as well as inferred OH and NO3 concentrations, shows that the production of HOMs is underestimated on average by a factor of 5.5 when incorporating common parameterizations of MT flux. Further, biogenic particle formation and growth should be dominated by organic (terpene-derived HOMs) rather than inorganic (DMS-derived sulfate) constituents, although the incorporation of anthropogenic SO2 causes HOM and H2SO4 production to be the same average value. Results from this study highlight the need to consider leaf senescence in mixed forests, where emissions of reactive BVOCs can be enhanced, and call for more observations of BVOC exchange in northern temperate forests during the summer to autumn transition. This would allow us to determine if the observed role of the canopy before and after the onset of leaf abscission follows a seasonal cycle or if the observations from PEcoRINO were anomalous to this region and time. This study also shows that DMS sources in a northern temperate mixed forest composed of woody wetlands are low and should be a small contributor to regional aerosol production, with the majority of aerosol formation and growth predicted to be from terpene oxidation or oxidation of outsourced anthropogenic sulfur.
Concentrations and fluxes of ambient species presented in this study can be found at http://digital.library.wisc.edu/1793/83610 (Vermeuel and Bertram, 2022). US-PFa meteorological data can be found at https://doi.org/10.17190/AMF/1246090 (Desai, 1996).
Supplementary files include additional GC methods, cospectra, flux quality control details, and supporting figures and tables. The supplement related to this article is available online at: https://doi.org/10.5194/acp-23-4123-2023-supplement.
MPV and THB designed the research. THB and ARD supervised the project. MPV carried out ambient Vocus sampling and analyzed the data. GAN, JT, MSC, and BML assisted with ambient deployment. JT collected meteorological data, and PAC provided O3 measurements. DBK conducted laboratory calibrations and assisted in GC characterization. MSC, BML, and AMT aided in the interpretation of data. MPV wrote the manuscript. All co-authors reviewed and edited this manuscript.
At least one of the (co-)authors is a member of the editorial board of Atmospheric Chemistry and Physics. The peer-review process was guided by an independent editor, and the authors also have no other competing interests to declare.
Publisher's note: Copernicus Publications remains neutral with regard to jurisdictional claims in published maps and institutional affiliations.
The authors would like to thank Jeff Ayres of the Wisconsin Educational Communications Board for his assistance at WLEF. Glenn M. Wolfe is gratefully acknowledged for publicly providing FluxToolbox and F0AM (archived on GitHub) and a MATLAB base of analysis scripts, portions of which were altered for use in this analysis. Hariprasad Alwe and Dylan Millet are acknowledged for providing the sampling inlet used in this study. We acknowledge that this project occurred on the traditional territory of the Ojibwe people.
This work was supported by the National Science Foundation (NSF) (grant nos. GEO AGS 1822420 and AGS 1829667). Flux observations at US-PFa were supported by the US Department of Energy Ameriflux Network Management Project award to the ChEAS core site cluster and the NOAA Carbon Cycle and Greenhouse Gases tall tower program. Patricia Cleary was supported by the University of Wisconsin–Eau Claire Blugold differential tuition fund for faculty–student collaborative research and the NSF (grant no. GEO AGS 1918850).
This paper was edited by Kelley Barsanti and reviewed by two anonymous referees.
Aaltonen, H., Pumpanen, J., Pihlatie, M., Hakola, H., Hellén, H., Kulmala, L., Vesala, T., and Bäck, J.: Boreal pine forest floor biogenic volatile organic compound emissions peak in early summer and autumn, Agr. Forest Meteorol., 151, 682–691, https://doi.org/10.1016/j.agrformet.2010.12.010, 2011.
Acton, W. J. F., Schallhart, S., Langford, B., Valach, A., Rantala, P., Fares, S., Carriero, G., Tillmann, R., Tomlinson, S. J., Dragosits, U., Gianelle, D., Hewitt, C. N., and Nemitz, E.: Canopy-scale flux measurements and bottom-up emission estimates of volatile organic compounds from a mixed oak and hornbeam forest in northern Italy, Atmos. Chem. Phys., 16, 7149–7170, https://doi.org/10.5194/acp-16-7149-2016, 2016.
Adams, R. P.: Systematics of Juniperus section Juniperus based on leaf essential oils and random amplified polymorphic DNAs (RAPDs), Biochem. Syst. Ecol., 28, 515–528, https://doi.org/10.1016/S0305-1978(99)00089-7, 2000a.
Adams, R. P.: The serrate leaf margined Juniperus (Section Sabina) of the western hemisphere: systematics and evolution based on leaf essential oils and Random Amplified Polymorphic DNAs (RAPDs), Biochem. Syst. Ecol., 28, 975–989, https://doi.org/10.1016/S0305-1978(00)00022-3, 2000b.
Adams, R. P. and Nguyen, S.: Infra-specific variation in Juniperus deppeana and F. Sperryi in the Davis Mountains of Texas: variation in leaf essential oils and random amplified polymorphic DNAS (RAPDS), Phytologia, 87, 96–108, 2005.
Adams, R. P., González Elizondo, M. S., Elizondo, M. G., and Slinkman, E.: DNA fingerprinting and terpenoid analysis of Juniperus blancoi var. huehuentensis (Cupressaceae), a new subalpine variety from Durango, Mexico, Biochem. Syst. Ecol., 34, 205–211, https://doi.org/10.1016/j.bse.2005.11.004, 2006.
Affek, H. P. and Yakir, D.: Protection by isoprene against singlet oxygen in leaves, Plant Physiol., 129, 269–277, https://doi.org/10.1104/pp.010909, 2002.
Alvarado, A., Tuazon, E. C., Aschmann, S. M., Atkinson, R., and Arey, J.: Products of the gas-phase reactions of O(3P) atoms and O3 with α-pinene and 1,2-dimethyl-1-cyclohexene, J. Geophys. Res.-Atmos., 103, 25541–25551, https://doi.org/10.1029/98JD00524, 1998.
Amiri, H.: Volatile constituents and antioxidant activity of flowers, stems and leaves of Nasturtium officinale R. Br., Nat. Prod. Res., 26, 109–115, https://doi.org/10.1080/14786419.2010.534998, 2012.
Atkinson, R. and Arey, J.: Gas-phase tropospheric chemistry of biogenic volatile organic compounds: A review, Atmos. Environ., 37, 197–219, https://doi.org/10.1016/S1352-2310(03)00391-1, 2003.
Bakwin, P. S., Tans, P. P., Hurst, D. F., and Zhao, C.: Measurements of carbon dioxide on very tall towers: results of the NOAA/CMDL program, Tellus B, 50, 401–415, https://doi.org/10.1034/J.1600-0889.1998.T01-4-00001.X, 1998.
Banwart, W. L. and Bremner, J. M.: Formation of volatile sulfur compounds by microbial decomposition of sulfur-containing amino acids in soils, Soil Biol. Biochem., 7, 359–364, https://doi.org/10.1016/0038-0717(75)90050-4, 1975.
Barnes, I., Hjorth, J., and Mihalapoulos, N.: Dimethyl sulfide and dimethyl sulfoxide and their oxidation in the atmosphere, Chem. Rev., 106, 940–975, https://doi.org/10.1021/cr020529+, 2006.
Benjamin, M. T., Sudol, M., Bloch, L., and Winer, A. M.: Low-emitting urban forests: A taxonomic methodology for assigning isoprene and monoterpene emission rates, Atmos. Environ., 30, 1437–1452, https://doi.org/10.1016/1352-2310(95)00439-4, 1996.
Berresheim, H. and Vulcan, V. D.: Vertical distributions of COS, CS2, DMS and other sulfur compounds in a loblolly pine forest, Atmos. Environ. A, 26, 2031–2036, https://doi.org/10.1016/0960-1686(92)90087-2, 1992.
Bianchi, F., Kurtén, T., Riva, M., Mohr, C., Rissanen, M. P., Roldin, P., Berndt, T., Crounse, J. D., Wennberg, P. O., Mentel, T. F., Wildt, J., Junninen, H., Jokinen, T., Kulmala, M., Worsnop, D. R., Thornton, J. A., Donahue, N., Kjaergaard, H. G., and Ehn, M.: Highly Oxygenated Organic Molecules (HOM) from Gas-Phase Autoxidation Involving Peroxy Radicals: A Key Contributor to Atmospheric Aerosol, Chem. Rev., 119, 3472–3509, https://doi.org/10.1021/acs.chemrev.8b00395, 2019.
Bouvier-Brown, N. C., Goldstein, A. H., Gilman, J. B., Kuster, W. C., and De Gouw, J. A.: In-situ ambient quantification of monoterpenes, sesquiterpenes and related oxygenated compounds during BEARPEX 2007: Implications for gas- and particle-phase chemistry, Atmos. Chem. Phys., 9, 5505–5518, https://doi.org/10.5194/acp-9-5505-2009, 2009.
Brown, P. J., Jullion, L., Landschützer, P., and Bakker, D. C. E.: Dimethyl sulfide in the Amazon rain forest, Global Biogeochem. Cy., 29, 288–306, https://doi.org/10.1002/2014GB004969, 2015.
Bryan, A. M., Bertman, S. B., Carroll, M. A., Dusanter, S., Edwards, G. D., Forkel, R., Griffith, S., Guenther, A. B., Hansen, R. F., Helmig, D., Jobson, B. T., Keutsch, F. N., Lefer, B. L., Pressley, S. N., Shepson, P. B., Stevens, P. S., and Steiner, A. L.: In-canopy gas-phase chemistry during CABINEX 2009: Sensitivity of a 1-D canopy model to vertical mixing and isoprene chemistry, Atmos. Chem. Phys., 12, 8829–8849, https://doi.org/10.5194/acp-12-8829-2012, 2012.
Butterworth, B. J., Desai, A. R., Metzger, S., Townsend, P. A., Schwartz, M. D., Petty, G. W., Mauder, M., Vogelmann, H., Andresen, C. G., Augustine, T. J., Bertram, T. H., Brown, W. O. J., Buban, M., Cleary, P., Durden, D. J., Florian, C. R., Iglinski, T. J., Kruger, E. L., Lantz, K., Lee, T. R., Meyers, T. P., Mineau, J. K., Olson, E. R., Oncley, S. P., Paleri, S., Pertzborn, R. A., Pettersen, C., Plummer, D. M., Riihimaki, L. D., Guzman, E. R., Sedlar, J., Smith, E. N., Speidel, J., Stoy, P. C., Sühring, M., Thom, J. E., Turner, D. D., Vermeuel, M. P., Wagner, T. J., Wang, Z., Wanner, L., White, L. D., Wilczak, J. M., Wright, D. B., and Zheng, T.: Connecting Land–Atmosphere Interactions to Surface Heterogeneity in CHEESEHEAD19, B. Am. Meteorol. Soc., 102, E421–E445, https://doi.org/10.1175/BAMS-D-19-0346.1, 2021.
Chen, J. W. and Cao, K. F.: Changes in activities of antioxidative system and monoterpene and photochemical efficiency during seasonal leaf senescence in Hevea brasiliensis trees, Acta Physiol. Plant., 30, 1–9, https://doi.org/10.1007/s11738-007-0070-1, 2008.
Claflin, M. S., Pagonis, D., Finewax, Z., Handschy, A. V., Day, D. A., Brown, W. L., Jayne, J. T., Worsnop, D. R., Jimenez, J. L., Ziemann, P. J., de Gouw, J., and Lerner, B. M.: An in situ gas chromatograph with automatic detector switching between PTR- and EI-TOF-MS: isomer-resolved measurements of indoor air, Atmos. Meas. Tech., 14, 133–152, https://doi.org/10.5194/amt-14-133-2021, 2021.
Curci, G., Beekmann, M., Vautard, R., Smiatek, G., Steinbrecher, R., Theloke, J., and Friedrich, R.: Modelling study of the impact of isoprene and terpene biogenic emissions on European ozone levels, Atmos. Environ., 43, 1444–1455, https://doi.org/10.1016/j.atmosenv.2008.02.070, 2009.
Dal Maso, M., Kulmala, M., Riipinen, I., Wagner, R., Hussein, T., Aalto, P. P., and Lehtinen, K. E. J.: Formation and growth of fresh atmospheric aerosols: Eight years of aerosol size distribution data from SMEAR II, Hyytiälä, Finland, Boreal Environ. Res., 10, 323–336, 2005.
Davis, K. J., Bakwin, P. S., Yi, C., Berger, B. W., Zhao, C., Teclaw, R. M., and Isebrands, J. G.: The annual cycles of CO2 and H2O exchange over a northern mixed forest as observed from a very tall tower, Global Change Biol., 9, 1278–1293, https://doi.org/10.1046/j.1365-2486.2003.00672.x, 2003.
Desai, A. R.: AmeriFlux US-PFa Park Falls/WLEF, AmeriFlux [data set], https://doi.org/10.17190/AMF/1246090, 1996.
Desai, A. R., Noormets, A., Bolstad, P. V., Chen, J., Cook, B. D., Davis, K. J., Euskirchen, E. S., Gough, C., Martin, J. G., Ricciuto, D. M., Schmid, H. P., Tang, J., and Wang, W.: Influence of vegetation and seasonal forcing on carbon dioxide fluxes across the Upper Midwest, USA: Implications for regional scaling, Agr. Forest Meteorol., 148, 288–308, https://doi.org/10.1016/j.agrformet.2007.08.001, 2008.
Desai, A. R., Helliker, B. R., Moorcroft, P. R., Andrews, A. E., and Berry, J. A.: Climatic controls of interannual variability in regional carbon fluxes from top-down and bottom-up perspectives, J. Geophys. Res.-Biogeo., 115, G02011, https://doi.org/10.1029/2009jg001122, 2010.
Desai, A. R., Xu, K., Tian, H., Weishampel, P., Thom, J., Baumann, D., Andrews, A. E., Cook, B. D., King, J. Y., and Kolka, R.: Landscape-level terrestrial methane flux observed from a very tall tower, Agr. Forest Meteorol., 201, 61–75, https://doi.org/10.1016/j.agrformet.2014.10.017, 2015.
Dewitz, J.: National Land Cover Dataset (NLCD) 2016 Products, US Geological Survey, https://doi.org/10.5066/P96HHBIE, 2020.
Duncan, J. B., Bianco, L., Adler, B., Bell, T., Djalalova, I. V., Riihimaki, L., Sedlar, J., Smith, E. N., Turner, D. D., Wagner, T. J., and Wilczak, J. M.: Evaluating convective planetary boundary layer height estimations resolved by both active and passive remote sensing instruments during the CHEESEHEAD19 field campaign, Atmos. Meas. Tech., 15, 2479–2502, https://doi.org/10.5194/amt-15-2479-2022, 2022.
Ehn, M., Thornton, J. a, Kleist, E., Sipilä, M., Junninen, H., Pullinen, I., Springer, M., Rubach, F., Tillmann, R., Lee, B., Lopez-Hilfiker, F., Andres, S., Acir, I.-H., Rissanen, M., Jokinen, T., Schobesberger, S., Kangasluoma, J., Kontkanen, J., Nieminen, T., Kurtén, T., Nielsen, L. B., Jørgensen, S., Kjaergaard, H. G., Canagaratna, M., Maso, M. D., Berndt, T., Petäjä, T., Wahner, A., Kerminen, V.-M., Kulmala, M., Worsnop, D. R., Wildt, J., and Mentel, T. F.: A large source of low-volatility secondary organic aerosol, Nature, 506, 476–479, https://doi.org/10.1038/nature13032, 2014.
Fall, R., Albritton, D. L., Fehsenfeld, F. C., Kuster, W. C., and Goldan, P. D.: Laboratory studies of some environmental variables controlling sulfur emissions from plants, J. Atmos. Chem., 6, 341–362, https://doi.org/10.1007/BF00051596, 1988.
Faloona, I., Tan, D., Brune, W., Hurst, J., Barket, D., Couch, T. L., Shepson, P., Apel, E., Riemer, D., Thornberry, T., Carroll, M. A., Sillman, S., Keeler, G. J., Sagady, J., Hooper, D., and Paterson, K.: Nighttime observations of anomalously high levels of hydroxyl radicals above a deciduous forest canopy, J. Geophys. Res.-Atmos., 106, 24315–24333, https://doi.org/10.1029/2000JD900691, 2001.
Foken, T. and Wichura, B.: Tools for quality assessment of surface-based flux measurements, Agr. Forest Meteorol., 78, 83–105, https://doi.org/10.1016/0168-1923(95)02248-1, 1996.
Foken, T., Göckede, M., Mauder, M., Mahrt, L., Amiro, B. D., and Munger, J. W.: Post-field data quality control, Handb. micrometeorology a Guid, Surf. Flux Meas. Anal., 29, 181–208, 2004.
Fuchs, N. A. and Sutugin, A. G.: Highly dispersed aerosols, in: Topics in Current Aerosol Research, edited by: Hidy, G. M. and Brock, J. R., Pergamon, New York, p. 1, https://doi.org/10.1016/B978-0-08-016674-2.50006-6, 1971.
Fuentes, J. D. and Wang, D.: On the seasonality of isoprene emissions from a mixed temperate forest, Ecol. Appl., 9, 1118–1131, https://doi.org/10.1890/1051-0761(1999)009[1118:OTSOIE]2.0.CO;2, 1999.
Fuentes, J. D., Chamecki, M., Dos Santos, R. M. N., Von Randow, C., Stoy, P. C., Katul, G., Fitzjarrald, D., Manzi, A., Gerken, T., Trowbridge, A., Freire, L. S., Ruiz-Plancarte, J., Maia, J. M. F., Tóta, J., Dias, N., Fisch, G., Schumacher, C., Acevedo, O., Mercer, J. R., and Yañez-Serrano, A. M.: Linking meteorology, turbulence, and air chemistry in the amazon rain forest, B. Am. Meteorol. Soc., 97, 2329–2342, https://doi.org/10.1175/BAMS-D-15-00152.1, 2016.
Fulgham, S. R., Millet, D. B., Alwe, H. D., Goldstein, A. H., Schobesberger, S., and Farmer, D. K.: Surface Wetness as an Unexpected Control on Forest Exchange of Volatile Organic Acids, Geophys. Res. Lett., 47, e2020GL088745, https://doi.org/10.1029/2020GL088745, 2020.
Gaona-Colmán, E., Blanco, M. B., Barnes, I., Wiesen, P., and Teruel, M. A.: OH- and O3-initiated atmospheric degradation of camphene: temperature dependent rate coefficients, product yields and mechanisms, RSC Adv., 7, 2733–2744, https://doi.org/10.1039/c6ra26656h, 2017.
Geron, C., Rasmussen, R., Arnts, R. R., and Guenther, A.: A review and synthesis of monoterpene speciation from forests in the United States, Atmos. Environ., 34, 1761–1781, https://doi.org/10.1016/S1352-2310(99)00364-7, 2000.
Geron, C. D., Guenther, A. B., and Pierce, T. E.: An improved model for estimating emissions of volatile organic compounds from forests in the eastern United States, J. Geophys. Res., 99, 12773–12781, 1994.
Goldan, P. D., Kuster, W. C., Albritton, D. L., and Fehsenfeld, F. C.: The Measurement of Natural Sulfur Emissions from Soils and Vegetation: Three Sites in the Eastern United States Revisited, J. Atmos. Chem., 5, 439–467, 1987.
Gratien, A., Johnson, S. N., Ezell, M. J., Dawson, M. L., Bennett, R., and Finlayson-Pitts, B. J.: Surprising formation of p-cymene in the oxidation of α-pinene in air by the atmospheric oxidants OH, O3, and NO3, Environ. Sci. Technol., 45, 2755–2760, https://doi.org/10.1021/es103632b, 2011.
Greenberg, J. P., Asensio, D., Turnipseed, A., Guenther, A. B., Karl, T., and Gochis, D.: Contribution of leaf and needle litter to whole ecosystem BVOC fluxes, Atmos. Environ., 59, 302–311, https://doi.org/10.1016/j.atmosenv.2012.04.038, 2012.
Guenther, A., Nicholas, C., Fall, R., Klinger, L., Mckay, W. A., and Scholes, B.: A global model of natural volatile organic compound emissions, J. Geophys. Res., 100, 8873–8892, 1995.
Guenther, A., Karl, T., Harley, P., Wiedinmyer, C., Palmer, P. I., and Geron, C.: Estimates of global terrestrial isoprene emissions using MEGAN (Model of Emissions of Gases and Aerosols from Nature), Atmos. Chem. Phys., 6, 3181–3210, https://doi.org/10.5194/acp-6-3181-2006, 2006.
Guenther, A. B., Jiang, X., Heald, C. L., Sakulyanontvittaya, T., Duhl, T., Emmons, L. K., and Wang, X.: The model of emissions of gases and aerosols from nature version 2.1 (MEGAN2.1): An extended and updated framework for modeling biogenic emissions, Geosci. Model Dev., 5, 1471–1492, https://doi.org/10.5194/gmd-5-1471-2012, 2012.
Hakola, H., Laurila, T., Rinne, J., and Puhto, K.: The ambient concentrations of biogenic hydrocarbons at a northern European, boreal site, Atmos. Environ., 34, 4971–4982, https://doi.org/10.1016/S1352-2310(00)00192-8, 2000.
Hakola, H., Tarvainen, V., Laurila, T., Hiltunen, V., Hellén, H., and Keronen, P.: Seasonal variation of VOC concentrations above a boreal coniferous forest, Atmos. Environ., 37, 1623–1634, https://doi.org/10.1016/S1352-2310(03)00014-1, 2003.
Haugen, D. E., Freeman, P. C., and Theisen, M. A.: The Forest Resources of the Chequamegon-Nicolet National Forest, US Department of Agriculture, Forest Service, North Central Research Station, https://doi.org/10.2737/NC-RB-194, 1998.
Hellén, H., Hakola, H., Pystynen, K. H., Rinne, J., and Haapanala, S.: C2–C10 hydrocarbon emissions from a boreal wetland and forest floor, Biogeosciences, 3, 167–174, https://doi.org/10.5194/bg-3-167-2006, 2006.
Helmig, D.: Ozone removal techniques in the sampling of atmospheric volatile organic trace gases, Atmos. Environ., 31, 3635–3651, https://doi.org/10.1016/S1352-2310(97)00144-1, 1997.
Helmig, D., Klinger, L., Guenther, A., Vierling, L., Geron, C., and Zimmerman, P.: Biogenic Volatile Organic Compound Emissions (BVOCs) I. Identifications from Three Continental Sites in the U.S., Chemosphere, 38, 2163–2187, https://doi.org/10.1016/S0045-6535(98)00425-1, 1999.
Helmig, D., Daly, R. W., Milford, J., and Guenther, A.: Seasonal trends of biogenic terpene emissions, Chemosphere, 93, 35–46, https://doi.org/10.1016/j.chemosphere.2013.04.058, 2013.
Holzke, C., Hoffmann, T., Jaeger, L., Koppmann, R., and Zimmer, W.: Diurnal and seasonal variation of monoterpene and sesquiterpene emissions from Scots pine (Pinus sylvestris L.), Atmos. Environ., 40, 3174–3185, https://doi.org/10.1016/j.atmosenv.2006.01.039, 2006.
Horst, T. W.: A simple formula for attenuation of eddy fluxes measured with first order response scalar sensors, Bound.-Lay. Meteorol., 82, 219–233, https://doi.org/10.1023/A:1000229130034, 1997.
Huang, G., Brook, R., Crippa, M., Janssens-Maenhout, G., Schieberle, C., Dore, C., Guizzardi, D., Muntean, M., Schaaf, E., and Friedrich, R.: Speciation of anthropogenic emissions of non-methane volatile organic compounds: a global gridded data set for 1970–2012, Atmos. Chem. Phys., 17, 7683–7701, https://doi.org/10.5194/acp-17-7683-2017, 2017.
Isaacman-VanWertz, G., Sueper, D. T., Aikin, K. C., Lerner, B. M., Gilman, J. B., de Gouw, J. A., Worsnop, D. R., and Goldstein, A. H.: Automated single-ion peak fitting as an efficient approach for analyzing complex chromatographic data, J. Chromatogr. A, 1529, 81–92, https://doi.org/10.1016/J.CHROMA.2017.11.005, 2017.
Isaacman-VanWertz, G., Lerner, B. M., and Sueper, D. T.: TAG Explorer and iNtegration (TERN), Zenodo [code], https://doi.org/10.5281/ZENODO.6940761, 2022.
Isebrands, J. G., Guenther, A. B., Harley, P., Helmig, D., Klinger, L., Vierling, L., Zimmerman, P., and Geron, C.: Volatile organic compound emission rates from mixed deciduous and coniferous forests in Northern Wisconsin, USA, Atmos. Environ., 33, 2527–2536, https://doi.org/10.1016/S1352-2310(98)00250-7, 1999.
Isidorov, V. A., Smolewska, M., Purzyåska-Pugacewicz, A., and Tyszkiewicz, Z.: Chemical composition of volatile and extractive compounds of pine and spruce leaf litter in the initial stages of decomposition, Biogeosciences, 7, 2785–2794, https://doi.org/10.5194/bg-7-2785-2010, 2010.
Jajic, I., Sarna, T., and Strzalka, K.: Senescence, stress, and reactive oxygen species, Plants, 4, 393–411, https://doi.org/10.3390/plants4030393, 2015.
Janson, R. W.: Monoterpene emissions from Scots pine and Norwegian spruce, J. Geophys. Res., 98, 2839–2850, https://doi.org/10.1029/92JD02394, 1993.
Jaoui, M. and Kamens, R. M.: Gaseous and particulate oxidation products analysis of a mixture of α-pinene + β-pinene/O3/air in the absence of light and α-pinene + β-pinene/NOx/air in the presence of natural sunlight, J. Atmos. Chem., 44, 259–297, https://doi.org/10.1023/A:1022977427523, 2003.
Jardine, K., Yañez Serrano, A., Arneth, A., Abrell, L., Jardine, A., Van Haren, J., Artaxo, P., Rizzo, L. V., Ishida, F. Y., Karl, T., Kesselmeier, J., Saleska, S., and Huxman, T.: Within-canopy sesquiterpene ozonolysis in Amazonia, J. Geophys. Res.-Atmos., 116, 1–10, https://doi.org/10.1029/2011JD016243, 2011.
Jenkin, M. E., Young, J. C., and Rickard, A. R.: The MCM v3.3.1 degradation scheme for isoprene, Atmos. Chem. Phys., 15, 11433–11459, https://doi.org/10.5194/acp-15-11433-2015, 2015.
Jimenez, J. L., Canagaratna, M. R., Donahue, N. M., Prevot, A. S. H., Zhang, Q., Kroll, J. H., DeCarlo, P. F., Allan, J. D., Coe, H., Ng, N. L., Aiken, A. C., Docherty, K. S., Ulbrich, I. M., Grieshop, A. P., Robinson, A. L., Duplissy, J., Smith, J. D., Wilson, K. R., Lanz, V. A., Hueglin, C., Sun, Y. L., Tian, J., Laaksonen, A., Raatikainen, T., Rautiainen, J., Vaattovaara, P., Ehn, M., Kulmala, M., Tomlinson, J. M., Collins, D. R., Cubison, M. J., Dunlea, E. J., Huffman, J. A., Onasch, T. B., Alfarra, M. R., Williams, P. I., Bower, K., Kondo, Y., Schneider, J., Drewnick, F., Borrmann, S., Weimer, S., Demerjian, K., Salcedo, D., Cottrell, L., Griffin, R., Takami, A., Miyoshi, T., Hatakeyama, S., Shimono, A., Sun, J. Y., Zhang, Y. M., Dzepina, K., Kimmel, J. R., Sueper, D., Jayne, J. T., Herndon, S. C., Trimborn, A. M., Williams, L. R., Wood, E. C., Middlebrook, A. M., Kolb, C. E., Baltensperger, U., and Worsnop, D. R.: Evolution of organic aerosols in the atmosphere, Science, 326, 1525–1529, https://doi.org/10.1126/science.1180353, 2009.
Johnson, D. and Marston, G.: The gas-phase ozonolysis of unsaturated volatile organic compounds in the troposphere, Chem. Soc. Rev., 37, 699–716, https://doi.org/10.1039/b704260b, 2008.
Jokinen, T., Berndt, T., Makkonen, R., Kerminen, V.-M., Junninen, H., Paasonen, P., Stratmann, F., Herrmann, H., Guenther, A. B., Worsnop, D. R., Kulmala, M., Ehn, M., and Sipilä, M.: Production of extremely low volatile organic compounds from biogenic emissions: Measured yields and atmospheric implications, P. Natl. Acad. Sci. USA, 112, 7123–7128, https://doi.org/10.1073/pnas.1423977112, 2015.
Jokinen, T., Kausiala, O., Garmash, O., Peräkylä, O., Junninen, H., Schobesberger, S., Yan, C., Sipilä, M., and Rissanen, M. P.: Production of highly oxidized organic compounds from ozonolysis of β-caryophyllene: Laboratory and field measurements, Boreal Environ. Res., 21, 262–273, 2016.
Kallio, M., Jussila, M., Rissanen, T., Anttila, P., Hartonen, K., Reissell, A., Vreuls, R., Adahchour, M., and Hyötyläinen, T.: Comprehensive two-dimensional gas chromatography coupled to time-of-flight mass spectrometry in the identification of organic compounds in atmospheric aerosols from coniferous forest, J. Chromatogr. A, 1125, 234–243, https://doi.org/10.1016/j.chroma.2006.05.050, 2006.
Kanda, K. I., Tsuruta, H., and Tsuruta, H.: Emissions of sulfur gases from various types of terrestrial higher plants, Soil Sci. Plant Nutr., 41, 321–328, https://doi.org/10.1080/00380768.1995.10419589, 1995.
Karl, T., Guenther, A., Spirig, C., Hansel, A., and Fall, R.: Seasonal variation of biogenic VOC emissions above a mixed hardwood forest in northern Michigan, Geophys. Res. Lett., 30, 2–5, https://doi.org/10.1029/2003GL018432, 2003.
Kilgour, D. B., Novak, G. A., Sauer, J. S., Moore, A. N., Dinasquet, J., Amiri, S., Franklin, E. B., Mayer, K., Winter, M., Morris, C. K., Price, T., Malfatti, F., Crocker, D. R., Lee, C., Cappa, C. D., Goldstein, A. H., Prather, K. A., and Bertram, T. H.: Marine gas-phase sulfur emissions during an induced phytoplankton bloom, Atmos. Chem. Phys., 22, 1601–1613, https://doi.org/10.5194/acp-22-1601-2022, 2022.
Kim, D., Stevens, P. S., and Hites, R. A.: Rate constants for the gas-phase reactions of OH and O3 with β-ocimene, β-myrcene, and α-and β-farnesene as a function of temperature, J. Phys. Chem. A, 115, 500–506, https://doi.org/10.1021/jp111173s, 2011.
Kim, S., Karl, T., Guenther, A., Tyndall, G., Orlando, J., Harley, P., Rasmussen, R., and Apel, E.: Emissions and ambient distributions of Biogenic Volatile Organic Compounds (BVOC) in a ponderosa pine ecosystem: Interpretation of PTR-MS mass spectra, Atmos. Chem. Phys., 10, 1759–1771, https://doi.org/10.5194/acp-10-1759-2010, 2010.
Kirkby, J., Curtius, J., Almeida, J., Dunne, E., Duplissy, J., Ehrhart, S., Franchin, A., Gagné, S., Ickes, L., Kürten, A., Kupc, A., Metzger, A., Riccobono, F., Rondo, L., Schobesberger, S., Tsagkogeorgas, G., Wimmer, D., Amorim, A., Bianchi, F., Breitenlechner, M., David, A., Dommen, J., Downard, A., Ehn, M., Flagan, R. C., Haider, S., Hansel, A., Hauser, D., Jud, W., Junninen, H., Kreissl, F., Kvashin, A., Laaksonen, A., Lehtipalo, K., Lima, J., Lovejoy, E. R., Makhmutov, V., Mathot, S., Mikkilä, J., Minginette, P., Mogo, S., Nieminen, T., Onnela, A., Pereira, P., Petäjä, T., Schnitzhofer, R., Seinfeld, J. H., Sipilä, M., Stozhkov, Y., Stratmann, F., Tomé, A., Vanhanen, J., Viisanen, Y., Vrtala, A., Wagner, P. E., Walther, H., Weingartner, E., Wex, H., Winkler, P. M., Carslaw, K. S., Worsnop, D. R., Baltensperger, U., and Kulmala, M.: Role of sulphuric acid, ammonia and galactic cosmic rays in atmospheric aerosol nucleation, Nature, 476, 429–435, https://doi.org/10.1038/nature10343, 2011.
Kljun, N., Calanca, P., Rotach, M. W., and Schmid, H. P.: A simple two-dimensional parameterisation for Flux Footprint Prediction (FFP), Geosci. Model Dev., 8, 3695–3713, https://doi.org/10.5194/gmd-8-3695-2015, 2015.
Krechmer, J., Lopez-Hilfiker, F., Koss, A., Hutterli, M., Stoermer, C., Deming, B., Kimmel, J., Warneke, C., Holzinger, R., Jayne, J., Worsnop, D., Fuhrer, K., Gonin, M., and De Gouw, J.: Evaluation of a New Reagent-Ion Source and Focusing Ion-Molecule Reactor for Use in Proton-Transfer-Reaction Mass Spectrometry, Anal. Chem., 90, 12011–12018, https://doi.org/10.1021/acs.analchem.8b02641, 2018.
Laffineur, Q., Aubinet, M., Schoon, N., Amelynck, C., Müller, J. F., Dewulf, J., Van Langenhove, H., Steppe, K., Šimpraga, M., and Heinesch, B.: Isoprene and monoterpene emissions from a mixed temperate forest, Atmos. Environ., 45, 3157–3168, https://doi.org/10.1016/j.atmosenv.2011.02.054, 2011.
Laffineur, Q., Aubinet, M., Schoon, N., Amelynck, C., Müller, J. F., Dewulf, J., Van Langenhove, H., Steppe, K., and Heinesch, B.: Abiotic and biotic control of methanol exchanges in a temperate mixed forest, Atmos. Chem. Phys., 12, 577–590, https://doi.org/10.5194/acp-12-577-2012, 2012.
Lamb, B., Westberg, H., Allwine, G., Bamesberger, L., and Guenther, A.: Measurement of biogenic sulfur emissions from soils and vegetation: Application of dynamic enclosure methods with Natusch filter and GC/FPD analysis, J. Atmos. Chem., 5, 469–491, https://doi.org/10.1007/BF00113906, 1987.
Langford, B., Acton, W., Ammann, C., Valach, A., and Nemitz, E.: Eddy-covariance data with low signal-to-noise ratio: Time-lag determination, uncertainties and limit of detection, Atmos. Meas. Tech., 8, 4197–4213, https://doi.org/10.5194/amt-8-4197-2015, 2015.
Lee, A., Goldstein, A. H., Keywood, M. D., Gao, S., Varutbangkul, V., Bahreini, R., Ng, N. L., Flagan, R. C., and Seinfeld, J. H.: Gas-phase products and secondary aerosol yields from the ozonolysis of ten different terpenes, J. Geophys. Res.-Atmos., 111, 1–18, https://doi.org/10.1029/2005JD006437, 2006a.
Lee, A., Goldstein, A. H., Kroll, J. H., Ng, N. L., Varutbangkul, V., Flagan, R. C., and Seinfeld, J. H.: Gas-phase products and secondary aerosol yields from the photooxidation of 16 different terpenes, J. Geophys. Res.-Atmos., 111, 1–25, https://doi.org/10.1029/2006JD007050, 2006b.
Lee, J. H., Batterman, S. A., Jia, C., and Chernyak, S.: Ozone artifacts and carbonyl measurements using tenax GR, tenax TA, carbopack B, and carbopack X adsorbents, J. Air Waste Manage. Assoc., 56, 1503–1517, https://doi.org/10.1080/10473289.2006.10464560, 2006.
Li, H., Canagaratna, M. R., Riva, M., Rantala, P., Zhang, Y., Thomas, S., Heikkinen, L., Flaud, P., Villenave, E., Perraudin, E., Worsnop, D., Kulmala, M., Ehn, M., and Bianchi, F.: Atmospheric organic vapors in two European pine forests measured by a Vocus PTR-TOF: insights into monoterpene and sesquiterpene oxidation processes, Atmos. Chem. Phys., 21, 4123–4147, https://doi.org/10.5194/acp-21-4123-2021, 2021.
Lindgren, B. S. and Miller, D. R.: Effect of verbenone on five species of bark beetles (Coleoptera: Scolytidae) in lodgepole pine forests, Environ. Entomol., 31, 759–765, https://doi.org/10.1603/0046-225x-31.5.759, 2002.
Loreto, F. and Schnitzler, J. P.: Abiotic stresses and induced BVOCs, Trends Plant Sci., 15, 154–166, https://doi.org/10.1016/j.tplants.2009.12.006, 2010.
Loreto, F., Pinelli, P., Manes, F., and Kollist, H.: Impact of ozone on monoterpene emissions and evidence for an isoprene-like antioxidant action of monoterpenes emitted by Quercus ilex leaves, Tree Physiol., 24, 361–367, https://doi.org/10.1093/treephys/24.4.361, 2004.
Lucero, M. E., Fredrickson, E. L., Estell, R. E., Morrison, A. A., and Richman, D. B.: Volatile composition of gutierrezia sarothrae (broom snakeweed) as determined by steam distillation and solid phase microextraction, J. Essent. Oil Res., 18, 121–125, https://doi.org/10.1080/10412905.2006.9699039, 2006.
Mäki, M., Aaltonen, H., Heinonsalo, J., Hellén, H., Pumpanen, J., and Bäck, J.: Boreal forest soil is a significant and diverse source of volatile organic compounds, Plant Soil, 441, 89–110, https://doi.org/10.1007/s11104-019-04092-z, 2019.
Martínez, E., Cabanas, B., Aranda, A., and Martín, P.: Kinetics of the reactions of NO3 radical with selected monoterpenes: A temperature dependence study, Environ. Sci. Technol., 32, 3730–3734, https://doi.org/10.1021/es970899t, 1998.
McKinney, K. A., Lee, B. H., Vasta, A., Pho, T. V., and Munger, J. W.: Emissions of isoprenoids and oxygenated biogenic volatile organic compounds from a New England mixed forest, Atmos. Chem. Phys., 11, 4807–4831, https://doi.org/10.5194/acp-11-4807-2011, 2011.
Medina, A. L., Lucero, M. E., Holguin, F. O., Estell, R. E., Posakony, J. J., Simon, J., and O'Connell, M. A.: Composition and antimicrobial activity of Anemopsis californica leaf oil, J. Agric. Food Chem., 53, 8694–8698, https://doi.org/10.1021/jf0511244, 2005.
Merle, H., Morón, M., Blázquez, M. A., and Boira, H.: Taxonomical contribution of essential oils in mandarins cultivars, Biochem. Syst. Ecol., 32, 491–497, https://doi.org/10.1016/J.BSE.2003.09.010, 2004.
Mozaffar, A., Schoon, N., Bachy, A., Digrado, A., Heinesch, B., Aubinet, M., Fauconnier, M. L., Delaplace, P., du Jardin, P., and Amelynck, C.: Biogenic volatile organic compound emissions from senescent maize leaves and a comparison with other leaf developmental stages, Atmos. Environ., 176, 71–81, https://doi.org/10.1016/j.atmosenv.2017.12.020, 2018.
Peñuelas, J. and Staudt, M.: BVOCs and global change, Trends Plant Sci., 15, 133–144, https://doi.org/10.1016/j.tplants.2009.12.005, 2010.
Pfammatter, J. A., Krause, A., and Raffa, K. F.: Evaluating predators and competitors in Wisconsin red pine forests for attraction to mountain pine beetle pheromones for anticipatory biological control, Environ. Entomol., 44, 1161–1171, https://doi.org/10.1093/ee/nvv091, 2015.
Portillo-Estrada, M. and Niinemets, Ü.: Massive release of volatile organic compounds due to leaf midrib wounding in Populus tremula, Plant Ecol., 219, 1021–1028, https://doi.org/10.1007/s11258-018-0854-y, 2018.
Portillo-Estrada, M., Ariza-Carricondo, C., and Ceulemans, R.: Outburst of senescence-related VOC emissions from a bioenergy poplar plantation, Plant Physiol. Biochem., 148, 324–332, https://doi.org/10.1016/j.plaphy.2020.01.024, 2020.
Rostad, C. E. and Pereira, W. E.: Kovats and lee retention indices determined by gas chromatography/mass spectrometry for organic compounds of environmental interest, J. High Resolut. Chromatogr., 9, 328–334, https://doi.org/10.1002/jhrc.1240090603, 1986.
Saunois, M., Bousquet, P., Poulter, B., Peregon, A., Ciais, P., Canadell, J. G., Dlugokencky, E. J., Etiope, G., Bastviken, D., Houweling, S., Janssens-Maenhout, G., Tubiello, F. N., Castaldi, S., Jackson, R. B., Alexe, M., Arora, V. K., Beerling, D. J., Bergamaschi, P., Blake, D. R., Brailsford, G., Brovkin, V., Bruhwiler, L., Crevoisier, C., Crill, P., Covey, K., Curry, C., Frankenberg, C., Gedney, N., Höglund-Isaksson, L., Ishizawa, M., Ito, A., Joos, F., Kim, H. S., Kleinen, T., Krummel, P., Lamarque, J. F., Langenfelds, R., Locatelli, R., Machida, T., Maksyutov, S., McDonald, K. C., Marshall, J., Melton, J. R., Morino, I., Naik, V., O'Doherty, S., Parmentier, F. J. W., Patra, P. K., Peng, C., Peng, S., Peters, G. P., Pison, I., Prigent, C., Prinn, R., Ramonet, M., Riley, W. J., Saito, M., Santini, M., Schroeder, R., Simpson, I. J., Spahni, R., Steele, P., Takizawa, A., Thornton, B. F., Tian, H., Tohjima, Y., Viovy, N., Voulgarakis, A., Van Weele, M., Van Der Werf, G. R., Weiss, R., Wiedinmyer, C., Wilton, D. J., Wiltshire, A., Worthy, D., Wunch, D., Xu, X., Yoshida, Y., Zhang, B., Zhang, Z., and Zhu, Q.: The global methane budget 2000–2012, Earth Syst. Sci. Data, 8, 697–751, https://doi.org/10.5194/essd-8-697-2016, 2016.
Savtchenko, A., Ouzounov, D., Ahmad, S., Acker, J., Leptoukh, G., Koziana, J., and Nickless, D.: Terra and Aqua MODIS products available from NASA GES DAAC, Adv. Space Res., 34, 710–714, https://doi.org/10.1016/j.asr.2004.03.012, 2004.
Seok, B., Helmig, D., Ganzeveld, L., Williams, M. W., and Vogel, C. S.: Dynamics of nitrogen oxides and ozone above and within a mixed hardwood forest in northern Michigan, Atmos. Chem. Phys., 13, 7301–7320, https://doi.org/10.5194/acp-13-7301-2013, 2013.
Spirig, C., Neftel, A., Ammann, C., Dommen, J., Grabmer, W., Thielmann, A., Schaub, A., Beauchamp, J., Wisthaler, A., and Hansel, A.: Eddy covariance flux measurements of biogenic VOCs during ECHO 2003 using proton transfer reaction mass spectrometry, Atmos. Chem. Phys., 5, 465–481, https://doi.org/10.5194/acp-5-465-2005, 2005.
Staubes, R., Georgii, H.-W., and Ockelmann, G.: Flux of COS, DMS and CS2 from various soils in Germany, Tellus B, 41, 305–313, https://doi.org/10.1111/j.1600-0889.1989.tb00309.x, 1989.
Still, C. J., Page, G., Rastogi, B., Griffith, D. M., Aubrecht, D. M., Kim, Y., and Burns, S. P.: No evidence of canopy-scale leaf thermoregulation to cool leaves below air temperature across a range of forest ecosystems, P. Natl. Acad. Sci. USA, 119, 1–8, https://doi.org/10.1073/pnas.2205682119, 2022.
Stull, R. B.: An Introduction to Boundary Layer Meteorology, Springer Science & Business Media, 427–428, ISBN 9027727686, 1988.
Takeoka, G., Perrino, C., and Buttery, R.: Volatile constituents of used frying oils, J. Agric. Food Chem., 44, 654–660, https://doi.org/10.1021/jf950430m, 1996.
Trowbridge, A. M., Stoy, P. C., and Phillips, R. P.: Soil Biogenic Volatile Organic Compound Flux in a Mixed Hardwood Forest: Net Uptake at Warmer Temperatures and the Importance of Mycorrhizal Associations, J. Geophys. Res.-Biogeo., 125, 1–14, https://doi.org/10.1029/2019JG005479, 2020.
Vaněk, T., Halík, J., Vaòková, R., and Valterová, I.: Formation of trans-Verbenol and Verbenone from α-Pinene Catalysed by Immobilised Picea abies Cells, Biosci. Biotechnol. Biochem., 69, 321–325, https://doi.org/10.1271/BBB.69.321, 2005.
Vermeuel, M. P. and Bertram, T. H.: Observations of biogenic volatile organic compounds over a mixed temperate forest during the summer to autumn transition, MINDS @ UW [data set], http://digital.library.wisc.edu/1793/83610, last access: 26 September 2022.
Vermeuel, M. P., Novak, G. A., Jernigan, C. M., and Bertram, T. H.: Diel Profile of Hydroperoxymethyl Thioformate: Evidence for Surface Deposition and Multiphase Chemistry, Environ. Sci. Technol., 54, 12521–12529, https://doi.org/10.1021/acs.est.0c04323, 2020.
Vermeuel, M. P., Cleary, P. A., Desai, A. R., and Bertram, T. H.: Simultaneous Measurements of O3 and HCOOH Vertical Fluxes Indicate Rapid In-Canopy Terpene Chemistry Enhances O3 Removal Over Mixed Temperate Forests, Geophys. Res. Lett., 48, e2020GL090996, https://doi.org/10.1029/2020GL090996, 2021.
WDNR: Nasturtium officinale, Aquatic Invasive Species Literature Review, https://dnr.wi.gov/topic/Invasives/documents/classification/Nasturtium officinale.pdf (last access: 16 June 2022), 2010.
Wilczak, J. M., Oncley, S. P., and Stage, S. A.: Sonic anemometer tilt correction algorithms, Bound.-Lay. Meteorol., 99, 127–150, https://doi.org/10.1023/A:1018966204465, 2001.
Wolfe, G. M., Marvin, M. R., Roberts, S. J., Travis, K. R., and Liao, J.: The framework for 0-D atmospheric modeling (F0AM) v3.1, Geosci. Model Dev., 9, 3309–3319, https://doi.org/10.5194/gmd-9-3309-2016, 2016.
Xu, K., Metzger, S., and Desai, A. R.: Upscaling tower-observed turbulent exchange at fine spatio-temporal resolution using environmental response functions, Agr. Forest Meteorol., 232, 10–22, https://doi.org/10.1016/j.agrformet.2016.07.019, 2017.
Yang, Z.: Measurement of Biogenic Sulfur Gases Emission from some Chinese and Japanese Soils, Atmos. Environ., 30, 2399–2405, 1996.
Yi, Z., Wang, X., Ouyang, M., Zhang, D., and Zhou, G.: Air-soil exchange of dimethyl sulfide, carbon disulfide, and dimethyl disulfide in three subtropical forests in south China, J. Geophys. Res.-Atmos., 115, 1–7, https://doi.org/10.1029/2010JD014130, 2010.
Yonghui, S. and Atkinson, R.: Atmospheric lifetimes and fates of a series of sesquiterpenes, J. Geophys. Res., 100, 7275–7281, https://doi.org/10.1029/95JD00368, 1995.
Yousefzadi, M., Heidari, M., Akbarpour, M., Mirjalili, M. H., Zeinali, A., and Parsa, M.: In vitro Cytotoxic Activity of the Essential Oil of Dorema ammoniacum D. Don., Middle-East J. Sci. Res., 7, 511–514, 2011.