


Abstract
The ZrO B1Π–X1Σ+, B1Π–A1Δ, and C1Σ+–X1Σ+ band systems are important opacity sources in the near-infrared and optical spectra of S-type stars. A total of 21 rovibronic bands with v'' ≤ 7 and  were observed and fit for the B1Π–X1Σ+ transition, five bands for the 90ZrO B1Π–A1Δ transition and one band for the 90ZrO C1Σ+–X1Σ+ transition. All band systems were analyzed using high-temperature, high-resolution emission spectra collected at the National Solar Observatory (Kitt Peak). A modern spectroscopic analysis was performed using the PGOPHER program to provide updated spectroscopic constants. In general, we improve the accuracy of the line positions reported in the literature and slightly extend the vibrational analysis. Equilibrium molecular constants were then derived and combined with new ab initio calculations of transition dipole moment functions to produce line lists with line strengths.
Export citation and abstract BibTeX RIS

Original content from this work may be used under the terms of the Creative Commons Attribution 4.0 licence. Any further distribution of this work must maintain attribution to the author(s) and the title of the work, journal citation and DOI.
1. Introduction
The presence of ZrO bands are characteristic features of S-type stars. Merrill (1922) identified the S class of stars as distinct from M stars (characterized by TiO bands) and carbon stars (C type, with C2 bands). S stars (Merrill 1922) have a number of unique absorption features that were not assigned to a particular carrier. The following year Merrill (1923) recorded the spectrum of a Zr arc in air and by direct comparison with the red spectra of S-type stars (R Cygni and others) assigned these features to ZrO. The extensive analysis of ZrO laboratory spectra began in the 1930s with the work of Lowater (1932, 1935).
S stars are red giant and asymptotic giant branch (AGB) stars that are part of the M-MS-S-SC-C stellar sequence determined by increasing carbon abundance (Keenan 1954; Ake 1979; Keenan & Boeshaar 1980). As stars leave the main sequence, He burning increases the C/O abundance ratio from less than 1 for M stars to greater than 1 for C stars. S stars have C/O abundance ratios of about 1. Zr is produced in the s-process by neutron capture and subsequent β decay. The classification of S-type stars is based primarily on the strength of ZrO bands (Keenan 1954; Ake 1979; Keenan & Boeshaar 1980).
Merrill (1952) discovered technetium (Tc) lines in the spectra of S-type stars. There are no stable Tc isotopes, and 99Tc has a half-life of 2.1 × 10⁵ yr in the laboratory. Only 99Tc is produced by the s-process in AGB stars (Van Eck & Jorissen 1999). There are two types of S stars: intrinsic S stars contain Tc and extrinsic S stars do not. Extrinsic S stars are binaries in which the s-process elements such as Zr were transferred from companion stars (Van Eck & Jorissen 2000). Zr isotope ratios provide information on the neutron density during the s-process (Lambert et al. 1995).
Owing to its astrophysical importance, ZrO has been extensively studied in the laboratory. As a transition metal oxide, ZrO has many low-lying electronic states, which lead to numerous optical and near-infrared transitions as illustrated by Figure 1 in the review paper by McKemmish et al. (2018). McKemmish et al. (2018) carried out a Measured Active Rotational-Vibrational Energy Levels (MARVEL) analysis that provided rovibronic energy levels from the observed line positions. In our present work, we focus on the band systems between the low-lying singlet states: B1Π–X1Σ+, B1Π–A1Δ, and C1Σ+–X1Σ+. Very recently (after the submission of this manuscript), Perri et al. (2023) published an extensive new line list and partition function for ZrO.
The first rotational analysis of the 0–0 band of the B1Π–X1Σ+ transition for 90Zr16O, 94Zr16O, and 96Zr16O was performed by Balfour & Tatum (1973). They analyzed ZrO emission spectra recorded with a spectrograph by S. Davis and coworkers at the University of California, Berkeley using an arc source from ZrO2 in natural abundance and three isotopically enriched samples (Tatum & Balfour 1973). Later, Phillips & Davis (1976a) analyzed many additional ZrO B1Π–X1Σ+ bands using the same photographic plates. Pettersson et al. (2000) measured the B1Π-state dipole moment to be 3.43 D. More recently, we carried out an analysis of 13 90Zr16O B1Π–X1Σ+ bands with vibrational levels up to four in both ground and excited states using carbon furnace emission spectra recorded with the National Solar Observatory Fourier transform spectrometer (Sorensen & Bernath 2021).
The 0–0 band of the C1Σ+–X1Σ+ transition was first observed by Phillips & Davis (1976b) for 90Zr16O, 94Zr16O, and 96Zr16O utilizing a zirconium arc source and the photographic plates cited above. The 0–0 band was later analyzed by Simard et al. (1988) for 90Zr16O, 91Zr16O, 92Zr16O, 94Zr16O, and 96Zr16O using laser-induced fluorescence of a supersonically cooled ZrO molecular beam. Zr has five naturally occurring isotopes with abundances 90Zr 51.5%, 91Zr 11.2%, 92Zr 17.2%, 94Zr 17.4%, and 96Zr 2.8% (Rumble 2022). Simard et al. (1988) also measured the radiative lifetimes of several vibrational levels of the C1Σ+ and B1Π states. Balfour & Chowdhury (2010) have reported the 0–0, 1–1, 1–0, 2–2, 3–3, 2–0, and 3–0 R-band heads for the C1Σ+–X1Σ+ transition.
For the B1Π–A1Δ transition, Hammer & Davis (1981) used a carbon furnace and a Fourier transform spectrometer (FTS) to report line positions of the 0–0, 0–1, 1–0, 1–1, and 2–1 bands of 90Zr16O and the 0–0 bands for 91Zr16O, 92Zr16O, 94Zr16O, and 96Zr16O (Hammer & Davis 1981; Hammer et al. 1981).
There have been two microwave studies of ZrO, the first of which was performed by Suenram et al. (1990) in which the X1Σ+ J = 1–0 transition frequencies for v = 0 for 91Zr16O, 92Zr16O, and 94Zr16O were measured using a laser ablation source coupled with a Fourier transform microwave spectrometer. They also measured the X1Σ+ ZrO dipole moment to be 2.55 D. The second study by Beaton & Gerry (1999) extended Suenram et al. (1990)'s work to provide the X1Σ+ J = 1–0 transition frequencies for excited vibrational levels and for additional isotopologues.
Additional experimental observations include the anion photoelectron spectrum of ZrO−, which yields a ZrO electron affinity of 1.26 eV (Li et al. 2012). The photoelectron spectrum of ZrO gives an ionization energy of 6.8127 eV (Luo et al. 2015). The ZrO dissociation energy D° is 7.89 ± 0.15 eV (Murad & Hildenbrand 1975).
There have been several relevant theoretical calculations of ZrO properties. Langhoff & Bauschlicher (1988) carried out ab initio calculations of the spectroscopic constants of the low-lying electronic states. In 1990, they extended their work to include transition dipole moments and radiative lifetimes. Tabet et al. (2019) calculated spectroscopic properties, dipole moments, and transition dipole moments associated with a large number of ZrO singlet and triplet states. The recent paper by Perri et al. (2023) also carried out extensive ab initio calculations at a similar level of theory as that in Tabet et al. (2019).
This present paper is an extension of our previous work on ZrO (Sorensen & Bernath 2021) and improves on it in a number of ways. First, we extend the analysis of the observed 90Zr16O B1Π–X1Σ+ bands and recalculate the line strengths with a new transition dipole moment. Second, we perform a PGOPHER spectroscopic analysis of the 90Zr16O B1Π–A1Δ (0–0, 0–1, 1–0, 1–1, and 2–1 bands) and C1Σ+–X1Σ+ (0–0 band) transitions. Third, we perform ab initio calculations reporting updated transition dipole moment functions for the B1Π–X1Σ+, B1Π–A1Δ, and C1Σ+–X1Σ+ transitions and use these data along with RKR potential energy curves to report line strengths.
2. Experiment
The ZrO emission spectra used in our work were recorded by S. Davis and coworkers using a carbon tube furnace (King furnace) in 1980 with the McMath–Pierce 1 m FTS at the National Solar Observatory at Kitt Peak in Arizona. For the B1Π–X1Σ+ and C1Σ+–X1Σ+ transitions, ZrO2 was heated to 2678 K with 72 Torr of He buffer gas. The ZrO thermal emission was measured with the Kitt Peak FTS using a visible beamsplitter at a spectral resolution of 0.046 cm−1. The spectral range 8400–24,000 cm−1 was set by a GG400 red pass filter (approximately 400 nm) and a silicon photodiode detector. Spectral calibration was carried out using Zr atomic lines (Lawler et al. 2022) with the linear equation σcal = 0.999997678σobs + 0.0157. The wavenumber scale was calibrated to better than 0.001 cm−1. This spectrum had a slightly improved signal-to-noise ratio (S/N) and improved calibration compared to our previous work (Sorensen & Bernath 2021).
In the analysis of the B1Π–A1Δ transition, the spectrum described above was used for many of the lines. However, three additional Kitt Peak spectra recorded with similar experimental conditions were also used. Most of the 0–0 and 1–1 band lines were from a spectrum recorded at a temperature of 2663 K and a pressure of 68 Torr He. The spectral bandpass of 9000–9700 cm−1 was set with filters and the spectral resolution was 0.015 cm−1. Calibration was carried out by comparison with the calibrated spectrum discussed above. The 9000–9700 cm−1 spectrum was shifted by −0.0328 cm−1 obtained using Zr atomic lines common to both spectra.
The B1Π–A1Δ 1–0 band region was partly analyzed with a spectrum covering 10,200–10,400 cm−1 at a spectral resolution of 0.025 cm−1. The spectral range was set with a bandpass filter. The experimental conditions were 2673 K for temperature and 95 Torr of He buffer gas. The calibration again used Zr atomic lines and the spectrum was shifted by −0.0355 cm−1.
The B1Π–A1Δ 0–1 band region was analyzed partly with a spectrum covering the 8200–8800 cm−1 region set by a bandpass filter at a spectral resolution of 0.025 cm−1. The experimental conditions were 2723 K for temperature and 100 Torr of He buffer gas. The calibration again used Zr atomic lines and the wavenumber scale was multiplied by 0.999996829.
3. Ab Initio Calculations
The potential energy curves of the X1Σ+, A1Δ, B1Π, and C1Σ+ states and the electric transition dipole moment curves for the B1Π–X1Σ+, B1Π–A1Δ, and C1Σ+–X1Σ+ transitions have been calculated with the MOLPRO quantum chemistry package (Werner et al. 2012, 2022) using the internally contracted multireference configuration interaction method (MRCI; Werner & Knowles 1988). State-averaged complete active space self-consistent field calculations (CASSCF; Werner & Knowles 1985; Kreplin et al. 2019) were performed to optimize the molecular orbitals (MOs) used in the MRCI calculations. Davidson's correction for unlinked quadruple excitations (Langhoff & Davidson 1974) adapted to a relaxed reference (Werner et al. 2008), has been taken into account in the energy calculations (MRCI+Q).
The 28 core electrons of the zirconium atom (Ar + 3d10) are described by a small-core scalar-relativistic pseudo potential adjusted in multiconfiguration Dirac–Hartree–Fock calculations, and the remaining electrons are explicitly represented by the related cc-pwCVQZ-PP basis set (Peterson et al. 2007). The cc-pCVQZ basis set has been adopted for the oxygen atom (Woon & Dunning 1993). The active space defining the multiconfigurational reference wave functions contains five σ, three π, and one δ MOs correlating to the zirconium 5s, 4d, and oxygen 2s, 2p atomic orbitals, with an additional π orbital improving the correlation of oxygen 2pπ and zirconium 4dπ, as previously suggested (Langhoff & Bauschlicher 1990). Additional MOs (two σ and one π) correlating to the zirconium 4s and 4p orbitals have been included in the single and double excitations MRCI process, leading to the correlation of all 12 out-of-core electrons of zirconium. Only the 1s-like orbital of oxygen, which lies too deep for interacting appreciably with the valence shells, has been kept frozen. In order to reduce the large size of the resulting MRCI Hamiltonian matrix, we have selected the reference configurations from the CASSCF wave function using a threshold of 0.0001 for the CI coefficients. This resulted in MRCI expansions of some 160 million contracted configuration state functions. The analysis of these wave functions at equilibrium geometry provides for each calculated state the main contributing configurations with their weights of
in which (A) is the ground configuration [core] (1–5)σ2 1π4 2π4, and (B)–(F) correspond to the following electron promotions with respect to (A): 5σ2 → 1δ2, 5σ2 → 3π2, 5σ1 → 1δ1, 5σ2 → 1δ13π1, and 5σ1 → 3π1, respectively.
A balanced description of the states involved in the different transitions has been obtained by applying a CASSCF state averaging including the X, A and B states for the B–X and B–A transitions, while for the C–X transition it has proven important to include the X, A, and C states, but also the D1Γ and C3Σ− states, arising as the C state from configuration (B).
The calculations have been carried out at a set of internuclear distances, r, ranging from 1.5–2.1 Å, in steps of 0.02 Å, providing the potential energy functions for the X, A, B, and C states and the transition dipole moment functions for the transitions of interest. The equilibrium spectroscopic properties for each state have been derived from Dunham 8th-order polynomial fits of the corresponding potential energy curves. The transition dipole moment functions have been interpolated by B-splines to create a set of 1592 points on the same r range, to be used in the determination of the band strengths. The calculated points and the interpolated points are provided as supplementary data. The ab initio results are presented and commented on in the discussion section.
4. Results
Spectral fitting was performed using the PGOPHER program (Western 2017). In the case of the 90Zr16O B1Π–X1Σ+ transition, the spectroscopic constants from our previous study were used as initial parameters (Sorensen & Bernath 2021). The ground X1Σ+ state was constrained by adding microwave data of the J = 1–0 transition for v = 0, 1, 2, and 3 for 90Zr16O taken from Beaton & Gerry (1999)'s work. PGOPHER's default standard deviation of 1 was used for all fitted lines except for the microwave lines, which had their standard deviation weightings switched to 0.02.
An overview of the spectrum analyzed for the B1Π–X1Σ+ transition (red, upward) is presented in Figure 1 along with a simulated spectrum (black, downward). A representative band head for each of the B1Π–X1Σ+, B1Π–A1Δ, and C1Σ+–X1Σ+ transitions is shown in Figures 2–4 along with their PGOPHER simulations. The additional weak features not simulated in these figures are due to Zr isotopologues and triplet transitions. The spectra analyzed had a high spectral line density that made analysis difficult especially for higher vibrational levels. However, we were able to consistently assign transitions with J values in excess of 100, often in the 120–150 range.
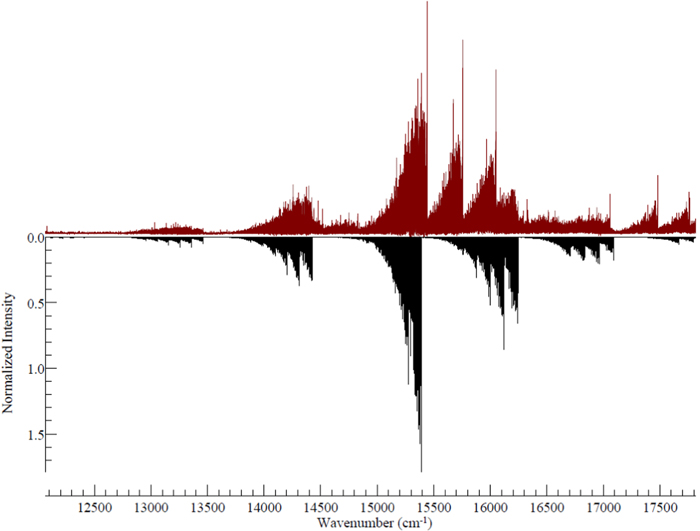
Figure 1. An overview of the spectrum for ZrO (red, upward) along with the simulated spectrum (black, downward) for 21 bands of the 90Zr16O B1Π–X1Σ+ transition. Note that spectral features that are not simulated are largely associated with the d3Φ–a3Δ transition, which will be discussed in a future publication.
Download figure:
Standard image High-resolution image
Figure 2. Typical 90Zr16O B1Π–X1Σ+ spectrum (red, upward) with a simulated R-branch head for the 1–0 band (blue, downward).
Download figure:
Standard image High-resolution image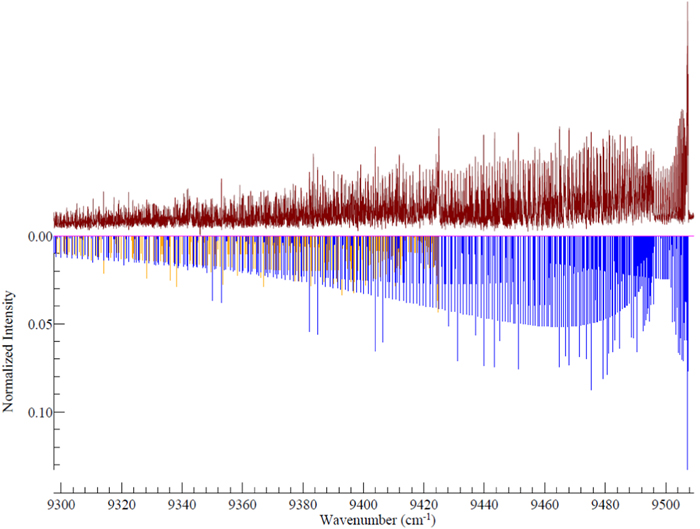
Figure 3. Typical 90Zr16O B1Π–A1Δ spectrum (red, upward) with a simulated R-branch head for the 0–0 band (blue, downward) and 1–1 band (yellow, downward)
Download figure:
Standard image High-resolution image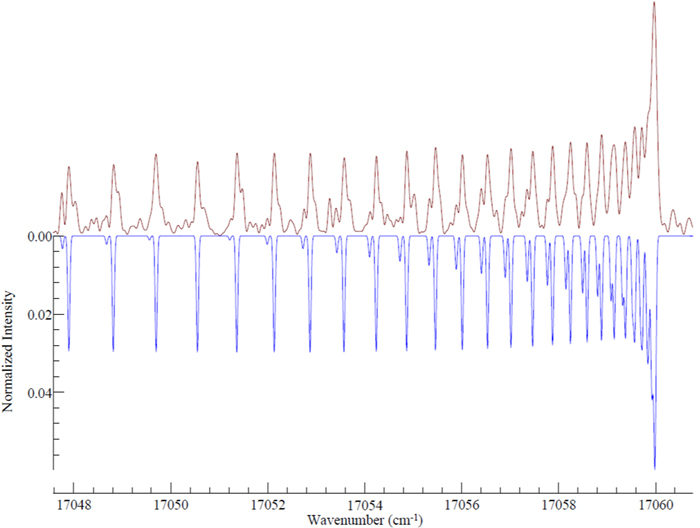
Figure 4. 90Zr16O C1Σ+–X1Σ+ spectrum (red, upward) with a simulated R-branch head for the 0–0 band (blue, downward)
Download figure:
Standard image High-resolution imageAs depicted in the ZrO energy diagram (Figure 1 in the paper by McKemmish et al. 2018), there are a large number of low-lying electronic states and many band systems falling in the visible and near-infrared spectral region. In our paper, we focus on the singlet systems, but the triplet systems (particularly α, β, γ) are equally significant and are mainly responsible for the missing features in the simulation shown in Figure 1.
In the case of the B1Π–X1Σ+ transition, our fit contains a total of 5514 lines associated with 21 bands of 90Zr16O, with an average error of 0.015 cm−1. Table 1 shows the calculated 90Zr16O R bandheads, 19 of which have been previously reported (Phillips & Davis 1976a; Sorensen & Bernath 2021) and two of which are new (bold values). Table 2 provides the observed line positions, and Tables 3 and 4 the spectroscopic constants obtained from the PGOPHER fit for the X1Σ+ and B1Π states.
Table 1. Calculated R-band Heads (in cm−1) for the 90Zr16O B1Π–X1Σ+ Transition
 /v'' /v'' | 0 | 1 | 2 | 3 | 4 | 5 | 6 | 7 |
|---|---|---|---|---|---|---|---|---|
| 0 | 15,391.406 | 14,422.643 | 13,460.945 | ⋯ | ⋯ | ⋯ | ⋯ | ⋯ |
| 1 | 16,244.260 | ⋯ | 14,313.493 | 13,358.676 | ⋯ | ⋯ | ⋯ | ⋯ |
| 2 | 17,091.317 | 16,122.319 | ⋯ | 14,205.326 | 13,257.399 | 12,316.624 | ⋯ | ⋯ |
| 3 | ⋯ | 16,963.411 | ⋯ | ⋯ | 14,098.081 | 13,157.055 | 12,223.201 | ⋯ |
| 4 | ⋯ | ⋯ | 16,836.428 | ⋯ | ⋯ | 13,991.766 | 13057.662 | 12,130.713 |
| 5 | ⋯ | ⋯ | ⋯ | 16,710.295 | ⋯ | ⋯ | ⋯ | 12,959.137 |
Note. Plain text denotes R-band heads that have been previously reported. Bold text shows bands that are new.
Download table as: ASCIITypeset image
Table 2. Sample of Lines and Residuals for the 90Zr16O B1Π–X1Σ+, B1Π–A1Δ, and C1Σ+–X1Σ+ Transitions from the PGOPHER Log File

|

| J'' | P'' | Obs (cm−1) | Calc (cm−1) | O–C (cm−1) | Line Assignment |
|---|---|---|---|---|---|---|---|
| 20 | e | 19 | e | 15,391.4090 | 15,391.3999 | 0.0091 | R(19): B1Pi v = 0 20e–X1Sigma v = 0 19e |
| 19 | e | 18 | e | 15,391.4090 | 15,391.4057 | 0.0033 | R(18): B1Pi v = 0 19e–X1Sigma v = 0 18e |
| 22 | e | 21 | e | 15,391.2802 | 15,391.2601 | 0.0201 | R(21): B1Pi v = 0 22e–X1Sigma v = 0 21e |
| 23 | e | 22 | e | 15,391.1434 | 15,391.1260 | 0.0174 | R(22): B1Pi v = 0 23e–X1Sigma v = 0 22e |
| 24 | e | 23 | e | 15,390.9681 | 15,390.9491 | 0.0190 | R(23): B1Pi v = 0 24e–X1Sigma v = 0 23e |
| 25 | e | 24 | e | 15,390.7479 | 15,390.7294 | 0.0185 | R(24): B1Pi v = 0 25e–X1Sigma v = 0 24e |
| 16 | e | 17 | e | 9477.9757 | 9477.9733 | 0.0024 | Pe(17): B1Pi v = 0 16e–A1Delta v = 0 17e |
| 16 | f | 17 | f | 9478.0361 | 9478.0377 | −0.0015 | Pf(17): B1Pi v = 0 16f–A1Delta v = 0 17f |
| 58 | e | 58 | f | 9444.4061 | 9444.4046 | 0.0015 | Qf(58): B1Pi v = 0 58e–A1Delta v = 0 58f |
| 37 | f | 38 | f | 9443.7537 | 9443.753 | 0.0007 | Pf(38): B1Pi v = 0 37f–A 1Delta v = 0 38f |
| 91 | e | 90 | e | 16,975.4809 | 16,975.467 | 0.0139 | R(90): C1Sigma v = 0 91e–X1sigma v = 0 90e |
| 50 | e | 51 | e | 16,961.8936 | 16,961.8988 | −0.0052 | P(51): C1Sigma v = 0 50e–X1sigma v = 0 51e |
| 88 | e | 87 | e | 16,982.8763 | 16,982.8702 | 0.0061 | R(87): C1Sigma v = 0 88e–X1sigma v = 0 87e |
| 73 | e | 72 | e | 17,014.705 | 17,014.7042 | 0.0008 | R(72): C1Sigma v = 0 73e–X1sigma v = 0 72e |
Note. J is total angular momentum, P is the e/f parity, Obs is the observed line position in cm−1, Calc is the calculated line position in cm−1, and O−C is the observed minus calculated line position in cm−1.
Only a portion of this table is shown here to demonstrate its form and content. A machine-readable version of the full table is available.
Download table as: DataTypeset image
Table 3. 90Zr16O Spectroscopic Constants (in cm−1) of the X1Σ+ State for v = 0 − 7 with a 1 Standard Deviation Error Indicated in Parentheses as Obtained from PGOPHER
| v | Tv | Bv | Dv × 107 | Hv × 1013 |
|---|---|---|---|---|
| 0 | 0 | 0.42261086(554) | 3.17714(542) | −0.50(15) |
| 1 | 969.5271(16) | 0.42066068(546) | 3.20005(527) | 0.77(14) |
| 2 | 1932.1582(16) | 0.41871098(550) | 3.23480(533) | 2.492(146) |
| 3 | 2887.9104(17) | 0.41674871(551) | 3.26186(536) | 3.824(147) |
| 4 | 3836.7706(21) | 0.41477259(553) | 3.26593(544) | 3.300(152) |
| 5 | 4778.7271(19) | 0.41279389(555) | 3.29429(552) | 4.984(159) |
| 6 | 5713.7565(24) | 0.41081684(564) | 3.33218(578) | 6.767(178) |
| 7 | 6641.8924(26) | 0.40880945(581) | 3.32195(664) | 6.232(264) |
Download table as: ASCIITypeset image
Table 4. 90Zr16O Spectroscopic Constants (in cm−1) of the B1Π State for v = 0 − 5 in with a 1 Standard Deviation Error Indicated in Parentheses as Obtained from PGOPHER
| v | Tv | Bv | Dv × 107 | Hv × 1013 | qv × 104 |

|
|---|---|---|---|---|---|---|
| 0 | 15,383.4208(13) | 0.40151627(549) | 3.50636(532) | −0.28(14) | −2.3673(28) | 1.041(14) |
| 1 | 16,236.9632(14) | 0.39961155(551) | 3.55471(535) | 2.767(147) | −2.3291(37) | 8.74(24) |
| 2 | 17,084.6130(14) | 0.39768122(550) | 3.56869(534) | 3.265(147) | −2.3055(33) | 0.819(24) |
| 3 | 17,926.2955(19) | 0.39574427(552) | 3.58941(542) | 4.401(152) | −2.3718(41) | 1.982(35) |
| 4 | 18,762.0048(19) | 0.39379547(556) | 3.61338(555) | 5.974(162) | −2.2993(48) | 1.618(46) |
| 5 | 19,591.6863(25) | 0.39182947(578) | 3.62373(657) | 7.383(261) | −2.3174(80) | 2.594(87) |
Download table as: ASCIITypeset image
For the B1Π−A1Δ transition the fit included 2790 lines associated with the 0–0, 0–1, 1–0, 1–1, and 2–1 bands with an average error of 0.015 cm−1. The A1Δ v = 0 and 1 spectroscopic constants are reported in Table 5.
Table 5. 90Zr16O Spectroscopic Constants for the A1Δ State for v = 0 and 1 in cm−1
| v | Tv | Bv | Dv × 107 | Hv × 1013 |
|---|---|---|---|---|
| 0 | 5887.19588(93) | 0.41645893(52) | 3.26039(69) | −3.96(24) |
| 1 | 6823.11895(88) | 0.41459260(65) | 3.3202(11) | 3.338(54) |
Download table as: ASCIITypeset image
The v = 0 level of the C1Σ+ state is perturbed by the v = 2 level of the B1Π state (Phillips & Davis 1976b). The v = 0 C1Σ+ level crosses the v = 2 B1Π level at about  . So, we fitted 456 lines associated with the 0–0 band of the C1Σ+–X1Σ+ transition and the 2–0 band of the B1Π–X1Σ+ transition together using the symmetrized matrix element
  . The average error in the fit was 0.018 cm−1 and the C1Σ+ spectroscopic constants are reported in Table 6. The B1Π–A1Δ and C1Σ+–X1Σ+ fits fixed the ground X1Σ+ and the B1Π constants to the values in Tables 3 and 4. The fitted lines are provided as supplemental data. Our line positions go to higher J values than the Simard et al. (1988) analysis based on laser-excitation spectra of a jet-cooled laser vaporization source. The line positions of Phillips & Davis (1976b) go to high J values but are not as accurate as our new values because they are from an arc source recorded with a grating spectrograph.
Table 6. 90Zr16O Spectroscopic Constants for the C1Σ+ State for v = 0 in cm−1
| T0 | B0 | D0 × 107 |
|---|---|---|
| 17,050.4060(24) | 0.40480978(97) | 3.45068(73) |
Note. Perturbation term 0.004065(54) 〈A, v = 2∣2J+ L−∣C, v = 0〉 is added to the Hamiltonian.
Download table as: ASCIITypeset image
The spectroscopic constants obtained through the spectral line fit for 90Zr16O, as shown in Tables 3 and 4, are used to obtain the equilibrium constants ωe , ωe xe , ωe ye , Be , αe , γe , δe , De , and βe , Equations (1)–(3) below are for the excited B1Π and ground X1Σ+ states of 90Zr16O as shown in Table 7 along with previously reported values. Table 8 also contains equilibrium constants for the A1Δ state, although data for only v = 0 and 1 were obtained. To estimate ωe and ωe xe , ωe xe = 3.1912 cm−1 (Hammer & Davis 1981) was combined with ΔG1/2 = 935.92 cm−1 (Table 8) to give ωe = 942.305 cm−1. For the C1Σ+ state, data for only v = 0 was measured so ωe = 876 cm−1, ωe xe = 3 cm−1, and αe = 0.00165 cm−1 were taken from Simard et al. (1988) and combined with B0 (Table 6) to give Be = 0.40563605 cm−1


Table 7. Equilibrium Constants for the B1Π and X1Σ+ States in cm−1 or Å for re
| B1Π | X1Σ+ | |||
|---|---|---|---|---|
| Constants | This Work | Previous Works | This Work | Previous Works |
| ωe | 859.4201(171) | 859.424252(344) a 859.44 b | 976.3962(104) | 976.40869(593) a 976.51 b |
| ωe xe | 2.92554(665) | 2.921697(161) a 2.918 b | 3.43556(303) | 3.44153(116) a 3.462 b |
| ωe ye × 103 | −6.422(732) | −7.2866(212) a −8.12 b | −1.169(249) | 0.52 b |
| Be | 0.40246814(390) | 0.402460322(736) a | 0.42357926(511) | 0.4235669(134) a 0.423608 b |
| αe × 103 | 1.89695(305) | 1.8770(132) a 1.920 b | 1.93751(297) | 1.9186(126) a 1.954 b |
| γe × 106 | −6.790(494) | −26.11(618) a −5.0 b | −4.175(361) | −10.68(246) a −3.3 b |
| De × 107 | 3.5089(86) | 3.52 b | 3.1726(83) | 3.19 b |
| βe × 109 | 2.24(25) | ⋯ | 2.21(18) | ⋯ |
| re | 1.75629524(851) | 1.75631230(44) a 1.75831(13) c | 1.71196914(103) | 1.71199404(79) a 1.71195242(73) d 1.71387(13) c |
Notes.
a Sorensen & Bernath (2021). b Phillips & Davis (1976a) Phillips and Davis did not report error limits on their values. c Pettersson et al. (2000). d Beaton & Gerry (1999).Download table as: ASCIITypeset image
Table 8. Equilibrium Constants for the A1Δ State in cm−1 or Å for re
| This Work | Previous Works | |
|---|---|---|
| ΔG1/2 | 935.92 | 935.9335 a |
| Be | 0.417389 | 0.417392(10) b |
| αe × 103 | 1.866 | 1.866(10) b |
| re | 1.724611 | 1.725(2) c |
Notes. As we only fit the v = 0 and v = 1 states for the A1Δ state, error analysis was not possible.
a This value is a ΔG1/2 = ωe − 2ωe xe . b Hammer & Davis (1981). c McKemmish et al. (2018).Download table as: ASCIITypeset image
After completing these spectroscopic fits and computations, our attention turned to producing line lists that included line strengths. This was achieved by utilizing Le Roy's RKR and LEVEL programs (Le Roy 2017a, 2017b). The RKR program utilizes the first-order semiclassical Rydberg–Klein–Rees (RKR) method to approximate diatomic molecule potential energy surfaces. By knowing the vibrational quantum number (v) dependence of molecular vibrational energies, Gv , and the inertial rotational constants, Bv , the RKR method can determine these potential energy surfaces.
These RKR potential energy surfaces are then combined with our computed B1Π–X1Σ+, B1Π–A1Δ, and C1Σ+–X1Σ+ transition dipole moment functions, which are shown in Figure 5 (along with a comparison to the transition dipole moment functions reported by Langhoff & Bauschlicher 1990) as the input to the LEVEL program. The LEVEL program uses this input data to solve the one-dimensional Schrödinger equation to compute output parameters such as band strengths and Franck–Condon factors with the band strengths being shown in Table 9 for the B1Π–X1Σ+ transition and Table 10 for the B1Π–A1Δ and C1Σ+–X1Σ+ transitions. These output band strengths were then entered into PGOPHER to determine the individual line strengths for the observed B1Π–X1Σ+, B1Π–A1Δ, and C1Σ+–X1Σ+ transitions. PGOPHER was utilized to output a line list of all possible B1Π–X1Σ+ bands with  and v'' ≤ 7, B1Π–A1Δ with
  and v'' ≤ 1 and C1Σ+–X1Σ+ with
  for 90Zr16O. These line lists are provided for all possible bands up to J = 200 as .csv files as an extended table with a table stub displayed in Table 11. Note that for J values greater than the highest experimentally observed values, the predicted line positions start to deviate from their true values. However, they are still useful because they provide opacity for the simulation of astronomical spectra.
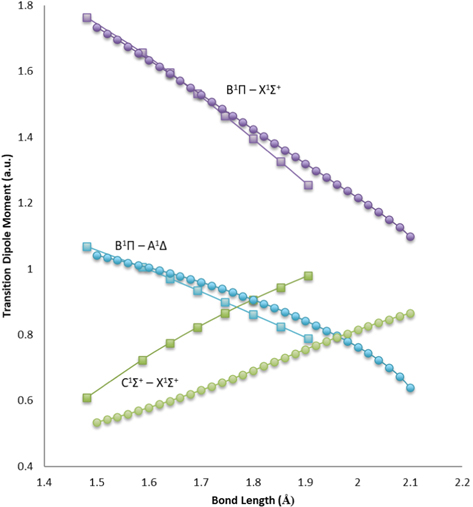
Figure 5. Computed transition dipole moment functions for the B1Π–X1Σ+ (purple), B1Π–A1Δ (blue), and C1Σ+–X1Σ+ (green) transitions. Square markers indicate transition dipole moment data taken from Langhoff & Bauschlicher (1990), and circles represent transition dipole moments computed in this work. The y-axis is in atomic units, with 1 a.u. = 2.5417 debye.(The data used to create this figure are available.)
Download figure:
Standard image High-resolution image
Table 9. Band Strengths  (debye) for the 90Zr16O B1Π–X1Σ+ Transition from the LEVEL Program

| 0 | 1 | 2 | 3 | 4 | 5 | 6 | 7 |
|---|---|---|---|---|---|---|---|---|
| 0 | 3.15858 | 1.82313 | 0.736997 | 0.233988 | 0.0604626 | 0.0125252 | 0.00155426 | −0.000442749 |
| 1 | −1.97628 | 1.99399 | 2.10723 | 1.12731 | 0.428718 | 0.124876 | 0.0260497 | 0.000844962 |
| 2 | 0.896335 | −2.26374 | 1.04133 | 2.07071 | 1.40108 | 0.617556 | 0.193181 | 0.0343972 |
| 3 | −0.335726 | 1.35763 | −2.19513 | 0.280239 | 1.87803 | 1.58401 | 0.786599 | 0.247639 |
| 4 | 0.108279 | −0.612764 | 1.66367 | −1.94396 | −0.305388 | 1.61581 | 1.69877 | 0.921369 |
| 5 | −0.0303094 | 0.229122 | −0.879521 | 1.83918 | −1.58416 | −0.727277 | 1.34260 | 1.76681 |
Download table as: ASCIITypeset image
Table 10. Band Strengths  (debye) for the 90Zr16O B1Π–A1Δ , and C1Σ+–X1Σ+ Transitions from the LEVEL Program

| 0 | 1 | |
|---|---|---|---|
| B1Π–A1Δ | 0 | 2.17295E | 0.884939 |
| 1 | −0.972823 | 1.76009 | |
| C1Σ+–X1Σ+ | 0 | 1.45395 | ⋯ |
| 2 | 0.314755 | −1.24506 |
Download table as: ASCIITypeset image
Table 11. Sample Table for the PGOPHER Line List for the 90Zr16O, B1Π–X1Σ+, B1Π–A1Δ, and C1Σ+–X1Σ+ Transitions

| J'' | Pos (cm−1) | Eup(cm−1) | Elow(cm−1) | A(s−1) | f × 103 | Line Assignment |
|---|---|---|---|---|---|---|---|
| 65 | 65 | 16,977.4610 | 18,784.6104 | 1807.1494 | 1,232,994 | 6.41 | :Q(65) :B1Pi v = 2 65f–X1Sigma v = 0 65e |
| 50 | 51 | 16,977.5652 | 18,096.0938 | 1118.5286 | 61,0404.5 | 3.11 | :P(51) :B1Pi v = 2 50e–X1Sigma v = 0 51e |
| 83 | 82 | 16,977.6697 | 19,839.2264 | 2861.5568 | 620,211.7 | 3.26 | :R(82) :B1Pi v = 2 83e–X1Sigma v = 0 82e |
| 157 | 157 | 16,978.3149 | 29,101.7723 | 12,123.4574 | 1,187,349 | 6.18 | :Q(157) :B1Pi v = 5 157f–X1Sigma v = 2 157e |
| 157 | 158 | 16,978.2952 | 28,314.9151 | 11,336.6198 | 28,7250 | 1.48 | :P(158) :B1Pi v = 4 157e–X1Sigma v = 1 158e |
| 64 | 64 | 16,980.7277 | 18,733.2870 | 1752.5594 | 1,233,706 | 6.41 | :Q(64) :B1Pi v = 2 64f–X1Sigma v = 0 64e |
| 98 | 97 | 11,232.8124 | 21,731.3643 | 10,498.5519 | 13,698.56 | 0.164 | :R(97) :B1pi v = 3 98e–X1Sigma v = 7 97e |
| 67 | 66 | 8554.9356 | 17,204.9196 | 8649.984 | 36,466.81 | 0.758 | :Re(66) : B1Pi v = 0 67e–A1Delta v = 1 66e |
| 69 | 68 | 8554.0082 | 17,315.1208 | 8761.1126 | 36,511.33 | 0.759 | :Rf(68) : B1i v = 0 69f–A1Delta v = 1 68f |
| 15 | 15 | 8557.1341 | 15,479.7361 | 6922.6021 | 76304.4 | 1.56 | Qf(15) : B1Pi v = 0 15e–A1Delta v = 1 15f |
| 10 | 11 | 17,039.152 | 17,094.9308 | 55.7788 | 87,6167.7 | 4.13 | :P(11) : C1Sigma v = 0 10e–X1sigma v = 0 11e |
| 13 | 14 | 17,035.336 | 17,124.0697 | 88.7338 | 866,732.9 | 4.17 | : P(14) : C1Sigma v = 0 13e–X1sigma v = 0 14e |
| 139 | 138 | 16,808.0964 | 24,797.336 | 7989.2396 | 799,860.1 | 4.28 | :P(138) : C1Sigma v = 0 139e–X1sigma v = 0 138e |
| 143 | 142 | 16,789.8506 | 25,239.9356 | 8450.085 | 797,341.8 | 4.27 | :P(142) : C1Sigma v = 0 143e–X1sigma v = 0 142e |
Note.
J is the total angular momentum, Pos is the calculated line position in cm−1, Eup and Elow are the upper and lower energy levels in cm−1, A is the Einstein  value in s−1, and
  is the oscillator strength, and line assignments are the associated quantum numbers for the given transition.
Only a portion of this table is shown here to demonstrate its form and content. A machine-readable version of the full table is available.
Download table as: DataTypeset image
5. Discussion
The spectroscopic constants listed in Tables 4 and 5 were derived from the spectroscopic fit of the lines listed in Table 2 (B1Π–X1Σ+ transition) and similar fitted lines for the B1Π–A1Δ and C1Σ+–X1Σ+ transitions. For the C1Σ+–X1Σ+ transition, this study represents the first high-resolution Fourier transform spectroscopic analysis of 90Zr16O. In the case of the B1Π–X1Σ+ transition, this work represents an improvement over previous studies as the spectrum used had a higher S/N, which enabled us to extend the number of observed 90Zr16O bands from 19–21 (see Table 1).
The theoretical equilibrium spectroscopic properties determined from our MRCI+Q potential energy curves are compared in Table 12 to our experimental values and to previous ab initio calculations (Langhoff & Bauschlicher 1990; Tabet et al. 2019). These latter works adopted a similar MRCI approach to ours, but with smaller basis sets and active spaces, and without taking the correlation energy arising from the zirconium 4s4p shell into account. As can be noted, this contribution reinforces the molecular bonding (smaller re and larger ωe values), and significantly improves the agreement with the experimental values. The mean absolute deviations of our calculations are 0.003 Å and 5 cm−1 for re and ωe , respectively, while those of Langhoff & Bauschlicher (1990) are 0.021 Å and 15 cm−1, and those of Tabet et al. (2019) are 0.027 Å and 20 cm−1. Be and αe are also calculated with a reasonable accuracy of 10−3 and 8 × 10⁻⁵ cm−1, respectively. The term energies Te are predicted within 200–700 cm−1 from the corresponding experimentally derived values, depending on the considered transition, with similar deviations for the previous calculations.
Table 12. Equilibrium Spectroscopic Constants for the X1Σ+, A1Δ, B1Π, and C1Σ+ States of ZrO from Ab Initio Calculations (in cm−1 and Å for re )
| re | Be | αe × 103 | ωe | ωe xe | Te | ||
|---|---|---|---|---|---|---|---|
| X1Σ+ | calc. a | 1.7136 | 0.42276 | 1.933 | 982.4 | 3.35 | 0 |
| calc. b | 1.734 | ⋯ | ⋯ | 941.5 | ⋯ | 0 | |
| calc. c | 1.74 | ⋯ | ⋯ | 965 | 2.8 | 0 | |
| exp. d | 1.71197 | 0.42358 | 1.9375 | 976.396 | 3.435 | 0 | |
| A1Δ | calc. a | 1.7289 | 0.41533 | 1.839 | 943.4 | 3.06 | 5725 |
| calc. b | 1.747 | ⋯ | ⋯ | 920.4 | ⋯ | 5230 | |
| calc. c | 1.75 | ⋯ | ⋯ | 932 | 2.9 | 6302 | |
| exp. d | 1.72461 | 0.41739 | 1.87 | 942.305 | 3.19 e | 5907.37 f | |
| B1Π | calc. a | 1.7515 | 0.40467 | 2.070 | 865.003 | 3.08 | 15,935 |
| calc. b | 1.774 | ⋯ | ⋯ | 857.5 | ⋯ | 15048 | |
| calc. c | 1.78 | ⋯ | ⋯ | 855 | 2.4 | 15,575 | |
| exp. d | 1.75630 | 0.40247 | 1.8970 | 859.4 | 2.92 | 15,441.78 f | |
| C1Σ+ | calc. a | 1.7502 | 0.40528 | 1.750 | 883.1 | 2.00 | 17,675 |
| calc. b | 1.772 | ⋯ | ⋯ | 873.2 | ⋯ | 17,278 | |
| calc. c | 1.78 | ⋯ | ⋯ | 867 | 2.8 | 18,219 | |
| exp. d | 1.74942 | 0.40564 | 1.65 g | 876 g | 3 g | 17,100.50 f |
Notes. Comparison with experimental and previous theoretical work.
a This work. b Langhoff & Bauschlicher (1990). c Tabet et al. (2019). d This work (see the text, Tables 7 and 8) or otherwise specified. e Hammer & Davis (1981). f Derived from available experimental T0, ωe , ωe xe , and ωe ye values. g Simard et al. (1988).Download table as: ASCIITypeset image
The transition dipole moment functions for the B1Π–X1Σ+, B1Π–A1Δ, and C1Σ+–X1Σ+ transitions are shown in Figure 5, along with a comparison to the transition dipole moment functions reported by Langhoff & Bauschlicher (1990). Both calculations globally agree for the first two transitions, while our functions have a smaller slope and the curvature is more pronounced in the case of the B1Π–A1Δ transition. The discrepancy is greater for the C1Σ+–X1Σ+ transition, for which we obtain lower values of 0.1–0.2 a.u. (atomic units). This difference probably comes from competing differential effects in which the 4p4d correlation should play a role.
Tables 7 and 8 provide the derived equilibrium molecular constants for the X1Σ+, B1Π, and A1Δ states of 90Zr16O along with previously reported values. We note that some of the previous values come from the work of Phillips & Davis (1976a) for which no error limits were reported. Attempts were made to fit higher order terms such as ωe
ze
(X1Σ+ and B1Π state) and δe
(X1Σ+ state); however, the errors were too large for confidence. Equilibrium bond lengths, re
in Å, are also presented in Tables 7 and 8 and were calculated from the equilibrium rotational constant, Be
in cm−1 using the standard equation (Bernath 2020). The reduced mass of 90Zr16O was calculated using atomic masses taken from the new atomic mass evaluation, AME2020 (Wang et al. 2021). The line lists provided in this work (as sampled in Table 11) contain both the Einstein  values and oscillator strengths
  in which the Einstein A coefficients were converted into oscillator strengths (Bernath 2020) using

with  in cm−1.
An estimate of the error of our reported line strengths can be made by comparing our computed radiative lifetimes, τ, to known experimental radiative lifetimes. Table 13 gives the computed radiative lifetimes for the 90Zr16O B1Π v = 0, 1, 2, 3, 4 levels. These lifetimes include transitions from the B1Π state to both the A1Δ and X1Σ+ states. Also included in Table 13 are radiative lifetimes from our previous work on the B1Π–X1Σ+ transition along with experimental values obtained from laser-induced fluorescence measurements of supersonically cooled ZrO (Simard et al. 1988). The radiative lifetimes were computed by taking the band strengths from the LEVEL program (Tables 9 and 10) and converting them into Einstein A values (Bernath 2020), which then can be converted into lifetimes τ, using  . The average error between our lifetimes and those of Simard et al. (1988) is about 25%, which is our error estimate.
Table 13. Comparison of 90Zr16O B1Π (v = 0, 1, 2, 3, 4) Radiative Lifetimes, τ (in ns)

| This Work | Previous Work a | Experiment b | Theory c |
|---|---|---|---|---|
| 0 | 61.03 | 68.5 | 83 | 56.4 |
| 1 | 62.65 | 69.2 | 83 | ⋯ |
| 2 | 65.56 | 70.8 | 83 | ⋯ |
| 3 | 68.72 | 81.9 | 90 | ⋯ |
| 4 | 69.51 | ⋯ | ⋯ | ⋯ |
Notes. Simard et al. (1988) reported their lifetimes without error limits.
a Sorensen & Bernath (2021). b Simard et al. (1988). c Langhoff & Bauschlicher (1990).Download table as: ASCIITypeset image
Plez et al. (2003) compiled line lists for a number of ZrO electronic transitions. A comparison between our PGOPHER energy levels and those of Plez et al. (2003) for the B1Π and X1Σ+ states agree to within about 0.1 cm−1 for J < 60; however, the levels deviate rapidly for high J values with deviations on the order of 5–10 cm−1. Similar deviations are also observed for the A1Δ and C1Σ+ states, although with fewer vibrational levels for comparison. As expected, however, our energy levels for the X1Σ+, B1Π, A1Δ, and C1Σ+ states agree to better than 0.2 cm−1 up to about J = 120 with MARVEL energy levels (McKemmish et al. 2018). These MARVEL energy levels were derived from older ZrO experimental data.
The spectra of ZrO are dominated by 90ZrO with a 51.5% natural abundance, but the four minor isotopologue abundances are not negligible (91ZrO 11.2%, 92ZrO 17.2%, 94ZrO 17.4%, 96ZrO 2.8%; Rumble 2022). The line positions (or isotopic shifts) of the minor isotopologues can be calculated from the spectroscopic constants provided in Tables 3–8 using the usual isotopic relationships (Bernath 2020), for example, as was recently carried out for TiO (Bernath & Cameron 2023). The line strengths for the minor isotopologues are approximately the same as for the 90ZrO; however, their band strengths can also be calculated with the LEVEL program by changing the isotopic mass.
After our paper was submitted, a comprehensive line list for ZrO (including isotopologues) was published by Perri et al. (2023). Their line positions for the B–X transition are based on our previous analysis and on the literature values for the B–A and C–X transitions. Although our new line positions improve on these values, the differences are typically less than 0.05 cm−1. The Perri et al. (2023) Einstein A values, however, vary more and differ by about 10%–50% for the B–X transition presumably because of differences in the transition dipole moment functions. The Perri et al. (2023) calculations are similar to those of Tabet et al. (2019) (see Table 12) and our calculations use larger basis sets and correlate more electrons. It is likely (Table 12) that our transition dipole moment functions are more accurate.
6. Conclusion
High-resolution spectra of hot ZrO were reanalyzed in the near-IR and visible regions. Lines associated with 21 bands of the B1Π–X1Σ+ transition, along with five bands of the B1Π–A1Δ transition and one band of the C1Σ+–X1Σ+ transition were observed and fit using PGOPHER. Updated spectroscopic constants are reported. In general, we improve the accuracy of the line positions reported in the literature and slightly extend the vibrational analysis. New ab initio calculations of the transition dipole moment functions were performed and used to determine line strengths. New line lists for the B1Π–X1Σ+, B1Π–A1Δ, and C1Σ+–X1Σ+ transitions were calculated. These line lists are useful for accurate modeling and identification of S-type stars, although we note that the spectra of cool stars are very complicated with many overlapping lines from several molecules and atoms.
Acknowledgments
The National Solar Observatory (NSO) is operated by the Association of Universities for Research in Astronomy, Inc. (AURA), under cooperative agreement with the National Science Foundation. Financial support was provided by the NASA Laboratory Astrophysics Program (80NSSC18K0240). P.B. acknowledges R.F.B. for productive discussion. J.L. thanks the Fonds de la Recherche Scientifique-FNRS through IISN (grant No. 4.4504.10) for financial support and the Consortium des Équipements de Calcul Intensif (CÉCI), funded by the Fonds de la Recherche Scientifique de Belgique (F.R.S.-FNRS) under grant No. 2.5020.11 and by the Walloon Region, for computational resources. We thank J. Sorensen for preliminary work.