Concentration Measurement of Uniform Particles Based on Backscatter Sensing of Optical Fibers


1
State Key Laboratory of Hydraulic Engineering Simulation and Safety, Tianjin University, Tianjin 300072, China
2
Institute of Modern Optics, Nankai University, Key Laboratory of Optical Information Science and Technology, Ministry of Education, Tianjin 300350, China
3
School of Physics, Peking University, Beijing 100871, China
*
Author to whom correspondence should be addressed.
Water 2019, 11(9), 1955; https://doi.org/10.3390/w11091955
Submission received: 14 August 2019
/
Revised: 15 September 2019
/
Accepted: 16 September 2019
/
Published: 19 September 2019
(This article belongs to the Section Hydraulics and Hydrodynamics)
Abstract
:A set of miniature optical fiber particle concentration measuring instruments is designed and applied to develop a unified expression for the concentration measurement of uniform particles in tap water. By measuring the concentrations of six uniform silicon carbide particles in the size range of 38–250 μm, the unified relationship between particle size, particle concentration, and optical scattering intensity is proposed. The unified expression is verified by the concentration measurements of silicon carbide particles with three other sizes. The results show that the measurement error is less than 10%, and the unified expression is satisfactory considering the large measuring range of 0–50 kg/m3. The effects of light intensity on the concentration measurement are discussed based on the results of 150 μm silicon carbide particles under three different light intensities. It is shown that a low light intensity can be applied for high-concentration measurement with relatively low accuracy, while a high light intensity can be adopted for low-concentration measurement with higher accuracy.
1. Introduction
Suspended sediment transport plays important roles for the morphologic evolution of rivers, estuaries, and coasts [1,2,3]. The quantitative assessment of suspended sediment concentration (SSC) through numerical modeling [4,5] or field measurement [6,7], therefore, has always been a key task in sediment transport research [8,9]. As for the measurement of SSC, many methods have been developed, which can be generally classified into direct methods and indirect methods [10]. Direct methods determine the sediment weight in the water by sampling the water body carrying sediment suspensions, filtering, drying, and weighing the sampled water, and then obtaining the sediment concentration of the water body. Although these sampling methods have high accuracy, they are time-consuming and laborious, and they make it difficult to obtain time series of concentrations. Therefore, indirect measurement methods have been developed according to the physical characteristics of suspended sediment in acoustics, electricity, optics, images, and so forth [11].
As one of the indirect methods, the acoustic method measures sediment concentration based on the reflection of the incident acoustic signal on the particles in the water body [12,13]. The acoustic method is non-intrusive, without disturbance to the measured water, and is able to measure sediment concentrations along vertical sections. However, the acoustic method is complex when it converts the reflected signal into SSC. In addition, it is necessary to compensate for the properties of surrounding water bodies, such as temperature and salinity [14,15]. The electrical method determines the SSC based on the different electrical characteristics of sediment suspensions [16]. It can measure high SSC, but it is usually not very sensitive to small changes in SSC and is less accurate at low SSC. In addition, it is highly affected by the temperature and salinity of ambient water [17,18]. The optical method is the most commonly used method for measuring suspended sediment concentration at present [19,20,21,22], and many commercial turbidimeters have been developed based on the optical method, such as Campbell Scientific Inc OBS3+, OBS5+ [23], Hach 2100Q [24], and so on. The optical method can be mainly divided into the scattering method and the transmission method. The scattering method measures SSC according to different scattering intensities [25]. The transmission method strictly follows the Lambert–Beer law and measures SSC according to different transmission light intensities [26]. Recently, the image method has also been developed based on the microscopic photography of SSC. The image method can not only obtain sediment concentration, but also obtain physical characteristics such as particle size distribution and the shape of sediment particles through image recognition. However, it is currently only used in the laboratory, and needs to be further studied under field conditions [27,28].
For different measurement methods of SSC, the sizes of measuring instruments are generally large and the measuring instrument is intrusive and has a great impact on the hydrodynamics, which is not suitable for SSC measurement at laboratory scale such as in an oscillating grid chamber [29] or a settling column [30]. In addition, all indirect measurement methods mentioned above, whether for the laboratory or the field, require concentration calibration before measurement [31,32], and SSC measurement can only be carried out after calibration, which is rather inconvenient for use. Therefore, the objective of the present paper is to design a set of miniature optical fiber sediment concentration measuring instruments based on the optical backscatter method, and the specific point is that we try to present a unified expression for uniform particles and need no further calibration in practical application. In addition, the measuring instrument also has the advantages of a small sensor probe, small disturbance to the water body, large range, and multiple channels.
The outline of this paper is as follows. The principle and system design for the instrument measuring the sediment concentration are introduced in Section 2. In Section 3, the instrument is used to develop and calibrate a relationship between silicon carbide particle concentration and optical scattering intensity using nine different particle sizes of silicon carbide within the scope of 38–250 μm. The measurement range and error for silicon carbide particles under different light intensities are discussed in Section 4. Conclusions are drawn in Section 5.
2. Measuring Principle and Instrument Design
2.1. Measuring Principle
The sediment concentration measurement in this paper is based on the principle of optical backscatter. The particle suspension near the end face of the optical sensor is illuminated by a parallel beam. The optical sensor collects the backscattered light of suspended particles and then converts the collected backscattered light signal into an electrical signal to obtain the relationship between particle concentration and electrical signal [33,34]. Because the measurement of sediment concentration by backscatter involves the complex problem of multiple particles and multiple backscatters, few relevant theoretical analytical formulas have been reported yet. Therefore, the measurement of sediment concentration based on optical backscatter mainly adopts the experimental method to obtain the relationship between sediment concentration and its backscatter intensity.
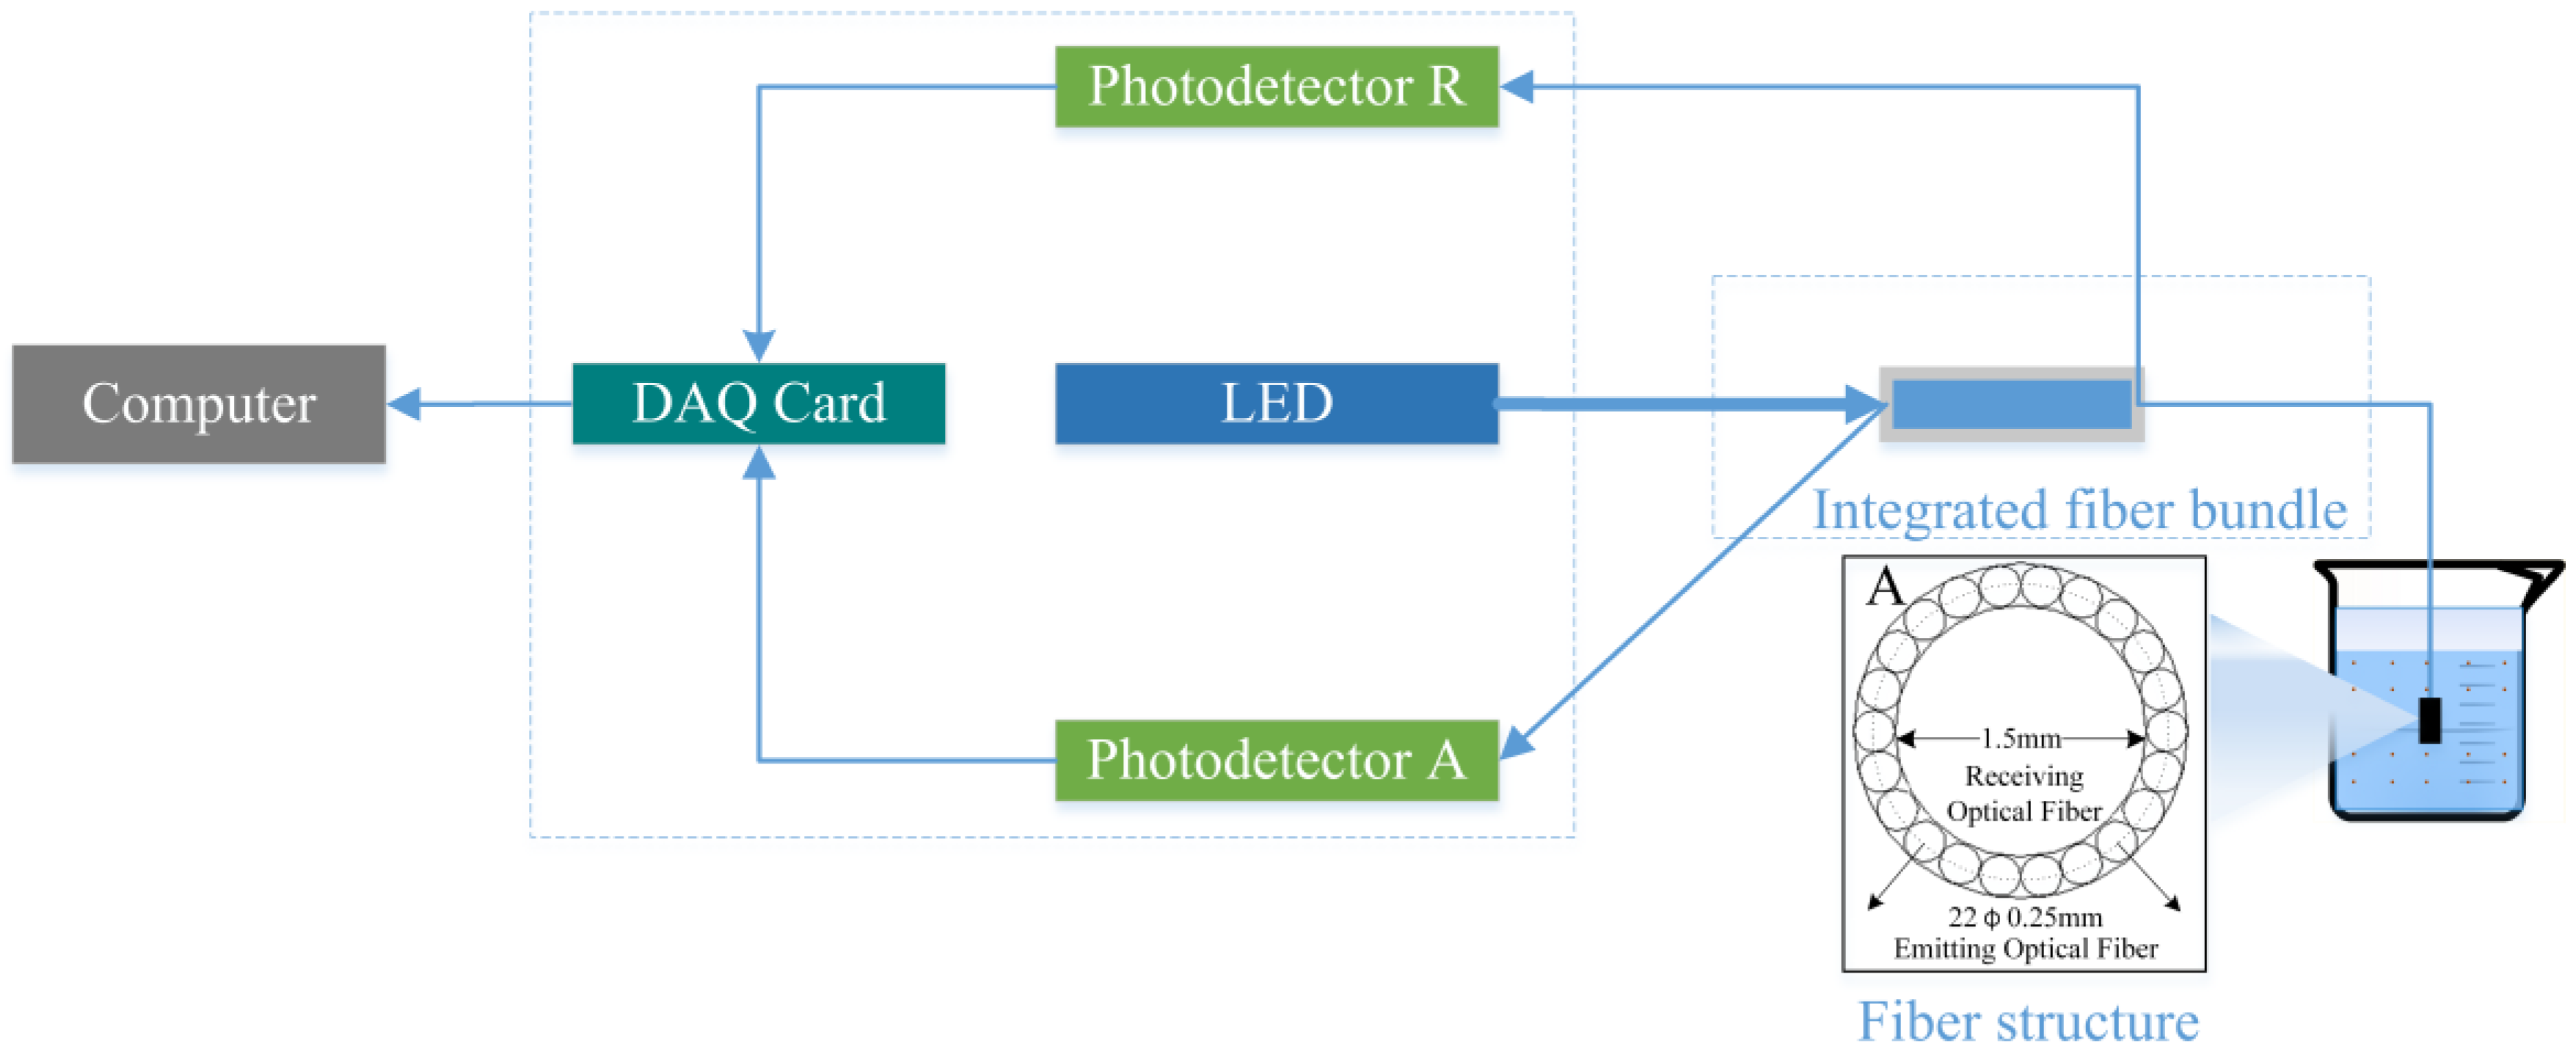
A set of miniature optical fiber sediment concentration measuring instruments based on the principle of optical backscatter was designed, as shown in Figure 1.
It is noted that most previous instruments measuring particle concentration through backscatter usually set the scattering angle as 90°–135°, which receives the most sensitive and stable light scattered by particles. However, using the scattering angle signal of 90°–135°, we would need to design the incident light emitter and scattering optical receiver with different angles, and the dimension of the measuring structure would be larger. In order to minimize the size of the sensor, we used the 180° backscatter angle [35]. The optical fibers emitting visible light and the optical fiber receiving scattered light were assembled together, so that the output of incident light and the receiving of scattered light could be realized with only a single-point probe, and the size of the probe into water could be reduced [36]. A backscattered light detection fiber with a diameter of 1.5 mm in the water-entry probe was located at the center of the probe. A ring of 22 plastic fiber bundles with diameters of 0.25 mm was arranged around the central detection fiber to transmit parallel light from the light source. The specific fiber structure is shown in Part A of Figure 1. The other end of the optical fiber detecting backscattered light was connected to the photodetector to detect the change in scattering light intensity. The photodetector was connected to the data acquisition card, through which the analog signal was converted into a digital signal to record the voltage value corresponding to scattered light in real time. The light source adopted light emitting diode (LED) white, visible cold light (the wavelength of the light was 380–780 nm) and the intensity of the light source was adjustable. In order to eliminate the voltage fluctuation of the LED light source, we set a reference light path, R, to monitor the voltage fluctuation of the light source.
Since the diameter of the optical fiber receiving the backscattered light of particles in the optical fiber probe was only 1.5 mm, the proportion of the backscattered light of particles received by the receiving optical fiber was relatively low. The signal strength of the backscattered light of the particles near the receiving fiber is a function of the distance from the end of the probe and has a changing rule with a rapid increase initially and then a gradual decrease. The peak signal strength is usually reached at a few millimeters from the probe, which depends on the diameter of the fibers and numerical apertures and the geometrical distribution of illumination and detection fibers [37,38]. The particles far from the optical fiber probe also have the problem of the multiple scattering of multiple particles, and the backscattered light of the distant particles is less received by the optical fiber. Therefore, it can be considered that the detection range of the fiber optic probe designed in this paper is within the one-millimeter magnitude.
2.2. Five-Channel Concentration Measuring Instrument
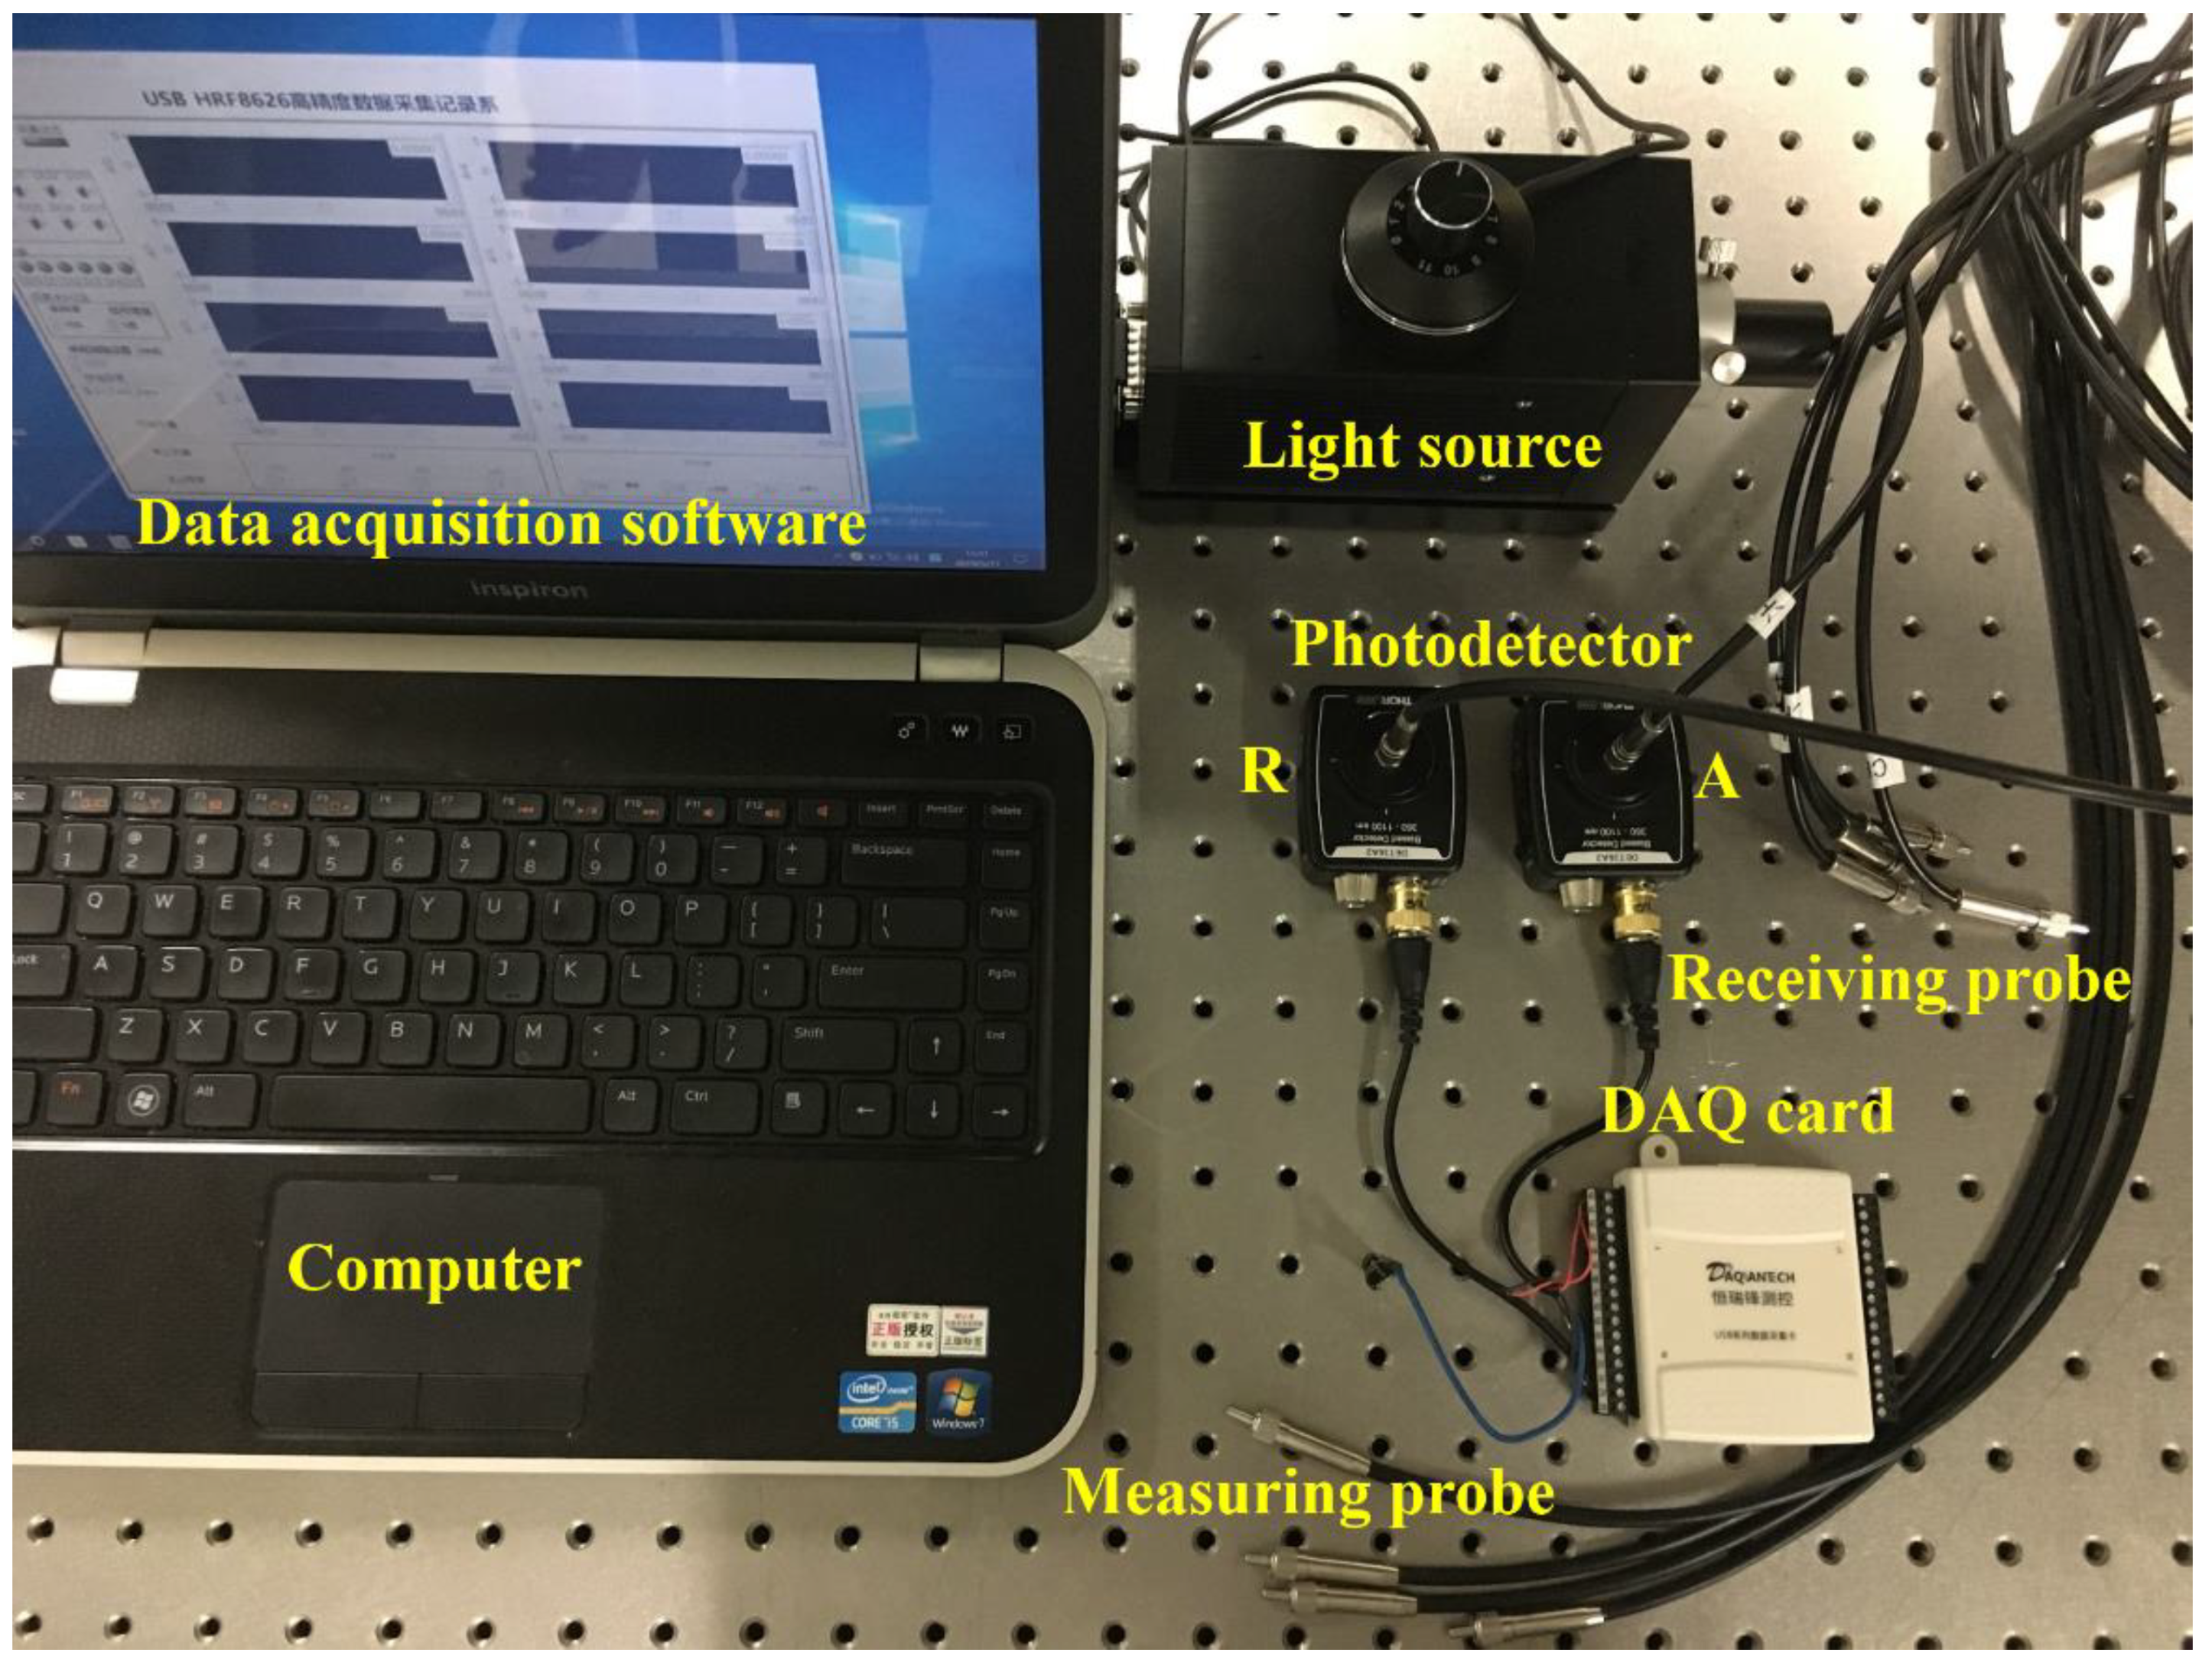
A set of miniature optical fiber sediment concentration measuring instruments was designed and constructed based on the principle explained in Section 2.1, and the components of the experimental apparatus are shown in Figure 2. The instrument was mainly composed of the light source, photodetector, integrated optical fiber bundle, and data acquisition card.
Considering the convenience of the instrument, we sequentially connected the visible light source, photodetector (DET36A/M, Thorlabs, Newton, NJ, USA), and data acquisition card together in a box. The integrated optical fiber bundles were connected to each other through the optical fiber adapter on the box, respectively. The switch of the light source and the light source intensity could be controlled on the panel of the box; the specific measuring instrument device is shown in Figure 3.
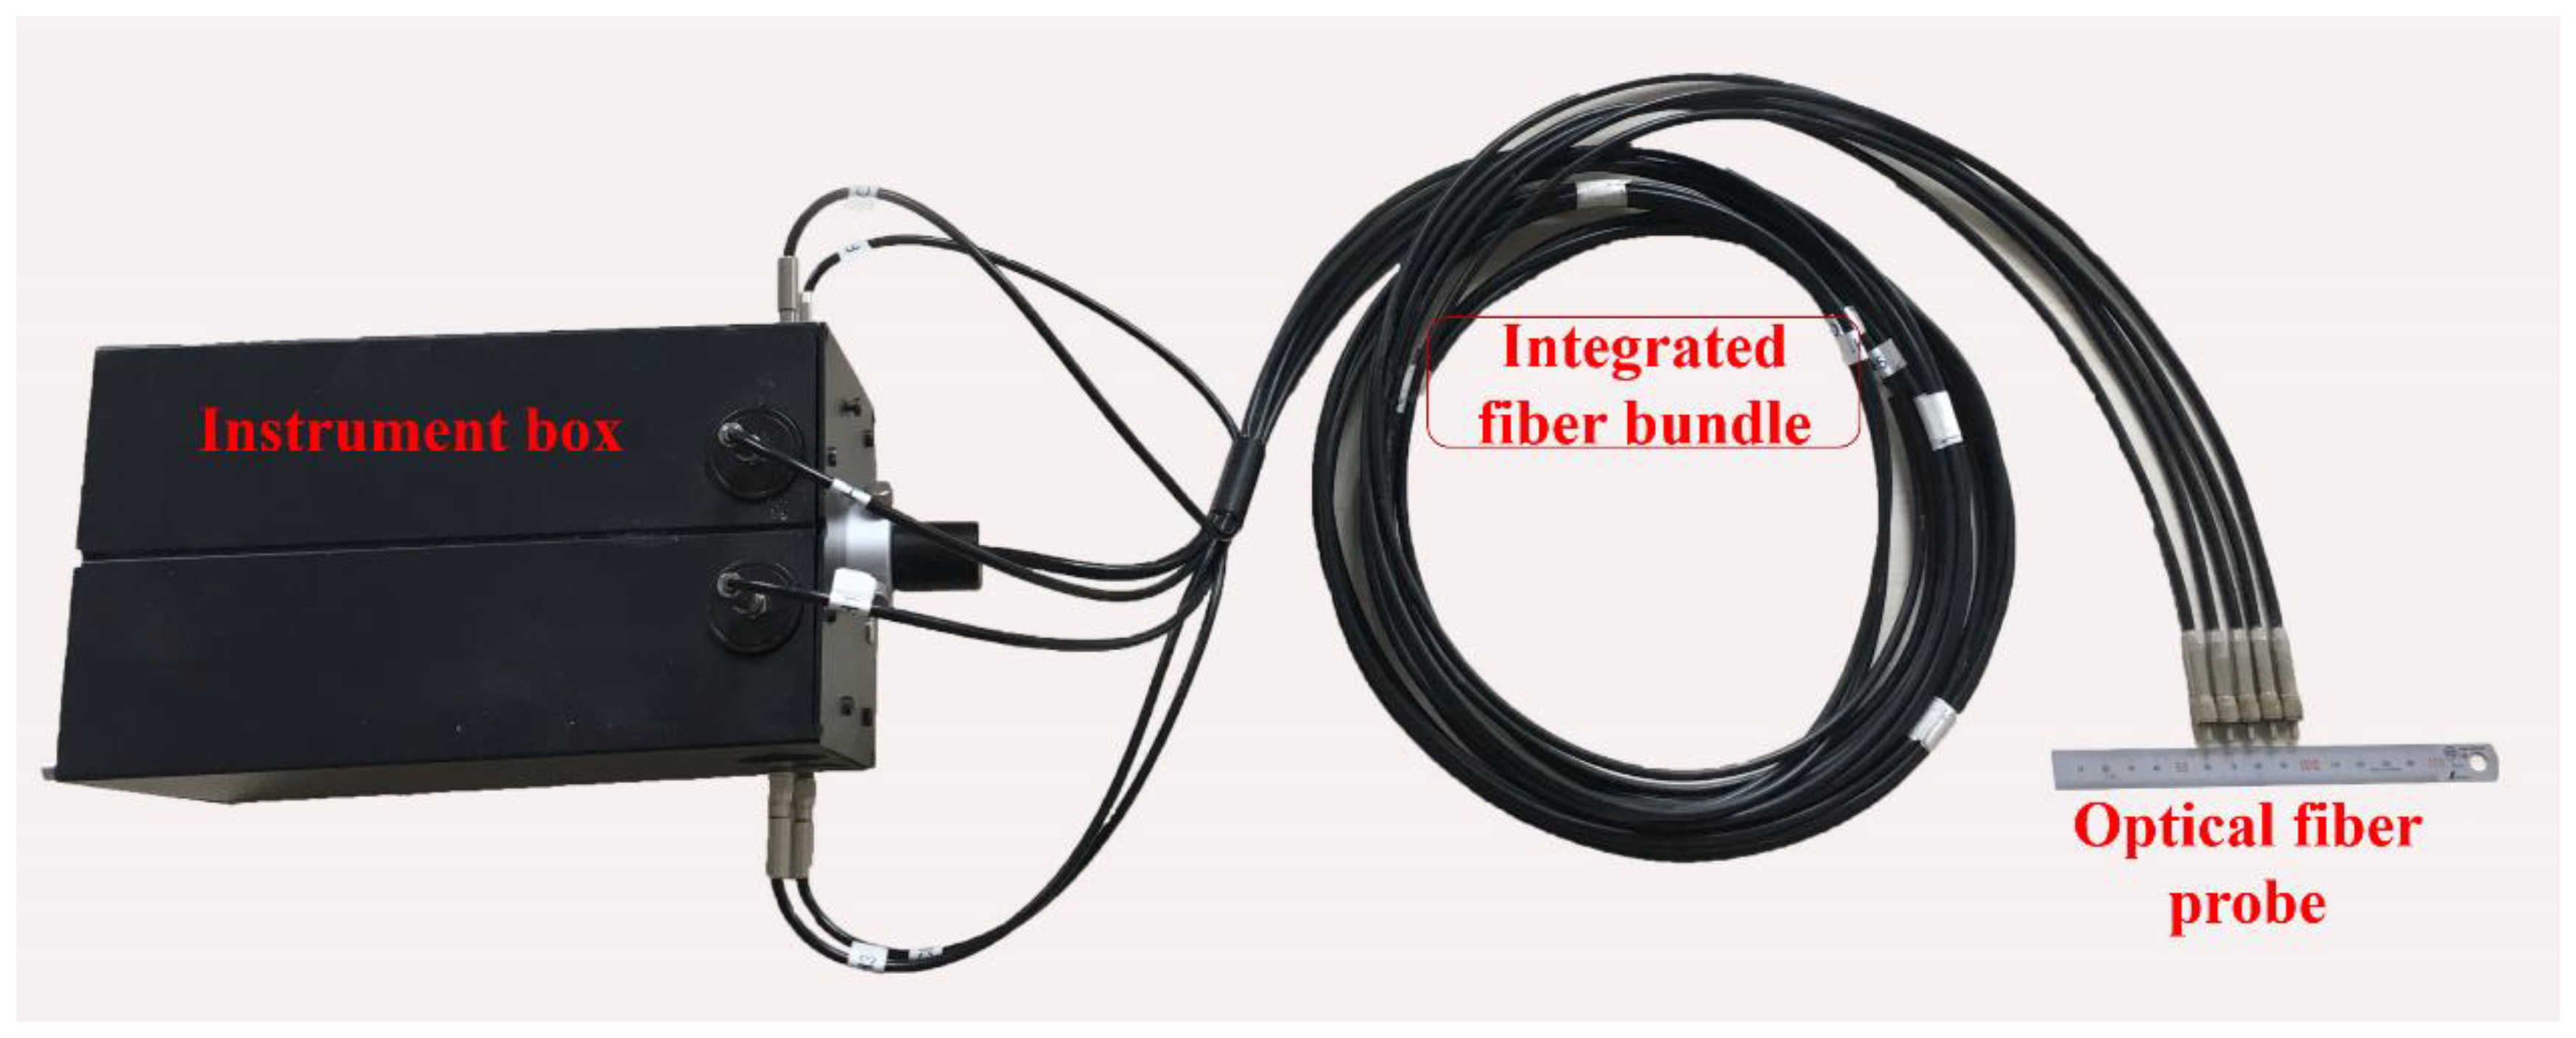
In practice, the particle concentration in the water can be directly measured by fixing the probe in the water. The water-entering optical fiber probe adopted a plastic optical fiber and was protected by a metal sleeve. The diameter of the measuring point at the front end of the water-entering part was only 2.5 mm, which exerts a small disturbance on the water body. In addition, the plastic fiber had the advantages of light weight, softness, resistance to casual tiny bending, and so on, which means that it meets the demands of convenient, fast, and stable use for daily measurement.
In both laboratory flume and field water environment measurements, it is often necessary to measure sediment concentration synchronously at multiple points. Therefore, we can design a multi-channel optical fiber on the basis of a single-channel optical fiber to realize multi-channel synchronous measurement [39]. Figure 3 shows the five-channel optical fiber particle concentration meter. It can be seen that there are seven cables going out from the instrument box. The coarsest cable on the right end of the box panel was the optical fiber connected with the light source, and it was adopted in the mode of 1–6, five of which were used as the emitting fibers of the measurement probes, and another one was used to monitor the light intensity of the light source. The other six cables included the receiving fibers of five probes and the fiber monitoring light source intensity, and they were connected to six photodetectors in the box.
3. Unified Relations for the Concentration Measurement of Uniform SiC Particles with Different Diameters
For particle concentration measurement using optical backscatter, the size, color, and morphology of particles have great influences on their optical scattering characteristics [40,41,42,43]. Among these influencing factors, the particle size has the greatest influence, and the effects of other factors are an order of magnitude less than that of the particle size. Commercial silicon carbide (SiC) particles are relatively uniform in size, with a density of 3200 kg/m3, which is similar to the sediment density of 2650 kg/m3, so they are a good representation for the measurement of sediment particle concentration. Therefore, SiC particles were used to approximate sediment particles to calibrate the relationship between particle size, concentration, and optical scattering intensity.
3.1. Experiments and Measured Results
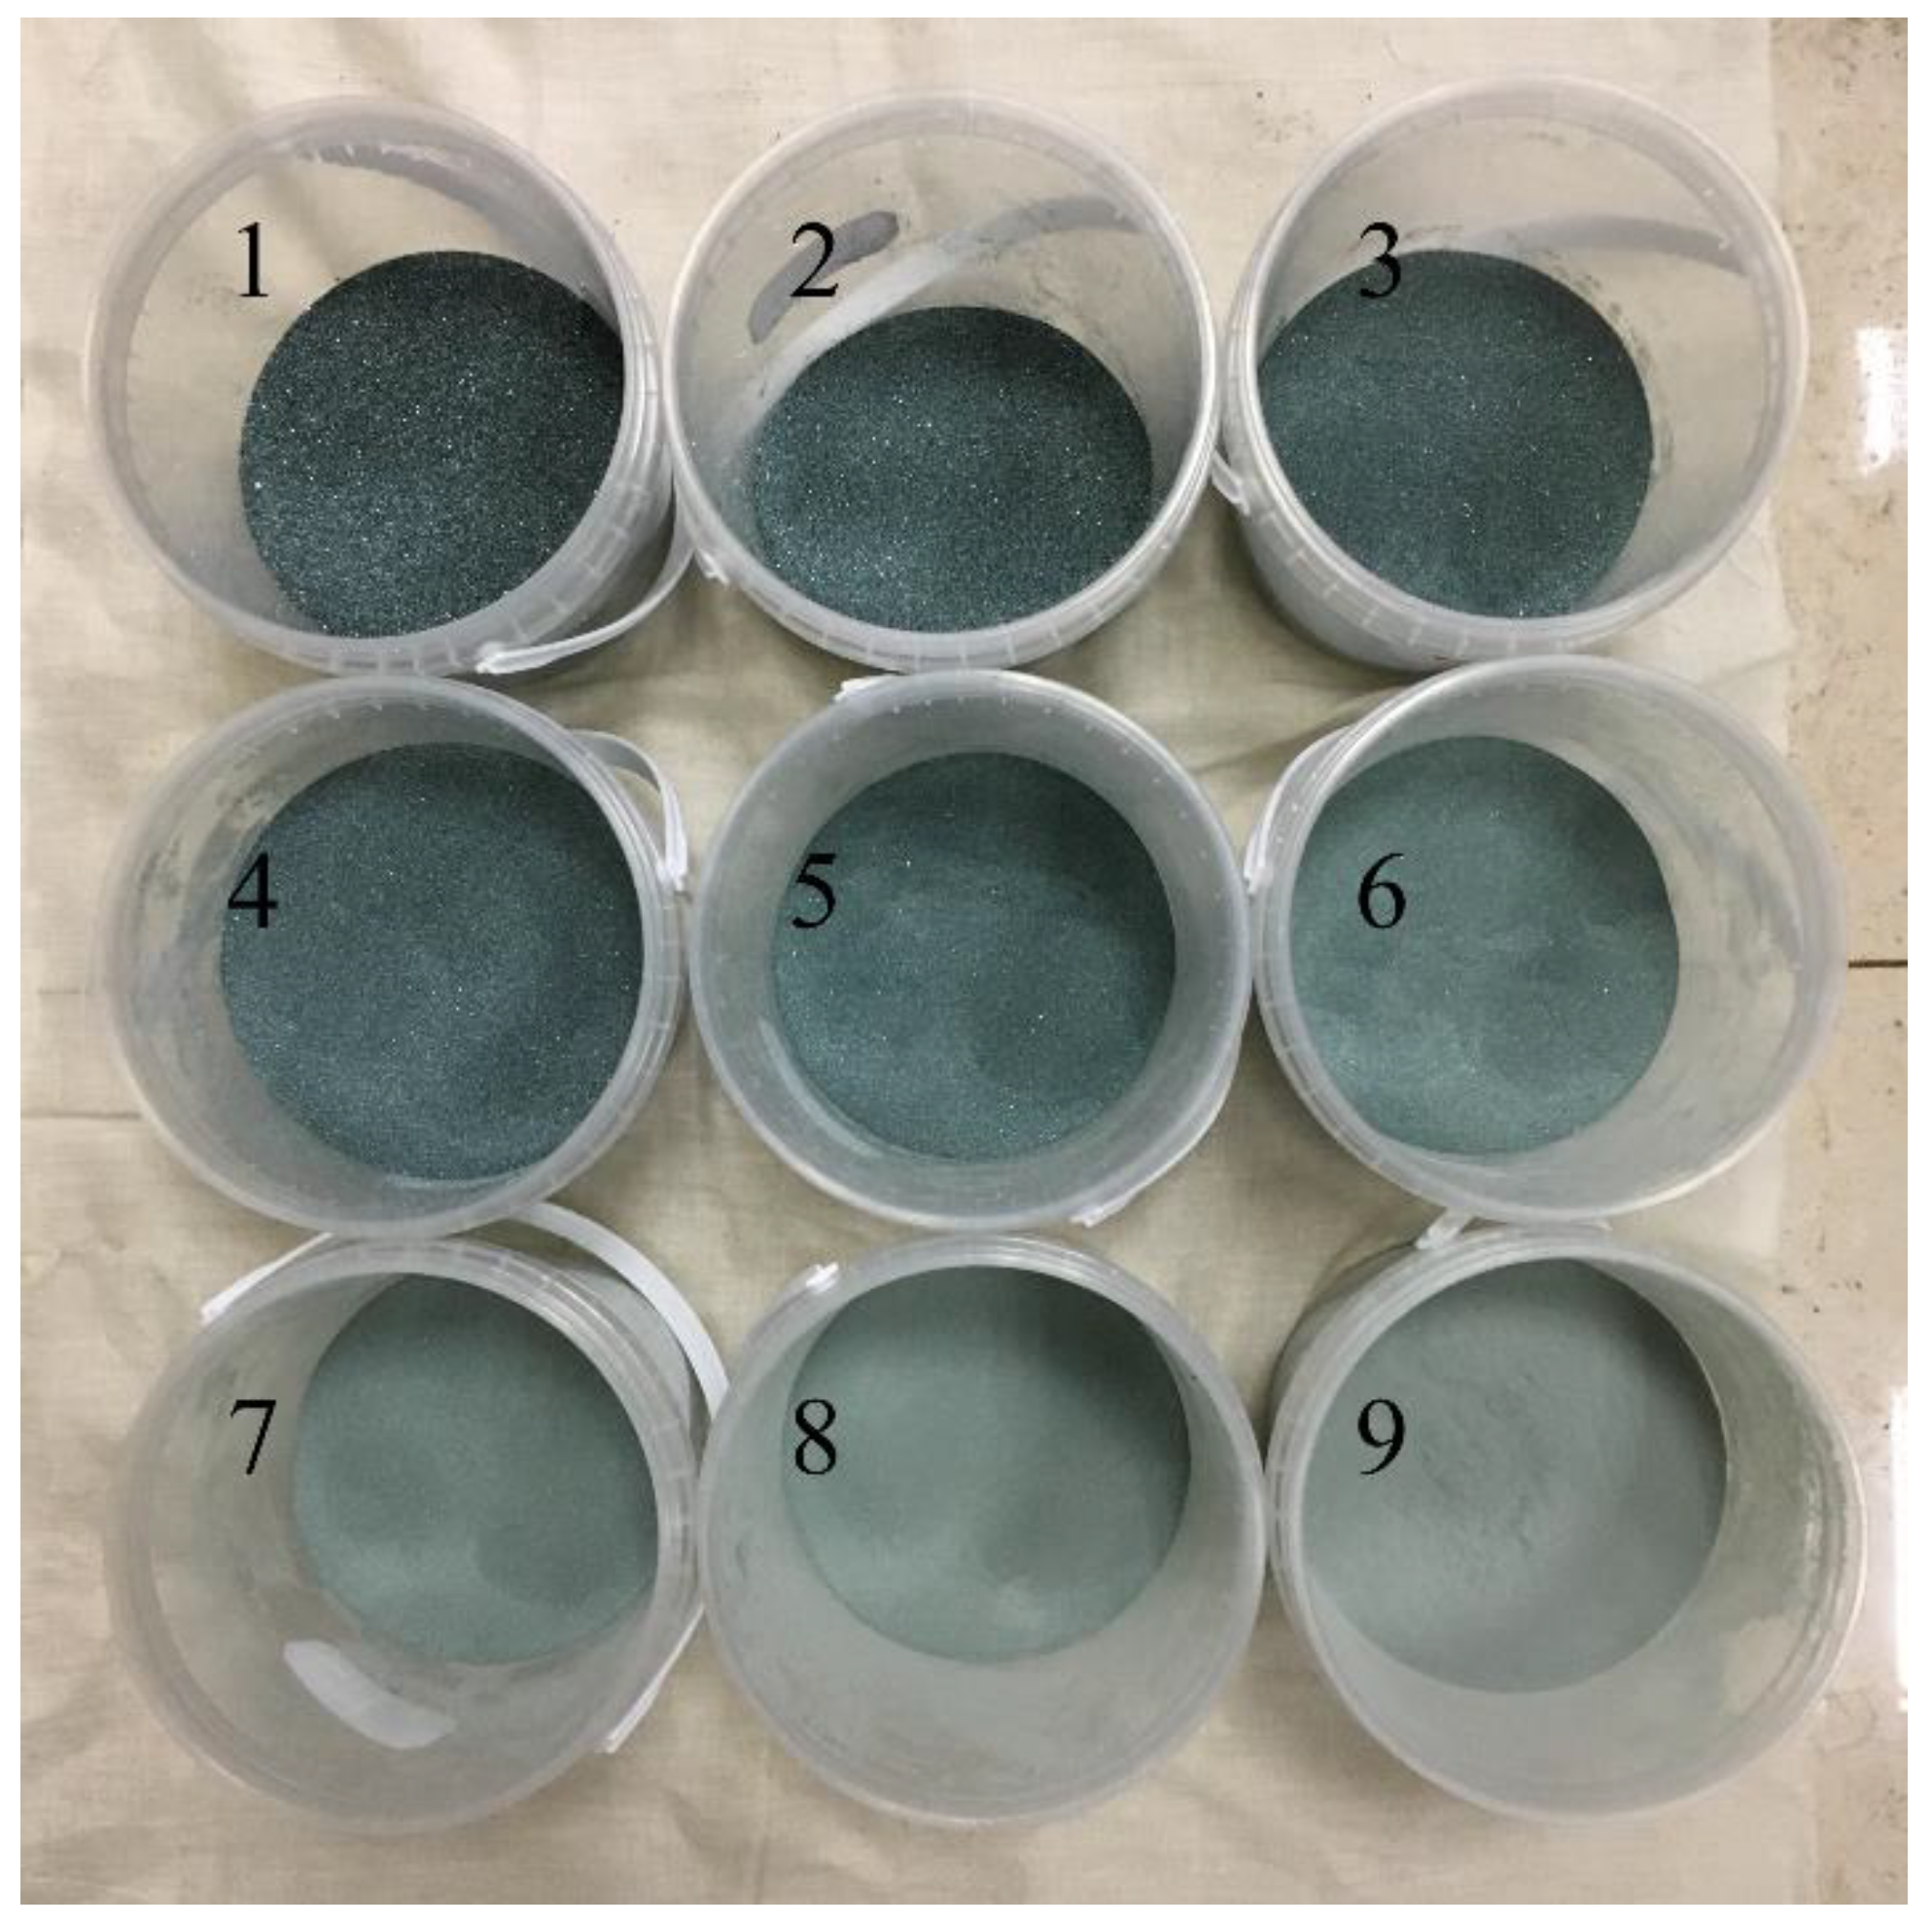
We used nine uniform SiC particles with different diameters distributed in the range of 38–250 μm, six of which were selected for developing an empirical equation, and the other three were used for verification. Specific SiC particle sizes are shown in Table 1, and Figure 4 shows the photos of the commercial SiC with nine different particle sizes used in the experiment.
A particle suspension of different standard concentrations was prepared in a beaker for concentration calibration [44], and uniform particle suspension was realized on the magnetic stirrer. The specific experimental steps were as follows: (1) Take an appropriate amount of purified water into the beaker, place the beaker on the magnetic stirrer, and put the magnetic rotor into the beaker. (2) Add the weighed SiC particles into the beaker and start the magnetic stirrer for stirring. (3) After the SiC suspension is mixed uniformly, put the fiber optic probe into the beaker and fix it in the proper depth of the suspension. (4) Turn on the LED light source and adjust to the desired light intensity. (5) Run the computer program, set the sampling interval to be 0.1 s, record the output data, continuously collect for 5 s, complete the recording, and take out the optical fiber probe; repeat the measurement for each standard concentration three times. (6) Prepare the SiC suspension for the next standard concentration and repeat steps (1) to (5).
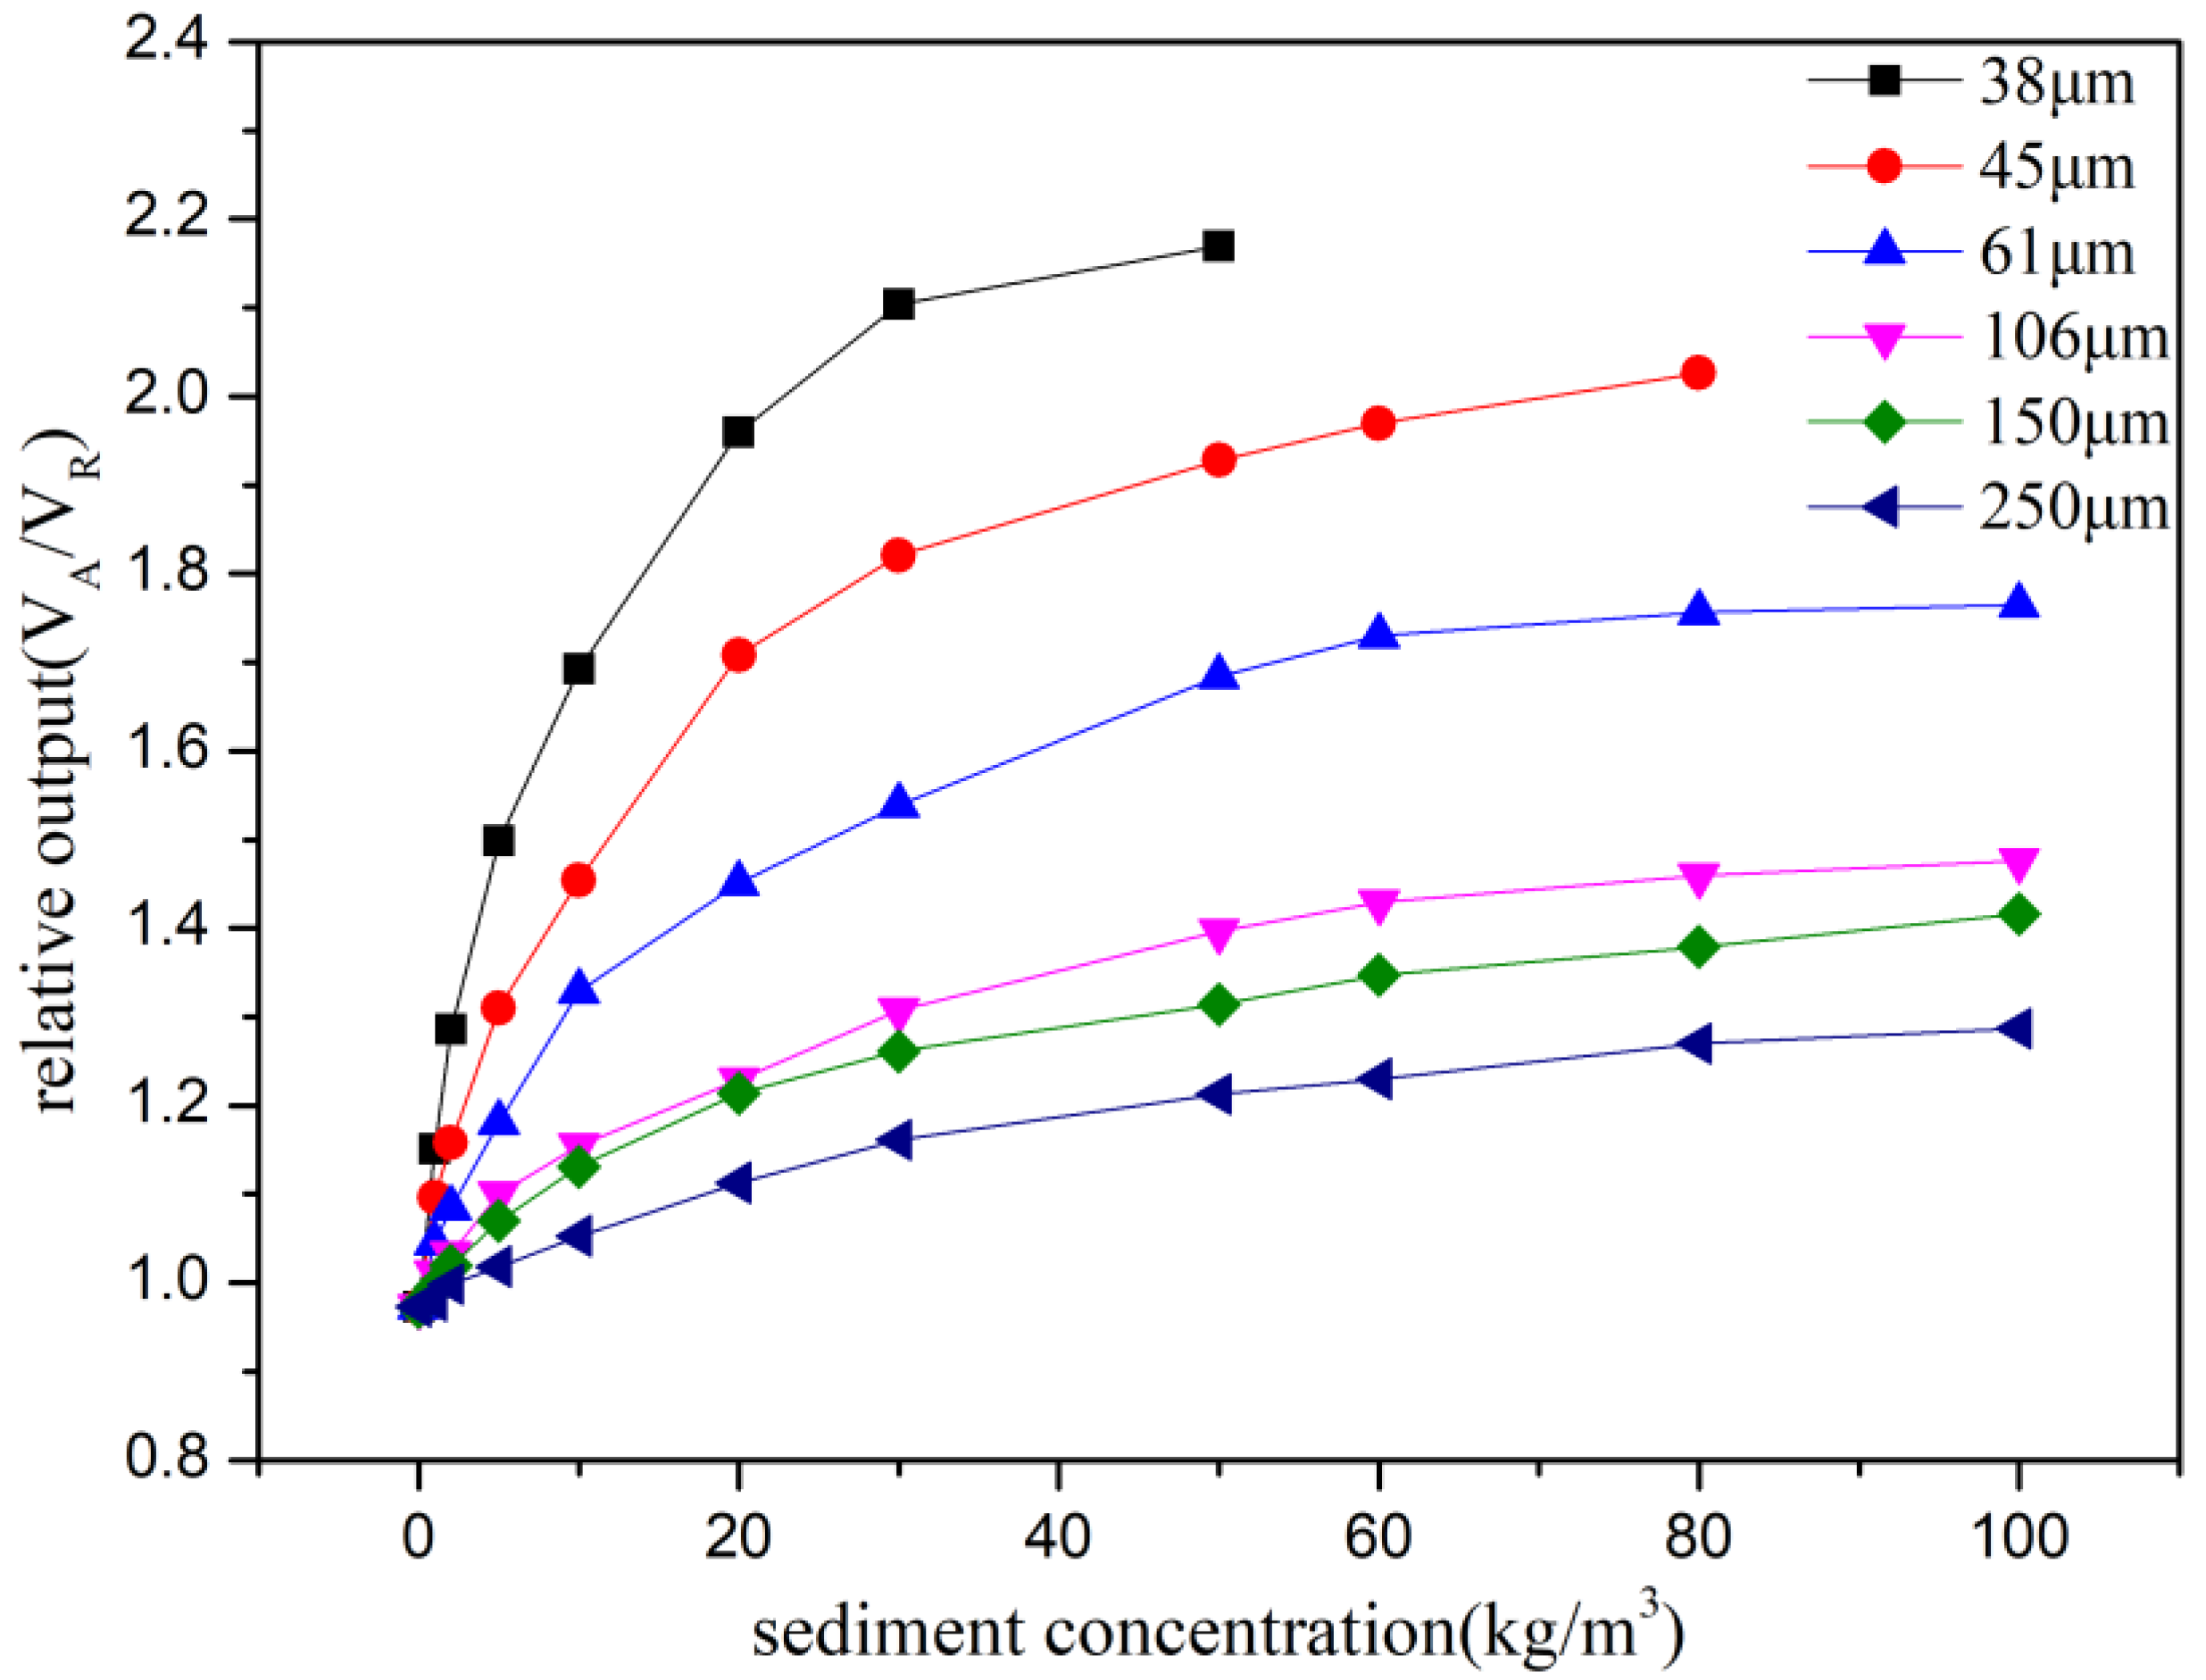
The relationship curves of SiC concentration–voltage for each particle size are shown in Figure 5. It can be clearly seen that the intensity of scattered light with a smaller particle size at the same concentration is higher, and the corresponding voltage value is higher. This is because the smaller the particle size is, the more particles there are when the particle concentration is the same, and the higher the scattering of incident light will be. At a lower concentration, the relationship between particle concentration and voltage is approximately linear. When the concentration increases, the relationship deviates from the linear and is close to the exponential form. When the particle concentration increases to a certain high value, the backscattered light intensity of the particle changes very little, and the increase in particle concentration will not have any effect on the backscattered light. This is because there are too many particles when the particle concentration is high, and the backscatter of particles basically reaches saturation, with the backscatter light intensity increasing very weakly as the number of particles increases. The smaller the SiC particle size is, the faster its concentration will achieve saturation, and it will reach saturation at a smaller concentration.
3.2. Unified Relation for the Concentration Measurement of Uniform SiC Particles
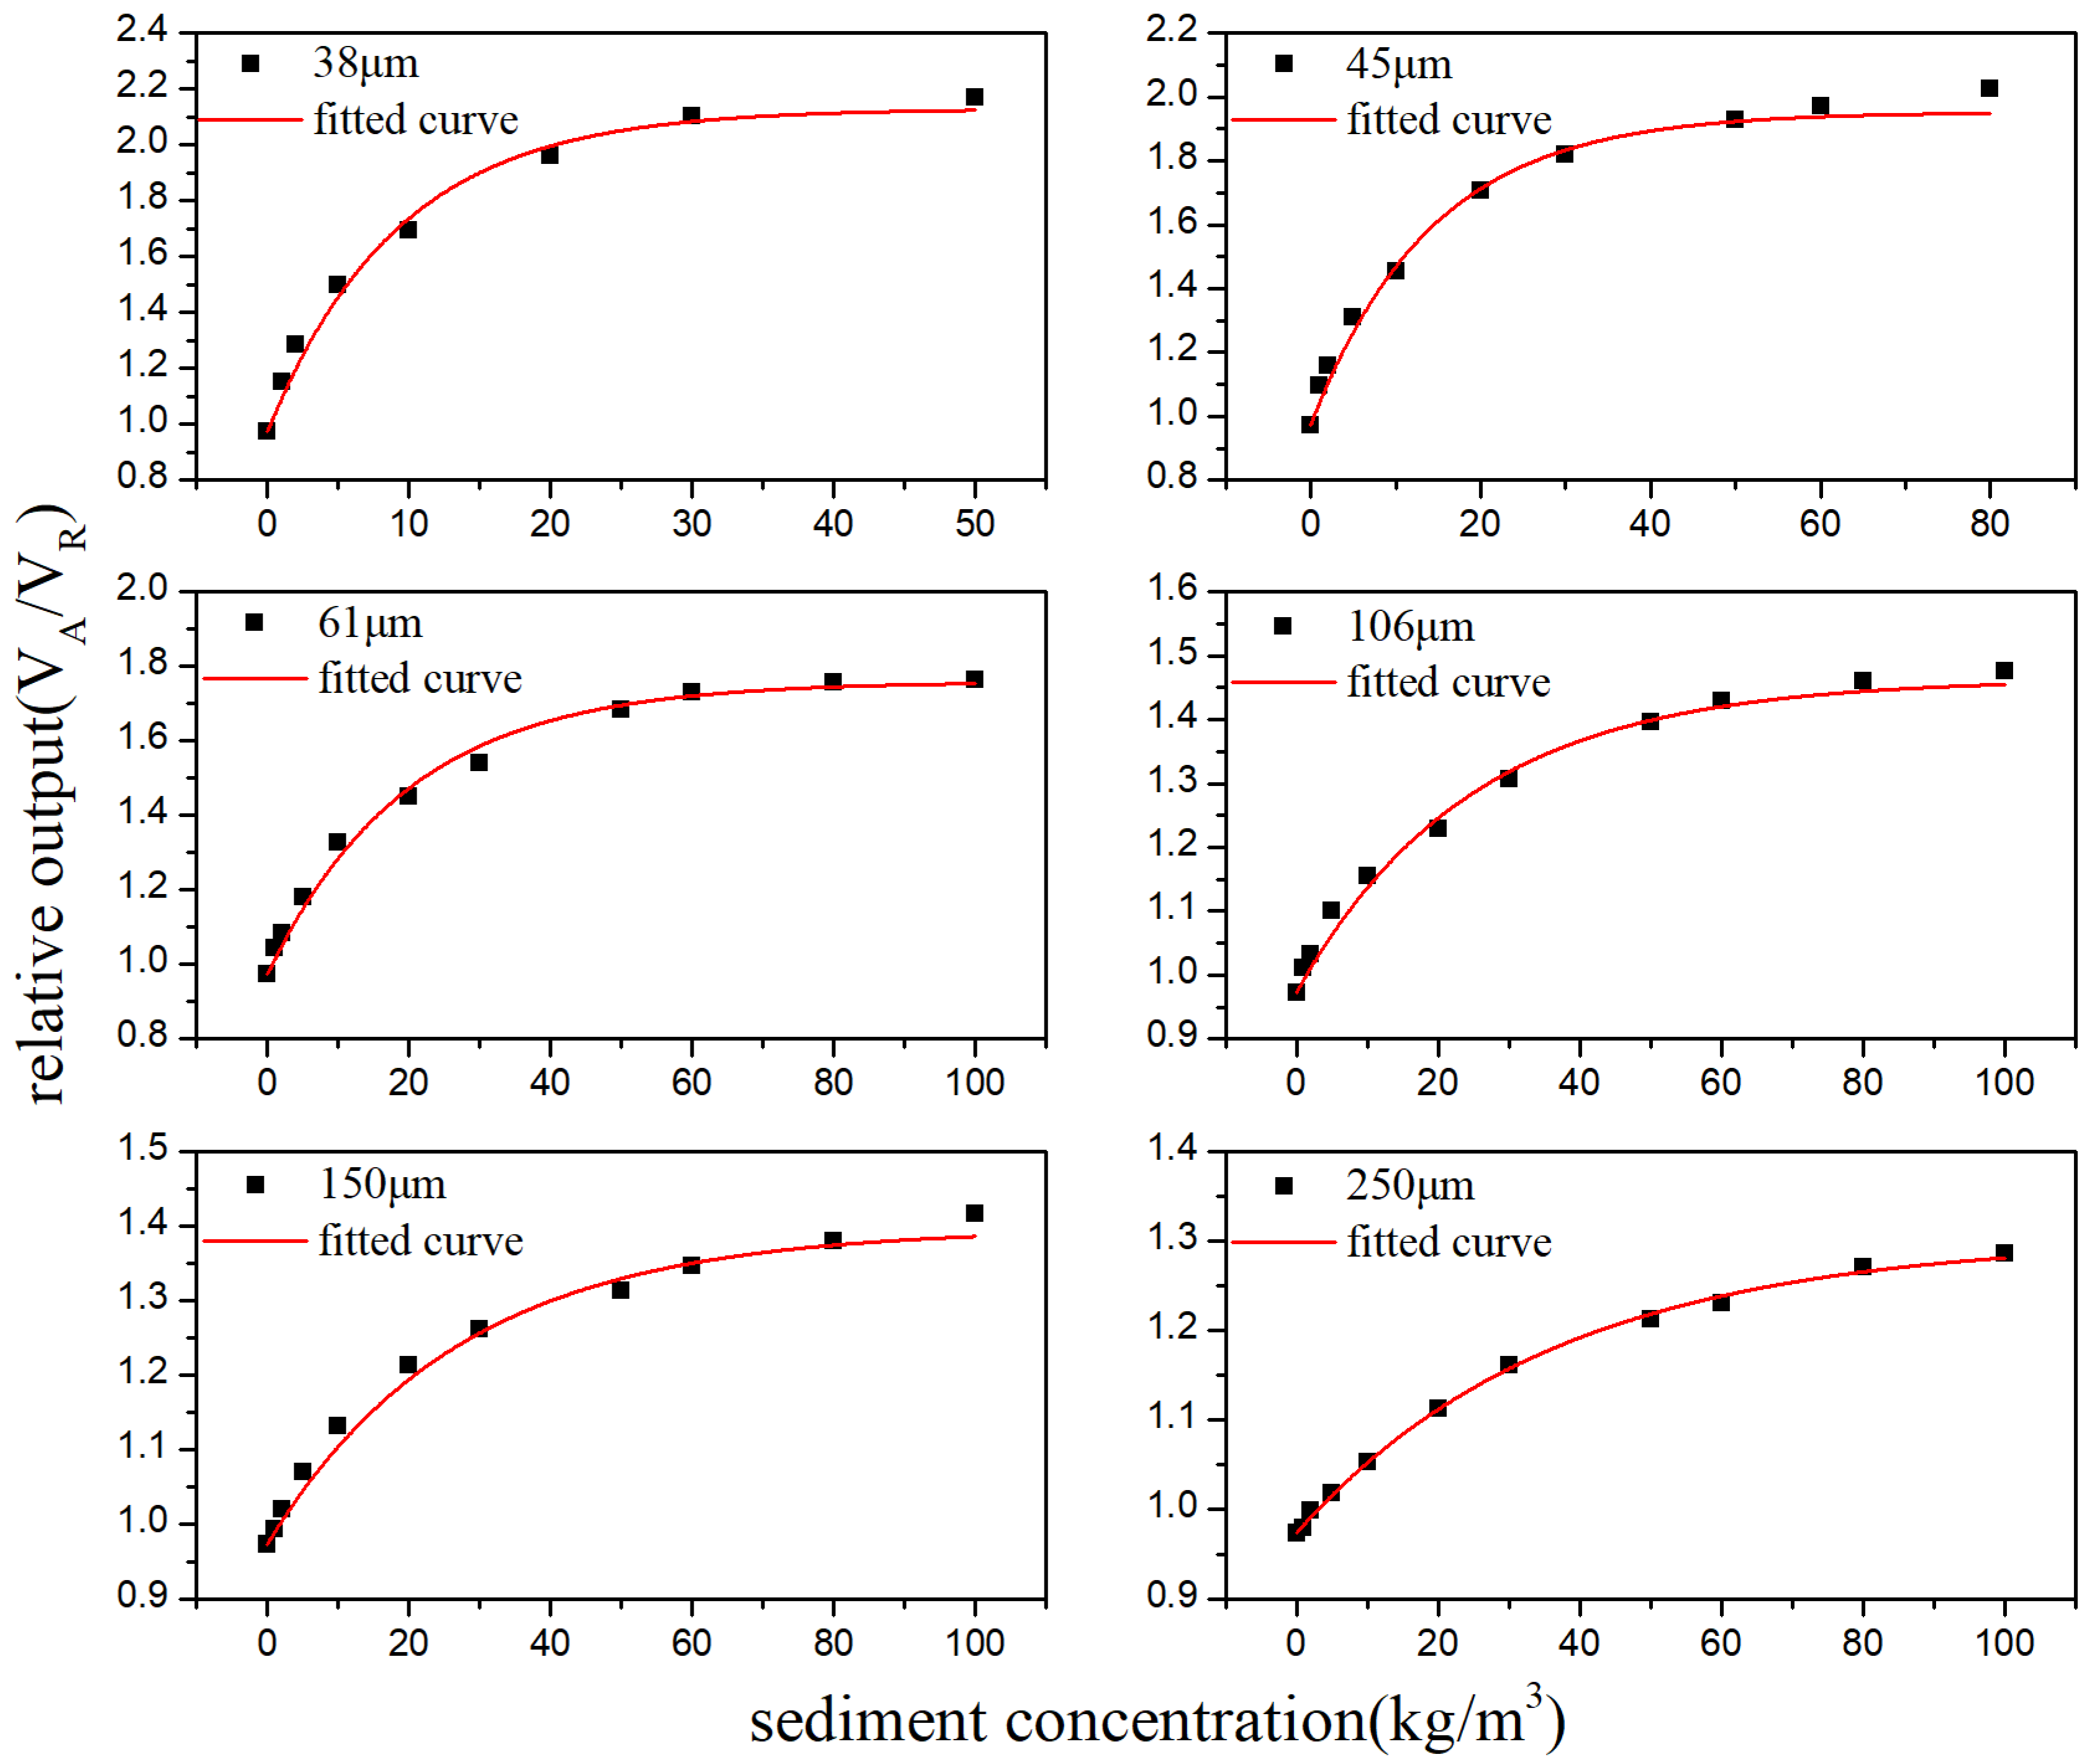
According to results of Figure 5, we use the generic exponential function for data fitting, as shown in Equation (1), in which a, t, and b are the fitting coefficients, C is the particle concentration (kg/m3), V is the relative value of the voltage VA corresponding to the scattering light intensity that offsets the fluctuation of the voltage VR of the light source in Equation (2):
In Equation (1), when the concentration of C is 0, that is, the voltage corresponds to the measured background scattered light intensity of pure water:
The exponential fitting curves corresponding to SiC with six different particle sizes are shown in Figure 6.
The parameters corresponding to the fitting curve function of six uniform SiC with different particle sizes are shown in Table 2. The correlation coefficients are all over 0.98, indicating a high degree of fitting.
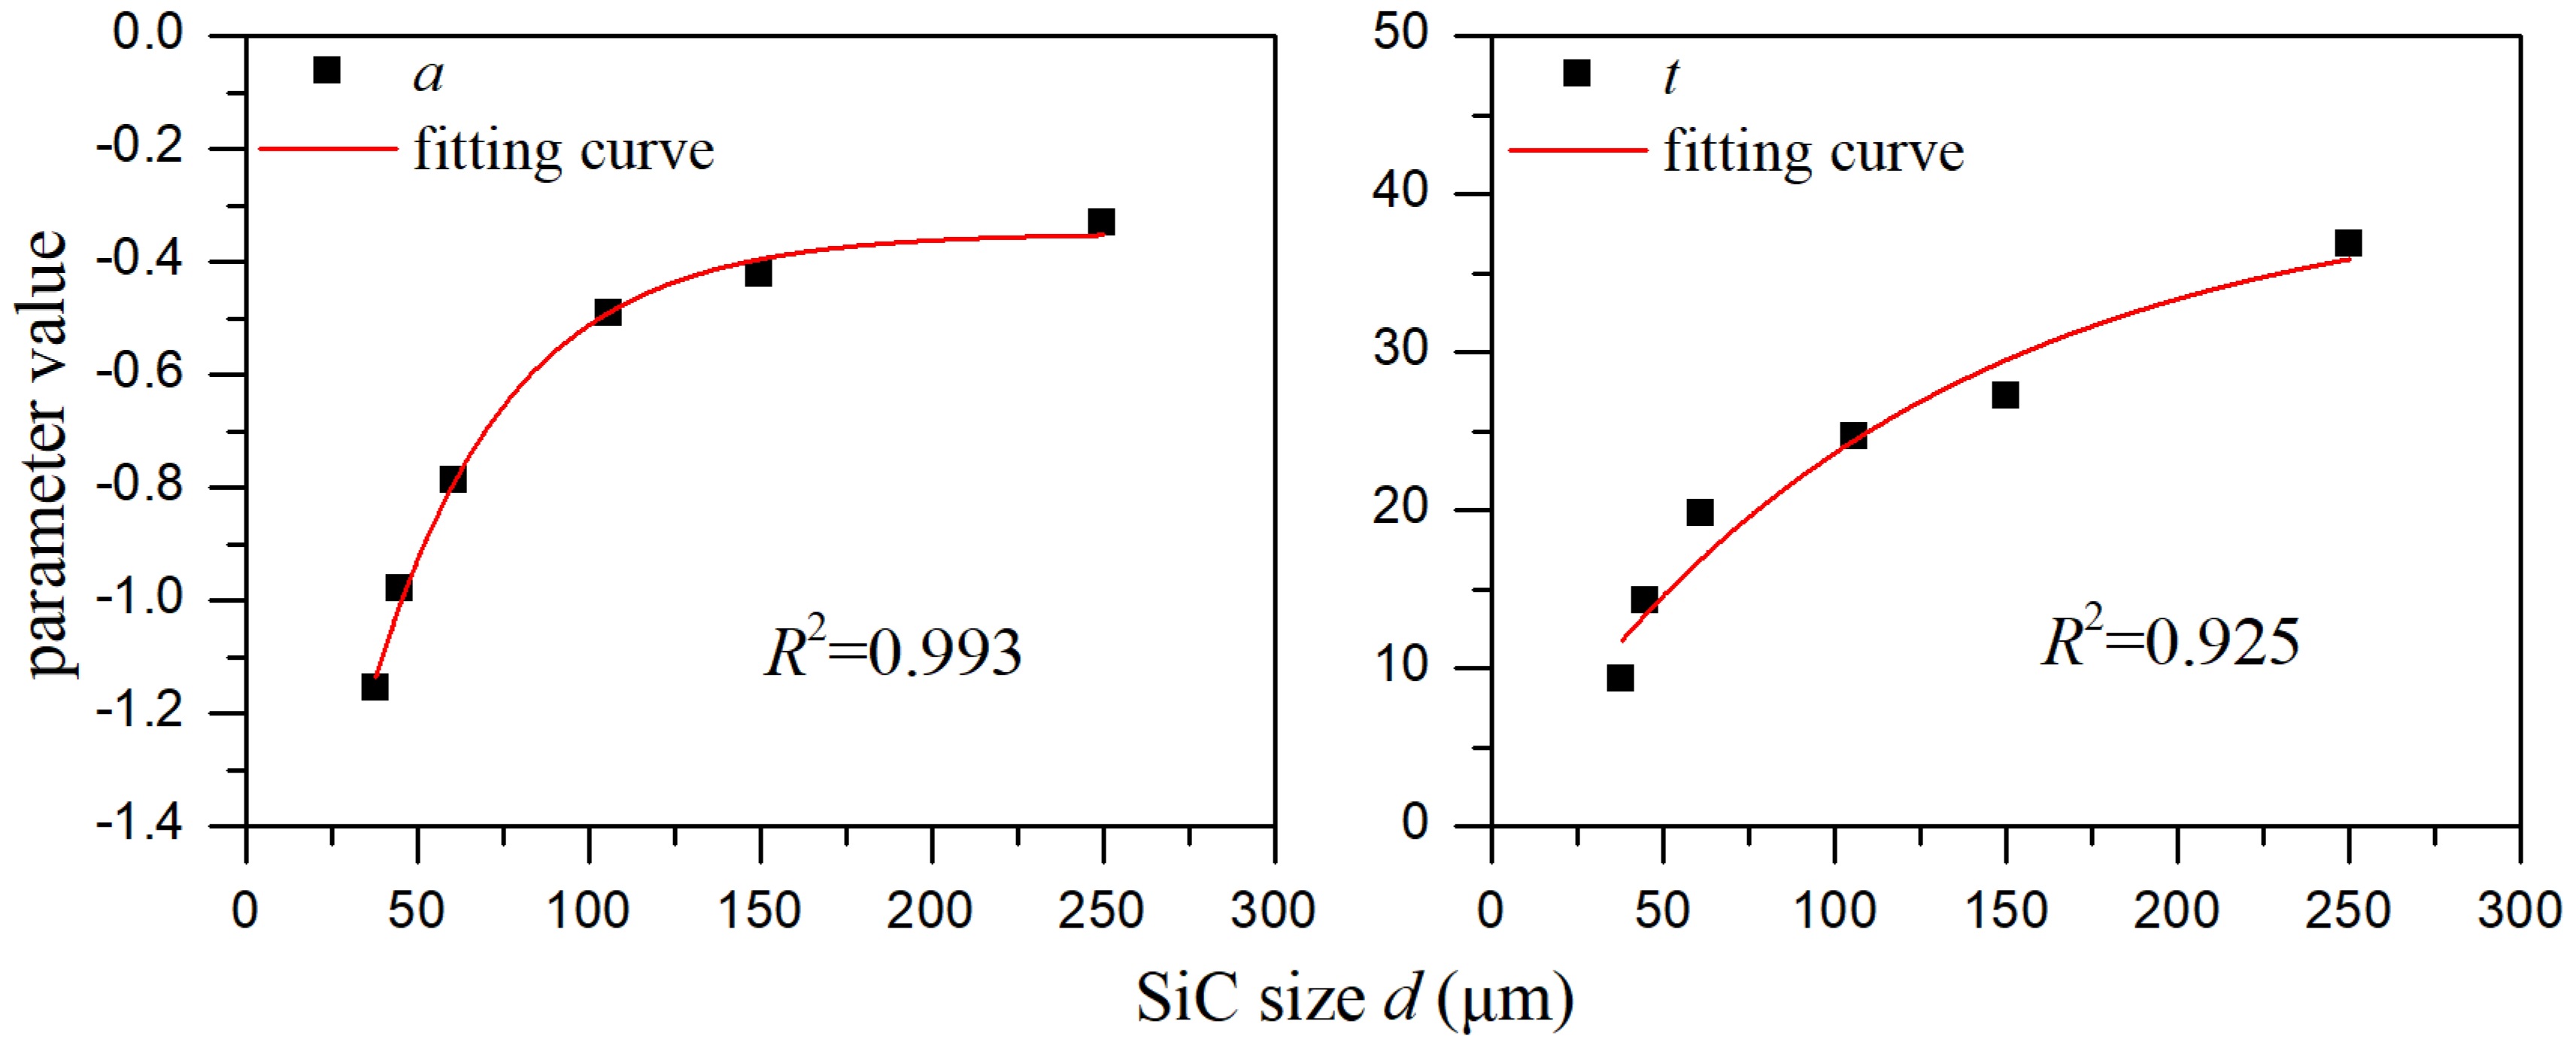
It can be seen that parameters a and t depend obviously on particle size d. The exponential function was used to fit the relation between a, t, and d, and the fitting curves are shown in Figure 7. In Equation (1), a indicates the influence degree of SiC particle concentration on its optical backscatter intensity, and larger a indicates the higher optical backscattering intensity. t represents the influence degree of SiC particle concentration on the change of its optical backscatter intensity. Larger t means the slower change of optical backscatter intensity with particle concentration, and smaller t means the faster change of optical backscatter intensity with particle concentration. From Equation (3), b = 0.973 − a, where b means the value of background scattered light intensity of pure water minus the value of a. The parameter a varies considerably with the particle size when the particle size is less than 100 μm. According to Equation (1), the smaller the particle size is, the higher the absolute value of parameter a is and the higher the voltage V will be. This indicates that the backscattered light intensity of particles smaller than 100 μm is higher, while the backscattered light intensity of particles larger than 100 μm is lower, which is consistent with Bunt’s conclusions [45].
The relationship between a, t, and particle size d can be expressed as
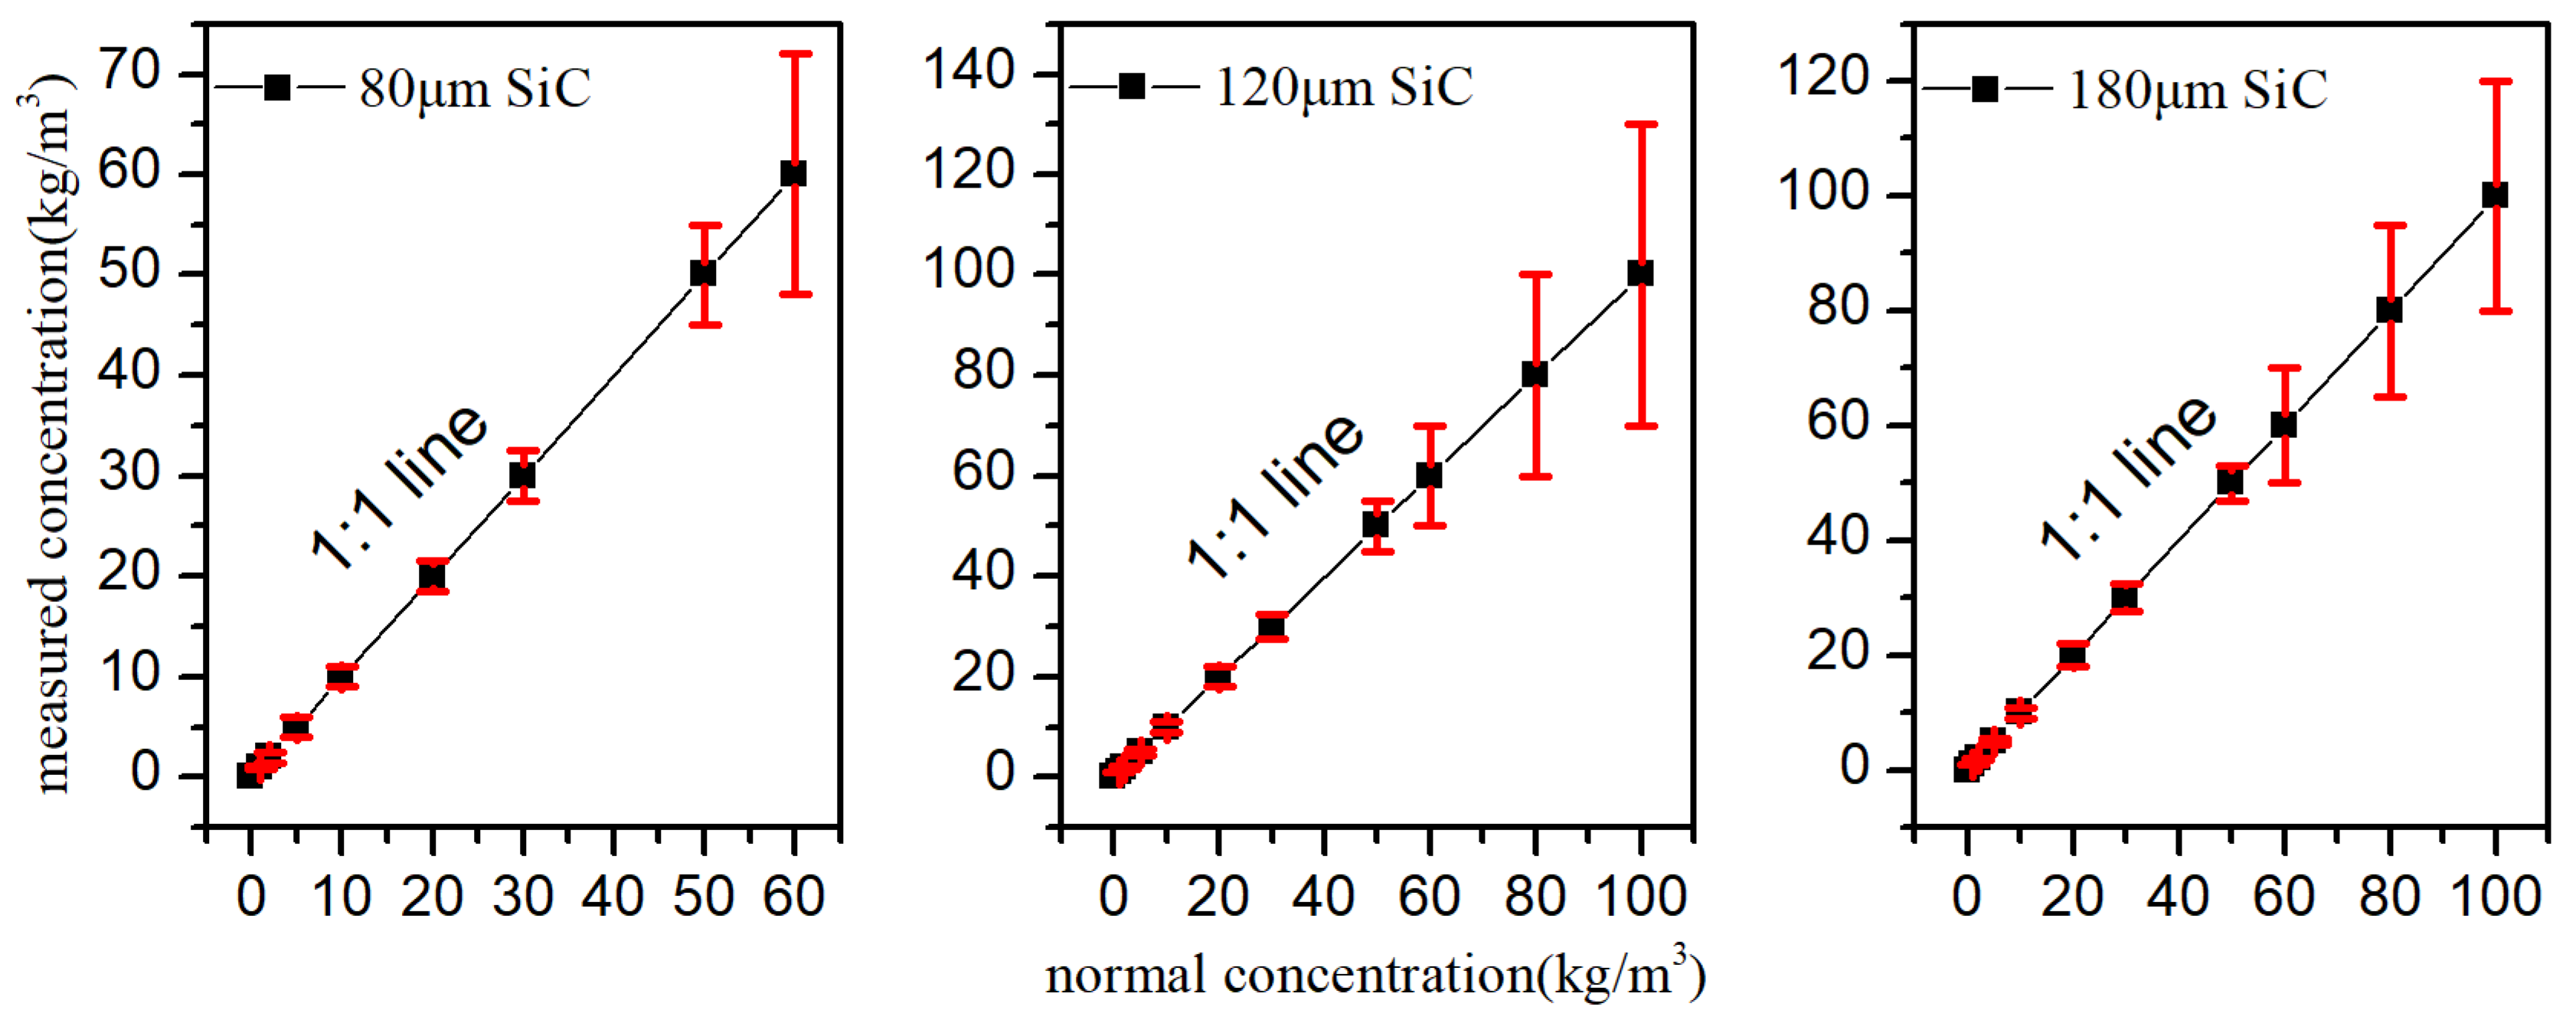
We used the above calibration relations (1)–(5) to measure the concentration of SiC with the other three different particle sizes, respectively, to verify the accuracy of the relations. The errors in the SiC concentrations measured according to Equations (1)–(5) relative to the prepared normal standard concentration for the three particle sizes are shown in Figure 8. It can be clearly seen that the measurement errors of SiC within the range of 0–50 kg/m3 were smaller than 10%.
However, the measurement error in the high concentration range of 50–100 kg/m3 was relatively large, over 10%, which is mainly because the variation of concentration in the high concentration range produces only a very small variation for the intensity of optical backscatter. It is obvious that the saturation induces such behavior. It can be seen from Figure 5 that the variation of concentration in the high concentration range of 50–100 kg/m3 of the fitted curve leads to a very small variation of voltage. This means that a small change in voltage will correspond to a large change in particle concentration, which will reduce the accuracy of particle concentration measurement. Therefore, in the actual calibration process, we should try to use the range with obvious concentration–voltage variation for concentration calibration, so that the measurement range can be reduced, while the measurement accuracy can be improved.
To sum up, in the actual calibration process, in order to obtain a high measurement accuracy, we need to limit the upper range of measurement concentration through using data with an obvious variation of voltages for concentration calibration.
4. Discussion on the Effects of Light Intensity on Concentration Measurement
The backscatter intensity for different concentrations of particles is closely related to the incident light intensity. For the same concentration of particles, the stronger the incident light is, the higher the backscattering intensity of the particles will be. Therefore, for particles with different particle sizes and concentrations, a change in incident light intensity will have an impact on the backscatter intensity of the particles and, thus, will have a certain impact on the measurement range and accuracy for the particle concentration. Therefore, we used three different light intensities listed in Table 3 to investigate the measurement performance of SiC particles with a particle size of 150 μm under different light intensities.
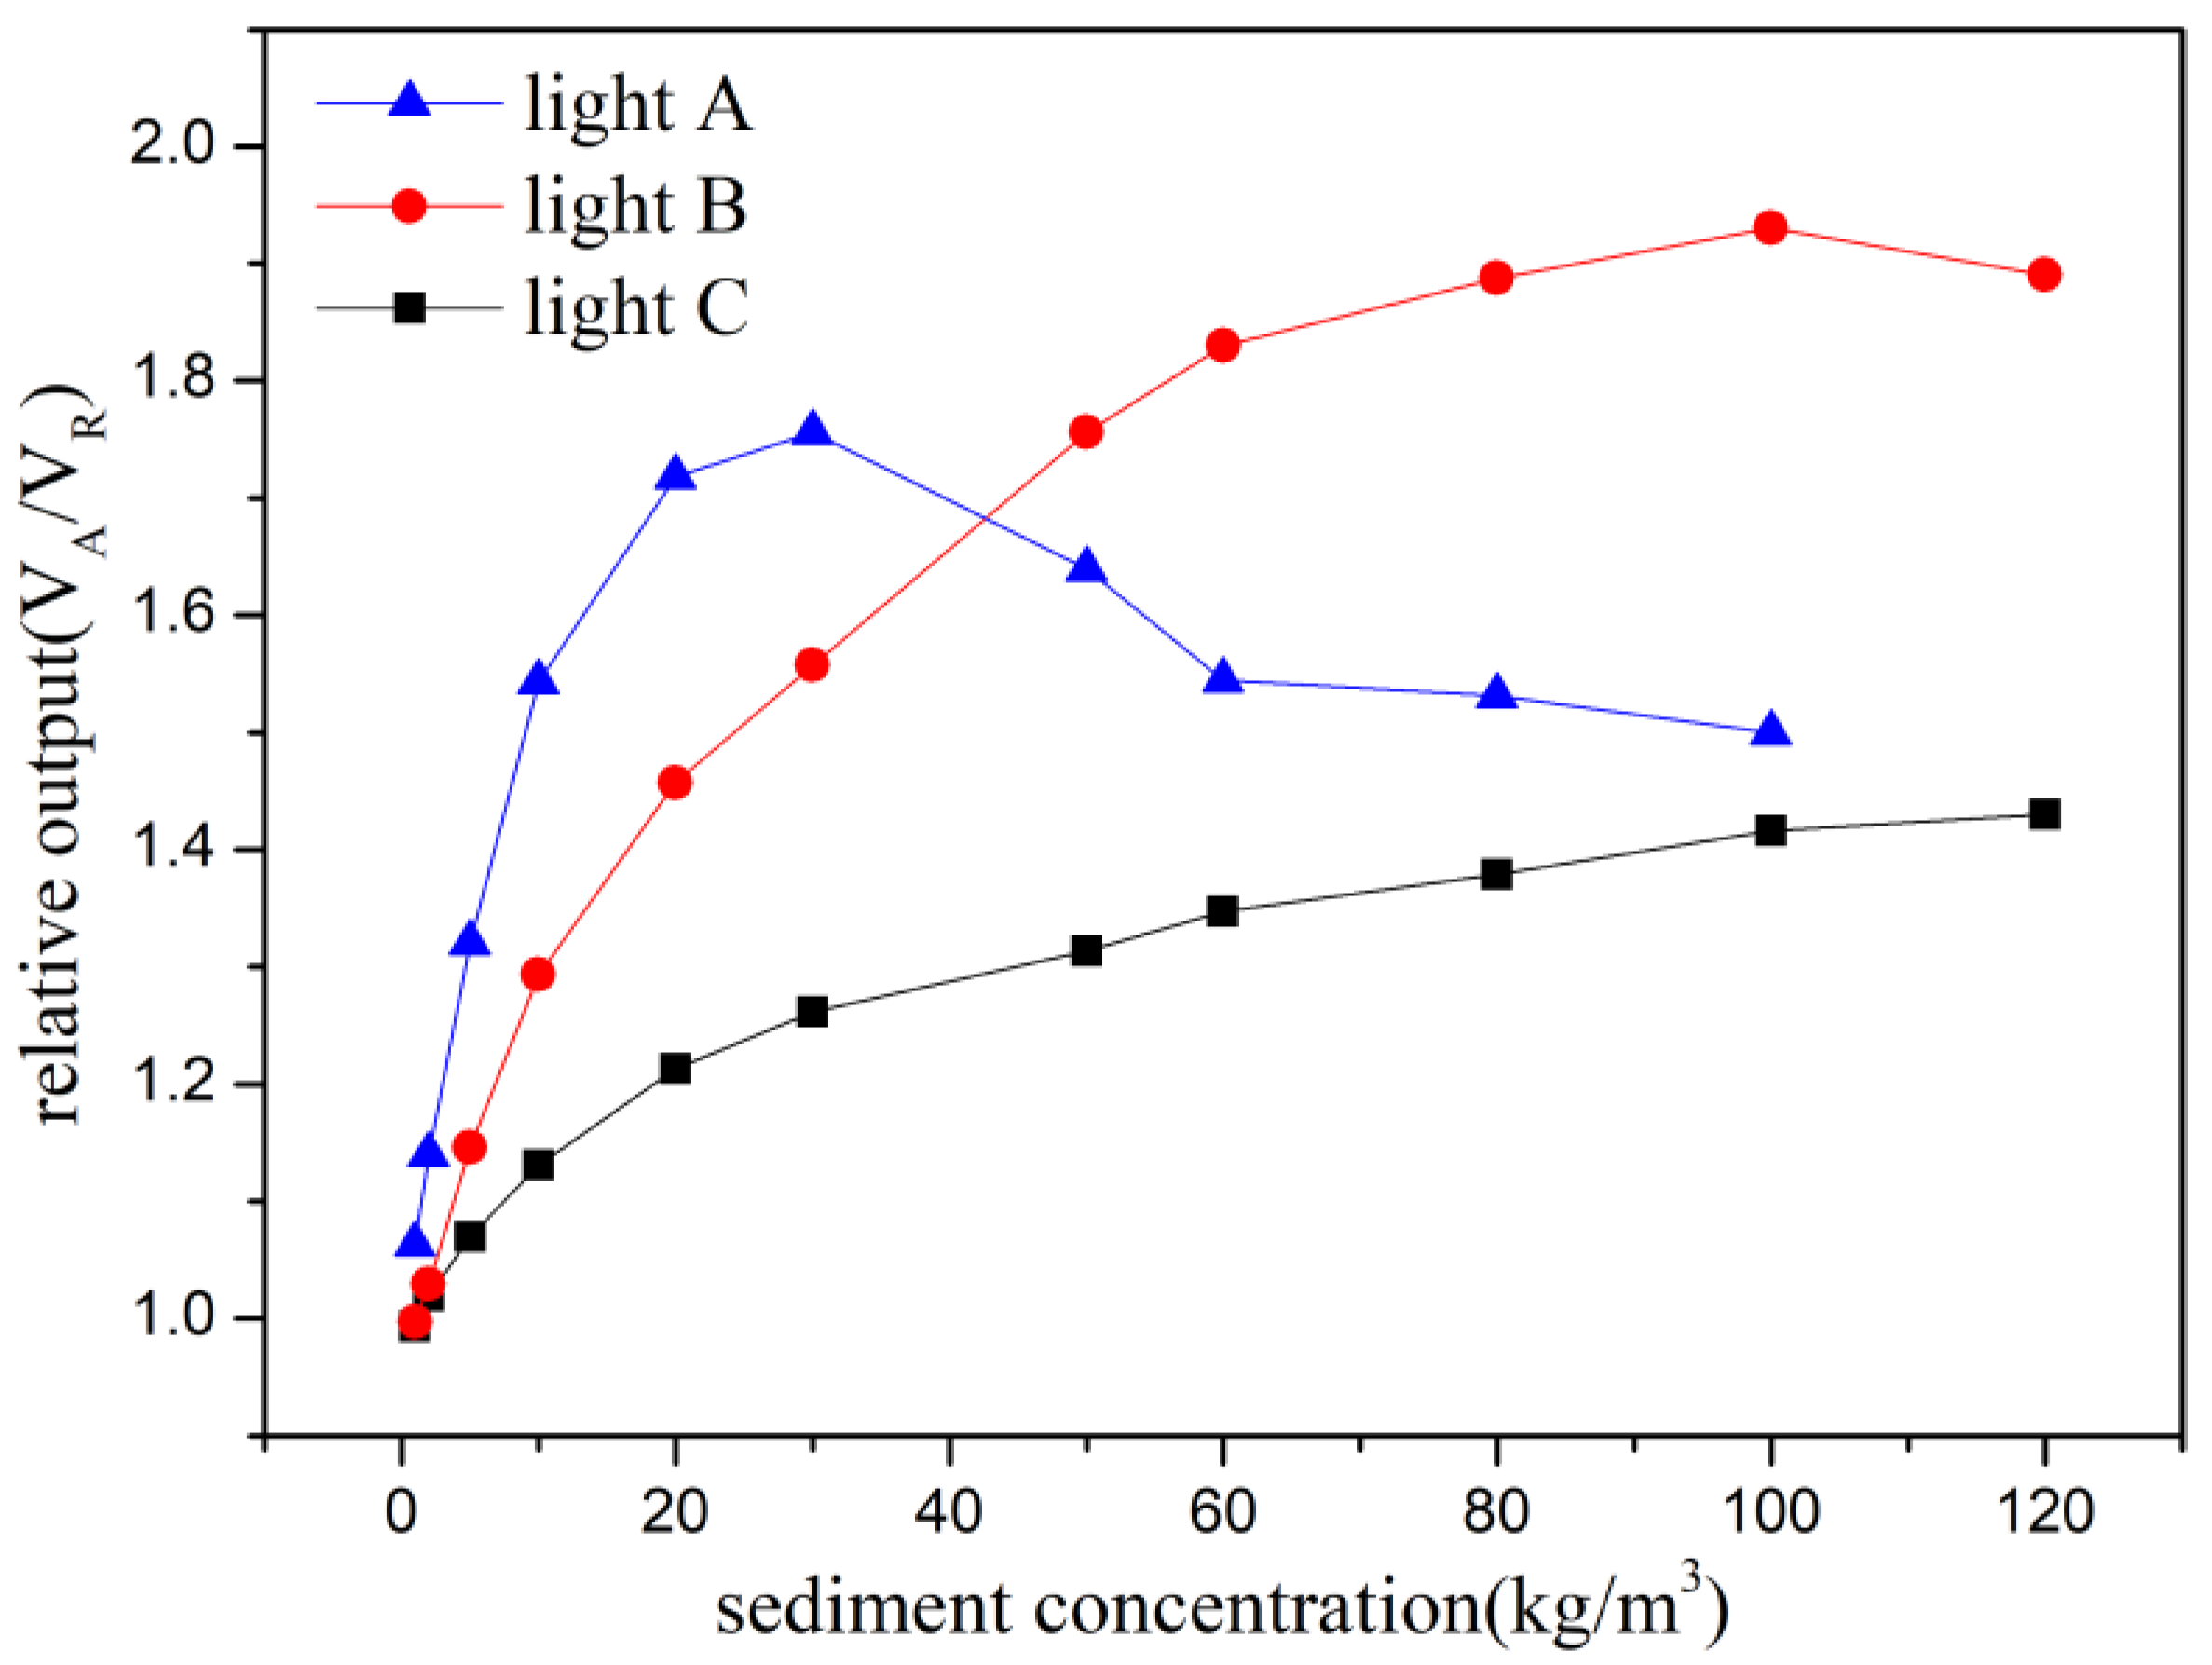
The concentration–voltage relationship curves for SiC particles with the diameter of 150 μm under three different light intensities are shown in Figure 9. The measuring ranges and errors of the three light intensities are shown in Table 3. The measurement error is defined as in the following equation:
where Cnormal is the normal uniform sediment suspension concentration, while Cmeasure is the measured concentration of standard uniform sediment suspension using the above calibration relationship.
It can be seen that under the high light intensity A, the concentration of SiC particles was positively correlated with the voltage within the range of 0–30 kg/m3, and the dependence of the voltage on concentration is obvious, which can ensure the measurement accuracy. It is indicated that a high light intensity is suitable for the measurement of low concentrations. This is mainly because of the fact that higher light intensities can provide stronger and unsaturated backscattered light of particles’ concentration condition. When the number of particles is too many, a number of different processes including: (a) partial blockage of the emitted and backscatter beam by abundant particles in highly concentration, (b) reduction of the scattering volume relative to the area of detection, (c) multiple backscatter by multiple particles, will weaken the light intensity received by the receiving fiber and the voltage drops when the concentration of SiC particles exceeds 30 kg/m3. In this case, the backscatter method is no longer suitable for measuring SiC concentrations [46]. In the cases of lights B and C, the voltage shows a positive correlation with the concentration of SiC particles within the ranges of 0–100 kg/m3 and 0–120 kg/m3. When the light intensity decreases, the voltage varies more slowly with the increase in concentration, and the measurement range increases. The measurement accuracy in the high-concentration section is high, while the measurement error is large in the low-concentration section. Larger errors in the low-concentration section are partly due to the fact that having less particles at low-concentrations leads to low values and a slow variation of backscatter intensity.
Considering the important role of particle sizes, as shown in Figure 5 calibrated under light intensity C, and combining the results of Figure 9, it can be concluded that it is necessary to comprehensively select the appropriate light source intensity according to the particle size and the required measurement range and accuracy. The general suggestion may be that a high light intensity is suitable for measuring the low-concentration range of large particles, while a low light intensity is suitable for measuring the high-concentration range of small particles.
5. Conclusions
Based on the principle of optical backscatter, a set of miniature particle concentration measurement devices was designed and developed in this paper. The experiment results show that this measuring instrument has the advantages of small size, large range, and synchronous measurement with multiple channels. The development of the measurement instrument provides a new method for the measurement of particle concentration in small-scale experiments in the laboratory. The following conclusions were drawn:
- A unified relation between SiC particle size, concentration, and scattered light intensity was developed through calibrating six uniform SiC particles with sizes ranging from 38 to 250 μm. The other three SiC particles with different sizes were used to test the universal applicability of the unified relation, and the measurement results show that the errors are less than 10%, which indicates that the relation is reasonable. At this point, we can measure the SiC concentration using the unified relation when knowing the uniform size of SiC particles, and there is no need to calibrate through a measurement for each particular particle group, which brings great convenience in the measurement of uniform particle concentration.
- The intensity of the light source has great influences on the measuring range and precision of SiC particle concentration. The experimental results for SiC concentration with a particle size of 150 μm under three light intensities showed that the measuring range of a high light intensity is small with high accuracy, while the measuring range of a low light intensity is large with low accuracy. The measuring range and accuracy can be adjusted by changing the intensity of the light source to meet different measuring demands.
It should be pointed out that the unified relation of particle size, particle concentration, and backscattered light intensity is developed for SiC particles in the size range of 38–250 μm. If the particle size of SiC exceeds the above size range, a new calibration measurement may be required to ensure the accuracy of measurement. In addition, considering the effects of other physical properties on the backscatter light of different particles, such as color, morphology, and so on, it is better to recalibrate the relationship for different particles to ensure the accuracy of measurement. Furthermore, due to the fact that actual natural sediment particles are all non-uniform, future investigation is also needed regarding how to develop a unified relation for non-uniform sediments with different gradings.
Author Contributions
Conceptualization, R.H., Q.Z., P.Q. and W.L.; methodology, R.H., Q.Z., P.Q. and W.L.; investigation, R.H. and Q.Z.; data curation, R.H.; writing—original draft preparation, R.H.; writing—review and editing, R.H. and Q.Z.; funding acquisition, Q.Z. All the authors contributed to technical discussions regarding this research.
Funding
This research was funded by the National Natural Science Foundation of China (grant No. 51679161).
Acknowledgments
The authors sincerely thank editors and anonymous reviewers for improving the manuscript.
Conflicts of Interest
The authors declare no conflict of interest.
References
- Van Rijn, L.C. Unified view of sediment transport by currents and waves. II: Suspended transport. J. Hydraul. Eng. ASCE 2007, 133, 668–689. [Google Scholar] [CrossRef]
- Barbier, E.B.; Hacker, S.D.; Kennedy, C.; Koch, E.W.; Stier, A.C.; Silliman, B.R. The value of estuarine and coastal ecosystem services. Ecol. Monogr. 2011, 81, 169–193. [Google Scholar] [CrossRef]
- Milliman, J.D.; Shen, H.T.; Yang, Z.S.; Mead, R.H. Transport and deposition of river sediment in the Changjiang estuary and adjacent continental shelf. Cont. Shelf Res. 1985, 4, 37–45. [Google Scholar] [CrossRef]
- Qiao, G.Q.; Zhang, J.F.; Zhang, Q.H.; Feng, X.; Lu, Y.C.; Feng, W.B. The Influence of Temperature on the Bulk Settling of Cohesive Sediment in Still Water with the Lattice Boltzmann Method. Water 2019, 11, 945. [Google Scholar] [CrossRef]
- Li, D.; Yang, Z.H.; Sun, Z.H.; Huai, W.X.; Liu, J.H. Theoretical Model of Suspended Sediment Concentration in a Flow with Submerged Vegetation. Water 2018, 10, 1656. [Google Scholar] [CrossRef]
- He, L.; Chen, D.; Zhang, S.Y.; Liu, M.; Duan, G.L. Evaluating Regime Change of Sediment Transport in the Jingjiang River Reach, Yangtze River, China. Water 2018, 10, 329. [Google Scholar] [CrossRef]
- Zhou, Q.; Tian, L.Q.; Wai, W.H.; Li, J.; Sun, Z.H.; Li, W.K. High-Frequency Monitoring of Suspended Sediment Variations for Water Quality Evaluation at Deep Bay, Pearl River Estuary, China: Influence Factors and Implications for Sampling Strategy. Water 2018, 10, 323. [Google Scholar] [CrossRef]
- Vercruysse, K.; Grabowski, R.C.; Rickson, R.J. Suspended sediment transport dynamics in rivers: Multi-scale drivers of temporal variation. Earth Sci. Rev. 2017, 166, 38–52. [Google Scholar] [CrossRef] [Green Version]
- Butt, T.; Russell, P. Hydrodynamics and cross-shore sediment transport in the swash-zone of natural beaches: A review. J. Coast. Res. 2000, 16, 255–268. [Google Scholar]
- Gray, J.R.; Gartner, J.W. Technological advances in suspended-sediment surrogate monitoring. Water Resour. Res. 2009, 45, W00D29. [Google Scholar] [CrossRef]
- Rai, A.K.; Kumar, A. Continuous measurement of suspended sediment concentration: Technological advancement and future outlook. Measurement 2015, 76, 209–227. [Google Scholar] [CrossRef]
- Thorne, P.D.; Vincent, C.E.; Hardcastle, P.J.; Rehman, S.; Pearson, N. Measuring suspended sediment concentrations using acoustic backscatter devices. Mar. Geol. 1991, 98, 7–16. [Google Scholar] [CrossRef]
- Thorne, P.D.; Hurther, D. An overview on the use of backscattered sound for measuring suspended particle size and concentration profiles in non-cohesive inorganic sediment transport studies. Cont. Shelf Res. 2014, 73, 97–118. [Google Scholar] [CrossRef] [Green Version]
- Öztürk, M. Sediment Size Effects in Acoustic Doppler Velocimeter-Derived Estimates of Suspended Sediment Concentration. Water 2017, 9, 529. [Google Scholar] [CrossRef]
- Ha, H.K.; Hsu, W.Y.; Maa, P.Y.; Shao, Y.Y.; Holland, C.W. Using ADV backscatter strength for measuring suspended cohesive sediment concentration. Cont. Shelf Res. 2009, 29, 1310–1316. [Google Scholar] [CrossRef]
- Mishra, P.N.; Bore, T.; Jiang, Y.; Scheuermann, A.; Li, L. Dielectric spectroscopy measurements on kaolin suspensions for sediment concentration monitoring. Measurement 2018, 121, 160–169. [Google Scholar] [CrossRef] [Green Version]
- Li, X.Y.; Lei, T.W.; Wang, W.; Xu, Q.C.; Zhao, J. Capacitance sensors for measuring suspended sediment concentration. Catena 2005, 60, 227–237. [Google Scholar] [CrossRef]
- Traykovski, P.; Geyer, W.R.; Irish, J.D.; Lynch, J.F. The role of wave-induced density-driven fluid mud flows for cross-shelf transport on the Eel River continental shelf. Cont. Shelf Res. 2000, 20, 2113–2140. [Google Scholar] [CrossRef]
- Downing, J.P.; Sternberg, R.W.; Lister, R.B. New instrumentation for the investigation of sediment suspension processes in the shallow marine environment. Mar. Geol. 1981, 42, 19–34. [Google Scholar] [CrossRef]
- Maa, P.Y.; Xu, J.P.; Victor, M. Notes on the performance of an optical backscatter sensor for cohesive sediments. Mar. Geol. 1992, 104, 215–218. [Google Scholar] [CrossRef]
- Ludwig, K.A.; Hanes, D.M. A laboratory evaluation of optical backscatterance suspended solids sensors exposed to sand-mud mixtures. Mar. Geol. 1990, 94, 173–179. [Google Scholar] [CrossRef]
- Downing, J. Twenty-five years with OBS sensors: The good, the bad, and the ugly. Cont. Shelf Res. 2006, 26, 2299–2318. [Google Scholar] [CrossRef]
- Shao, Y.Y.; Maa, P.Y. Comparisons of different instruments for measuring suspended cohesive sediment concentrations. Water 2017, 9, 968. [Google Scholar] [CrossRef]
- Neukermans, G.; Ruddick, K.; Loisel, H.; Roose, P. Optimization and quality control of suspended particulate matter concentration measurement using turbidity measurements. Limnol. Oceanogr. Methods 2012, 10, 1011–1023. [Google Scholar] [CrossRef] [Green Version]
- Ma, L.; Duan, F.J.; Song, G.C.; Zhao, L. A concentration measurement model of suspended solids in oilfield reinjection water based on underwater scattering. Measurement 2018, 117, 125–132. [Google Scholar] [CrossRef]
- Campbell, C.G.; Laycak, D.T.; Hoppes, W.; Tran, N.T.; Shi, F.G. High concentration suspended sediment measurements using a continuous fiber optic in-stream transmissometer. J. Hydrol. 2005, 311, 244–253. [Google Scholar] [CrossRef]
- Qi, P.F.; Lin, L.; Huang, R.; Zhao, S.C.; Tian, H.L.; Li, S.; Zhang, Q.H.; Liu, W.W. Image Fiber-Based Miniature Suspended Solid Sensor with High Accuracy and a Large Dynamic Range. Sci. Rep. 2017, 7, 16798. [Google Scholar] [CrossRef] [PubMed] [Green Version]
- Shen, X.T.; Maa, P.Y. A camera and image processing system for floc size distributions of suspended particles. Mar. Geol. 2016, 376, 132–146. [Google Scholar] [CrossRef]
- Orlins, J.J.; Gulliver, J.S. Turbulence quantification and sediment resuspension in an oscillating grid chamber. Exp. Fluids 2003, 34, 662–677. [Google Scholar] [CrossRef]
- Zhang, J.F.; Shen, X.T.; Zhang, Q.H.; Maa, P.Y.; Qiao, G.Q. Bimodal particle size distributions of fine-grained cohesive sediments in a settling column with oscillating grids. Cont. Shelf Res. 2019, 174, 85–94. [Google Scholar] [CrossRef]
- Holliday, C.P.; Rasmussen, T.C.; Miller, W.P. Establishing the relationship between turbidity and total suspended sediment concentration. In Proceedings of the 2003 Georgia Water Resources Conference, Athens, GA, USA, 23–24 April 2003. [Google Scholar]
- Guillén, J.; Palanques, A.; Puig, P.; Madron, X.D.; Nyffeler, F. Field calibration of optical sensors for measuring suspended sediment concentration in the western Mediterranean. Sci. Mar. 2000, 64, 427–435. [Google Scholar] [CrossRef] [Green Version]
- Green, M.O.; Boon, J.D. The measurement of constituent concentrations in nonhomogeneous sediment suspensions using optical backscatter sensors. Mar. Geol. 1993, 110, 73–81. [Google Scholar] [CrossRef]
- Fugate, D.C.; Friedrichs, C.T. Determining concentration and fall velocity of estuarine particle populations using ADV, OBS and LISST. Cont. Shelf Res. 2002, 22, 1867–1886. [Google Scholar] [CrossRef]
- Yeoh, S.; Matjafri, M.Z.; Mutter, K.N.; Oglat, A.A. Plastic fiber evanescent sensor in measurement of turbidity. Sens. Actuator A Phys. 2019, 285, 1–7. [Google Scholar] [CrossRef]
- Omar, A.F.; MatJafri, M.Z. Turbidimeter design and analysis: A review on optical fiber sensors for the measurement of water turbidity. Sensors 2009, 9, 8311–8335. [Google Scholar] [CrossRef] [PubMed]
- Berkovic, G.; Shafir, E. Optical methods for distance and displacement measurements. Adv. Opt. Photonics 2012, 4, 441–471. [Google Scholar] [CrossRef]
- Shenoy, M.R. Optical fibre probes in the measurement of scattered light: Application for sensing turbidity. Pramana J. Phys. 2014, 82, 39–48. [Google Scholar] [CrossRef]
- Huang, R.; Zhang, Q.H.; Xing, E.B.; Qi, P.F.; Liu, W.W. Multichannel suspended sediment concentration measurement method based on optical fiber sensing. J. Hydroelectr. Eng. 2019, 38, 1–9. (In Chinese) [Google Scholar]
- Sutherland, T.F.; Lane, P.M.; Amos, C.L.; Downing, J. The calibration of optical backscatter sensors for suspended sediment of varying darkness levels. Mar. Geol. 2000, 162, 587–597. [Google Scholar] [CrossRef]
- Gentile, F.; Bisantino, T.; Corbino, R.; Milillo, F.; Romano, G.; Liuzzi, G.T. Monitoring and analysis of suspended sediment transport dynamics in the Carapelle torrent (southern Italy). Catena 2010, 80, 1–8. [Google Scholar] [CrossRef]
- Landers, M.N.; Sturm, T.W. Hysteresis in suspended sediment to turbidity relations due to changing particle size distributions. Water Resour. Res. 2013, 49, 5487–5500. [Google Scholar] [CrossRef]
- Merten, G.H.; Capel, P.D.; Minella, P.G. Effects of suspended sediment concentration and grain size on three optical turbidity sensors. J. Soils Sediments 2014, 14, 1235–1241. [Google Scholar] [CrossRef]
- Butt, T.; Miles, J.; Ganderton, P.; Russel, P. A simple method for calibrating optical backscatter sensors in high concentrations of non-cohesive sediments. Mar. Geol. 2002, 192, 419–424. [Google Scholar] [CrossRef]
- Bunt, A.C.; Larcombe, P.; Jago, C.F. Quantifying the response of optical backscatter devices and transmissometers to variations in suspended particulate matter. Cont. Shelf Res. 1999, 19, 1199–1220. [Google Scholar] [CrossRef]
- Kineke, G.C.; Sternberg, R.W. Measurements of high concentration suspended sediments using the optical backscatterance sensor. Mar. Geol. 1992, 108, 253–258. [Google Scholar] [CrossRef]
Figure 1.
Sketch of instruments and experiment setup.

Figure 2.
Experimental instruments.

Figure 3.
Five-channel optical fiber device for particle concentration measurement.

Figure 4.
Commercial SiC particles (Nos. 1–9 represent nine uniform SiC particles from coarse to fine).
Figure 4.
Commercial SiC particles (Nos. 1–9 represent nine uniform SiC particles from coarse to fine).

Figure 5.
Concentration–voltage relation curves of six uniform SiC particles of different sizes.

Figure 6.
Concentration–voltage fitting curves of six uniform SiC particles of different sizes.

Figure 7.
Fitting curve between parameters a and t with particle size d.

Figure 8.
Measurement errors of three different SiC particle sizes.

Figure 9.
Concentration–voltage relationship for SiC particles of 150 μm under three different light intensities.
Figure 9.
Concentration–voltage relationship for SiC particles of 150 μm under three different light intensities.


Table 1.
Nine uniform SiC particle sizes.
| Six Uniform SiC for Calibration | Three Uniform SiC for Verification | ||||||||
|---|---|---|---|---|---|---|---|---|---|
| SiC size (μm) | 38 | 45 | 61 | 106 | 150 | 250 | 80 | 120 | 180 |
Table 2.
Parameters of fitting function for six uniform SiC particles of different sizes.
| Particle Size d (μm) | a | t | b | R2 |
|---|---|---|---|---|
| 38 | −1.156 | 9.265 | 2.129 | 0.981 |
| 45 | −0.980 | 14.226 | 1.952 | 0.985 |
| 61 | −0.786 | 19.827 | 1.759 | 0.988 |
| 106 | −0.491 | 24.666 | 1.463 | 0.987 |
| 150 | −0.423 | 27.186 | 1.400 | 0.984 |
| 250 | −0.330 | 36.821 | 1.303 | 0.998 |
Table 3.
Measuring range and precision under three different light intensities.
| Light | Light Intensity (lm) | Range (kg/m3) | Error (%) |
|---|---|---|---|
| A | 600 | 0–1, 1–30 | 10.0, 5.0 |
| B | 240 | 0–5, 5–100 | 30.0, 8.0 |
| C | 90 | 0–5, 5–120 | 40.0, 10.0 |
© 2019 by the authors. Licensee MDPI, Basel, Switzerland. This article is an open access article distributed under the terms and conditions of the Creative Commons Attribution (CC BY) license (http://creativecommons.org/licenses/by/4.0/).
Share and Cite
MDPI and ACS Style
Huang, R.; Zhang, Q.; Qi, P.; Liu, W. Concentration Measurement of Uniform Particles Based on Backscatter Sensing of Optical Fibers. Water 2019, 11, 1955. https://doi.org/10.3390/w11091955
AMA Style
Huang R, Zhang Q, Qi P, Liu W. Concentration Measurement of Uniform Particles Based on Backscatter Sensing of Optical Fibers. Water. 2019; 11(9):1955. https://doi.org/10.3390/w11091955
Chicago/Turabian StyleHuang, Rui, Qinghe Zhang, Pengfei Qi, and Weiwei Liu. 2019. "Concentration Measurement of Uniform Particles Based on Backscatter Sensing of Optical Fibers" Water 11, no. 9: 1955. https://doi.org/10.3390/w11091955
Note that from the first issue of 2016, this journal uses article numbers instead of page numbers. See further details here.