Article

Pseudo-nitzschia Blooms in a Coastal Upwelling System: Remote Sensing Detection, Toxicity and Environmental Variables

by
Jesus M. Torres Palenzuela
1,*,
Luis González Vilas
1,
Francisco M. Bellas
1,
Elina Garet
2,
África González-Fernández
2 and
Evangelos Spyrakos
3
1
Remote Sensing and GIS Laboratory, Department of Applied Physics, Sciences Faculty, University of Vigo, Campus Lagoas Marcosende, 36310 Vigo, Spain
2
Immunology Area, Biomedical Research Center (CINBIO) and Institute of Biomedical Research of Vigo (IBIV), University of Vigo, Campus Lagoas Marcosende, 36310 Vigo, Spain
3
Biological and Environmental Sciences, School of Natural Sciences, University of Stirling, Stirling FK9 4LA, UK
*
Author to whom correspondence should be addressed.
Water 2019, 11(9), 1954; https://doi.org/10.3390/w11091954
Submission received: 17 July 2019 / Revised: 13 September 2019 / Accepted: 16 September 2019 / Published: 19 September 2019
(This article belongs to the Special Issue Application of Remote Sensing and GIS in Aquatic Ecosystems)

Abstract

:
The NW coast of the Iberian Peninsula is dominated by extensive shellfish farming, which places this region as a world leader in mussel production. Harmful algal blooms in the area frequent lead to lengthy harvesting closures threatening food security. This study developed a framework for the detection of Pseudo-nitzschia blooms in the Galician rias from satellite data (MERIS full-resolution images) and identified key variables that affect their abundance and toxicity. Two events of toxin-containing Pseudo-nitzschia were detected (up to 2.5 μg L−1 pDA) in the area. This study suggests that even moderate densities of Pseudo-nitzschia in this area might indicate high toxin content. Empirical models for particulate domoic acid (pDA) were developed based on MERIS FR data. The resulting remote-sensing model, including MERIS bands centered around 510, 560, and 620 nm explain 73% of the pDA variance (R2 = 0.73, p < 0.001). The results show that higher salinity values and lower Si(OH)4/N ratios favour higher Pseudo-nitzschia spp. abundances. High pDA values seem to be associated with relatively high PO43, low NO3 concentrations, and low Si(OH)4/N. While MERIS FR data and regionally specific algorithms can be useful for detecting Pseudo-nitzschia blooms, nutrient relationships are crucial for predicting the toxicity of these blooms.

1. Introduction

Pseudo-nitzschia Peragallo is a chain-forming diatom genus that is widespread in all oceans of the world [1]. A number of these diatom species of this genus are known producers of a neurotoxic amino acid, domoic acid (DA), which when accumulated via trophic transfer in the food-web can have deleterious (amnesic shellfish poisoning, ASP) and even fatal effects to several marine organisms and less frequently to humans [2,3,4]. Pseudo-nitzschia is the only diatom genus among 27 dinoflagellates and 1 raphidophyte species that is listed as responsible for harmful algal events in upwelling regions [5]. Pseudo-nitzschia is generally common in upwelling systems e.g., in California Current System [6,7,8,9,10], in Iberian System [11,12,13,14], and Benguela upwelling system [15,16,17].
Understanding the relationships between the abundance of these diatoms, DA, and the characteristics of the environment will provide valuable information on the variable(s) that might determine their growth, distribution, and DA production. Several authors [18,19,20,21,22,23,24] have related these blooms with changes in nutrient availability, and therefore with upwelling events and eutrophication. On the west coast of USA, an area where Pseudo-nitzschia is a common harmful bloom former, DA outbreaks that are caused by P. australis have been associated with upwelling events and increased but in declining phase nutrients [25,26]. Other authors have also found a relationship between high Pseudo-nitzschia spp. cell abundance and low-nutrient conditions [27,28,29]. Several laboratory experiments [30,31,32,33,34,35] have addressed the silicic acid and/or phosphorus, iron, copper limitations as significant factors for the toxin production of Pseudo-nitzschia species. The relationship between DA production and the nutritional status appears to be complex in natural populations, since they are often composed of several species [36,37], in fact some authors have not found obvious environmental triggers of DA production [16]. However, it seems that the silicic acid supply [7,9,20,24,28,38,39] plays an important role. More specifically for P. australis, Anderson [9] suggested that weight ratio values of Si(OH)4:NO3 below 2 are found to be linked to DA production from this species. Recently, Trick et al. [40] showed that iron and copper limitations, and not macronutrient stress, are more essential for the DA production in natural populations in the Pacific North-West.
In addition to nutrient availability, salinity has also been reported as an important factor that affects Pseudo-nitzschia abundance and/or DA production, mainly in estuarine systems [23,24,26,29,41]. Regarding temperature, although Pseudo-nitzschia species are observed in a wide range of temperatures, some authors have identified the optimal ranges for specific species [23,39]. Moreover, in a recent work, [42] report that warming could lead to an increase of abundance and toxicity of Pseudo-nitzschia spp. blooms in California coastal waters. Other environmental factors identified as affecting to Pseudo-nitzschia spp. distribution and bloom dynamics are light intensity [23,39], photoperiod [38], and factors controlling nutrient availability, such as river flow [29], rainfall [23,38], or upwelling [10,13,14].
Harmful algal events that were attributed to the genus Pseudo-nitzschia are considered as a reoccurring phenomenon along the northern boundary of the Iberian–Canary current upwelling system. These blooms have become a focal point of numerous studies since the first time that they were recorded in the autumn of 1994 [43] and they are occasionally associated with sporadic DA production, which occurs primarily towards the latter stages of bloom development [26]. Although several species of Pseudo-nitzschia have been recorded in the Galician coastal embayments referred to as rias (NW Spain), only P. australis has been shown to produce DA in the region [44]. Toxigenic events due to blooms of P. australis in this area have been recorded before DSP (Diarrheic Shellfish Poisoning) events [45] in thermohaline stratified water masses.
There is considerable interest in the study of Pseudo-nitzschia and the detection of DA in the Galician rias due to the economic and social importance of the extensive mussel culture in this region and human health concerns [46,47]. As part of a routine monitoring programme, the Technological Institute for the Control of the Marine Environment of Galicia (INTECMAR) has organized sampling on a weekly basis in the Galician rias, where, among other water parameters, Pseudo-nitzschia spp. abundance and biotoxins in mussels and other molluscs are recorded. DA detection in this area has been mainly studied on shellfish extracts [48,49] and on Pseudo-nitzschia cultures [44,50]. However, very limited information is available on the particulate DA concentrations (pDA) in seawater.
Chlorophyll a (chla) concentration can be used as a phytoplankton biomass indicator, since it is common to almost taxonomic groups [51]. Thus, chla maps that were derived from passive ocean colour sensors could be useful for identifying and monitoring high biomass blooms, although they do not provide information regarding species or toxicity [52]. In Galicia, MERIS imagery has already proven to be an effective tool to map the spatial and temporal distribution of high biomass algae events during an upwelling cycle [53]. MERIS provides images with a 300 m spatial resolution in nadir (Full Resolution –FR mode) and fifteen bands from visible to near infrared to support the monitoring of coastal zones [54]. Although MERIS is not operative since 2012, Sentinel-3 OLCI provides continuity to the MERIS dataset since 2016, providing the same spatial resolution (300 m), but with more spectral bands (21 instead of 15) ranging from 400 nm to 1020 nm [55].
The aim of this study is two-fold. Firstly, it attempts to develop a framework for the detection of potentially toxic Pseudo-nitzschia spp. blooms that are based on satellite data. Secondly, it aims to identify key variables affecting the formation and toxicity of Pseudo-nitzschia spp. blooms during different seasonally and meteorologically defined conditions, typical in upwelling systems.

2. Materials and Methods

2.1. Study Area

The Galician rias are V-shaped coastal formations along the northwest part of the Iberian Peninsula. The rias Baixas are the four southern rias, from north to south: Muros, Arousa, Pontevedra, and Vigo, all being oriented in a SW-NE direction (Figure 1a). This study focuses on two rias (Pontevedra and Vigo, Figure 1b), each being connected to the open sea through two entrances, to the north and south of the islands located at the external part of each ria. Rivers located in the innermost part of the rias provide the primary freshwater input [56].

2.2. Sampling Regime and In Situ Measurements

The samples were collected in two Galician rias during seven field trips (Table 1, Figure 1b) over a three-year period (2007–2009). Three periods were selected reflecting the different seasons of the campaigns and the meteorological conditions of the study area (Figure 2). Period 1 (spring downwelling) corresponds to spring downwelling conditions. The campaigns that were carried out on period 2 (summer) were characterised mainly by upwelling conditions or relaxation after strong upwelling favourable winds. This is typical of the summer upwelling-downwelling cycle in the area. The last period (period 3, autumn downwelling) includes campaigns in autumn and it is characterised by strong downwelling-favourable winds. These periods are considered as recurrent events in the coastal upwelling system of the Galician rias and they have been associated with harmful events due to diatoms or/and dinoflagellates in previous studies (review by [57]).
Ten fixed stations were visited five times (25 July 2007; 19 October 2007; 9 July 2008; 22 July 2008; 14 July 2009) in the Ria de Vigo, while using a sampling transect extended from the open sea toward the inner part of the ria. Two additional sampling stations, shown in Figure 1b as closed circles, were sampled on 14 July 2009. The depth of the stations ranged from 5 m inside the ria to 100 m in the outer part. Moreover, a five station transect was sampled twice (27 May and 7 July) in Ria de Pontevedra during 2009 (Table 1), while using a transect extended from the middle part of the ria to the innermost part.
Chla fluorescence profiles were monitored by a Turner designs CYCLOPS-7 submersible fluorometer. A portable meter provided the profiles of water temperature, pH, and dissolved oxygen (DO) (HI 9829, Hanna instruments). A Seabird Model 25 CTD was used to collect vertical profiles of temperature, salinity, fluorescence, and depth of water column at each site. Triplicate water samples from surface to 3 m were collected at each station from an integrated polycarbonate tubular water sampler (3524 cm3) for further analysis, which is described below. The depth of the euphotic zone was established with a Secchi disk (Secchi disk depth or Zsd), while using measurements recorded by the same observer and taken from the sunny side of the boat.

2.2.1. High Performance Liquid Chromatography (HPLC)

For the HPLC chla determination, water samples (100–200 mL) were filtered through 9 mm diameter Whatman GF/F filters and then stored at −80 °C for two weeks. The pigments were extracted in 95% methanol. In this study only chla concentration data are presented, calculated as the sum of chlorophyllide a, chlorophyll a epimer, chlorophyll a allomer, and divinyl chlorophyll a. An HPLC method while using a reversed phase C8 was applied for the separation of the pigments. Details of pigment extraction and separation are provided in [58].

2.2.2. Suspended Particulate Material (SPM)

SPM was evaluated in terms of SPM concentration and percent weight of organic material (%OM). Pre-combusted (450 °C for 24 h), pre-washed in 500 mL of MilliQ (Merck, Burlington, MA, USA), and 47 mm Whatman GF/F filters (Merck, Burlington, MA, USA) were used. These filters were then dried at 65 °C to a constant weight. Particles were collected by filtering a standard volume (1000 mL) of seawater samples and then rinsed with 50 mL MilliQ (Merck, Burlington, MA, USA) to remove salts and dissolved organic material. For the determination of SPM, the filters were dried at 65 °C until no weight changes were observed. The filters were then re-combusted at 450 °C for 5 h in order to obtain the inorganic suspended material (ISM) [59,60]. The percent weight of organic material (%OM) was determined by subtracting the ISM from the SPM. All of the filters were weighted on a Precisa 262 SMA-FR microbalance (10−5 g precision).

2.2.3. Nutrients and Dissolved Organic Carbon (DOC)

The water samples were filtered through 47 mm Whatman GF/F filters (Merck, Burlington, MA, USA) (0.7 μm pore size) and the filtered water was stored at −40 °C for further analysis of DOC and dissolved inorganic micronutrients (nitrate, nitrite, phosphorus, silicate and ammonia). All the nutrients and DOC were analysed with a Technicon AAII (SEAL Analytical GmbH, Norderstedt, Germany) auto-analyser following the methodologies that are described in [61,62,63]. The ratios of silicate to other nutrients were also calculated due to their importance to marine diatoms.

2.2.4. Particulate Organic Carbon and Nitrogen (POC, PON)

POC and PON content were determined from seawater samples (100–200 mL) filtered through pre-combusted 9 mm diameter Whatman GF/F filters and then stored at −80 °C. The filters were dried at 70 °C and then combusted in a Fisons EA-1108 CHN analyser (Triad Scientific, Inc., Manasquan, NJ, USA) [64]. Sulfanilamide was used as the standard.

2.2.5. Pseudo-nitzschia spp. Abundance

We used light microscopy (LM) counting: 250 mL of seawater were fixed with buffered formaldehyde at a final concentration of 1% and stored under dark and cool conditions. An appropriate aliquot (10, 50 mL), depending on the phytoplankton cells density, inorganic suspended material, and detritus density, was settled in a counting chamber. Total abundances of Pseudo-nitzschia spp. were enumerated while using an inverted light microscope at 250 × and 400 × magnification [65]. Pseudo-nitzschia species were separated into P. delicatissima and P. seriata complexes depending on their valve width [66].

2.2.6. Pseudo-nitzschia Species Identification

Phytoplankton samples for Pseudo-nitzschia species identification were collected in the upper 3 m (in order to amass sufficient material for the analysis and to coincide with Pseudo-nitzschia spp. LM counting) of each station during the campaigns by vertical net tows with 20 μm mesh-size plankton net. The samples were placed in dark and fixed with paraformaldeyde (to a final concentration of 1%). Scanning electron microscopy (SEM) was performed on selected samples (depending on the presence or not of Pseudo-nitzschia in the counting chambers) to identify individual Pseudo-nitzschia cells. The removal of the organic matter from the samples involved treatment with hydrogen hyperoxide and incubation at 90 °C [67]. Pseudo-nitzschia species identification was based on the descriptions by [68,69,70].

2.2.7. Particulate DA (pDA) Analysis

Particulate DA analysis was performed to triplicate sub-samples derived from seawater samples that were collected at the stations shown in Figure 1. The particulate DA retained on the Whatman GF/F 9 mm filters after the filtration of 200 mL seawater was quantified by ASP cELISA (Biosense Laboratories, Bergen, Norway). A protocol described in [33] was followed for the preparation of the seawater samples and the assay procedure. A Multiskan EX (LabSystems, Bradenton, FL, USA) microplate spectrophotometer with a 450 nm filter was used to read the absorbance of the samples. The detection limit for the ELISA assay was 1 pg DA mL−1 and for the analysis of pDA in the seawater was 0.005 ng DA L−1. The cellular DA (cDA) concentration was calculated by normalizing the pDA concentration to the abundance of Pseudo-nitzschia spp. cells that were found in the preserved samples. By pDA we mean how much total domoic acid is present, and by cellular DA (cDA) we refer to how toxic are those cells.

2.2.8. Meteorological Buoys

Meteorological data off the rias Baixas were provided by the Spanish Port System (www.puertos.es). Wind speed (W) and direction were observed at a Seawatch buoy station located off Cape Silleiro (42° 7.8′N, 9° 23.4′W). This meteorological station was selected as being representative of the study area [71]. The daily upwelling index (IW) was estimated from wind data according to [72]:
IW = −τy/(ρW·f) = −1000·ρa·CD·W·Wy/(ρW·f) (m3/(s·km))
ρa is the density of air (1.2 kg·m−3 at 15 °C), CD is an empirical dimensionless drag coefficient (1.4·10−3 according to [73]), f is the Coriolis parameter (9.9·10−5 s−1 at 42° latitude), ρW is the density of seawater (1025 kg·m−3), and W and Wy are the average daily module and northerly component of the wind, respectively.

2.3. MERIS FR Imagery

Seven full-resolution (FR) level-1b MERIS images that were acquired over the study area between 2007 and 2009 were available in this study. MERIS overpasses were within 2 h of the time that samples and data were collected in situ (Table 1). The MERIS image that was acquired on 7 July 2009 had high cloud coverage and it was removed from the analysis.
Smile correction [74] was applied to the original level-1b data in order to correct the MERIS Top of Atmosphere (TOA) reflectance for the smile distortion, i.e., small variations due to the non-constant central wavelength of a given band across the spectrometer field of view. For the atmospheric correction, the ocean colour data were processed with a neural network (NN)-based algorithm that was developed by [75]. The flags for coastline, land, clouds, and invalid reflectance were raised while using the Beam software to mask the images. Ocean colour data derived from areas significantly affected by sun glint (beyond a solar zenith angle limit of 60°) were also considered invalid and masked. The fuzzy c-mean clustering (FCM) algorithm described by [76] was applied to the MERIS images in order to obtain classification images, in which each open water pixel was assigned to the cluster with the highest value in its corresponding membership function. FCM output includes three clusters with overlapped chla ranges defining the scope of the regionally specific algorithm for chla retrieval (neural network for rias Baixas-NNRB), which was developed and hence it is only valid for one of the clusters (cluster#1, see [76]). NNRB was finally applied to obtain chla maps. Both classification images and chla maps were resampled while using the nearest neighbour method to a common grid (Mercator projection, 890 × 890 pixels) with the same spatial resolution (300 m) as the original images. Each image ranges from 42°04′ N to 42°40′ N latitude and from 8°32′ W to 9°32′ W longitude, covering approximately 3.1 × 10³ km2.

2.4. Statistical Modelling Approach

Two separate models were developed in this study, which associate Pseudo-nitzschia abundance and pDA concentration with selected environmental parameters. Since this diatom includes both toxic and non-toxic species [1], models only based on the abundance might be not always sufficient to approximate the factors related to toxigenic events. Data exploration showed considerable differences of Pseudo-nitzschia spp. density and pDA values between stations and different periods, indicating that these two factors have to be included in the models. Abundance data were analysed while using generalised additive mixed models (GAMMs) that were implemented in the mgcv R package [77]. GAMMs use additive non-parametric functions by smoothing splines to model covariate effects, while allowing correlations between the variables explicitly by adding random effects to the additive variable and they are applicable to nested data structures [78]. Poisson and negative binomial distributions were used for the model fitting of Pseudo-nitzschia abundance data, although the negative binomial model did not converge. A linear function was considered and a generalised linear mixed model (GLMM, [79]) was applied to DA concentration data. Gaussian distribution was used for DA data.
Table 2 lists available variables. A square root transformation was applied to Pseudo-nitzschia abundance and DA concentration data. Zsd, N (Total Nitrogen, the sum of NO2 and NO3), NO2, ISM, Temp, and Si(OH)4/PO43− were dropped due to the collinearity that was observed while using the variation inflation factor (VIF) that was computed using the corvif function in the AED R package [79]. DOC and pH were also removed from the statistical analysis due to an insufficient number of measurements. The final list of available environmental variables for the GAMMs included Chla, SPM, Sal, Si(OH)4, PO43−, NO3, NH4+, Si(OH)4/N, POC, and PON. Model optimization was based on finding first the optimal random structure and then selecting the optimal fixed structure. Both of the models included each station as a random effect. The final models were selected stepwise on the basis of the AIC (Akaike Information Criterion) and individual significance of explanatory variables. The F test was used to compare the nested models [80]. A multiple regression model was used for the remote sensing-based models.

3. Results

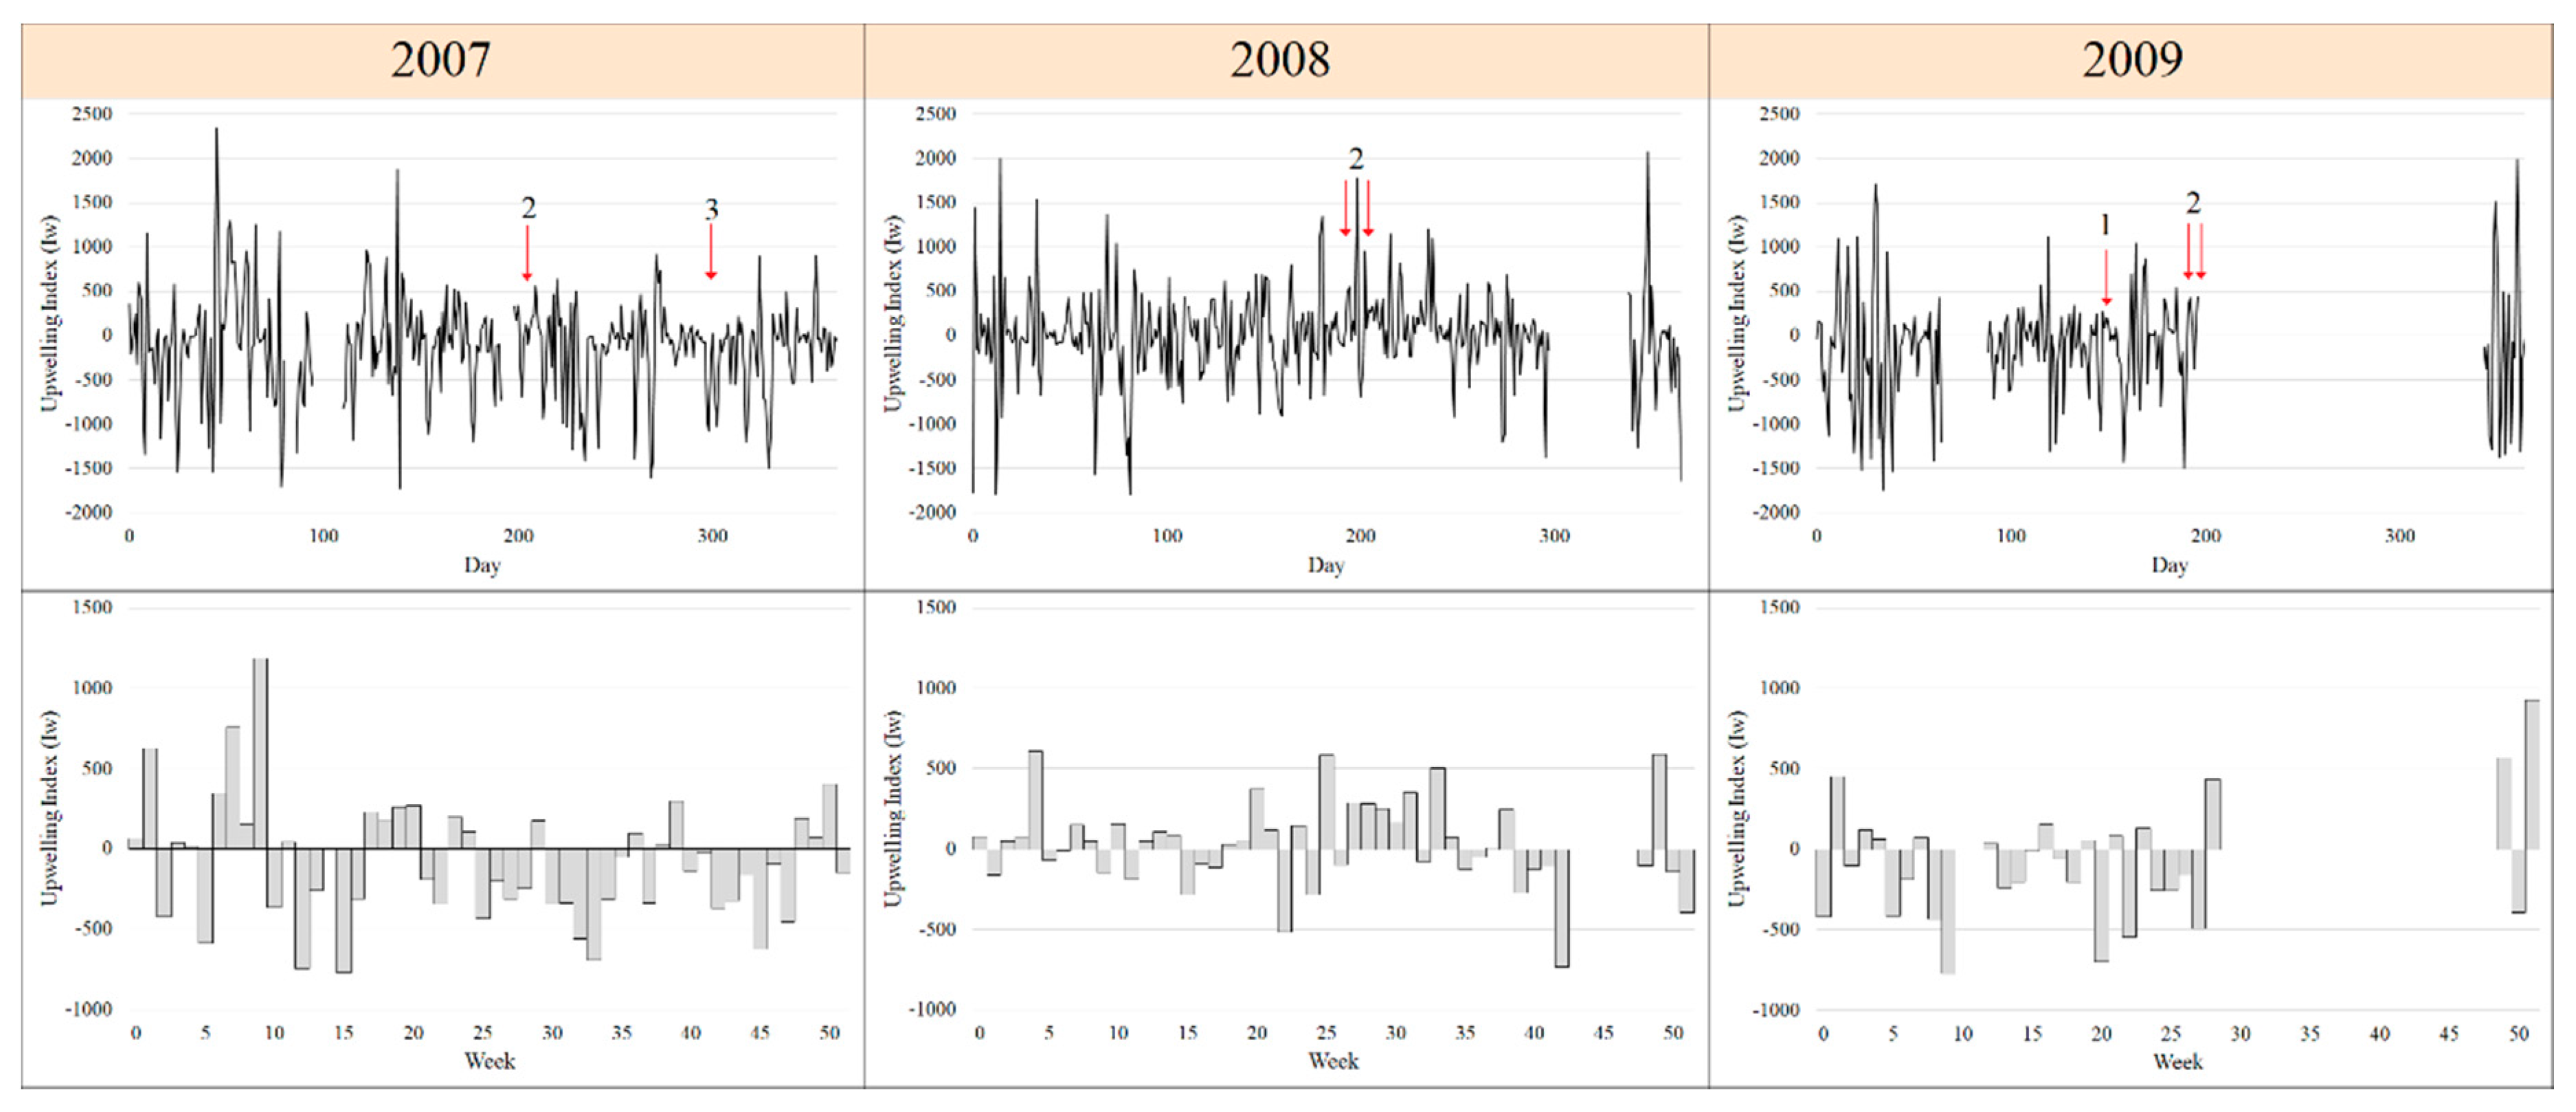
3.1. Environmental and Meteorological Conditions

Table 2 shows a list of the environmental parameters that were measured in this study and their mean values during the three periods. The surface concentration of nitrates ranged from below detection limit to 3.775 mg L−1 and nitrites from 0.005 to 0.415 mg L−1. Highest values for these two macronutrients were observed during the spring downwelling period. Orthophosphate at the sampling stations ranged from below detection limit to 0.850 mg L−1, with high concentrations in the spring downwelling period. Silicic acid concentrations were generally low. The concentration levels of ammonium in surface waters in both studied rias were generally low (below 0.023 mg L−1), although elevated ammonium concentrations were observed in the Ria de Vigo during the summer period (22 July 2008). The POC surface concentration varied between 0.13 (autumn downwelling) and 0.75 mg L−1 (summer). Higher levels of POC were observed in the summer period (22 July 2008). High concentrations of DOC were found in the autumn downwelling period in accordance with relatively high surface chla concentrations. The SPM concentrations varied from 1.17 to 3.74 mg L−1 and the chla values ranged from 0.03 to 6.25 μg L−1, with a maximum in the autumn downwelling period.
Samples from Ria de Pontevedra revealed higher concentrations of nitrate, nitrite, silicate, and orthophosphate, and the highest concentrations of the three first macronutrients were detected close to the main freshwater inputs in the ria (statistically significant at p < 0.05 for nitrite and orthophosphate). On the other hand, the ammonium and POC concentrations were generally higher in the Ria de Vigo with statistically significant differences only for ammonium. SPM concentrations showed, in general, decreasing values (in both rias) with distance from Station 1, which is located in the inner, narrow part of the rias and closer to the main freshwater inputs. In this part of the rias sediment resuspension and continental runoff is probably higher, resulting in high concentrations of SPM. ISM followed the same spatial and temporal distribution pattern as SPM. Secchi disk depths ranged from 2 m to 12 m in the Ria de Vigo and from 6 m to 11 m in the Ria de Pontevedra, generally less than half the water column depth.

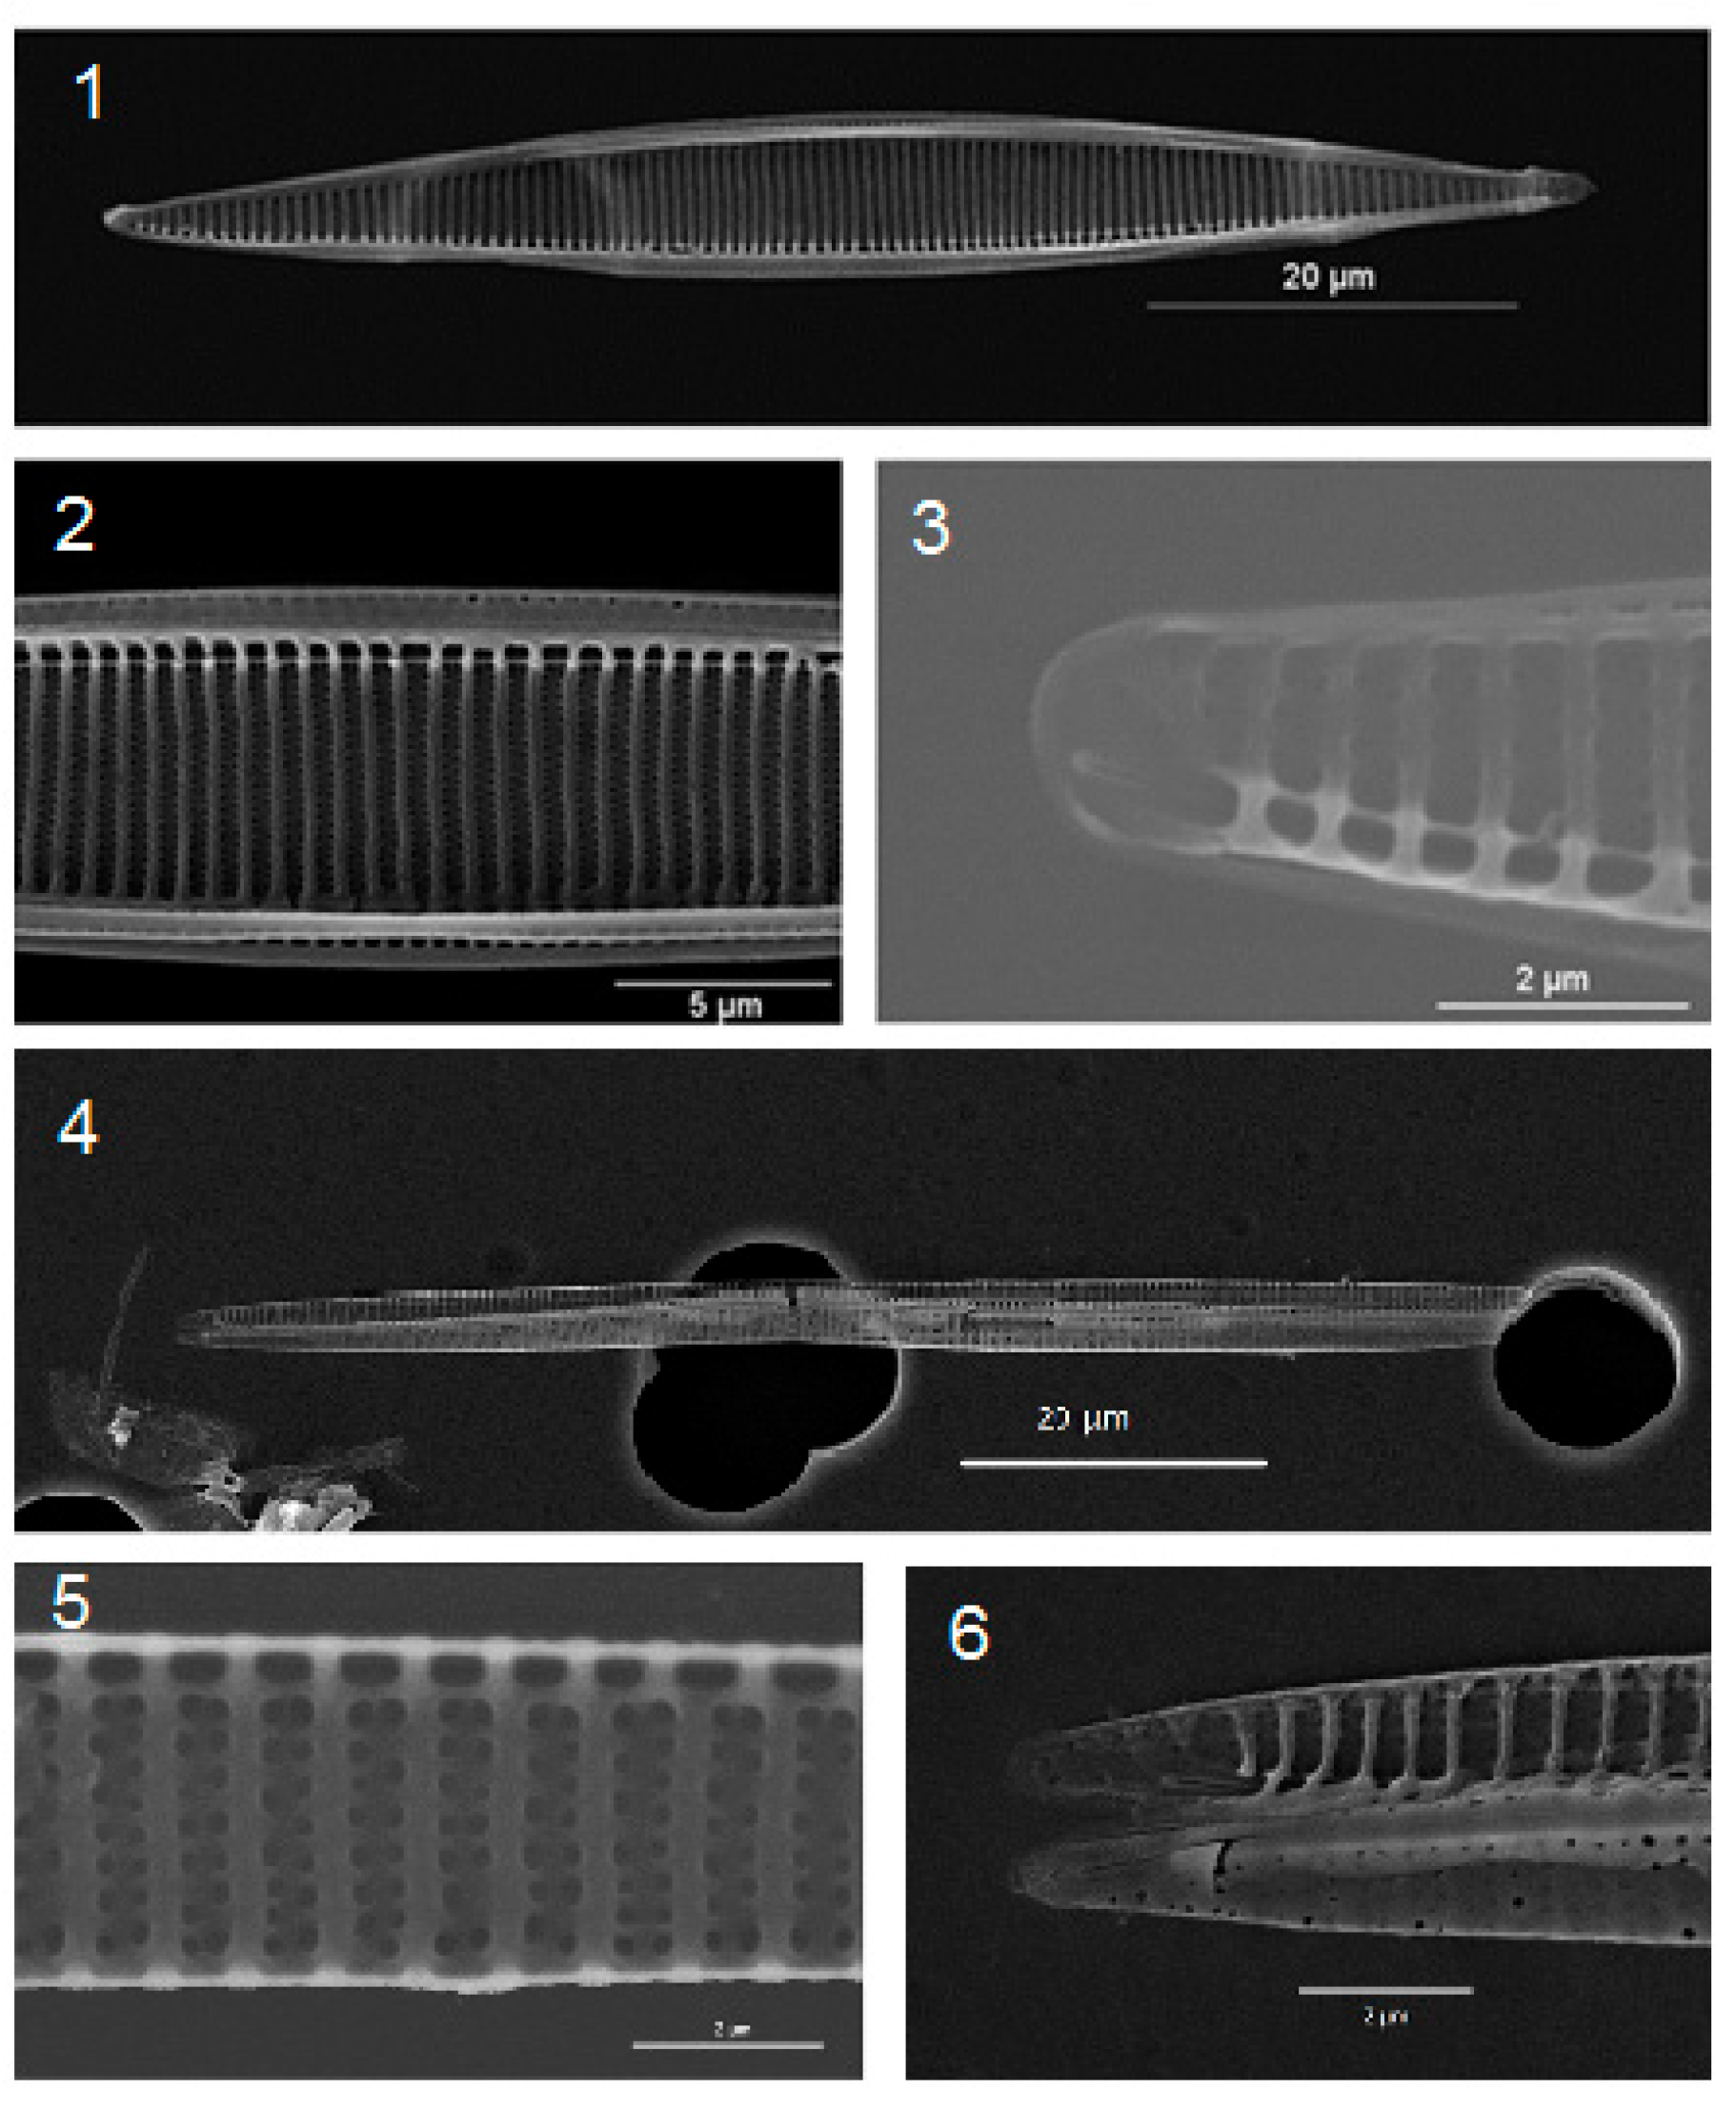
3.2. Pseudo-nitzschia Composition, Abundance, and Particulate Domoic Acid

Scanning electron microscopy observations of the phytoplankton net samples revealed the dominance of P. australis Frenguelli (Figure 3). P. pungens (Figure 3) and P. pseudodelicatissima were also found in the samples. Pseudo-nitzschia was recorded during all of the surveys carried out in the study area and it was present in all of the samples. Pseudo-nitzschia cells that belonged to the P. delicatissima complex were detected in less than one-third of the samples, mainly in lower abundances than the P. seriata complex and only when Pseudo-nitzschia species belonging to seriata complex were present.
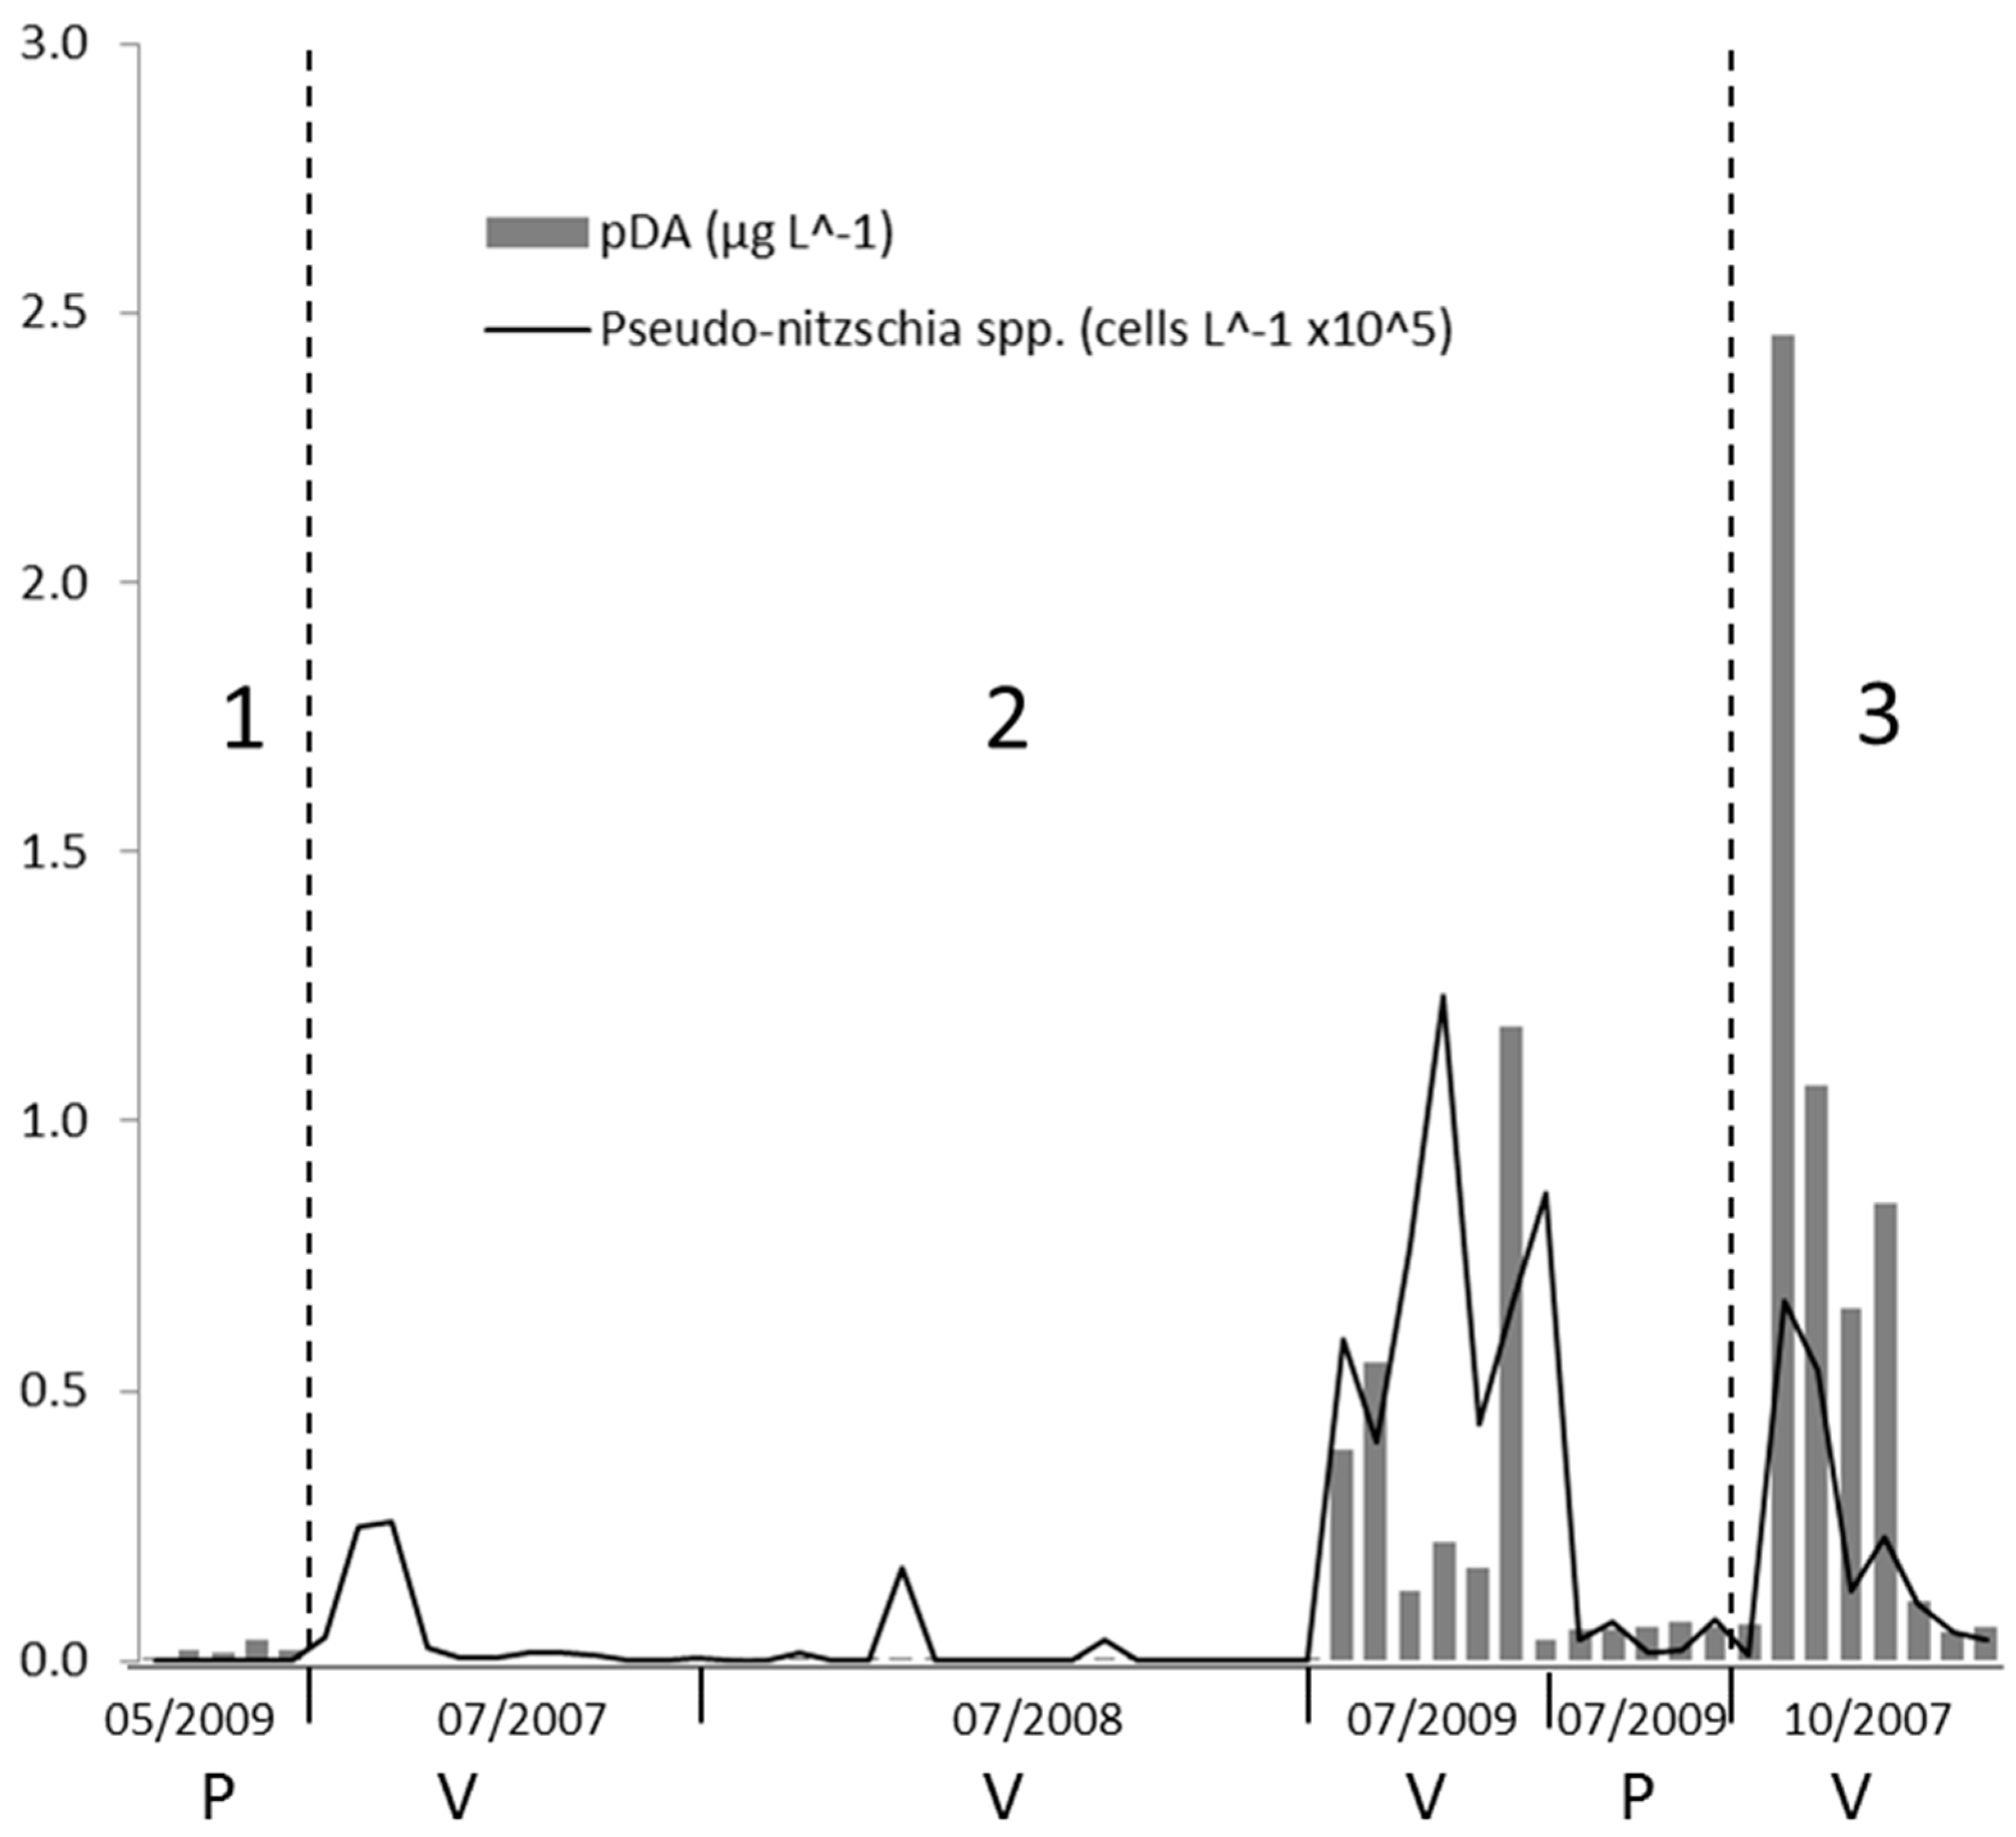
In 2008, Pseudo-nitzschia spp. were recorded at only few stations and in general with low abundances while pDA was barely detectable in most of the samples (Figure 4). Only Pseudo-nitzschia species belonging to seriata complex were detected during these campaigns.
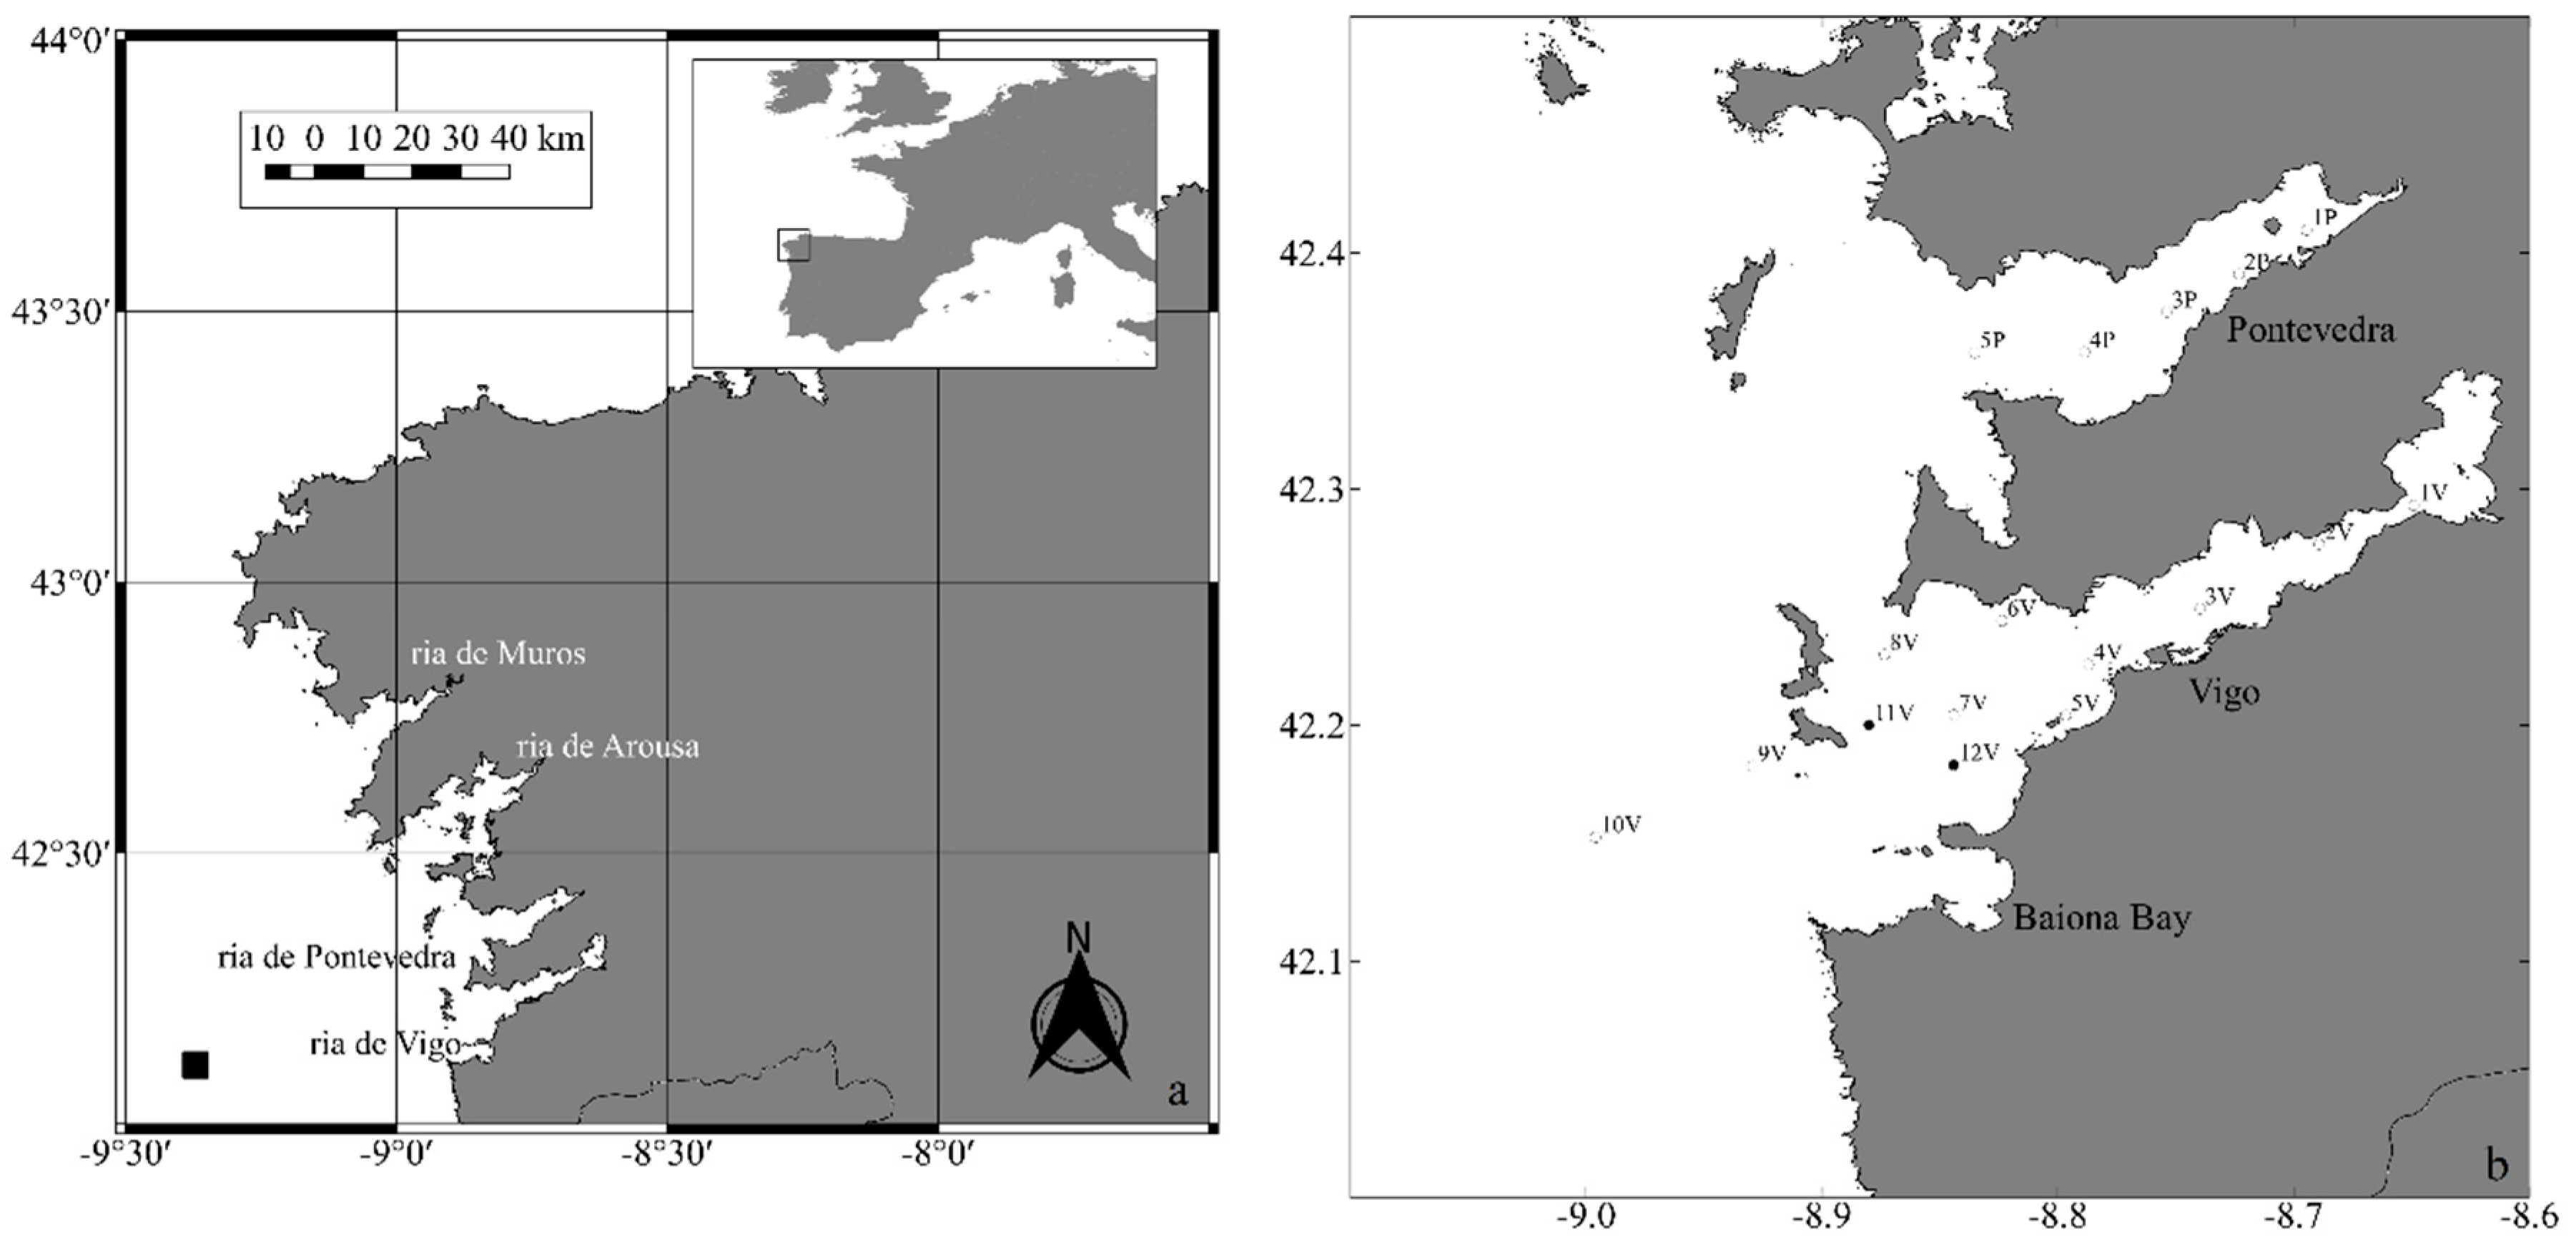
During the summer campaign in 2007, the maximum abundance of Pseudo-nitzschia spp. (> 0.44 104 cells L−1) in the Ria de Vigo was detected at the station 1, located at the innermost part of the ria.
In 2009, Pseudo-nitzschia spp. abundances in the Ria de Pontevedra averaged 80 cells L−1 on May 27 and 0.40 104 cells L−1 on July 7. pDA values in all of the samples from the Ria de Pontevedra were above the detection limit, but relatively low (0.01–0.07 μg L−1). The cellular DA levels varied from 0 to 54.31 pg DA cell−1 (Figure 4) Pseudo-nitzschia spp. abundance almost linearly decreased from the warm surface waters (around 19 °C) at the inner part of the Ria de Vigo to the colder (17 °C) more saline waters outside the ria. In order to investigate the dominant conditions during toxic blooms in more detail, the toxic Pseudo-nitzschia events have also been individually studied in Section 3.3.

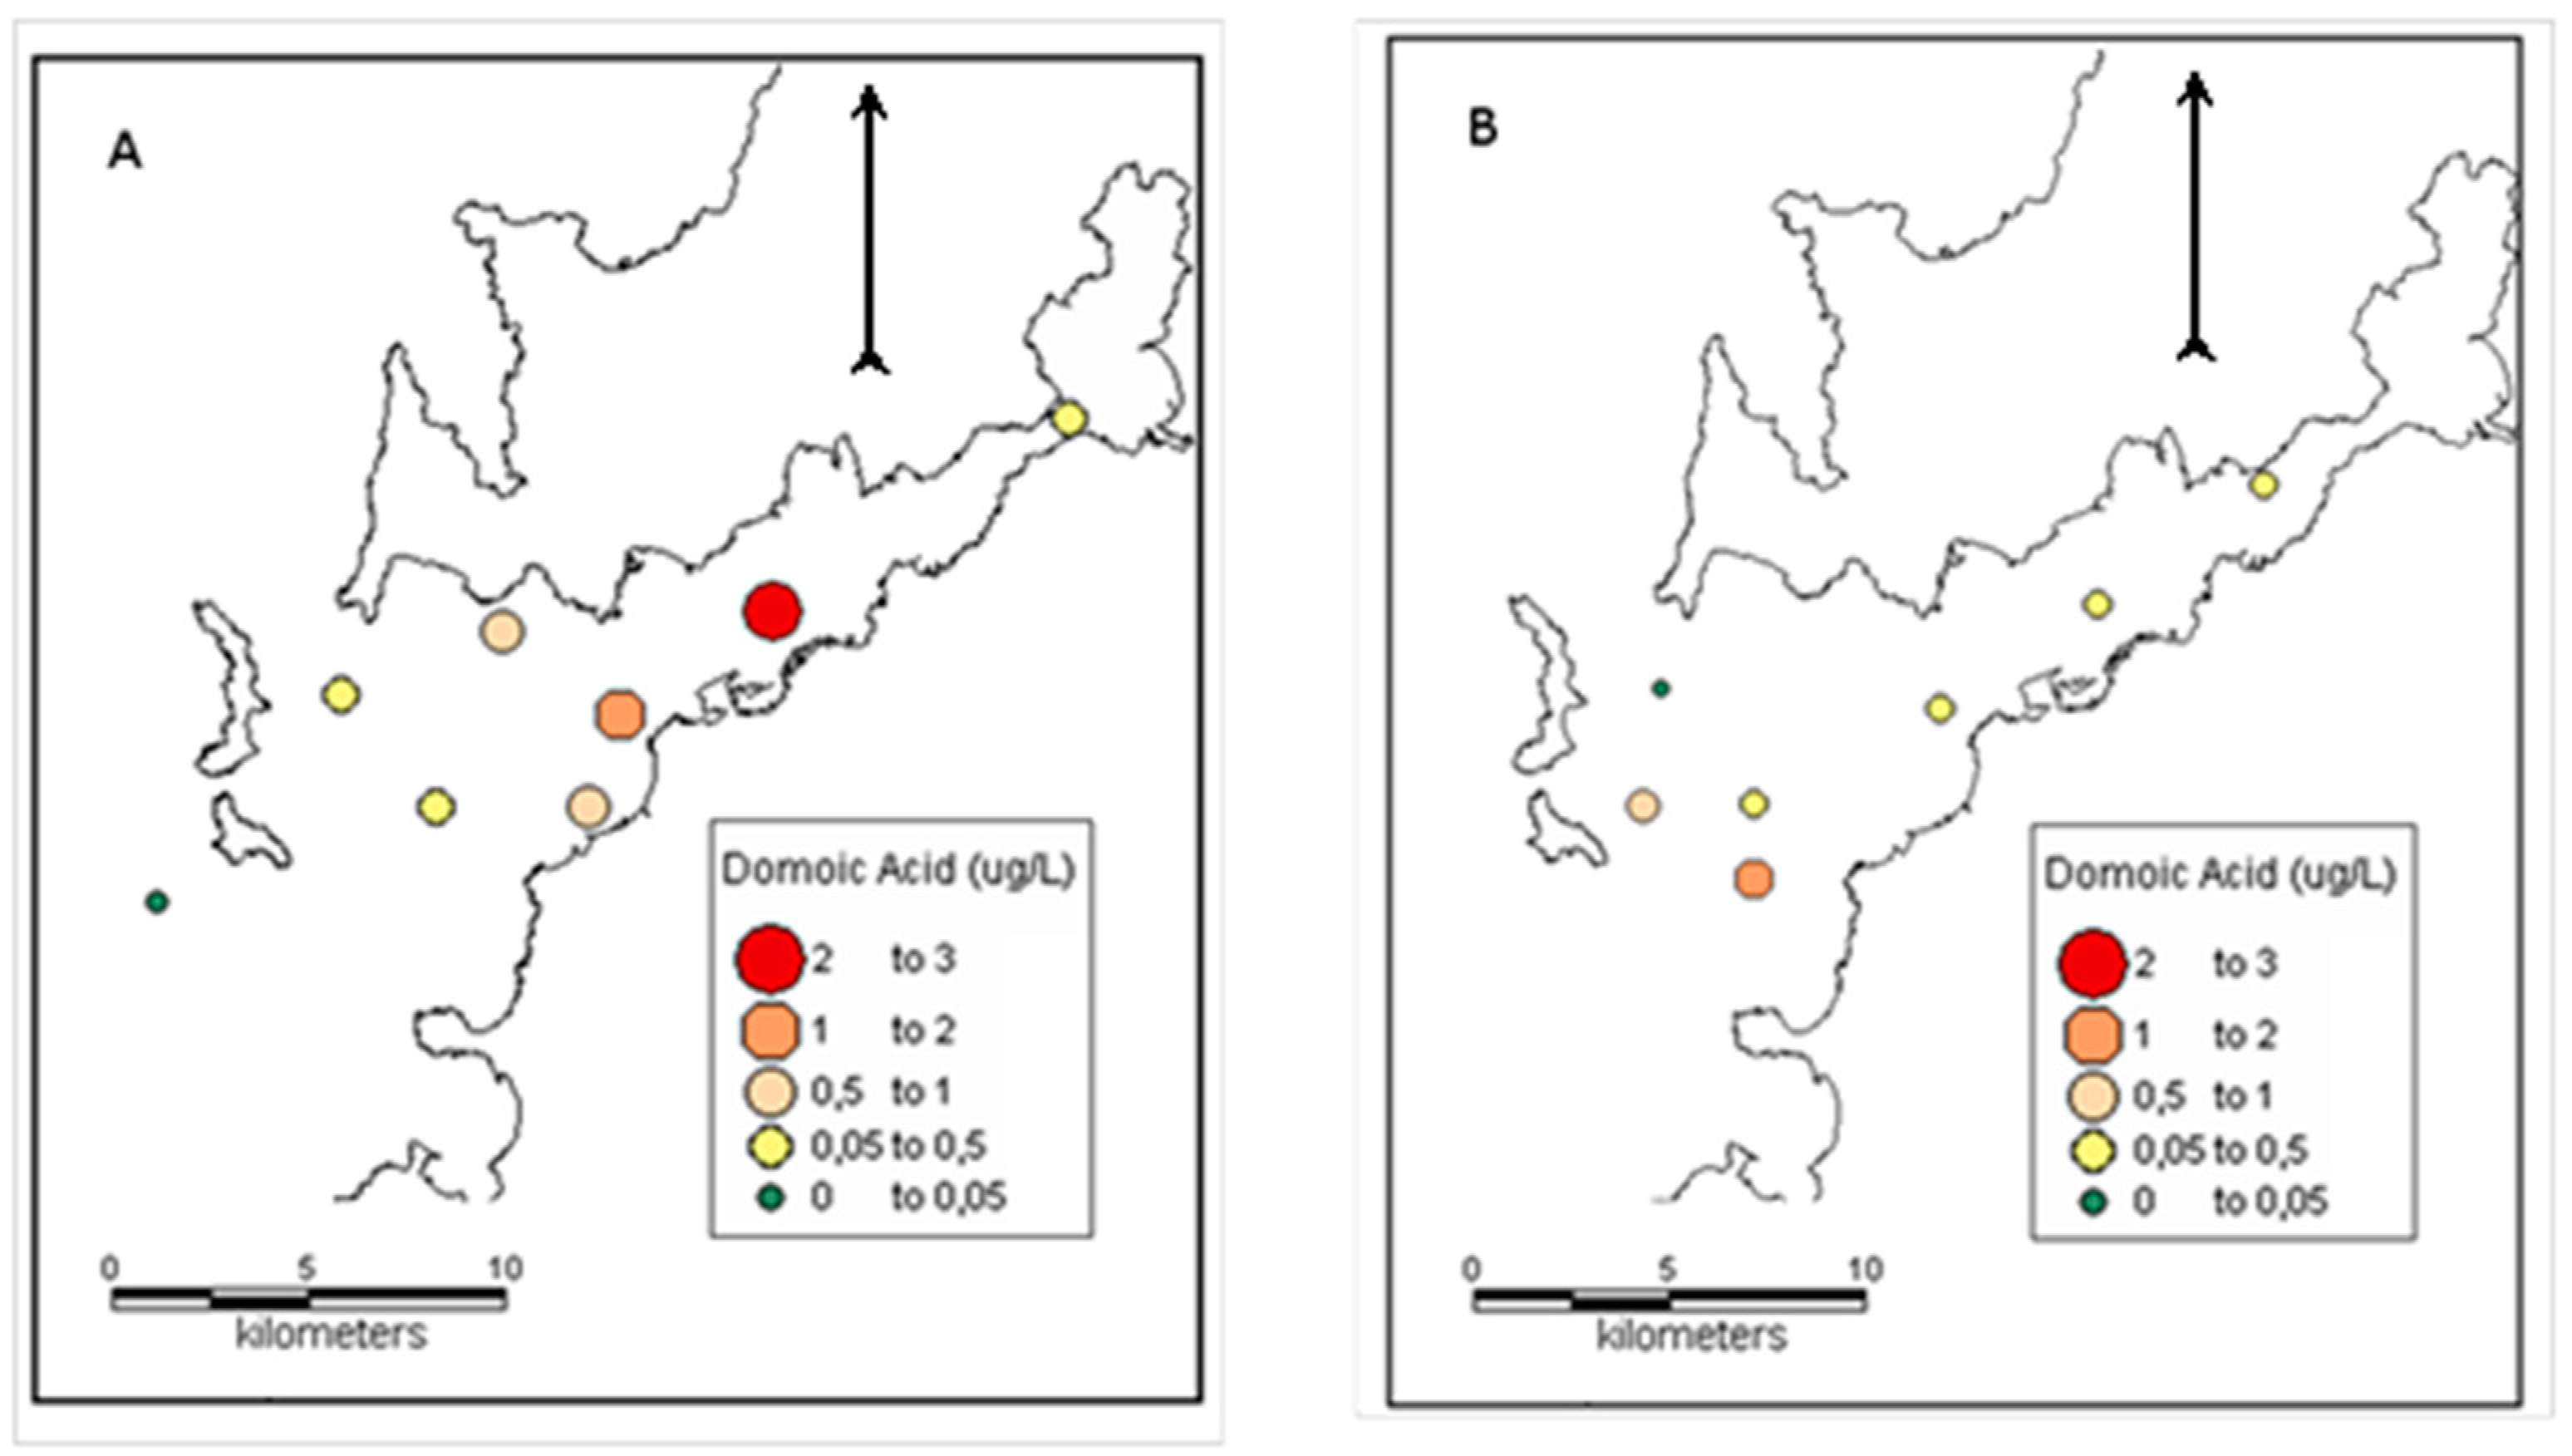
3.3. Pseudo-nitzschia Toxic Events

The first toxic event was recorded in the autumn downwelling period (19/10/2007) in the Ria de Vigo during a downwelling period. It was characterised by high abundances of Pseudo-nitzschia spp. that belonged to the seriata complex and DA concentrations up to 2.51 μg L−1. Surface pDA was detectable at all of the sites with available samples. pDA concentrations were higher than 0.50 μg L−1 throughout the middle part of the Ria de Vigo and they were still detectable, but in lower concentrations (close to 0.05 μg L−1) outside and at the inner part of the ria (Figure 5). pDA in the Ria de Vigo showed a strong positive significant relationship with Pseudo-nitzschia spp. in this dataset (Pearson’s r = 0.92, p = 0.001). Pseudo-nitzschia spp. abundances and pDA concentrations were also highly correlated with Secchi disk depth (r = −0.75), TSM (r = −0.83), POC (r = 0.87), chla (r = −0.77), and the ratios of Si(OH)4/PO43− (r = −0.72) and Si(OH)4/N (r = −0.71) (Table 3). For the same survey, mean cellular DA was 31.7, ranging between 9.5 and 70.30 pg DA cell−1. The highest cellular DA concentration was recorded at the site (V1) where the lowest Pseudo-nitzschia spp. abundance (0.1 104 cells L−1) was found.
On 14 July 2009 (summer period), a toxic event mostly due to Pseudo-nitzschia seriata complex was monitored in the Ria de Vigo. During this event, Pseudo-nitzschia spp. reached the highest abundance for the sampling period in the area (12 104 cells L−1). Pseudo-nitzschia abundance was high at all sites averaging 5.65·104 cells L−1. pDA was detectable in all of the samples and ranged between 0.04 to 1.18 μg L−1. The highest pDA concentrations were found in samples from sites close to the southern mouth of Ria de Vigo while the lowest concentration was recorded close to the northern mouth of the ria (Figure 5). The maximum pDA concentration for this sampling was measured in a sample containing 6.90·104 cells L−1 of Pseudo-nitzschia spp., while the minimum pDA concentration was found in a sample that contained the same magnitude of Pseudo-nitzschia spp. (5.62·104 cells L−1). Cellular DA concentrations averaged 14.20 pg DA cell−1, showing a wide range of values (0.70–58.62 pg DA cell−1). There was no significant correlation (Pearson’s test) between Pseudo-nitzschia spp., DA concentration and cellular DA concentration for this sampling. Pseudo-nitzschia spp. abundance was positively correlated to the Si(OH)4/N ratio (r = 0.75, p = 0.05), while a strong relationship was revealed between the cellular DA concentration and N (r = 0.96) and Si(OH)4/N (r = −0.92) (Table 3).

3.4. Remote Sensing Detection

The FCM clustering method was applied in available MERIS FR images to build classification images defining the scope of the regionally specific algorithm for chla retrieval (NNRB). These images revealed large areas where Cluster#1 is dominant, and therefore NNRB could be applied to obtain reliable results of chla concentration. Table 4 shows the percentage of pixels that belong to each cluster for each image over the Ria de Vigo and Ria de Pontevedra. Cluster#1 was dominant in both rias, averaging almost 92% of the pixels in the six images, while Cluster#2 and Cluster#3 were assigned to an average of 7.9% and 0.3% of the pixels, respectively.
In most of the images, Cluster#1 is dominant, allowing for the chla mapping over large areas. Only on 14 July 2009, the relatively high percentage of pixels belonging to Cluster#2 in combination with the cloud cover averted a reliable continuous chla mapping of the rias.
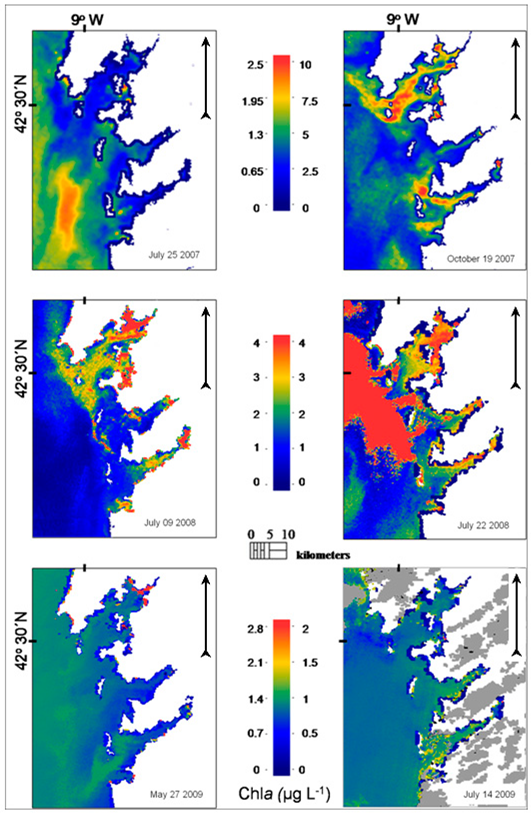
Spatial distribution of phytoplankton biomass in the study area was analysed from the available MERIS FR images while using the NNRB chla algorithm, showing heterogeneous results (Figure 6). Elevated chla concentrations in the shallow innermost parts of the rias observed in some images are most likely due to the high abundances of macroalgae on the remote sensing signal since in-situ measurements showed generally lower values.
On 25 July 2007, MERIS NNRB surface chla concentrations were relatively low (<1 μg L−1) in most parts of the Ria de Vigo and Ria de Pontevedra. An area of chla concentrations close to 2.5 μg L−1 was mapped in the area off the external coast of the rias. Generally, surface chla concentration was higher in offshore areas, where the lowest concentrations of Pseudo-nitzschia spp. were found.
Maximum MERIS NNRB chla concentrations were observed on 19 October 2007 coinciding with the first toxic event recorded during the sampling period and related to the presence of Pseudo-nitzschia spp. in the Ria de Vigo. In fact, the chla map shows high biomass “patches” clearly defined in this ria, i.e., zones of elevated chla concentrations (up to 10 μg L−1) at the middle part, just where the highest Pseudo-nitzschia spp. concentrations were measured, and also close to the northern and southern mouths. In the Ria de Pontevedra, the chla concentration was significantly lower in comparison with the concentrations observed in the Ria de Vigo and the Ria de Arousa. Areas of relatively high chla concentrations were noted in the adjacent area of the rias.
In the next MERIS image, which was acquired on 9 July 2008, a different chla distribution pattern is observed: the phytoplankton biomass is principally confined in the rias, while in the area off the rias the chla concentration remained at levels close to 0 μg L−1.
On 22 July 2008, high chla concentrations were mapped in the neighbouring shelf area. High concentrations were also extended to the outside part of Ria de Arousa and Ria de Pontevedra. The chla that was retrieved by NNRB in the Ria de Vigo showed wider variation than the concentrations measured in situ. During July 2008 Pseudo-nitzschia abundances remained at low levels.
On 27 May 2009, concentrations of chla lower than 1 μg L−1 were mainly noted in the three southern rias, while NNRB estimates were above this value off the rias. Low chla concentrations close to or lower than 1 μg L−1 were also observed both on the adjacent continental shelf and inside the rias on 14 July 2009.
The results of the multiple regression indicated that spectral reflectance in MERIS bands centred around 510 (Rrs_510), 560 (Rrs_560) and 620 (Rrs_620) nm explain 73% of the pDA variance (R2 = 0.73, F(2,32) = 32.26, p < 0.001). It was found that Rrs_510 significantly predicted pDA (β = 0.31, p < 0.001), as did Rrs_560 (β = −1.56, p < 0.01) and Rrs_620 (β = 3.24, p < 0.001).

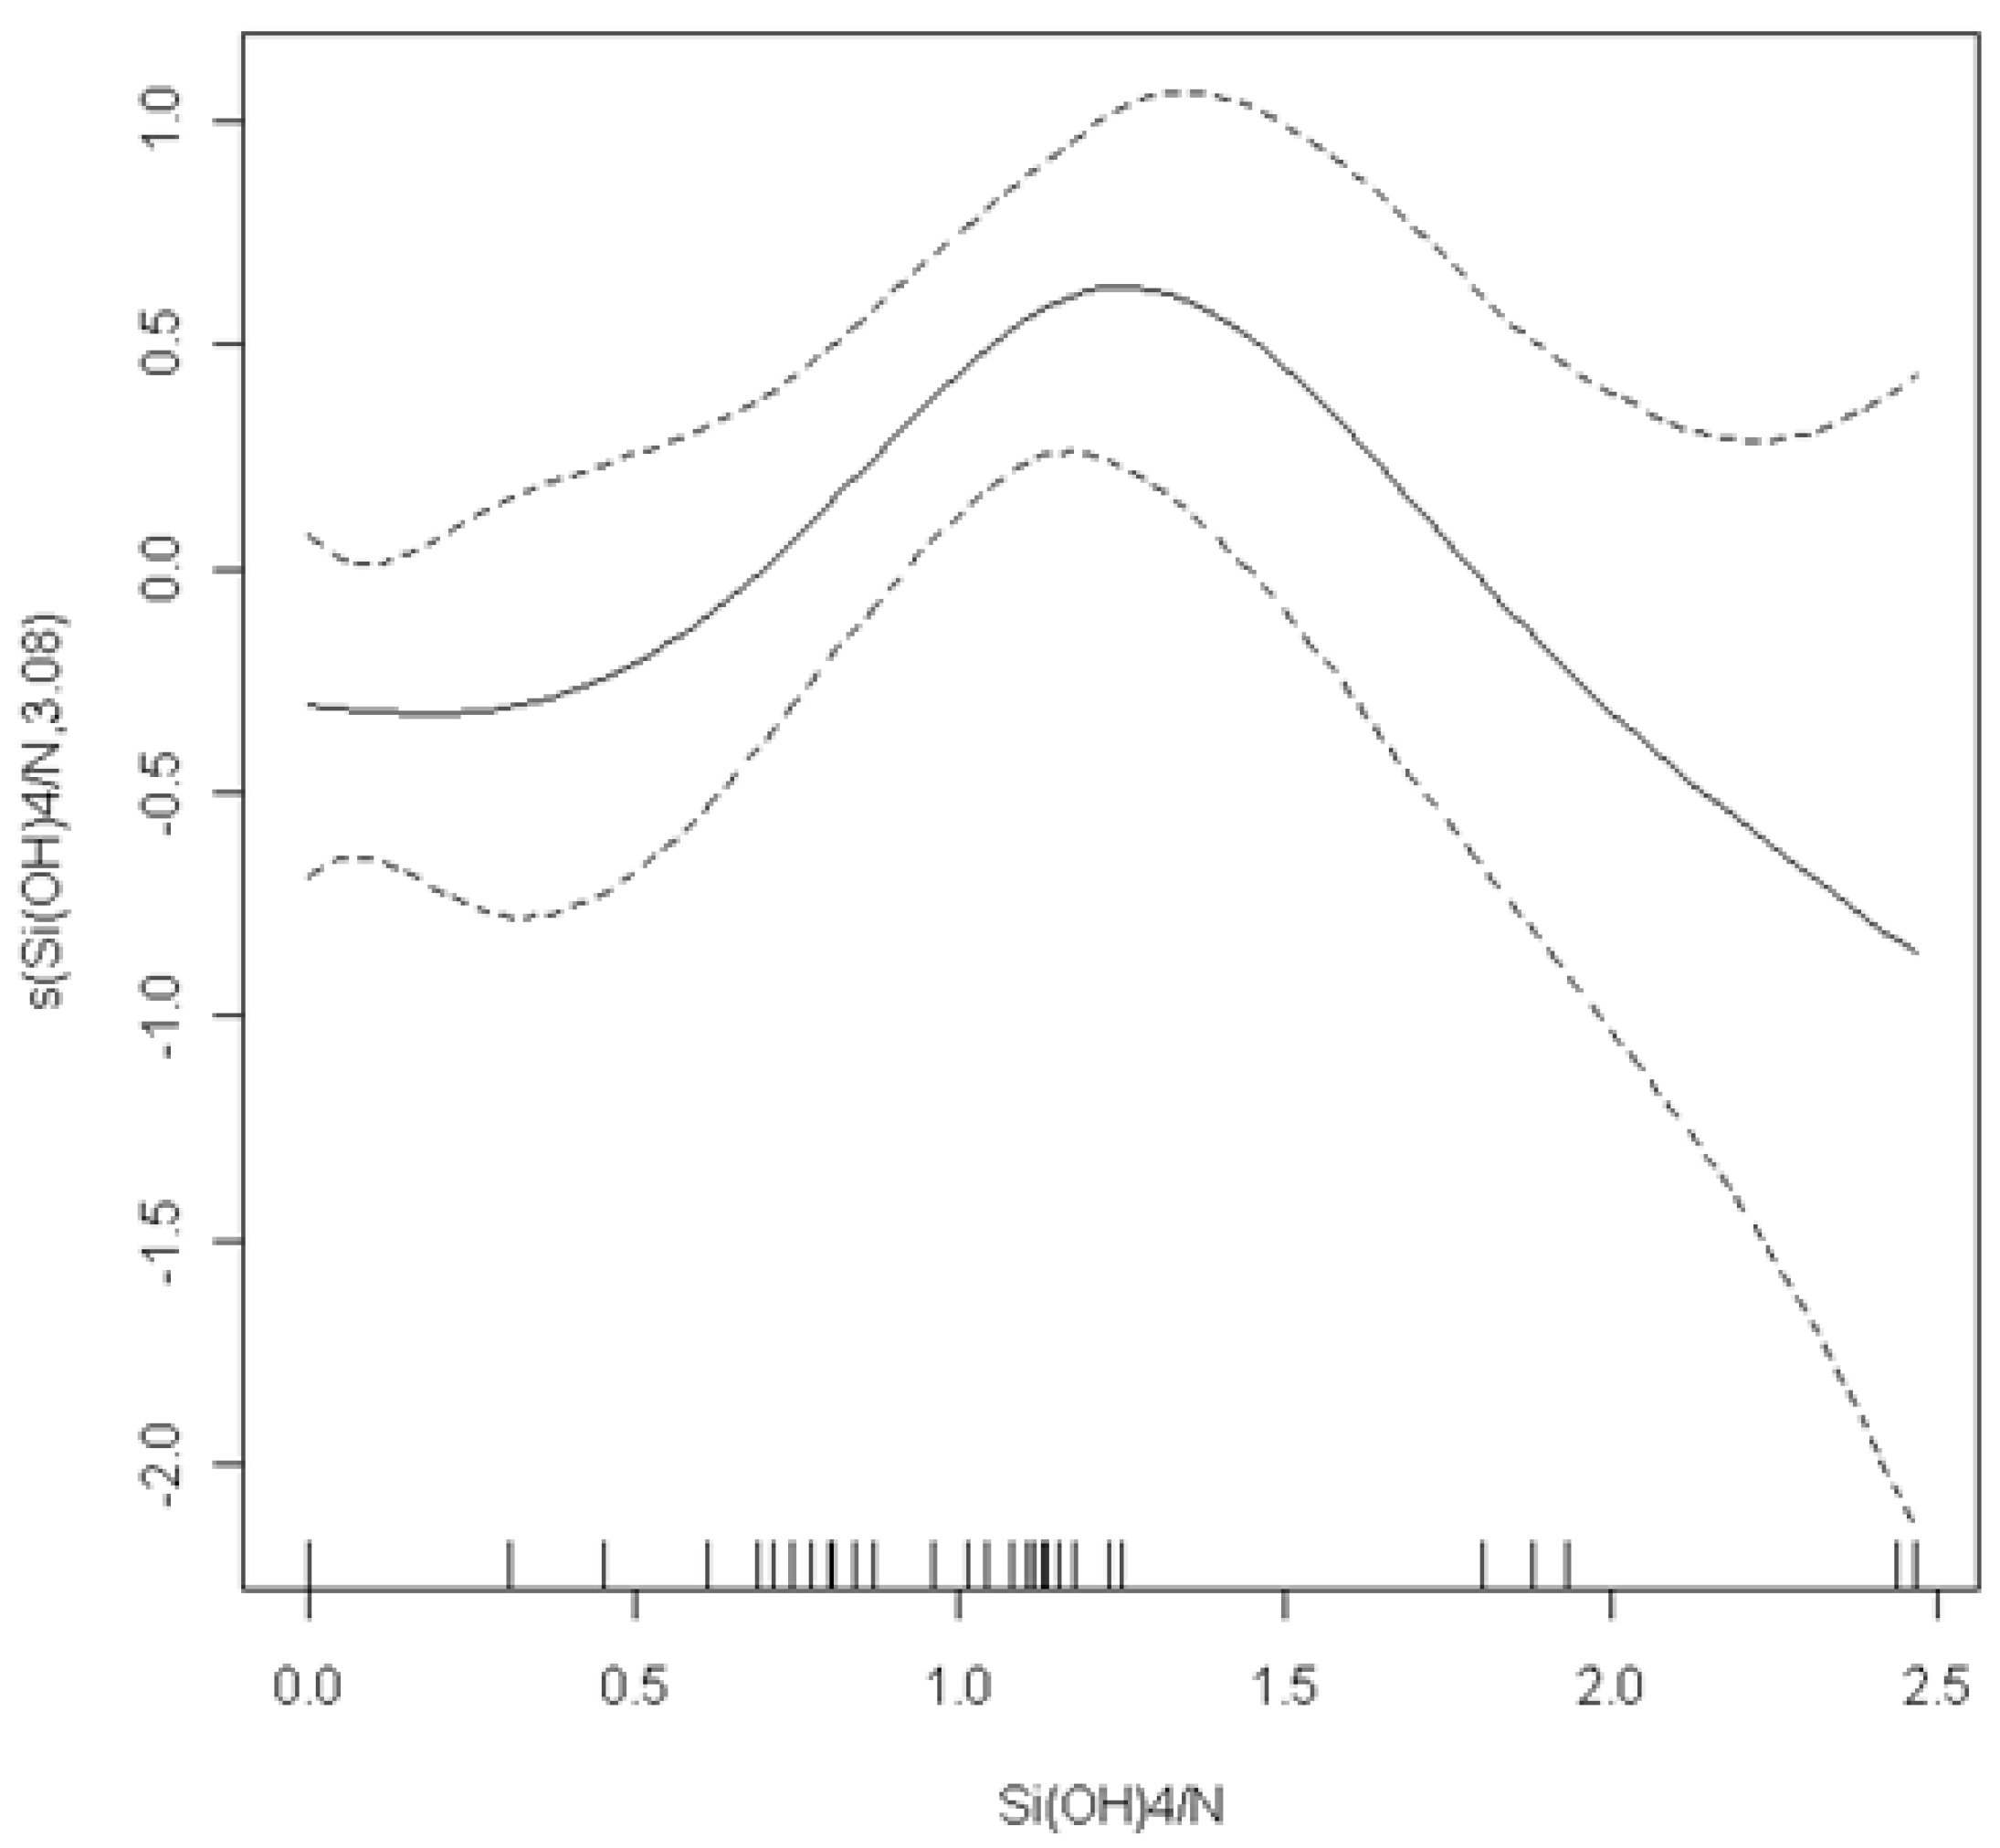
3.5. Model Results of Pseudo-nitzschia spp. and pDA as a Function of Biotic and Abiotic Parameters

The results of generalised additive mixed models (GAMMs), which were used to model Pseudo-nitzschia abundances in response to biotic and abiotic parameters, are summarised in Table 5. The GAMMs results show a significant (p < 0.005) linear relation of salinity and chla with Pseudo-nitzschia abundance. The optimal model fitted the ratio Si(OH)4/N in an additive way (p = 0.02). The cross-validation estimated the degrees of freedom for this function to be 3.08. The smoothing curve that is shown in Figure 7 suggests a peak of Pseudo-nitzschia spp. abundance in moderate values of the Si(OH)4/N ratio (close to 1.7) and an almost linear decrease for higher values. From all of the explanatory variables that were tested to model the pDA concentration, the final GLMM model included POC (p = 0.02), NO3 (p = 0.03), PO43− (p = 0.004), and Si(OH)4/N (p = 0.02). Parameters estimates with SE and t-values for the linear covariates are given in the Table 6. Examination of the residuals did not indicate patterns.

4. Discussion

4.1. Pseudo-nitzschia Abundance and Species

Pseudo-nitzschia spp. were revealed to be a common component of the phytoplankton assemblages during the summer period in the study area, since they were recorded in the samples from all summer surveys. Concomitantly, in their review on HABs in upwelling areas, Trainer et al. [26] reached a similar conclusion that Pseudo-nitzschia spp. are present in the Galician rias mainly during late spring-summer. Nevertheless, we recorded an autumn-time high abundance event in the Ria de Vigo. The Pseudo-nitzschia assemblages during our study mostly contained Pseudo-nitzschia species belonging to the seriata complex. Pseudo-nitzschia species belonging to the delicatissima complex were also present in some samples and always along with Pseudo-nitzschia seriata complex species. P. australis was identified as the dominant species in the net (selected) samples that were examined by electron microscopy. However, field samples from both rias contained P. delicatissima and P. pungens cells. The latter species is an important part of the phytoplankton community in the Ria de Pontevedra during late winter and summer upwelling/downwelling conditions [81].

4.2. Domoic Acid

The present study provides DA concentrations from natural phytoplankton populations in the Galician rias. The results of this survey show that relatively high Pseudo-nitzschia spp. abundances and DA concentrations can be distributed throughout the surface waters of Ria de Vigo. Overall, pDA was detected in more than half of the samples that were obtained during the surveys (2007–2009) and relatively high values of pDA and cDA were found. In our data, pDA ranged from below detection limits to 2.51 μg L−1. Similar pDA levels have been measured in the surface waters in other coastal upwelling areas around the world, where P. australis was the dominant Pseudo-nitzschia species during the blooms [27,82,83,84]. For example, the same magnitude of Pseudo-nitzschia abundance (7 104 cells L−1) that gave us the maximum pDA concentration (2.51 μg L−1) was detected in San Diego (USA), where the pDA levels reached 2.3 μg L−1 [82]. Cellular DA in the field samples varied between 0 and 70.30 pg DA cell−1. We are not aware of other measurements of cellular DA content in field populations from the Iberian upwelling system. Several studies along the West coast of USA have recorded analogous ranges of cellular DA during harmful events, which were mainly due to P. australis (7–75 pg DA cell−1: [85]; 0.1–78: [36]; 5–43 pg DA cell−1: [82]; 0.14–2.1 pg DA cell−1: [9]; and, 0–117 pg DA cell−1: [27]). From the two toxic Pseudo-nitzschia events recorded in our study, cDA was higher in the Ria de Vigo on the 19 October 2007. According to the data from INTECMAR (www.intecmar.gal), Pseudo-nitzschia population in this ria was in the declining phase. This is consistent with numerous (e.g., [86]) reports of increased cDA at the late stages of the population. The second toxic event found the Pseudo-nitzschia close to the peak of abundance.

4.3. Pseudo-nitzschia spp. Toxic Events in the Study Area and ASP Implications

In our study, the first toxic event in the Ria de Vigo was recorded on 19 October 2007. It was characterised by high pDA concentrations due to moderate abundances of Pseudo-nitzschia. It is worth mentioning that high Pseudo-nitzschia spp. abundances have been previously observed in the Galician rias during autumn causing the closure of the mussel harvesting beds [12].
In our data, a second DA episode due to Pseudo-nitzschia spp. was recorded in the Ria de Vigo on 14 July 2009, but showing lower pDA concentrations. INTECMAR also found high Pseudo-nitzschia spp. abundances (over 105 cells/L) in the rias during the last three weeks of July 2009, although closures of mussel rafts polygons were mainly associated with the presence of DSP (Diarrheic Shellfish Poisoning), while DA data were not available.
In the same year, Pazos and Moroño [87] observed very high abundances of P. australis in May in the Rias de Vigo and Pontevedra over a week. Raft mussels and natural shellfish beds closures due to ASP (Amnesic Shellfish Poisoning) were reported in Rias of Pontevedra and Vigo from late March to early April, whereas DA was found above the regulatory levels in scallops (Pecten maximus) during the whole 2009 as well as 2007 [88,89].
In the situations that are described above, it seems that, even if we detected high concentrations of pDA (up to 2.51 μg L−1) in our survey in 2007, DA in mussels was below regulatory levels during the whole year. Likewise, in 2009, despite the high pDA detected during our campaigns, DA was not taken up by the suspended mussel raft cultures. A possible explanation for this could be either rapid depuration or the result of food selection or dilution [90,91,92,93]. Another factor that might be associated with the observed situation, where mussels do not seem to take up the DA, despite the high pDA concentrations, is the possible short-term duration of these harmful events. Spyrakos et al. [53] describe using remote sensing data important changes on phytoplankton biomass in the rias within three days and highlight the challenges for the detection and monitoring of harmful algal events in a physically complex system, such as the Galician rias. Nonetheless, even these short-term high DA events, if they are recurrent, can pose a significant threat to the harvesting of species that show slow DA depuration rates, like scallops [94,95].
Diaz et al. [96] analysed phytoplankton and mussel samples that were collected from the Ria de Pontevedra from 28 May to 7 June 2007, and despite the high abundances of Pseudo-nitzschia spp. (higher than 5 105 cells L−1) with the dominance of P. australis were observed, DA analysis using HPLC-UV methods did not reveal any detectable concentrations in the seawater or above regulatory levels in mussels. Discrepancies that were observed in our DA data in comparison to those by [95] and INTECMAR could be also due to the different methods, followed by the quantification of DA. ELISA methods have shown more sensitive detection limits for DA than HPLC-UV based methods and appear to perform better in the formalin-fixed samples [97,98]. However, overestimation has been observed in some cases [49] while using ELISA in the quantification of DA. This overestimation was attributed to the detection by the antibodies of domoic acid isomers in addition to the domoic acid and epi-domoic acid.

4.4. Environmental Conditions Associated with Pseudo-nitzschia spp. Abundance and DA Concentration

This study attempts to provide insight on the environmental conditions that are associated to the occurrence of toxic Pseudo-nitzschia spp. events in the surface waters of two Galician rias. González Vilas et al. [14] while using a larger database of Pseudo-nitzschia spp. abundances, but with limited environmental factors discussing possible processes related to high abundances of these diatoms in the area. Here we attempt to get a better understanding on the relationships between the measured parameters and the toxic Pseudo-nitzschia events, which may be essential for future monitoring and prediction efforts. Due to considerable differences in the Pseudo-nitzschia spp. abundance and pDA concentration among the three different periods of dominant meteorological conditions off the rias, these periods were included in the models as a variable. The results show that there is higher probability of high Pseudo-nitzschia spp. abundance and pDA in the summer period (summer upwelling-downwelling cycle) and the autumn downwelling period (autumn strong downwelling) (Table 5 and Table 6). These results are consistent with previous studies on Pseudo-nitzschia spp. abundance in upwelling systems [99].
Results of GAMMs for Pseudo-nitzschia spp. revealed a significant linear effect (refers to statistical relationships and not biogeochemical processes) of salinity, chla, and the additive effect of the Si(OH)4 to N ratio. The preference of Pseudo-nitzschia spp. for higher values of salinity found in our dataset confirms previous observations on Pseudo-nitzschia spp. in coastal waters of Galicia. For example, [100] analysed time series of Pseudo-nitzschia spp. abundance between 1999 and 2000 and concluded that Pseudo-nitzschia spp. blooms were mainly recorded in high salinity values (> 35). Salinity has been suggested as an important regulator of specific Pseudo-nitzschia species or Pseudo-nitzschia spp. abundance in other observational studies around the world (e.g., Adriatic Sea: [41]; West Coast of USA: [26]; Gulf of Mexico: [29]; and, Sea of Marmara: [23]).
The final GAMM fitted to the Pseudo-nitzschia spp. abundance includes linear relationship with chla. [8,36,37] pointed out that there is higher probability for Pseudo-nitzschia spp. blooms when chla concentration is high. The trend observed during the sampling period of higher Pseudo-nitzschia spp. abundances with high chla concentrations can be valuable in the remote sensing detection of high biomass “patches” in the Galician rias.
According to GAMM results, Pseudo-nitzschia spp. abundance increases until a maximum value at moderate values of the ratio of Si(OH)4 to N (mainly NO3), followed by a sharp decline at higher values. These results suggest that lower, but not the lowest, ratio values favour higher Pseudo-nitzschia spp. abundances. The results support the consideration that silicate and inorganic nitrogen are limiting factors for the growth of several Pseudo-nitzschia species [9,27,28,29,30,31,39,86]. Schnetzer et al. [27] also suggested that the observed decline of Si concentrations when the Pseudo-nitzschia spp. abundances are high could be explained by the fact that samplings can occur after the growth of Pseudo-nitzschia, and hence Si has been drawn down.
Nutrient availability at the end of the blooms has been suggested as possible factor that is implicated in the appearance of toxic Pseudo-nitzschia spp. events in the Galician rias [26,101]. However, the environmental conditions that are related to the pDA occurrence and distribution in the area are poorly defined. The GLMM identified POC, NO3, PO43−, and Si(OH)4/N as significant factors that influence pDA concentration. The enhancement of higher pDA concentrations by low Si(OH)4/N observed in our data are consistent with the results that were reported in [9] in the Santa Barbara Channel, California, and in other field studies in which DA seems to be associated with Si-limitation [7].
Moreover, our results (Table 6) showed that the PO43− and NO3 concentrations have a significant effect on the pDA in the surface seawater. The relationship between DA production by several Pseudo-nitzschia species and the availability of these two macronutrients has been studied in several laboratory experiments [30,31,33,102,103]. In some of these laboratory studies, PO43−-limitation and N-sufficiency (since DA is an amino-acid) have been pointed out as the driving factors for DA production. Contradictorily, in our study, moderate-high pDA values were found in relatively high PO43− and low NO3 concentrations. This is possibly implicating the necessity to consider other environmental conditions, which might be responsible for the production of DA, as it is also suggested by field studies [7,104,105].
The final GAMM fitted to the Pseudo-nitzschia spp. abundance includes the linear effect of chla. This probably reflects a dominance or co-dominance of Pseudo-nitzschia spp. in the phytoplankton community. Several studies [8,36,37] suggest a relationship between high chla concentrations and the occurrence of Pseudo-nitzschia spp. blooms.

5. Summary & Concluding Remarks

Domoic acid (DA) was measured in the seawater samples from the Galician rias and revealed the presence of high levels in several cases. DA concentrations were not always related to Pseudo-nitzschia abundances, showing that cell counts are not enough for assessing the toxicity of Pseudo-nitzschia occurrence in the area. Despite the fact that no serious illnesses that were caused by ASP were reported in the area (Intecmar, Ministerio de Sanidad y Consumo) during the study period, DA levels, such as the ones detected here, could have the potential for significant impacts on the ecosystem and human health (e.g., by chronic exposure to moderate toxin levels, as it is mentioned by [106] and [107]). Furthermore, the DA content in some potential vectors that can be consumed by humans and other marine animals has not been studied in the Galician rias.
In this study, mixed effect modelling was used to associate several environmental factors with the toxic Pseudo-nitzschia events for three different seasonal upwelling-downwelling conditions. The major aspects of phytoplankton succession in the area are relatively well known, in terms of major groups (diatoms, dinoflagellates, flagellates). Here, we intended to obtain to a finer degree of resolution, focusing in a particular group of diatoms. The results show that higher salinity values and lower, but not the lowest, Si(OH)4/N ratios favour higher Pseudo-nitzschia spp. abundances. High pDA values seem to be associated with relatively high PO43−, low NO3 concentrations, and low Si(OH)4/N. Knowledge of these relationships could help in evaluating the potential impacts of the blooms due to Pseudo-nitzschia on mariculture and wildlife, and improve our ability to predict toxic events as a function of environmental parameters.
The relationships that were found by the models only apply to the study area and the data that were collected during this period. Longer time-series from a wider area, samples from discrete depths, and micronutrients data could offer more detailed insight regarding the occurrence of toxic Pseudo-nitzschia spp. events. Nevertheless, this study documents the presence of toxigenic Pseudo-nitzschia and suggests that the monitoring of DA in the natural populations of Pseudo-nitzschia could be useful for identifying potential risks for DA contamination into higher trophic levels. Further research is also needed in the pathways of DA to highler trophic levels and examination of the relationships between Pseudo-nitzschia spp. blooms in the area and closures of mussel farms due to DA.
In this study, chla is retrieved from MERIS FR data while using a regional algorithm previously developed [75]. A part of the chla data from the surveys described here has been used for the development of this regional neural network-based algorithm, which has been shown to permit the accurate mapping of chla of the rias [53]. In our MERIS imagery set, Cluster#1 was dominant in the three rias and the adjacent area allowing for reliable chla mapping over the area. The autumn-time DA event was characterised by high chla concentrations. The highest Pseudo-nitzschia spp. abundances (3 to 6 104 cells L−1) were found in a relatively small area in the Ria de Vigo where elevated surface chla concentration (>6 mg m−3) was mapped from the MERIS FR data. These small areas of high chla concentration accompanied with moderate abundances of toxic Pseudo-nitzschia spp. can be easily missed by conventional monitoring techniques. The MERIS FR and MODIS (not shown here) images from the extended area of the Iberian Peninsula show very high chla concentrations, coupled with colder waters along the Portuguese and Galician coast indicating a general high biomass event.
Moreover, our results show “patchiness” in the spatial distribution of Pseudo-nitzschia in this coastal upwelling system, which suggests that the spatial and temporal resolution for the monitoring of these events should be increased. Ocean colour techniques can be helpful in tracking potentially harmful events that are caused by Pseudo-nitzschia and complement monitoring programs based on direct observations at fixed stations. Satellite data can be even more useful following the approach of this study with near real-time fine resolution imagery and regionally/cluster-specific algorithms for the retrieval of chla concentrations. According to the recorded in situ data, our approach to retrieve chla is an improvement on other previously used techniques, and made it possible to obtain reliable chla maps while using almost every image. The relationship that was established in this paper between the MERIS Rrs and pDA can be the basis of an effective Earth Observation (EO)-based HAB monitoring that will address the requirements of several key regional end-users.
Another finding is the relationship between MERIS FR data and pDA. In a previous study, Anderson et al. [108] also developed regression models for Pseudo-nitzschia spp. abundance, pDA, and cDa in the Santa Barbara channel integrating ocean colour (MODIS-Aqua and SeaWiFS) and sea surface temperature (AVHRR) data, finding relationships while using similar spectral bands (510 nm and 555 nm). Although our model is based on a limited dataset and it requires further research, it could be a good starting point for the development of new algorithms for the Rias Baixas area.
Although the Envisat satellite has stopped functioning in May 2012, the approach that was followed with MERIS by the authors could be adapted to other satellite-based ocean colour sensors. At present, we are involved in the European (EU H2020) funded project CoastObs [109], which explores the potential use of the new Sentinel satellites to monitor coastal water environments. It includes, among its objectives, the development of validated map products that were derived from Sentinel 3 images that are expected to provide useful information for HABs detection and monitoring in Galicia, including not only chla concentration, but also species indicators for specific species, such as Pseudo-nitzschia spp. or Alexandrium minutum.

Author Contributions

Conceptualization, J.M.T.P., F.M.B. and E.S.; methodology, E.G., A.G.-F. and E.S; formal analysis, e.g., A.G.-F. and E.S.; resources, J.M.T.P. and A.G.-F.; writing—original draft preparation, J.M.T.P., E.G., A.G.-F. and E.S.; writing—review and editing, F.M.B., L.G.V. and E.S.; visualization, L.G.V. and E.S.; supervision, J.M.T.P. and E.S.; project administration, J.M.T.; funding acquisition, J.M.T. and E.S.

Funding

This study was funded by the European Union’s Horizon 2020 research and innovation programme (grant agreement n° 776348) and Marie Sklodowska-Curie Actions (project 20501 ECOsystem approach to Sustainable Management of the Marine Environment and its living Resources (ECOSUMMER)).

Acknowledgments

We are very grateful to A. Acuña and D. Perez Estevez for their helpful assistance during the fieldwork. We also thank Aldo Barreiro for his useful comments on the manuscript.

Conflicts of Interest

The authors declare no conflict of interest.

References

  1. Hasle, G.R. Are most of the domoic acid-producing species of the diatom genus Pseudo-nitzschia cosmopolites? Harmful Algae 2002, 1, 137–146. [Google Scholar] [CrossRef]
  2. Bates, S.S.; Garrison, D.L.; Horner, R.A. Bloom dynamics and physiology of domoic-acid-producing Pseudo-nitzschia species. In Physiological Ecology of Harmful Algal Blooms; Anderson, D.M., Cembella, A.D., Hallegraeff, G.M., Eds.; Springer: Berlin, Germany, 1998; Volume 41, pp. 267–292. [Google Scholar]
  3. Quiroga, I. Pseudo-nitzschia blooms in the Bay of Banyuls-sur-Mer, northwestern Mediterranean Sea. Diatom Res. 2006, 21, 91–104. [Google Scholar] [CrossRef]
  4. Terseleer, N.; Gypens, N.; Lancelot, C. Factors controlling the production of domoic acid by Pseudo-nitzschia (Bacillariophyceae): A model study. Harmful Algae 2013, 24, 45–53. [Google Scholar] [CrossRef]
  5. Trainer, V.L.; Hickey, B.M.; Horner, R.A. Biological and physical dynamics of domoic acid production off the Washington coast. Limnol. Oceanogr. 2002, 47, 1438–1446. [Google Scholar] [CrossRef]
  6. Adams, N.G.; Lesoing, M.; Trainer, V.L. Environmental conditions associated with domoic acid in razor clams on the Washington coast. J. Shellfish Res. 2000, 19, 1007–1015. [Google Scholar]
  7. Marchetti, A.; Trainer, V.L.; Harrison, P.J. Environmental conditions and phytoplankton dynamics associated with Pseudo-nitzschia abundance and domoic acid in the Juan de Fuca eddy. Mar. Ecol. Prog. Ser. 2004, 281, 1–12. [Google Scholar] [CrossRef]
  8. Kudela, R.; Pitcher, G.; Probyn, T.; Figueiras, F.; Moita, T.; Trainer, V.L. Harmful algal blooms in coastal upwelling systems. Oceanography 2005, 18, 185–197. [Google Scholar] [CrossRef]
  9. Anderson, C.R.; Brzezinski, M.A.; Washburn, L.; Kudela, R. Circulation and environmental conditions during a toxigenic Pseudo-nitzschia australis bloom in the Santa Barbara Channel, California. Mar. Ecol. Prog. Ser. 2006, 327, 119–133. [Google Scholar] [CrossRef]
  10. Schnetzer, A.; Jones, B.H.; Schaffner, R.A.; Cetinic, I.; Fitzpatrick, E.; Miller, P.E.; Caron, D.A. Coastal upwelling linked to toxic Pseudo-nitzschia australis blooms in Los Angeles coastal waters, 2005–2007. J. Plankton Res. 2013, 35, 1080–1092. [Google Scholar] [CrossRef]
  11. Figueiras, F.G.; Rios, A.F. Phytoplankton succession, red tides and the hydrographic regime in the Rías Bajas of Galicia. In Toxic Phytoplankton Blooms in the Sea; Smayda, T.J., Shimizu, Y., Eds.; Elsevier: Amsterdam, The Netherlands, 1993; pp. 239–244. [Google Scholar]
  12. Moroño, A.; Pazos, Y.; Maneiro, J. Evolución del fitoplancton tóxico y condiciones oceanográficas asociadas en los años 97–98 en las Rías Gallegas. In Proceedings of the VI Reunión Ibérica sobre Fitoplancton Tóxico y Biotoxinas, Sevilla, Spain, 5–7 May 1999; Junta de Andalucía: Sevilla, Spain, 2000; pp. 59–66. [Google Scholar]
  13. Palma, S.; Mouriño, H.; Silva, A.; Barao, M.; Moita, M.T. Can Pseudo-nitzschia blooms be modeled by coastal upwelling in Lisbon Bay? Harmful Algae 2010, 9, 294–303. [Google Scholar] [CrossRef]
  14. González Vilas, L.; Spyrakos, E.; Torres Palenzuela, M.; Pazos, Y. Support Vector Machine-based method for predicting Pseudo-nitzschia spp. blooms in coastal waters (Galician rias, NW Spain). Prog. Oceanogr. 2014, 124, 66–77. [Google Scholar] [CrossRef]
  15. Fawcett, A.; Pitcher, G.C.; Bernard, S.; Cembella, A.D.; Kudela, R.M. Contrasting wind patterns and toxigenic phytoplankton in the southern Benguela upwelling system. Mar. Ecol. Prog. Ser. 2007, 348, 19–31. [Google Scholar] [CrossRef] [Green Version]
  16. Guannel, M.L.; Haring, D.; Twiner, M.J.; Wang, Z.; Noble, A.E.; Lee, P.A.; Saito, M.A.; Rocap, G. Toxigenicity and biogeography of the diatom Pseudo-nitzschia across distinct environmental regimes in the South Atlantic Ocean. Mar. Ecol. Prog. Ser. 2015, 526, 67–87. [Google Scholar] [CrossRef]
  17. Louw, D.C.; Doucette, G.J.; Lundholm, N. Morphology and toxicity of Pseudo-nitzschia species in the northern Benguela Upwelling System. Harmful Algae 2018, 75, 118–128. [Google Scholar] [CrossRef] [PubMed]
  18. Smith, J.C.; Cormier, R.; Worms, J.; Bird, C.J.; Quilliam, M.A.; Pocklington, R.; Angus, R.; Hanic, L. Toxic blooms of the domoic acid containing diatom Nitzschia pungens in the Cardigan River, Prince Edward Island. In Toxic Marine Phytoplankton; Graneli, E., Sundstrom, B., Edler, L., Anderson, D.M., Eds.; Elsevier: New York, NY, USA, 1990; pp. 227–232. [Google Scholar]
  19. Parsons, M.L.; Dortch, Q.; Turner, R.E. Sedimentological evidence of an increase in Pseudo-nitzschia (Bacillariophyceae) abundance in response to coastal eutrophication. Limnol. Oceanogr. 2002, 47, 551–558. [Google Scholar] [CrossRef]
  20. Kudela, R.; Cochlan, W.; Roberts, A. Spatial and temporal patterns of Pseudo-nitzschia species in central California related to regional oceanography. In Harmful Algae 2002; Steidenger, K.A., Landsberg, J.H., Tomas, C.R., Vargo, G.A., Eds.; Florida Fish and Wildlife Conservation Commission, Florida Institute of Oceanography, and Intergovernmental Oceanographic Commission of UNESCO: St. Petersburg, FL, USA, 2004; pp. 347–349. [Google Scholar]
  21. GEOHAB. Global Ecology and Oceanography of Harmful Algal Blooms, GEOHAB Core Research Project: HABs in Upwelling Systems; Pitcher, P., Moita, T., Trainer, V.L., Kudela, R., Figueiras, P., Probyn, T., Eds.; IOC and SCOR.: Paris, France; Baltimore, MD, USA, 2005. [Google Scholar]
  22. Klein, C.; Claquin, P.; Bouchart, V.; Le Roy, B.; Véron, B. Dynamics of Pseudo-nitzschia spp. and domoic acid production in a macrotidal ecosystem of the Eastern English Channel (Normandy, France). Harmful Algae 2010, 9, 218–226. [Google Scholar] [CrossRef]
  23. Tas, S.; Lundholm, N. Temporal and spatial variability of the potentially toxic Pseudo-nitzschia spp. in a eutrophic estuary (Sea of Marmara). J. Mar. Biol. Assoc. UK 2017, 97, 1483–1494. [Google Scholar] [CrossRef]
  24. Pednekar, S.M.; Bates, S.S.; Kerkar, V.; Prabhu Matondkar, S.G. Environmental Factors Affecting the Distribution of Pseudo-nitzschia in Two Monsoonal Estuaries of Western India and Effects of Salinityon Growth and Domoic Acid Production by P. pungens. Estuaries Coasts 2018, 41, 1448–1462. [Google Scholar] [CrossRef]
  25. Horner, R.A.; Garrison, D.L.; Plumley, F.G. Harmful algal blooms and red tide problems on the US west coast. Limnol. Oceanogr. 1997, 42, 1076–1088. [Google Scholar] [CrossRef]
  26. Trainer, V.L.; Pitcher, G.C.; Reguera, B.; Smayda, T.J. The distribution and impacts of harmful algal bloom species in eastern boundary upwelling systems. Prog. Oceanogr. 2010, 85, 33–52. [Google Scholar] [CrossRef]
  27. Schnetzer, A.; Miller, O.; Schaffner, R.; Stauffer, B.; Jones, B.; Weisberg, S.; DiGiacomo, P.; Berelson, W.; Caron, D. Blooms of Pseudo-nitzschia and domoic acid in the San Pedro Channel and Los Angeles harbor areas of the Southern California Bight, 2003–2004. Harmful Algae 2007, 6, 372–387. [Google Scholar] [CrossRef]
  28. Liefer, J.A.; Robertson, A.; MacIntyre, H.L.; Smith, W.L.; Dorsey, C.P. Characterization of a toxic Pseudo-nitzschia spp. bloom in the northern Gulf of Mexico associated with domoic acid accumulation in fish. Harmful Algae 2013, 26, 20–32. [Google Scholar] [CrossRef]
  29. Bargu, S.; Baustian, M.M.; Rabalais, N.N.; Del Rio, R.; Von Korff, B.; Turner, R.E. Influence of the Mississippi River on Pseudo-nitzschia spp. Abundance and Toxicity in Louisiana Coastal Waters. Estuaries Coasts 2016, 39, 1345–1356. [Google Scholar] [CrossRef]
  30. Pan, Y.; Subba Rao, D.V.; Mann, K.H. Changes in domoic acid production and cellular chemical composition of the toxigenic diatom Pseudo-nitzschia multiseries under phosphate limitation. J. Phycol. 1996, 32, 371–381. [Google Scholar] [CrossRef]
  31. Pan, Y.L.; Rao, D.V.S.; Mann, K.H.; Brown, R.G.; Pocklington, R. Effects of silicate limitation on production of domoic acid, a neurotoxin, by the diatom Pseudo-nitzschia multiseries. 1. Batch culture studies. Mar. Ecol. Prog. Ser. 1996, 131, 225–233. [Google Scholar] [CrossRef]
  32. Maldonado, M.T.; Hughes, M.P.; Rue, E.L.; Wells, M.C. The effect of Fe and Cu on growth and domoic acid production by Pseudo-nitzschia multiseries and Pseudo-nitzschia australis. Limnol. Oceanogr. 2002, 47, 515–526. [Google Scholar] [CrossRef]
  33. Fehling, J.; Davidson, K.; Bolch, C.J.; Bates, S.S. Growth and domoic acid production by Pseudo-nitzschia seriata (Bacillariophyceae) under phosphate and silicate limitation. J. Phycol. 2004, 40, 674–683. [Google Scholar] [CrossRef]
  34. Wells, M.L.; Trick, C.G.; Cochlan, W.P.; Hughes, M.P.; Trainer, V.L. Domoic acid: The synergy of iron, copper, and the toxicity of diatoms. Limnol. Oceanogr. 2005, 50, 1908–1917. [Google Scholar] [CrossRef] [Green Version]
  35. Auro, M.E.; Cochlan, W.P. Nitrogen Utilization and Toxin Production by Two Diatoms of the Pseudo-nitzschia pseudodelicatissima Complex: P. cuspidata and P. fryxelliana. J. Phycol. 2013, 49, 1529–8817. [Google Scholar] [CrossRef]
  36. Trainer, V.L.; Bill, B.D.; Stehr, C.M.; Wekell, J.C.; Moeller, P.; Busman, M.; Woodruff, D. Domoic acid production near California coastal upwelling zones, June 1998. Limnol. Oceanogr. 2000, 45, 1818–1833. [Google Scholar] [CrossRef] [Green Version]
  37. Trainer, V.L.; Hickey, B.M.; Lessard, E.J.; Cohlan, W.P.; Trick, C.G.; Wells, M.L.; MacFadyen, A.; Moore, S.K. Variability of Pseudo-nitzschia and domoic acid in the Juan de Fuca eddy region and its adjacent shelves. Limnol. Oceanogr. 2009, 54, 289–308. [Google Scholar] [CrossRef]
  38. Downes-Tettmar, N.; Rowland, S.; Widdicombe, C.; Woodward, M.; Llewellyn, C. Seasonal variation in Pseudo-nitzschia spp. and domoic acid in the western English Channel. Cont. Shelf Res. 2013, 53, 40–49. [Google Scholar] [CrossRef]
  39. Thorel, M.; Claquin, P.; Schapira, M.; Le Gendre, R.; Riou, P.; Goux, D.; Le Roy, B.; Raimbault, V.; Deton-Cabanillas, A.F.; Bazin, P.; et al. Nutrient ratios influence variability in Pseudo-nitzschia species diversity and particulate domoic acid production in the Bay of Seine (France). Harmful Algae 2017, 68, 192–205. [Google Scholar] [CrossRef] [PubMed]
  40. Trick, C.G.; Trainer, V.L.; Cochlan, W.P.; Wells, M.L.; Beall, B.F. The successional formation and release of domoic acid in a Pseudo-nitzschia bloom in the Juan de Fuca Eddy: A drifter study. Harmful Algae 2018, 79, 105–114. [Google Scholar] [CrossRef] [PubMed]
  41. Caroppo, C.; Congestri, R.; Bracchini, L.; Albertano, P. On the presence of Pseudo-nitzschia calliantha Lundholm, Moestrup et Hasle and Pseudo-nitzschia delicatissima (Cleve) Heiden in the Southern Adriatic Sea (Mediterranean Sea, Italy). J. Plankton Res. 2005, 27, 763–774. [Google Scholar] [CrossRef]
  42. Zhu, Z.; Qu, P.; Fu, F.; Tennenbaum, N.; Tatters, A.O.; Hutchins, D.A. Understanding the blob bloom: Warming increases toxicity and abundance of the harmful bloom diatom Pseudo-nitzschia in California coastal waters. Harmful Algae 2017, 67, 36–43. [Google Scholar] [CrossRef] [PubMed]
  43. Míguez, A.; Fernández, M.L.; Fraga, S. First detection of domoic acid in Galicia (NW Spain). In Harmful and Toxic Algal Blooms; Yasumoto, T., Oshima, Y., Fukuyo, Y., Eds.; Intergovernmental Commission of UNESCO: Paris, France, 1996; pp. 143–145. [Google Scholar]
  44. Fraga, S.; Alvarez, M.J.; Míguez, A.; Fernández, M.L.; Costas, E.; Lopez-Rodas, V. Pseudo-nitzschia species isolated from Galician waters: Toxicity, DNA content and lectin binding assay. In Harmful Algae; Reguera, B., Blanco, B., Fernández, M.L., Wyatt, T., Eds.; Xunta de Galicia and Intergovernmental Commission of UNESCO: Santiago de Compostela, Spain, 1998; pp. 270–273. [Google Scholar]
  45. Reguera, B.; Garcés, E.; Bravo, I.; Pazos, Y.; Ramilo, I.; González, G. Cell cycle patterns and estimates of in situ division rates of dinoflagellates of the genus Dinophysis by a postmitotic index. Mar. Ecol. Prog. Ser. 2003, 249, 117–131. [Google Scholar] [CrossRef]
  46. Álvarez-Salgado, X.A.; Labarta, U.; Fernandez-Reiriz, M.J.; Figueiras, F.G.; Rosón, R.; Piedracoba, S.; Filgueira, R.; Cabanas, J.M. Renewal time and the impact of harmful algal blooms on the extensive mussel raft culture of the Iberian coastal upwelling system (SW Europe). Harmful Algae 2008, 7, 849–855. [Google Scholar] [CrossRef] [Green Version]
  47. Rodríguez Rodríguez, G.; Villasante, S.; García-Negro, M. Are red tides affecting economically the commercialization of the Galician (NW Spain) mussel farming? Mar. Policy 2011, 35, 252–257. [Google Scholar] [CrossRef]
  48. Arévalo, F.F.; Bermúdez, M.; Salgado, C. ASP toxicity in scallops: Individual variability and tissue distribution. In Harmful Algae; Reguera, B., Blanco, B., Fernández, M.L., Wyatt, T., Eds.; Xunta de Galicia and Intergovernmental Commission of UNESCO: Santiago de Compostela, Spain, 1998; pp. 499–502. [Google Scholar]
  49. Garet, E.; González-Fernández, Á.; Lago, J.; Vieites, J.; Cabado, A. Comparative evaluation of Enzyme-linked Immunoassay and reference methods for the detection of shellfish hydrophilic toxins in several presentations of seafood. J. Agric. Food Chem. 2010, 20, 1410–1415. [Google Scholar] [CrossRef]
  50. Maneiro, I.; Iglesias, P.; Guisande, C.; Riveiro, I.; Barreiro, A.; Zervoudaki, S.; Granéli, E. Fate of domoic acid ingested by the copepod Acartia clausi. Mar. Biol. 2005, 148, 123–130. [Google Scholar] [CrossRef]
  51. Kudela, R.M.; Stumpf, R.P.; Petrov, P. Acquisition and analysis of remote sensing imagery of harmful algal blooms. In Harmful Algal Blooms (HABs) and Desalination: A Guide to Impacts, Monitoring and Management; Anderson, D.M., Boerlage, S.F.E., Dixon, M.B., Eds.; Intergovernmental Oceanographic Commission of UNESCO: Paris, France, 2017; pp. 119–132. [Google Scholar]
  52. Zheng, G.; DiGiacomo, P.M. Uncertainties and applications of satellite-derived coastal water quality products. Prog. Oceanogr. 2017, 159, 45–72. [Google Scholar] [CrossRef]
  53. Spyrakos, E.; González Vilas, L.; Torres Palenzuela, J.M.; Barton, E.D. Remote sensing chlorophyll a of optically complex waters (rias Baixas, NW Spain): Application of a regionally specific chlorophyll a algorithm for MERIS full resolution data during an upwelling cycle. Remote Sens. Environ. 2011, 115, 2471–2485. [Google Scholar] [CrossRef] [Green Version]
  54. Doerffer, R.; Sorensen, K.; Aiken, J. MERIS potential for coastal zone applications. Int. J. Remote Sens. 1999, 20, 1809–1818. [Google Scholar] [CrossRef]
  55. Donlon, C.; Berruti, B.; Buongiorno, A.; Ferreira, M.H.; Féménias, P.; Frerick, J.; Goryl, P.; Klein, U.; Laur, H.; Mavrocordatos, C.; et al. The Global Monitoring for Environment and Security (GMES) Sentinel-3 mission. Remote Sens. Environ. 2012, 120, 37–57. [Google Scholar] [CrossRef]
  56. Barton, E.D.; Largier, J.L.; Torres, R.; Sheridan, M.; Trasviña, A.; Souza, A.; Pazos, Y.; Valle-Levinson, A. Coastal upwelling and downwelling forcing of circulation in a semi-enclosed bay: Ria de Vigo. Prog. Oceanogr. 2015, 134, 173–189. [Google Scholar] [CrossRef] [Green Version]
  57. Pitcher, G.C.; Figueiras, F.G.; Hickey, B.M.; Moita, M.T. The physical oceanography of upwelling systems and the development of harmful algal blooms. Prog. Oceanogr. 2010, 85, 5–32. [Google Scholar] [CrossRef] [PubMed] [Green Version]
  58. Zapata, M.; Rodríguez, F.; Garrido, J.L. Separation of chlorophylls and carotenoids from marine phytoplankton: A new HPLC method using a reversed phase C8 column and pyridine-containing mobile phases. Mar. Ecol. Prog. Ser. 2000, 195, 29–45. [Google Scholar] [CrossRef]
  59. Strickland, J.; Parsons, T. A Practical Handbook of Seawater Analysis, 2nd ed.; Fisheries Research Board of Canada Bulletin: Ottawa, ON, Canada, 1972. [Google Scholar]
  60. Van der Linde, D. Protocol for Total Suspended Matter Estimate; Technical Note No.I.98.182; European Commission, Joint Research Centre: Ispra, Italy, 1998. [Google Scholar]
  61. Bendschneider, K.; Robinson, R. A new spectrophotometric method for the determination of nitrite in sea water. J. Mar. Res. 1952, 11, 87–96. [Google Scholar]
  62. Wood, E.D.; Armstrong, F.A.J.; Richards, F.A. Determination of nitrate in seawater by cadmium copper reduction to nitrite. J. Mar. Biol. Assoc. UK 1967, 47, 23–31. [Google Scholar] [CrossRef]
  63. Grasshoff, K.; Kremling, K.; Ehrhardt, K. Methods of Seawater Analysis, 3rd ed.; Wiley-VCH: New York, NY, USA, 1999. [Google Scholar]
  64. Grasshoff, K.; Ehrhardt, M.; Kremling, K. Methods of Seawater Analysis, 2nd ed.; Verlag Chemie: Weinheim, FL, USA, 1983. [Google Scholar]
  65. Utermöhl, H. Zur vervollkommnung der quantitativen phytoplankton-methodik. Mitt. Int. Ver. Theor. Amgewandte Limnol. 1958, 9, 1–38. [Google Scholar] [CrossRef]
  66. Tomas, C.R. Identifying Marine Phytoplankton; Academic Press: San Diego, CA, USA, 1997. [Google Scholar]
  67. Renberg, I. A procedure for preparing large sets of diatom slides from sediment cores. J. Paleolimnol. 1990, 4, 87–90. [Google Scholar] [CrossRef]
  68. Hasle, G.R.; Syvertsen, E.E. Marine diatoms. In Identifying Marine Diatoms and Dinoflagellates; Tomas, C.R., Ed.; Academic Press: San Diego, CA, USA, 1996; pp. 5–385. [Google Scholar]
  69. Skov, J.; Lundholm, N.; Moestrup, Ø.; Larsen, J. Leaflet no. 185: Potentially toxic phytoplankton. The diatom genus Pseudo-nitzschia (Diatomophyceae/Bacillariophyceae). In ICES Identification Leaflets for Phytoplankton; Lindley, J.A., Ed.; ICES: Copenhagen, Denmark, 1999; pp. 1–23. [Google Scholar]
  70. Fryxell, G.A.; Hasle, G.R. Taxonomy of harmful diatoms. In Manual on Harmful Marine Microalgae, Monographs on Oceanographic Methodology; Hallegraeff, G.M., Anderson, D.M., Cembella, A.D., Eds.; UNESCO: Paris, France, 2003; Volume 11, pp. 465–510. [Google Scholar]
  71. Herrera, J.L.; Piedracoba, S.; Varela, R.A.; Roson, G. Statial analysis of the wind field on the western coast of Galicia (NW Spain) from in situ measurements. Cont. Shelf Res. 2005, 25, 1728–1748. [Google Scholar] [CrossRef]
  72. Bakun, A. Coastal Upwelling Indices, West Coast of North America 1946–71; Technical Report NMFS-SSRF 671; NOAA: Seattle, WA, USA, 1973; pp. 1–103. [Google Scholar]
  73. Hidy, G.M. A view of recent air—Sea interaction research. Bull. Am. Meteorol. Soc. 1972, 53, 1083–1102. [Google Scholar] [CrossRef]
  74. Beam 5, Brockmann Consult and Contributors. Available online: http://www.brockmann-consult.de/cms/web/beam/ (accessed on 18 September 2019).
  75. Doerffer, R.; Schiller, H. MERIS Regional Coastal and Lake Case 2 Water Project—Atmospheric Correction ATBD; GKSS Research Center: Geestacht, Germany, 2008; Version 1.0. [Google Scholar]
  76. González Vilas, L.; Spyrakos, E.; Torres Palenzuela, J.M. Neural network estimation of chlorophyll a from MERIS full resolution data for the coastal waters of Galician rias (NW Spain). Remote Sens. Environ. 2011, 115, 524–535. [Google Scholar] [CrossRef]
  77. Wood, S.N. Modelling and smoothing parameter estimation with multiple quadratic penalties. J. R. Stat. Soc. 2000, 62, 413–428. [Google Scholar] [CrossRef] [Green Version]
  78. Lin, X.; Zhang, D. Inference in generalized additive mixed models using smoothing splines. J. R. Stat. Soc. 1999, 61, 381–400. [Google Scholar] [CrossRef]
  79. Zuur, A.; Ieno, E.N.; Walker, N.; Saveliev, A.A.; Smith, G.M. Mixed Effects Models and Extensions in Ecology With R; Springer: New York, NY, USA, 2009. [Google Scholar]
  80. Zuur, A.; Ieno, E.; Smith, G.M. Analysing Ecological Data; Springer: New York, NY, USA, 2007. [Google Scholar]
  81. Prego, R.; Guzmán-Zuñiga, D.; Varela, M.; deCastro, M. Consequences of winter upwelling events on biogeochemical and phytoplankton patterns in a western Galician ria (NW Iberian peninsula). Estuar. Coast. Shelf Sci. 2007, 73, 409–422. [Google Scholar] [CrossRef]
  82. Busse, L.; Venrick, E.; Antrobus, R.; Miller, P.; Vigilant, V.; Silver, M.; Mengelt, C.; Mydlarz, L.; Prezelin, B. Domoic acid in phytoplankton and fish in San Diego, CA, USA. Harmful Algae 2006, 5, 91–101. [Google Scholar] [CrossRef]
  83. Garcia-Mendoza, E.; Rivas, D.; Olivos-Ortiz, A.; Almazan-Becerril, A.; Castaneda-Vega, C.; Pena-Manjarrez, J.L. A toxic Pseudo-nitzschia bloom in Todos Santos Bay, northwestern Baja California, Mexico. Harmful Algae 2009, 8, 493–503. [Google Scholar] [CrossRef]
  84. Sekula-Wood, E.; Benitez-Nelson, C.; Morton, S.; Anderson, C.; Burrell, C.; Thunell, R. Pseudo-nitzschia and domoic acid fluxes in Santa Barbara Basin (CA) from 1993 to 2008. Harmful Algae 2011, 10, 567–575. [Google Scholar] [CrossRef]
  85. Scholin, C.; Gulland, F.; Doucette, G.; Benson, S.; Busman, M.; Chavez, F.; Cordaro, J.; Delong, E.; Vogelaere, A.; Harvey, J.; et al. Mortality of sea lions along the central California coast linked to a toxic diatom bloom. Nature 2000, 403, 80–84. [Google Scholar] [CrossRef] [PubMed]
  86. Parsons, M.L.; Dortch, Q.; Doucette, G. An assessment of Pseudo-nitzschia population dynamics and domoic acid production in coastal Louisiana. Harmful Algae 2013, 30, 65–77. [Google Scholar] [CrossRef]
  87. Pazos, Y.; Moroño, A. Monitorización de condiciones oceanográficas y fitoplancton en las zonas de producción de moluscos de Galicia (2007–2010). In Proceedings of the XI Reunion Iberica, Fitoplancon Tóxico y Biotoxinas, Bilbao, Spain, 30 May–2 June 2011. [Google Scholar]
  88. ICES. Report of the ICES-IOC Working Group on Harmful Algal Bloom Dynamics (WGHABD); ICES CM 2008/OCC: Galway, Ireland, 2008. [Google Scholar]
  89. ICES. Report of the ICES—IOC Working Group on Harmful Algal Bloom Dynamics (WGHABD); ICES CM 2012/SSGHIE: Oban, UK, 2012. [Google Scholar]
  90. Blanco, J.; De La Puente, M.B.; Arevalo, F.; Salgado, C.; Morono, A. Depuration of mussels (Mytilus galloprovincialis) contaminated with domoic acid. Aquat. Living Resour. 2002, 15, 53–60. [Google Scholar] [CrossRef]
  91. Mafra, L.L., Jr.; Bricelj, V.M.; Fennel, K. Domoic acid uptake and elimination kinetics in oysters and mussels in relation to body size and anatomical distribution of toxin. Aquat Toxicol. 2010, 100, 17–29. [Google Scholar] [CrossRef] [PubMed] [Green Version]
  92. Kvitek, R.G.; Goldberg, J.D.; Smith, G.J.; Doucette, G.J.; Silver, M.W. Domoic acid contamination within eight representative species from the benthic food web of Monterey Bay, California, USA. Mar. Ecol. Prog. Ser. 2008, 367, 35–47. [Google Scholar] [CrossRef] [Green Version]
  93. Del Rio, R.; Bargu, S.; Baltz, D.; Fire, S.; Peterson, G.; Wang, Z. Gulf menhaden (Brevoortia patronus): A potential vector of domoic acid in coastal Louisiana food webs. Harmful Algae 2010, 10, 19–29. [Google Scholar] [CrossRef]
  94. Blanco, J.; Acosta, C.P.; de la Puente, M.B.; Salgado, C. Depuration and anatomical distribution of the amnesic shellfish poisoning (ASP) toxin domoic acid in the king scallop Pecten maximus. Aquat Toxicol. 2002, 60, 111–121. [Google Scholar] [CrossRef]
  95. Mauriz, A.; Blanco, J. Distribution and linkage of domoic acid (amnesic shellfish poisoning toxins) in subcellular fractions of the digestive gland of the scallop Pecten maximus. Toxicon 2010, 55, 606–611. [Google Scholar] [CrossRef]
  96. Diaz, P.A.; Ruiz Villarreal, M.; Velo-Suarez, L.; Ramilo, I.; Gentien, P.; Lunven, M.; Fernand, L.; Raine, R.; Reguera, B. Tidal and wind-event variability and the distribution of two groups of Pseudo-nitzschia species in an upwelling-influenced ría. Deep Sea Res. Part II Top. Stud. Oceanogr. 2014, 101, 163–179. [Google Scholar] [CrossRef]
  97. Silver, M.; Bargu, S.; Coale, S.; Benitez-Nelson, C.; Garcia, A.; Roberts, K.; Sekula-Wood, E.; Bruland, K.; Coale, K. Toxic diatoms and domoic acid in natural and iron enriched waters of the oceanic Pacific. Proc. Natl. Acad. Sci. USA 2010, 107, 20762–20767. [Google Scholar] [CrossRef] [PubMed] [Green Version]
  98. Kleivdal, H.; Kristiansen, S.I.; Nilsen, M.V.; Briggs, L. Single-laboratory validation of Biosense Direct Competitative Enzyme-linked Immunosorbent Assay (ELISA) for the determination of Domoic acid toxins in shellfish. J. AOAC Int. 2007, 90, 1000–1010. [Google Scholar] [PubMed]
  99. Lane, J.; Raimondi, P.; Kudela, R. Development of a logistic regression model for prediction of toxigenic Pseudo-nitzshia blooms in Monteray Bay, California. Mar. Ecol. Prog. Ser. 2009, 383, 37–51. [Google Scholar] [CrossRef]
  100. Torres Palenzuela, J.; González Vilas, L.; Spyrakos, E. Artificial Neural Network model for predicting Pseudo-nitzschia spp. abundance in the Galician Rias (NW Spain). In Proceedings of the 14th International Conference on Harmful Algae, Creta, Greece, 1–5 November 2010. [Google Scholar]
  101. Moroño, A.; Pazos, Y. Floraciónes algales nocivas y condiciones oceanográficas en las rias gallegas durante los años 2007 y 2008. In Proceedings of the X Reunion Iberica, Fitoplancon Tóxico y Biotoxinas, Lisbon, Portugal, 12–15 May 2009. [Google Scholar]
  102. Bates, S.S.; Defreitas, A.S.W.; Milley, J.E.; Pocklington, R.; Quilliam, M.A.; Smith, J.C.; Worms, J. Controls on domoic acid production by the diatom Nitzschia-pungens f. multiseries in culture—Nutrients and irradiance. Can. J. Fish. Aquat. Sci. 1991, 48, 1136–1144. [Google Scholar] [CrossRef]
  103. Fehling, J.; Davidson, K.; Bates, S.S. Growth dynamics of non-toxic Pseudonitzschia delicatissima and toxic P. seriata (Bacillariophyceae) under simulated spring and summer photoperiods. Harmful Algae 2005, 4, 763–769. [Google Scholar] [CrossRef]
  104. Fehling, J.; Davidson, K.; Bolch, C.J.; Tett, P. Seasonality of Pseudo-nitzschia spp. (Bacillariophyceae) in western Scottish waters. Mar. Ecol. Prog. Ser. 2006, 323, 91–105. [Google Scholar] [CrossRef]
  105. Davidson, K.; Gowen, R.; Tett, P.; Bresnan, E.; Harrison, P.; McKinney, A.; Milligan, S.; Mills, D.; Silke, J.; Crooks, A.M. Harmful algal blooms: How strong is the evidence that nutrient ratios and forms influence their occurrence? Estuar. Coast. Shelf Sci. 2012, 115, 399–413. [Google Scholar] [CrossRef]
  106. Thessen, A.E.; Stoecker, D.K. Distribution, abundance and domoic acid analysis of the toxic diatom genus Pseudo-nitzschia from the Chesapeake Bay. Estuaries Coasts 2008, 31, 664–672. [Google Scholar] [CrossRef]
  107. Lefebvre, K.A.; Robertson, A. Domoic acid and human exposure risks: A review. Toxicon 2010, 56, 218–230. [Google Scholar] [CrossRef]
  108. Anderson, C.R.; Siegel, D.A.; Kudela, R.M.; Brzezinski, M.A. Empirical models of toxigenic Pseudo-nitzschia blooms: Potential use as a remote detection tool in the Santa Barbara Channel. Harmful Algae 2009, 8, 478–492. [Google Scholar] [CrossRef]
  109. CoastObs Project. Available online: http://coastobs.eu/ (accessed on 18 September 2019).
Figure 1. (a) Map of the Galician coast. From north to south the rias Baixas: Muros y Noya, Arousa, Pontevedra and Vigo. The location of the Seawatch buoy station off Cabo Silleiro is shown by a black rectangle. (b) Map of Ria de Vigo and Ria de Pontevedra showing the locations of the sampling stations.
Water 11 01954 g001
Figure 2. Daily and weekly upwelling index off the rias Baixas for the years 2007–2009. The Iw in m−3 s−1 100 m−1 represents the offshore Ekman flux in the surface layer. Arrows indicate the days where the in-situ surveys were carried out.
Water 11 01954 g002
Figure 3. (13) Scanning electron micrographs of Pseudo-nitzschia australis. Note the: (1) apically asymmetric valve; (2,3) details of the rounded poroids arranged in two striae, the absence of central interspace. (46) Scanning electron micrographs of P. pungens. Note the: (4) Linear to lanceolate valves (5,6) 2 rows of poroids in contact with interstriae and arranges in opposite sites. Scale bar: (1) 20μm, (2) 5μm, (3) 2μm, (4) 20μm, (5) 2μm, and (6) 2μm.
Water 11 01954 g003
Figure 4. Abundance of Pseudo-nitzshia spp. plotted with concentration of pDA across all the stations in Ria de Vigo (V) and Ria de Pontevedra (P) during our sampling period for periods (1) (spring downwelling), (2) (summer), and (3) (autumn downwelling).
Water 11 01954 g004
Figure 5. Distribution of particulate domoic acid (pDA) during the two high DA episodes recorded in the surface waters of Ria de Vigo on (a) 19 October 2007 and (b) 14 July 2009.
Water 11 01954 g005
Figure 6. Chla maps retrieved from MERIS full-resolution (FR) data using the neural network for rias Baixas (NNRB)on the survey dates. White colour indicates masking of land while grey masking of clouds. Pixels belonging to Cluster#2 and Cluster#3 were assigned a value of 0 (dark blue).
Water 11 01954 g006
Figure 7. Generalised additive mixed model (GAMM) results: model of Pseudo-nitzschia spp. abundance: smoothers and estimated degrees of freedom (y axis) showing partial effects of Si(OH)4:N ratio on Pseudo-nitzschia spp. abundance. x axis in cubic root (mg-N L−1).
Water 11 01954 g007
Table 1. Summary of the field campaign, showing date, ria, number of sampling stations (#stations), period (between 1 and 3), sky conditions and the acquisition time and mean view zenith angle from west for the MERIS FR images used in this study. The three periods were: 1: Spring downwelling favourable winds; 2: summer upwelling-downwelling cycle and 3: autumn strong downwelling favourable winds.
Dateria#stationsPeriodSky ConditionsAcquisition Time (UTC)View Zenith Angle (º)
25 July 2007Vigo102clear11:1115.3
19 October 2007Vigo103clear11:0812.6
9 July 2008Vigo102clear11:1013.0
22 July 2008Vigo102clear11:0211.7
27 May 2009Pontevedra51clear10:5120.7
7 July 2009Pontevedra52cloudy10:5815.7
14 July 2009Vigo122partly cloudy10:4220.7
Table 2. A list of the environmental parameters, units and in-situ mean values during the 3 periods (1: spring downwelling; 2: summer; 3: autumn downwelling). Chlorophyll a (chla); suspended particulate material (SPM); inorganic suspended material (ISM); Secchi disk depth (Zsd); pH; salinity (Sal); temperature (temp); silicic acid (Si(OH)4), orthophosphate (PO43−); nitrite (NO2); nitrate (NO3); ammonium (NH4+), dissolved organic carbon (DOC), particulate organic carbon (POC) and particulate organic nitrogen (PON). nd = not determined, bd = below detection limit (detection limit for: Si(OH)4: 0.036 mg L−1; PO43−: 0.003 mg L−1; NO2: 0.001 mg L−1; NO3:0.005 mg L−1; NH4+: 0.001 mg L−1; DOC: 0.100 mg L−1). We considered only the first 3 m of the depth profiles for pH, salinity and temperature. Square brackets indicate the number of samples for each period.
ParameterUnits1 (15)2 (141)3 (30)
Chlaμg L−10.95 ± 0.401.24 ± 0.883.73 ± 1.71
SPMmg L−11.87 ± 0.152.09 ± 0.462.47 ± 0.31
ISM%37.8 ± 2.942.1 ± 11.948.5 ± 4.3
Zsdm8.8 ± 1.96.7 ± 2.77.3 ± 1.5
pHn/and8.2 ± 0.28.1 ± 0.1
Salpsu35.5 ± 0.433.2 ± 2.629.7 ± 0.7
Temp°C13.1 ± 0.218.6 ± 1.115.9 ± 0.5
Si(OH)4mg-Si L−11.380 ± 0.4840.340 ± 0.0910.630 ± 0.064
PO43−mg-P L−10.606 ± 0.2530.052 ± 0.1260.018 ± 0.019
NO2mg-N L−10.354 ± 0.0750.027 ± 0.0390.016 ± 0.013
NO3mg-N L−12.689 ± 1.1750.057 ± 0.1200.096 ± 0.098
NH4+mg-N L−1bd0.009 ± 0.0040.005 ± 0.002
DOCmg-C L−1nd1.43 ± 0.942.98 ± 1.07
POCmg L−10.28 ± 0.080.37 ± 0.130.33 ± 0.16
PONmg L−10.07 ± 0.000.07 ± 0.030.04 ± 0.03
Table 3. Pearson’s correlations between Pseudo-nitzschia spp. abundances (P-N in cells L−1), particulate DA (pDA in μg L−1), and cellular DA (cDA in pg DA cell−1) concentrations with several environmental parameters during 10 October 2007 and 14 July 2009.
10 October 2007
pDAChlaSPMZsdpHSalSi(OH)4
P-N0.92 **0.77 *0.83 *−0.75 *0.20−0.09−0.49
pDA 0.670.78*−0.690.070.04−0.44
cDA 0.360.28−0.22−0.23−0.620.26
TempPO43−NSi(OH)4/PO43−Si(OH)4/NPOC
P-N0.16−0.020.00−0.72 *−0.71 *0.87 *
pDA0.32−0.320.02−0.71 *−0.690.84 **
cDA0.83 *0.510.09−0.240.00−0.24
14 July 2009
pDAChlaSPMZsdpHSalSi(OH)4
P-N−0.080.110.66--−0.460.01
pDA −0.24−0.15--0.670.00
cDA −0.06-0.70--0.500.00
TempPO43−NSi(OH)4/PO43−Si(OH)4/NPOC
P-N0.28−0.33−0.59−0.230.75 *0.03
pDA−0.520.020.21−0.03−0.280.48
cDA−0.430.710.96 **−0.16−0.92 **0.22
* significant at p < 0.05 and ** significant at p < 0.001.
Table 4. Percentage of pixels belonging to each cluster over the study area, obtained from classification images derived from the MERIS images used in this study.
DateriaCluster#1Cluster#2Cluster#3
25 July 2007Vigo98.530.920.55
Pontevedra99.700.300.00
10 October 2007Vigo97.702.300.00
Pontevedra97.931.480.59
9 July 2008Vigo95.404.040.55
Pontevedra96.143.570.30
22 July 2008Vigo87.4111.880.71
Pontevedra90.069.790.15
27 May 2009Vigo98.071.580.35
Pontevedra98.981.020.00
14 July 2009Vigo70.5929.010.41
Pontevedra71.2028.510.29
Table 5. Results of the generalised additive mixed models used to model the Pseudo-nitzschia spp. as a function of biotic and abiotic parameters. For linear covariates the parameter estimates with SE and t-values are given. For the additive covariate the estimated degrees of freedom (edf) and F-value are provided. Periods 1 (spring downwelling), 2 (summer), and 3 (autumn downwelling) corresponds to May, July, and October.
PeriodEstimatesSEt
1−6.85±2.83−2.42
23.01±1.721.74
33.73±1.822.05
Linear effectsEstimatesSEt
Sal0.21±0.063.39
chla0.89±0.312.90
Additive effectsedfF
Si(OH)4/N3.083.61
Table 6. Results of the best generalised linear mixed model that shows the effect of abiotic and biotic parameters on particulate domoic acid (pDA) in our database. Station was included as random effect. Parameter estimates with SE and t-values are given. Periods are the same as in Table 4.
PeriodEstimatesSEt
1−0.120.290.42
20.090.230.39
30.790.263.07
ParametersEstimatesSEt
POC0.700.292.42
NO3−0.380.17−2.23
PO43−0.690.223.15
Si(OH)4/N−0.180.07−2.51

