Removal of >10 µm Microplastic Particles from Treated Wastewater by a Disc Filter


Department of Civil Engineering, Aalborg University, Thomas Manns Vej 23, 9220 Aalborg Øst, Denmark
*
Author to whom correspondence should be addressed.
Water 2019, 11(9), 1935; https://doi.org/10.3390/w11091935
Submission received: 7 August 2019
/
Revised: 10 September 2019
/
Accepted: 15 September 2019
/
Published: 17 September 2019
(This article belongs to the Section Wastewater Treatment and Reuse)
Abstract
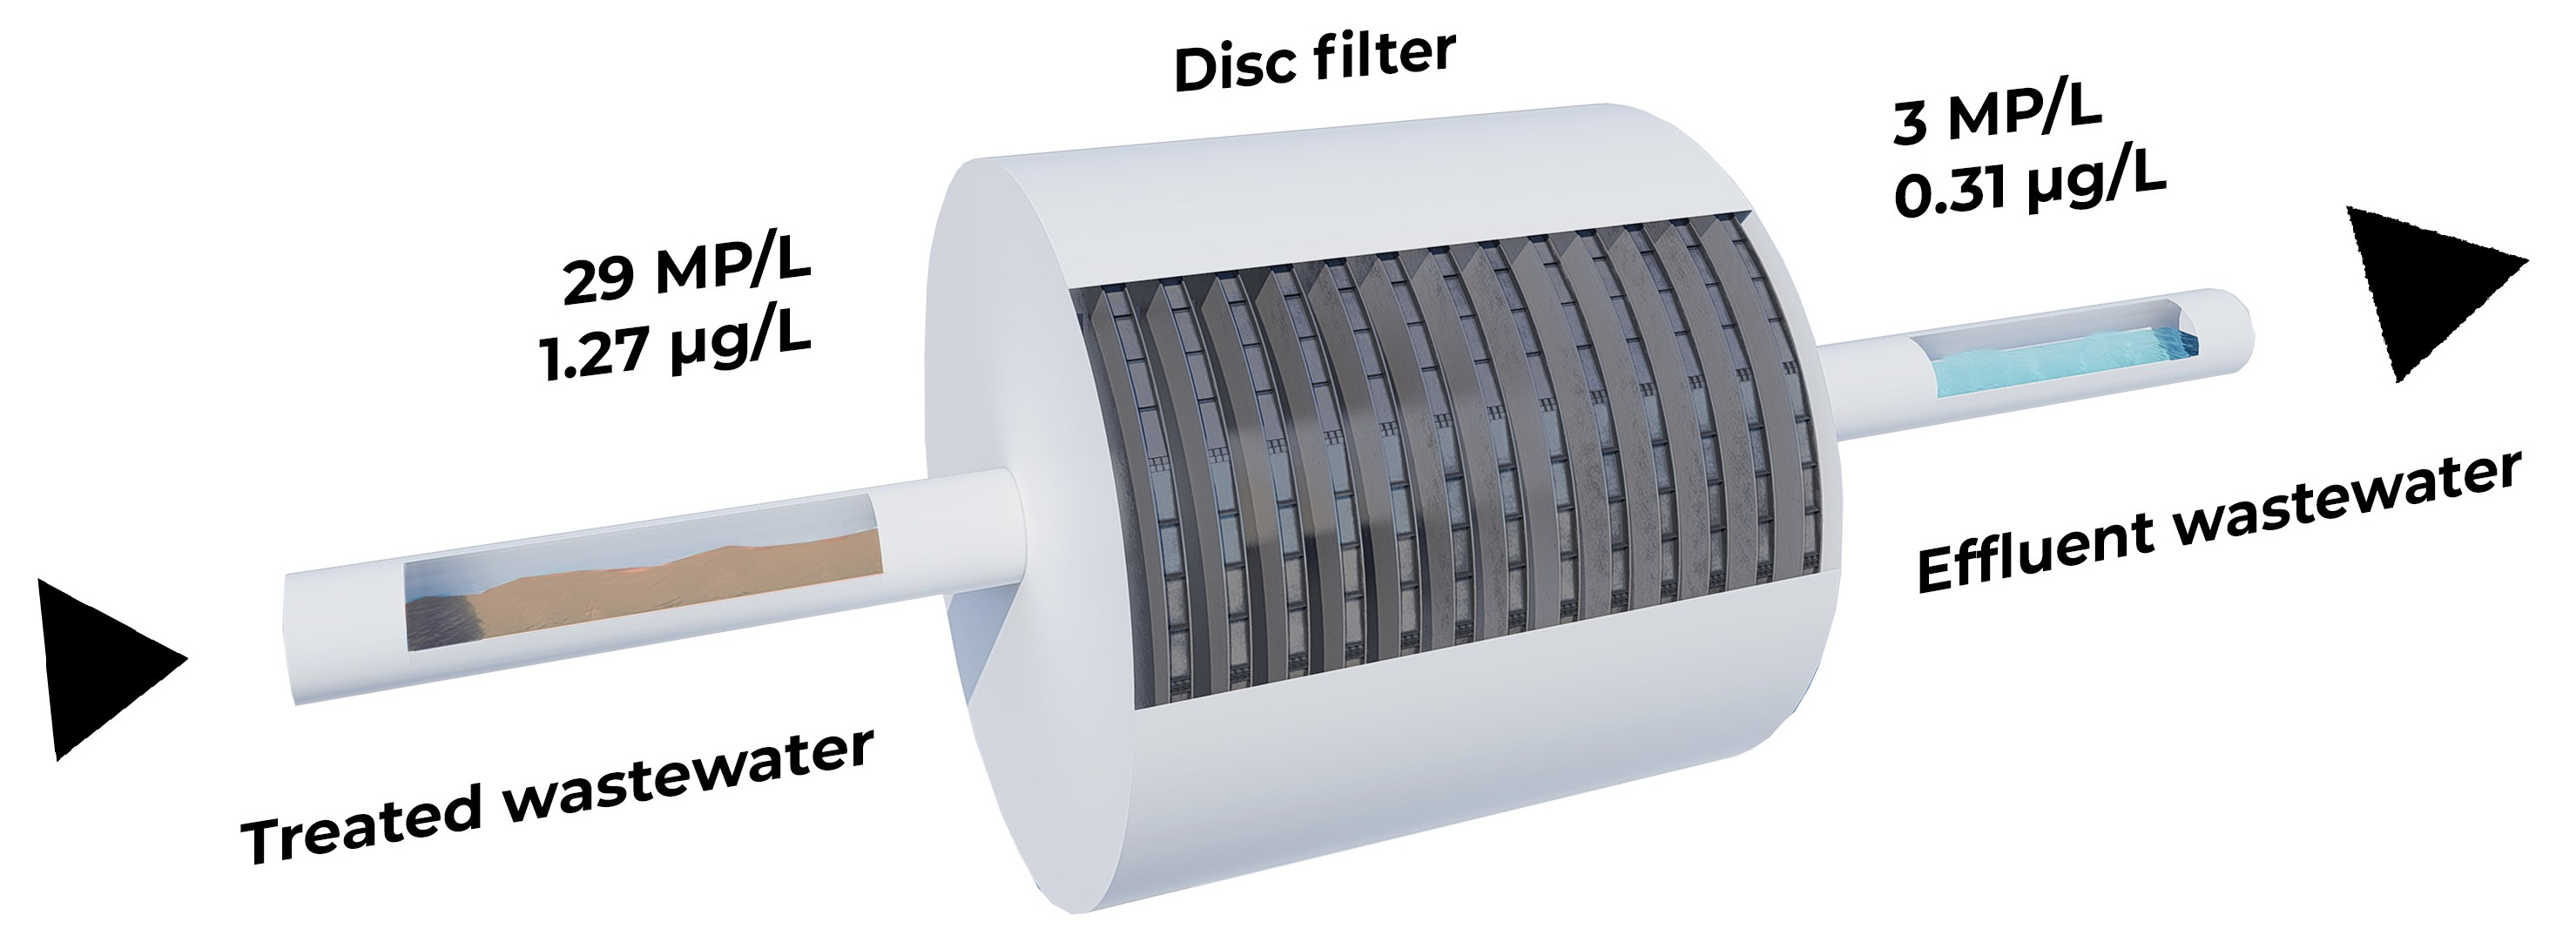
:In this paper, we evaluate the performance of a disc filter that retains microplastic (MP) particles from treated wastewater. A focal plane array-based Fourier transform infrared imaging technique enabled MP quantification and an in-house-built software (MPhunter) facilitated automatic analysis of the obtained infrared spectra. The disc filter retained 89.7% of particles, and 75.6% of their mass. This removal efficiency is comparable to removal rates reported by previous studies. However, the presence of an unexpectedly large number of MP particles whose size substantially exceeded the pore size of the disc filter suggests that particles could either bypass or pass through the filter mesh, somewhat diminishing the performance of the filter. The concentration of MPs in the effluent was 3 MP/L, corresponding to an estimated mass concentration of 0.31 µg/L. The annual MP discharge from the studied WWTP after the disc filter was estimated to be 1.1 kg in 2017. It was hence not a significant contributor to MP emissions in Denmark. Although the operation of the disc filter seems to have been disturbed, it nonetheless achieved a high MP removal rate. Therefore, we conclude that it is a suitable technology to decrease the concentration of discharged MPs in wastewater effluents.

1. Introduction
Microplastic (MP) pollution has gained increasing attention in recent years. Microplastics (MPs), plastic particles in the size range of 1–5000 µm, are often divided into two types: primary MPs are produced as raw material for plastic production or as additives to personal care products, while secondary MPs are formed by fragmentation of larger plastic items by, for example, UV-light and mechanical friction [1,2]. Both primary and secondary MPs can spread over substantial distances by wind or currents due to their low weight and small size [3]. Consequently, studies have reported the ubiquitous occurrence of MPs in marine, freshwater and terrestrial habitats from the tropics to the arctic regions [4], and the estimated mass of 0.3–5 mm-sized MPs floating in the world’s oceans alone is 7000–35,000 tons [5,6]. The increase of plastic waste accumulating in landfills and the environment is expected to increase in the coming years [7], and this entails the rise of MP concentrations in the ecosystem as well.
The widespread presence of MPs is of concern due to their potentially harmful impacts on the various organisms they encounter [8]. Although current knowledge gaps about the toxic effects of MPs hamper understanding of the significance of MP impact on the ecosystem [9], studies have shown that they can damage the organisms physically and chemically upon ingestion [10]. As such, MPs can cause malnutrition and interfere with the organisms’ biochemical processes by introducing potentially toxic compounds into the body, through either leaching plastic additives or acting as vectors for organic pollutants [11].
The principal sources of MPs are yet to be ascertained, but studies have proposed that transportation, e.g., the abrasion of car tires, erosion of painted surfaces as well as degradation of plastic surfaces, and unconfined plastic litter contribute to MP pollution [12,13]. Numerous studies have scrutinized the role of wastewater treatment plants (WWTPs) as an urban point source of MPs [14,15,16]. That is because WWTPs collect vast volumes of wastewater of various origin such as industrial plants and households, along with stormwater runoff, which potentially contains considerable amounts of MPs [13,14]. Although research has shown that WWTPs remove 96–98% of the inflowing MPs [17,18,19], the limited percentage of MP particles discharged to receiving water bodies adds up to a substantial amount, owing to the large flux of wastewater [14,15]. For instance, annual wastewater production in Denmark alone is approximately 700 million m3 year−1 [20]. Therefore, further treatment of effluent wastewater might be required to decrease the amount of MPs released by certain WWTPs to the environment.
CTo increase a WTTP’s effectiveness at trapping MPs, a filtration step can be added. For instance, disc filters are already in use at certain WWTPs as a final polishing step, removing particles and associated pollutants from biologically treated wastewater to ensure that the quality of effluent wastewater meets regulatory requirements [21,22]. Disc filters consist of a stack of round filter meshes in a closed tank [21]. The filter mesh is a woven material, typically polypropylene, polyester or polyamide, of 10−40 µm pore size. Particles from wastewater are retained by the filter mesh and by a sludge cake that forms progressively on the filters surfaces [21,22]. The cake is periodically removed by high-pressure back-flushing as the increasing sludge deposit slows down the filtration process [22].
The goal of the present study was to investigate the efficiency of a disc filter concerning MP removal. To this end, the quality and quantity of MPs in water prior to disc filter treatment was compared with MPs that had passed through a disc filter.
2. Materials and Methods
2.1. Sampling
We sampled water at the wastewater treatment plant operated by Billund Vand and Energi A/S in Grindsted, Denmark. In 2017, the treatment plant received an average of 10,040 m3 day−1 wastewater from households and industries with a chemical oxygen demand (COD) of 571 mg L−1. Influent wastewater is treated by primary sedimentation, activated sludge processes for biological nutrient removal, and secondary clarification. The concentration of suspended solids (SS) of secondary clarifier effluent is typically 20 mg L−1. This effluent undergoes further treatment by a Hydrotech HF2220 disc filter that consists of 13 discs. Each disc has a polyester mesh of 18 µm pore size and a capacity of 1200 m3 h−1. The disc filter effluent contains 3–8 mg L−1 SS.
In order both to estimate the discs’ effectiveness at filtering out solids and to collect solid material for further analysis, we first filtered secondary clarifier effluent before it entered the disc filter (this water will be described as “before filter,” or BF). Water was pumped into a custom-made large-scale water-sampling device [23]. The device was made of stainless steel to decrease possible plastic contamination deriving from the equipment. It consisted of a housing that contained a single, removable 10 cm diameter, 10 µm pore size stainless steel mesh to filter out solids from the water. We stopped sampling when three filters had clogged. The combined mass of material on these three filters allowed sufficient material for the subsequent MP analysis. By collecting material on three filters, we furthermore covered a couple of hours of continuous outflow, which we deemed would average out short term variabilities in the MP content of the water. Disc filter effluent was sampled by the same approach (“after filter,” or AF).
2.2. Sample Preparation
MPs were then extracted from the solids thus collected. Extraction involved a purification procedure based on the method described in [23]. In brief, to detach the gathered solids from the filters, the filters were sonicated into filtered demineralized water containing 0.15 g L−1 sodium dodecyl sulfate (SDS). The resulting suspensions were incubated first with cellulolytic enzymes and then with proteolytic enzymes to eliminate most organic materials from the sample matrix. Remaining organic matter was oxidized by hydrogen peroxide catalyzed by iron (II). Next, MPs were separated from the inorganic particles in a zinc chloride solution (1.70 g cm−3). Finally, the extracted MPs were gathered in 5 mL 50% ethanol.
In order to minimize MP contamination from the equipment used for sampling and sample preparation, all utensils were flushed with Milli Q water three times before use. Whenever possible, we used tools made of glass or metal, or coated with PTFE, instead of plastic, and then excluded the material PTFE from the analysis. Sample containers were covered with aluminum foil to reduce airborne contamination, and steel filters were muffled at 500 °C before usage.
2.3. Analysis
A Cary 620 FT-IR microscope was coupled with a Cary 670 IR spectroscope (Agilent Technologies, Santa Clara, CA, USA), thus enabling an FPA-based µFT-IR imaging technique to be used to analyze the extracted particles. We deposited three 200 µL aliquots from each sample (that is, from the BF sample and from the AF sample) onto Ø13 mm zinc selenide transmission windows for analysis. Before each sample scan, we collected the IR background absorption by 120 co-added scans on a clean window in the spectral range of 3850–950 cm−1 at 8 cm−1 resolution. Subsequently, we scanned the entire area of all windows and collected spectra of the full windows by 30 co-added scans with the same settings as for the background scan.
We used a 25x Cassegrain objective, creating 3.3 µm pixel resolution on the 128 × 128 Mercury Cadmium Telluride (MCT) FPA detector in order to obtain spectra of the particles. Afterwards, we analyzed the collected infrared map with an in-house built software called MPhunter, which allows for the analysis of each pixel of the map [23]. The software applies Pearson correlations to compare the sample’s spectra to a database composed of 113 reference spectra, including six relevant natural materials and 32 polymer types (Table 1). It assigns the material with the highest correlation score to each pixel and re-constructs the particle based on the scores of adjacent pixels.
MPhunter also estimates the size and mass of the identified MPs as described in [19]. In short, the major dimension, defined as the particle’s longest axis, was measured directly, while the minor dimension was estimated based on the particle’s area and an assumption of elliptical particle shape. The mass was calculated from the density of the polymer and an assumption that the particle was of ellipsoidal shape. The software identified some 1-pixel areas as particles, but we considered these to be false positives and set a threshold of a minimum of three pixels to comprise a particle [23], resulting in a minimum particle length of 6.6 µm (longer axis). However, as the filter mesh used to collect the particles was 10 µm, the size limit of detection should be viewed as being 10 µm.
2.4. Statistics
We used the software R v3.5.1. [24] for statistical analysis. We executed all statistical tests on log-transformed data. We first assessed normality of the dataset with the Shapiro–Wilk normality test followed by three nonparametric tests, the Kruskal–Wallis H-test, Wilcoxon rank sum test and Dunn’s test [25] (as a post hoc test of the Kruskal–Wallis H-test) to evaluate significant differences between the samples. The significance level was 0.05 for all statistical tests.
3. Results
3.1. Removal Efficiency
Two hundred liters of wastewater was filtered before the disc filter (BF) and 1.6 m3 after the disc filter (AF). We identified 701 MPs in total in the triplicate aliquots of the BF sample and 560 MPs in the aliquots of the AF sample. As we quantified background contamination in the same laboratory, at the same time, and applied virtually identical sampling and sample treatment methods as well as quality assurance measures, the results of [23,26] led us to expect that approximately 6–8 MPs were likely to have derived from background contamination. Since the contamination rate was approximately 1%, we did not correct the data for contamination in further calculations.
Table 2 shows the calculated concentration of MPs in wastewater before and after the disc filter by both number and mass of particles, as well as the removal efficiency of the disc filter based on both parameters. The solids from the three filters of each sample were combined during sample preparation, resulting in one particle suspension from the BF and one from the AF sample. While three aliquots had been scanned from each sample, these do not represent true triplicates of the sampled waters, and the MP concentrations were hence calculated by summing up the number of MPs and their estimated mass.
3.2. Polymer Composition of MPs
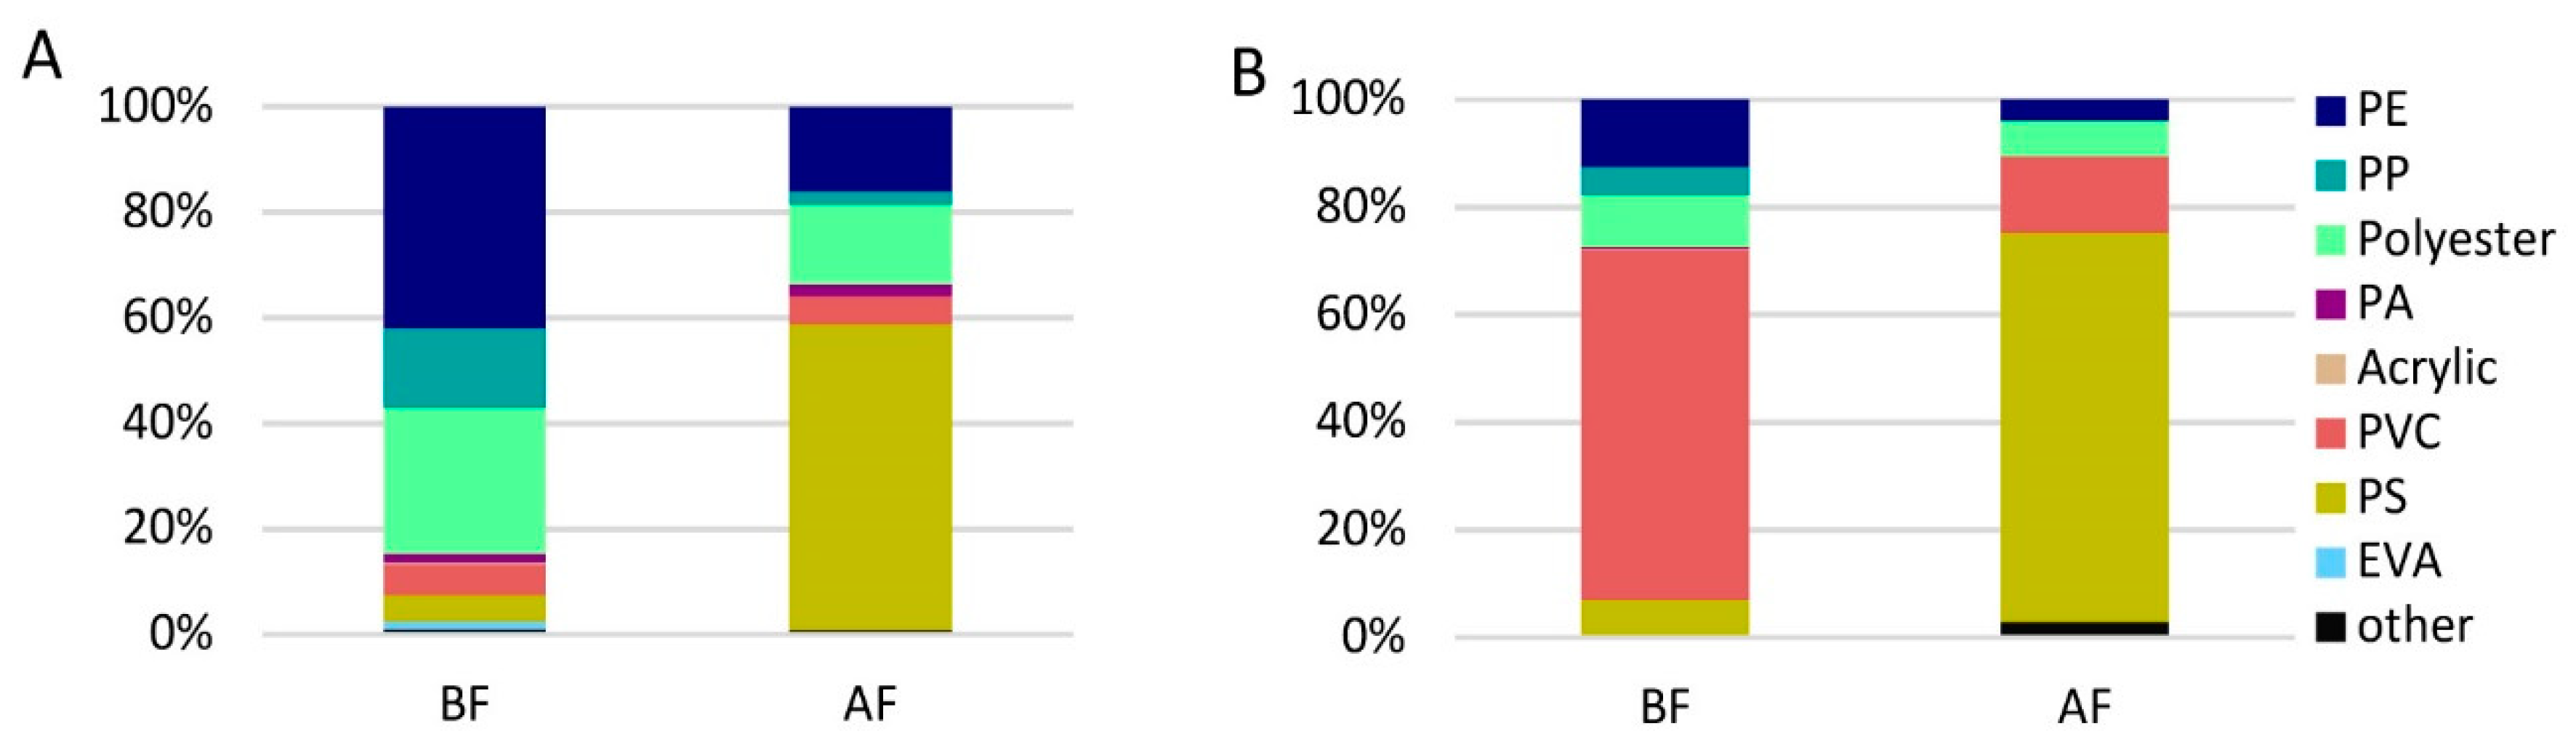
Figure 1 shows the distribution of polymers in the BF and AF samples based on the number and mass of particles. In both regards, the relative fraction of all polymer types of the BF sample differed from those of the AF sample. In the BF sample, polyethylene (PE) was the most abundant (42%), followed by polyester (28%). Only 6% of the BF sample’s particles were PVC, yet PVC contributed 65% to this sample’s MP mass. Fifty-eight percent of the AF sample’s particles were polystyrene (PS), which also comprised 75% of the sample’s mass. The concentration of PS was 90 ng L−1 in the BF sample, corresponding to 1 MP L−1, which is lower than the 220 ng L−1 and 1.6 MP L−1 measured in the AF sample. The larger deviation by mass concentration than by number of particles stems from differences in the size of particles before and after the filter. The relative fraction of all the polymer types by number of particles was different from the fraction by mass in both samples, showing no clear correlation based on either parameter.
3.3. Particle Size
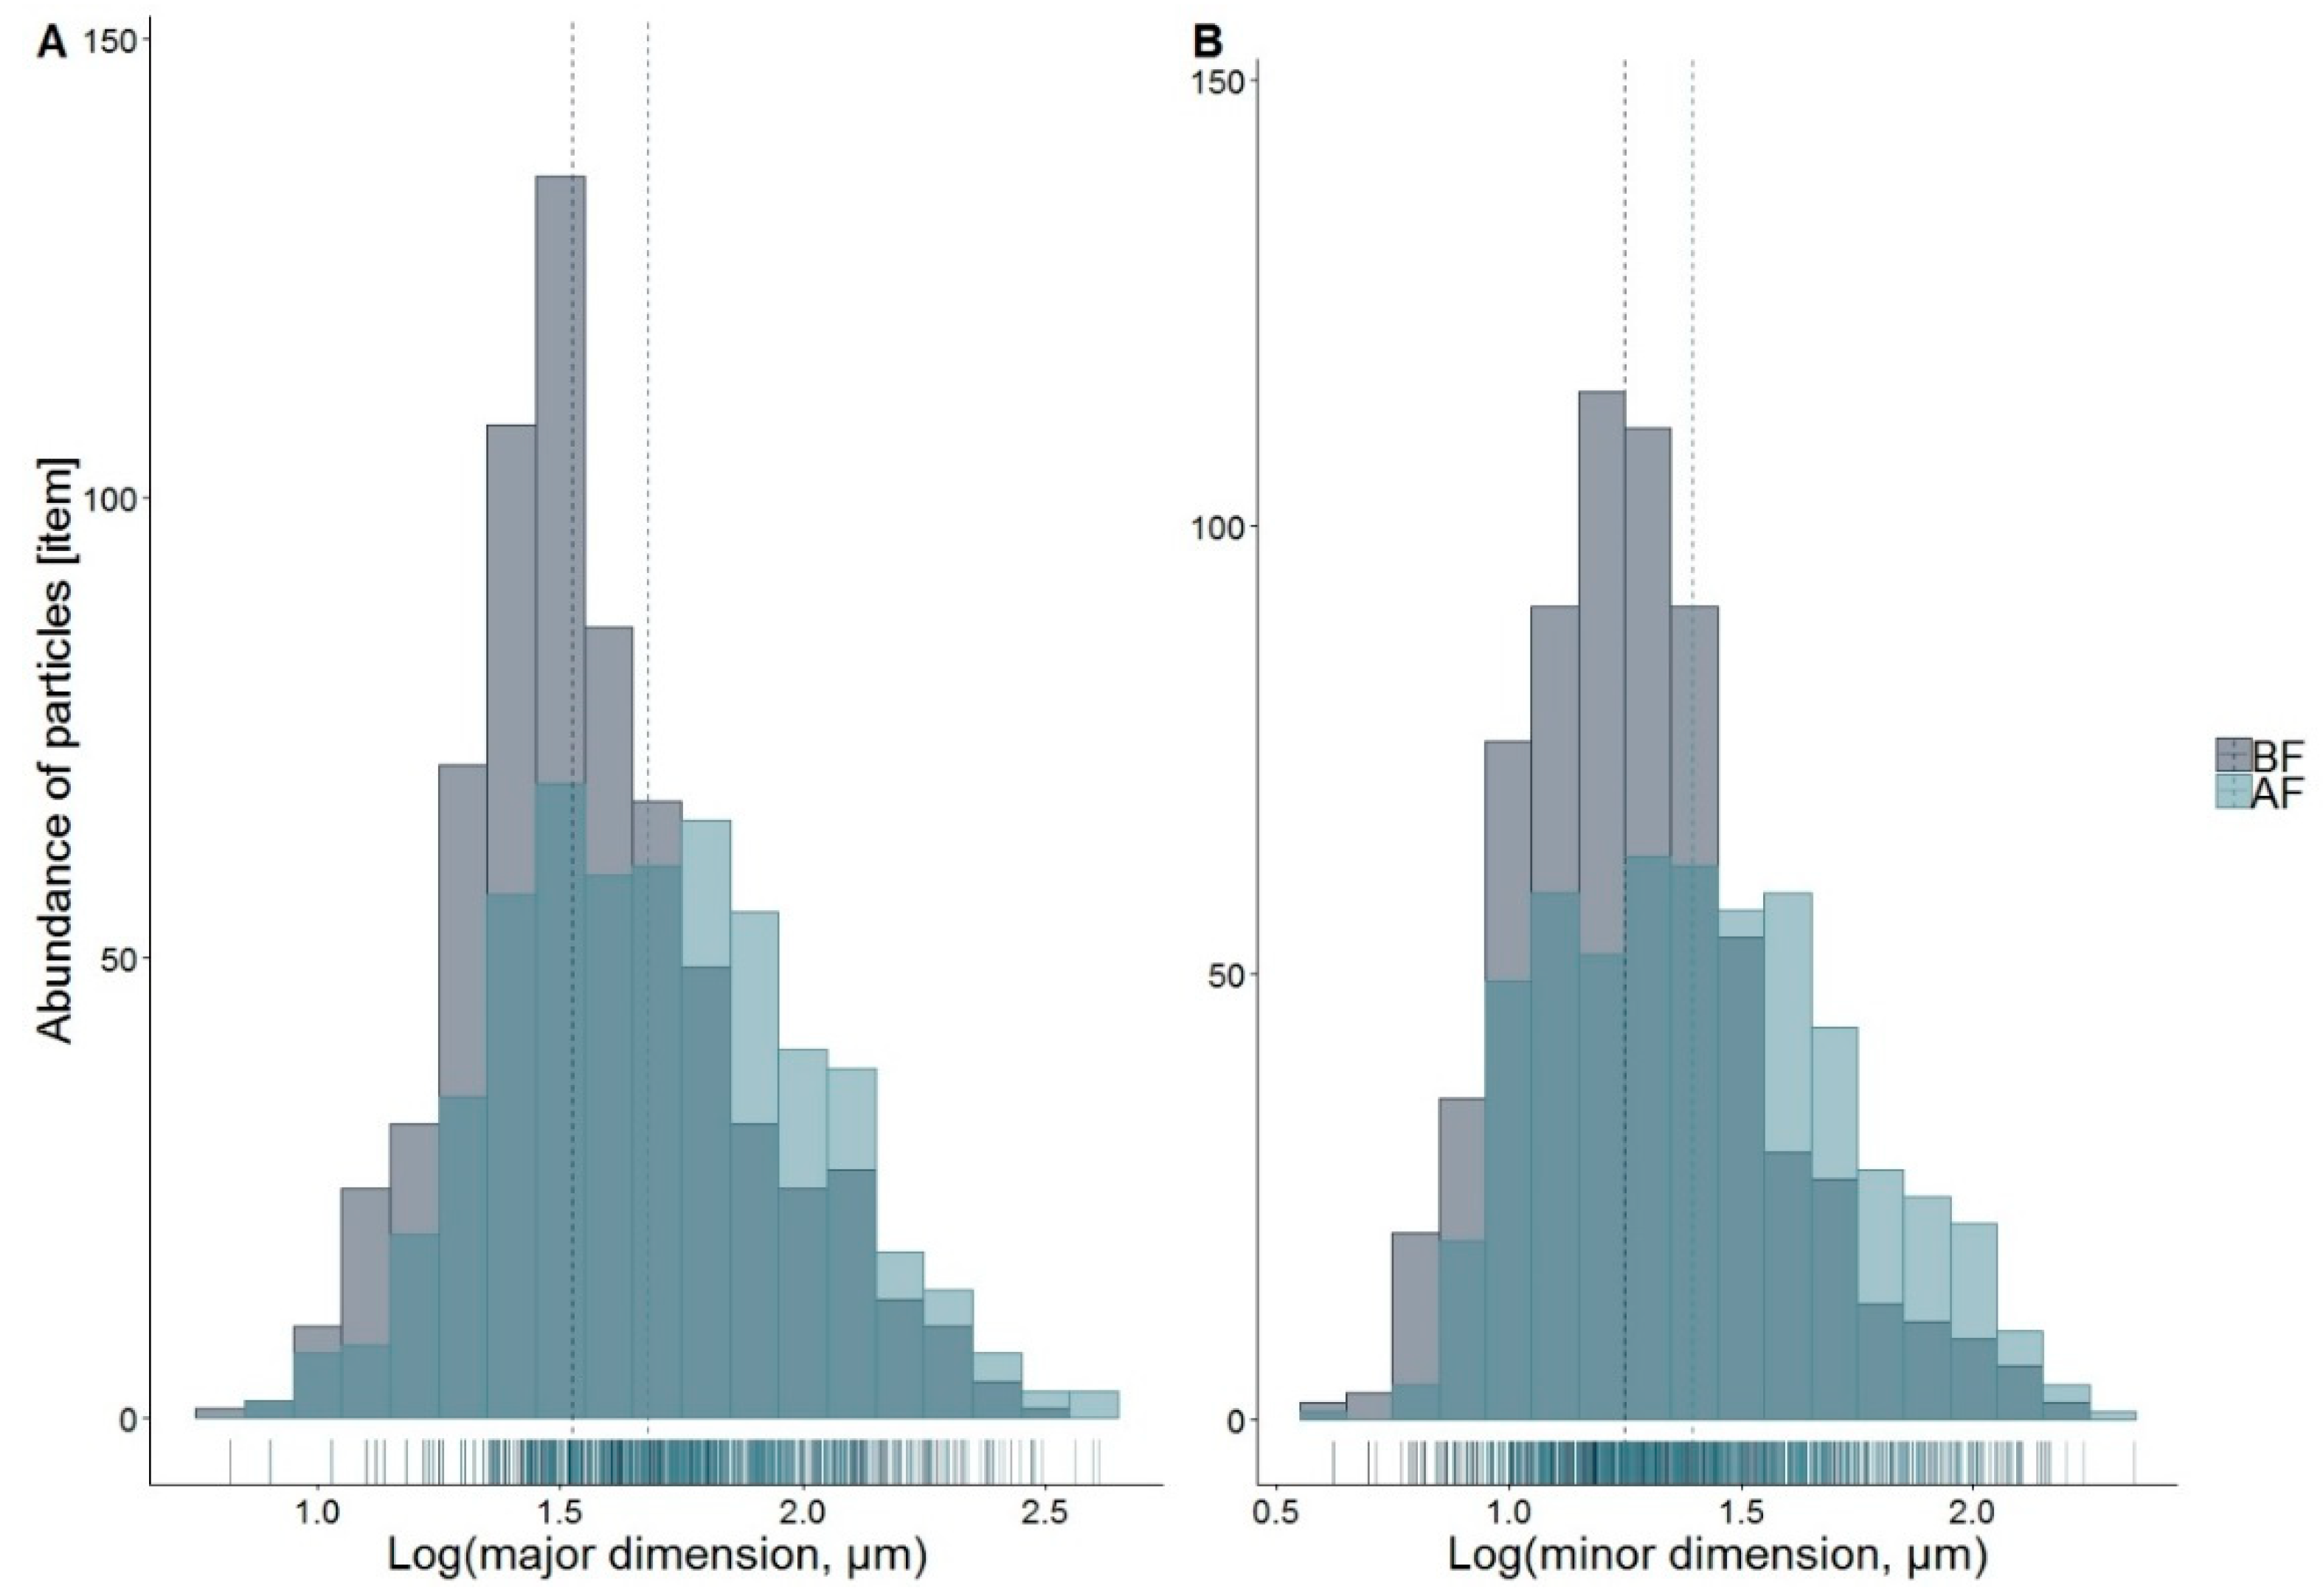
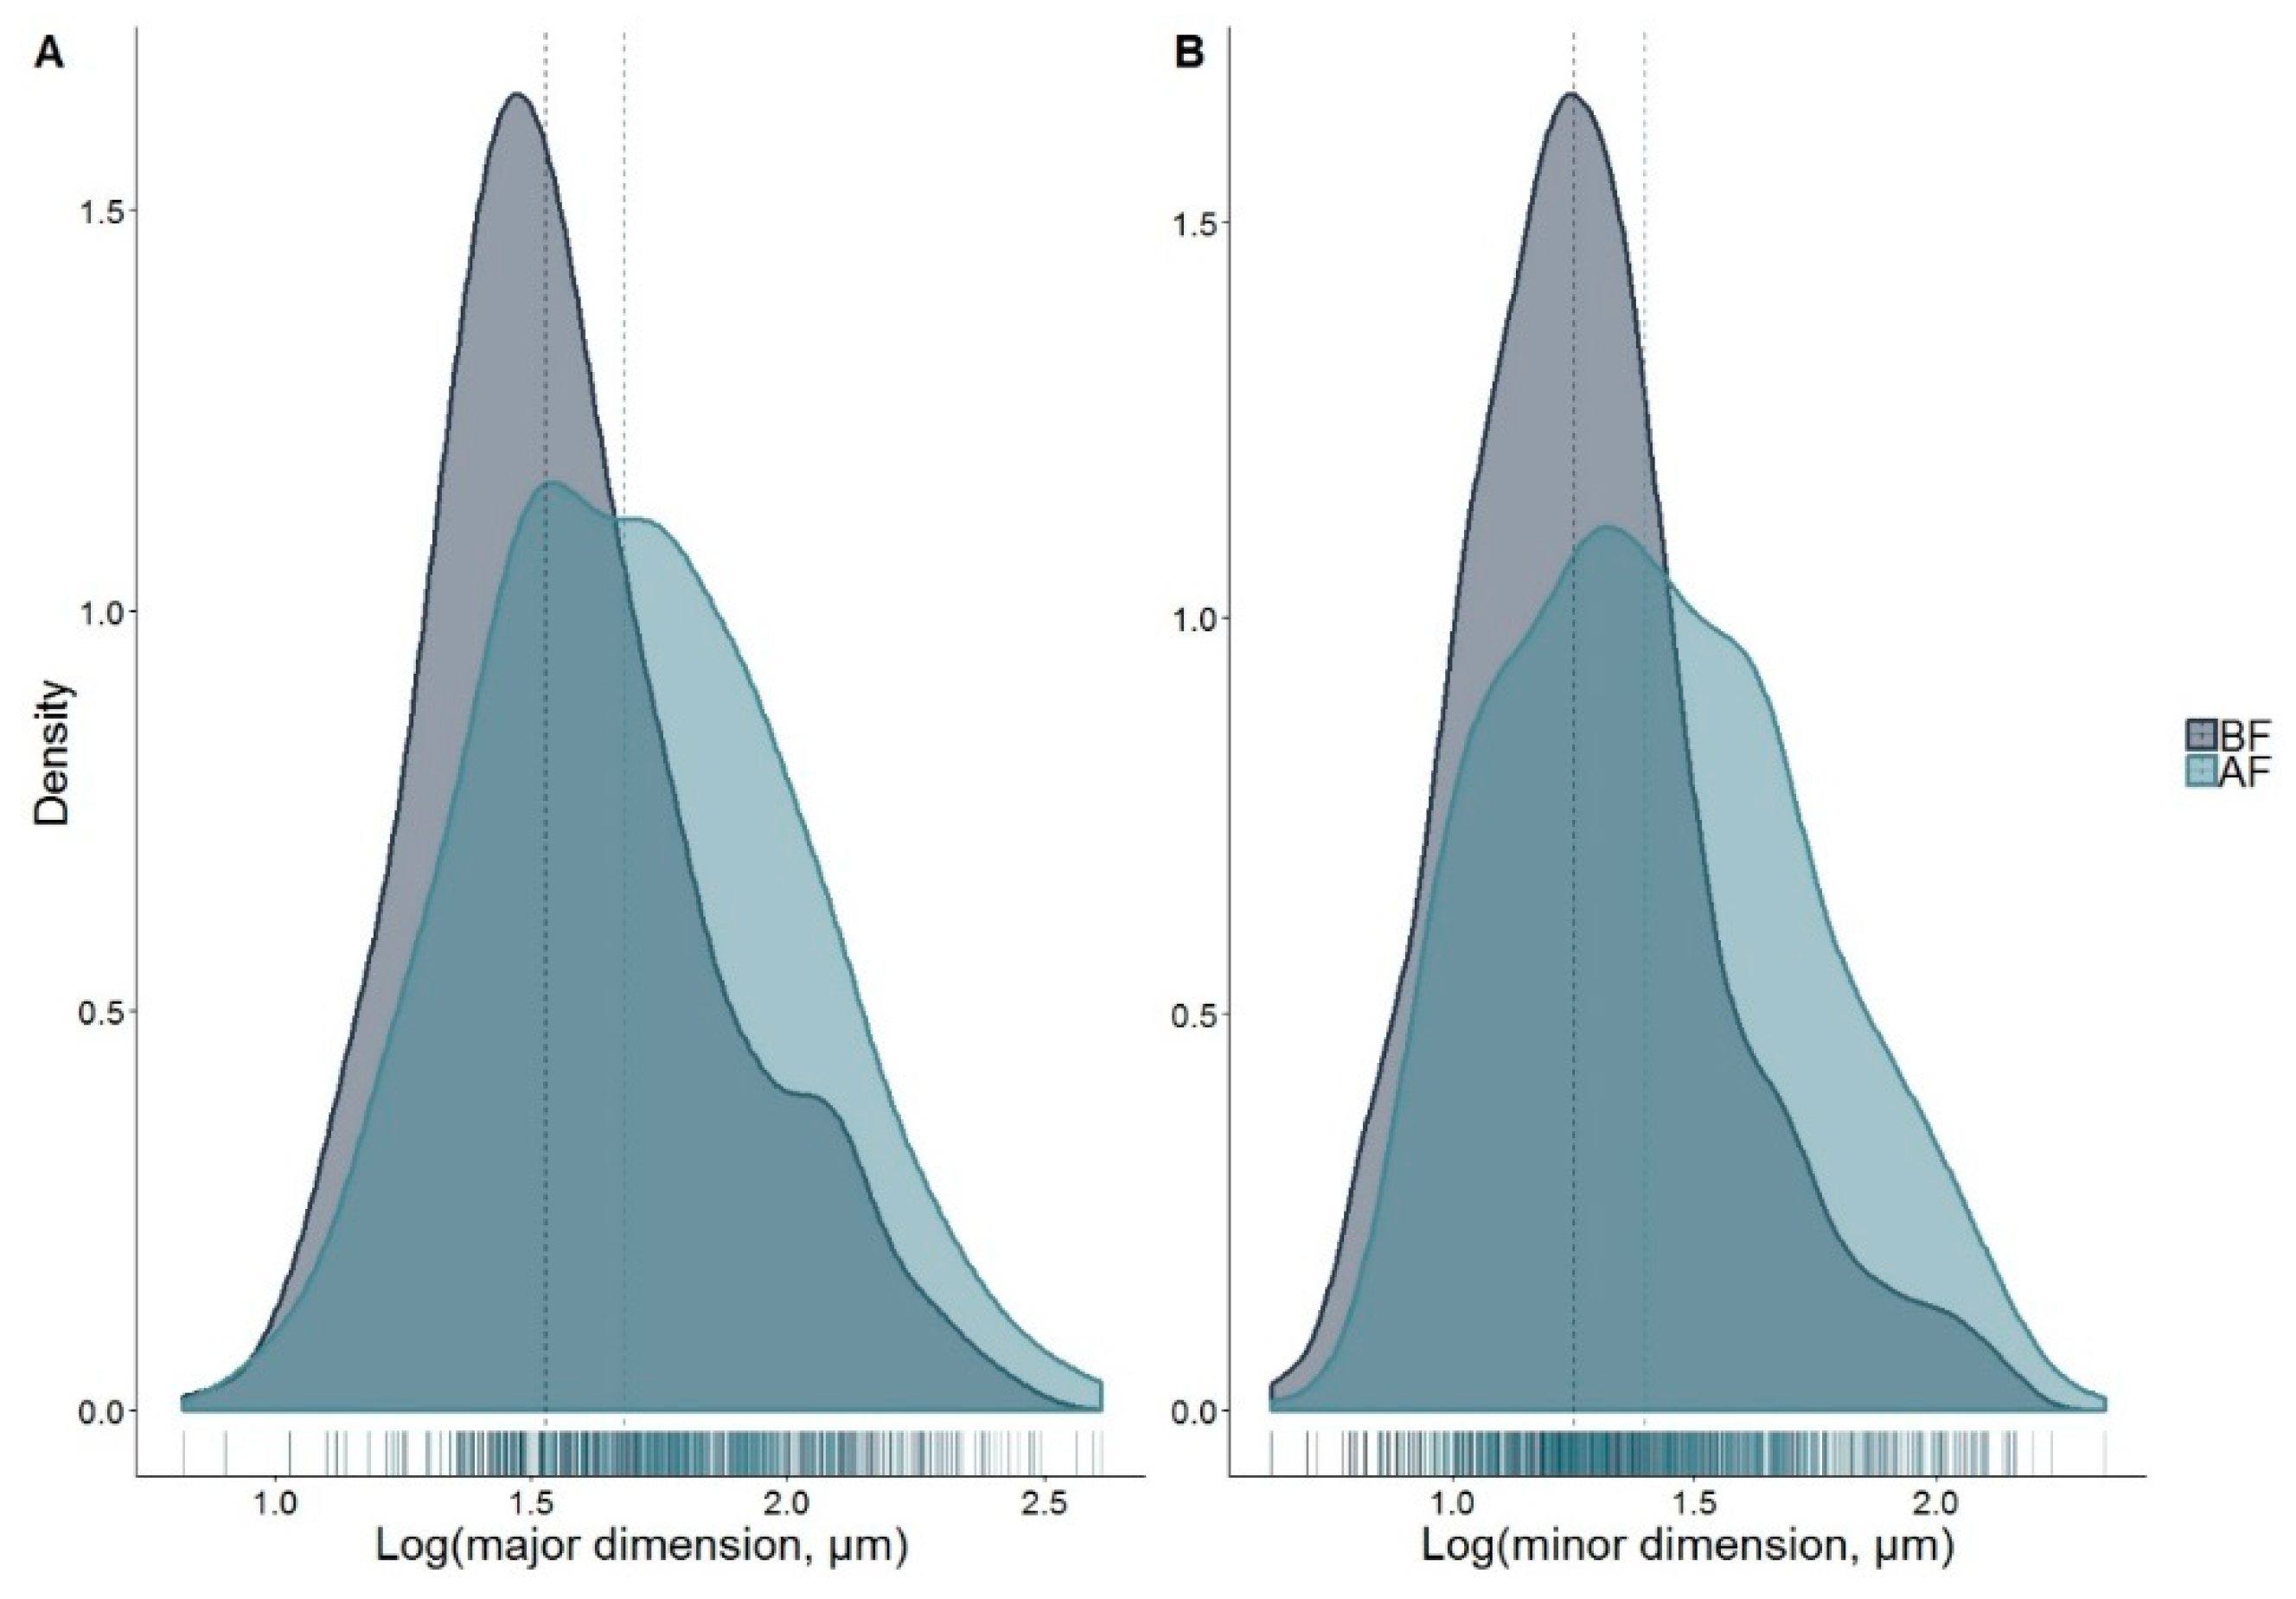
We describe the size of a particle by its major and minor dimensions, respectively specified as the particle’s longest axis and the longest axis perpendicular to that axis. Data on the major and minor dimension of both BF and AF samples were positively skewed, highlighting that small particles were more abundant than large ones in both samples (Figure 2). Table 3 summarizes parameters that describe particle size, showing that MPs in the AF sample were larger than in the BF sample. As the data was not normally distributed (p = 2.71 × 10⁻¹⁰ for the log major and p = 1.00 × 10⁻¹² for the log minor dimension), we performed the Wilcoxon rank sum test to determine whether the observed dimensional differences between the BF and AF samples were significant. The test resulted in p-values of 1.71 × 10⁻¹⁴ for the major and 6.54 × 10⁻¹⁵ for the minor dimension, indicating that the difference in the size of MPs in the two samples was significant. Figure 3 demonstrates that the dissimilarity arises from a greater proportion of particles in the AF sample that have larger major and minor dimensions, compared to the BF sample. As the particle’s minor dimension determines whether it can pass through the filter mesh, the disc filter should have retained MPs whose minor dimension exceeded the 18 µm pore size of the mesh. Nevertheless, microplastic particles larger than 18 µm (minor dimension) were present in the AF sample.
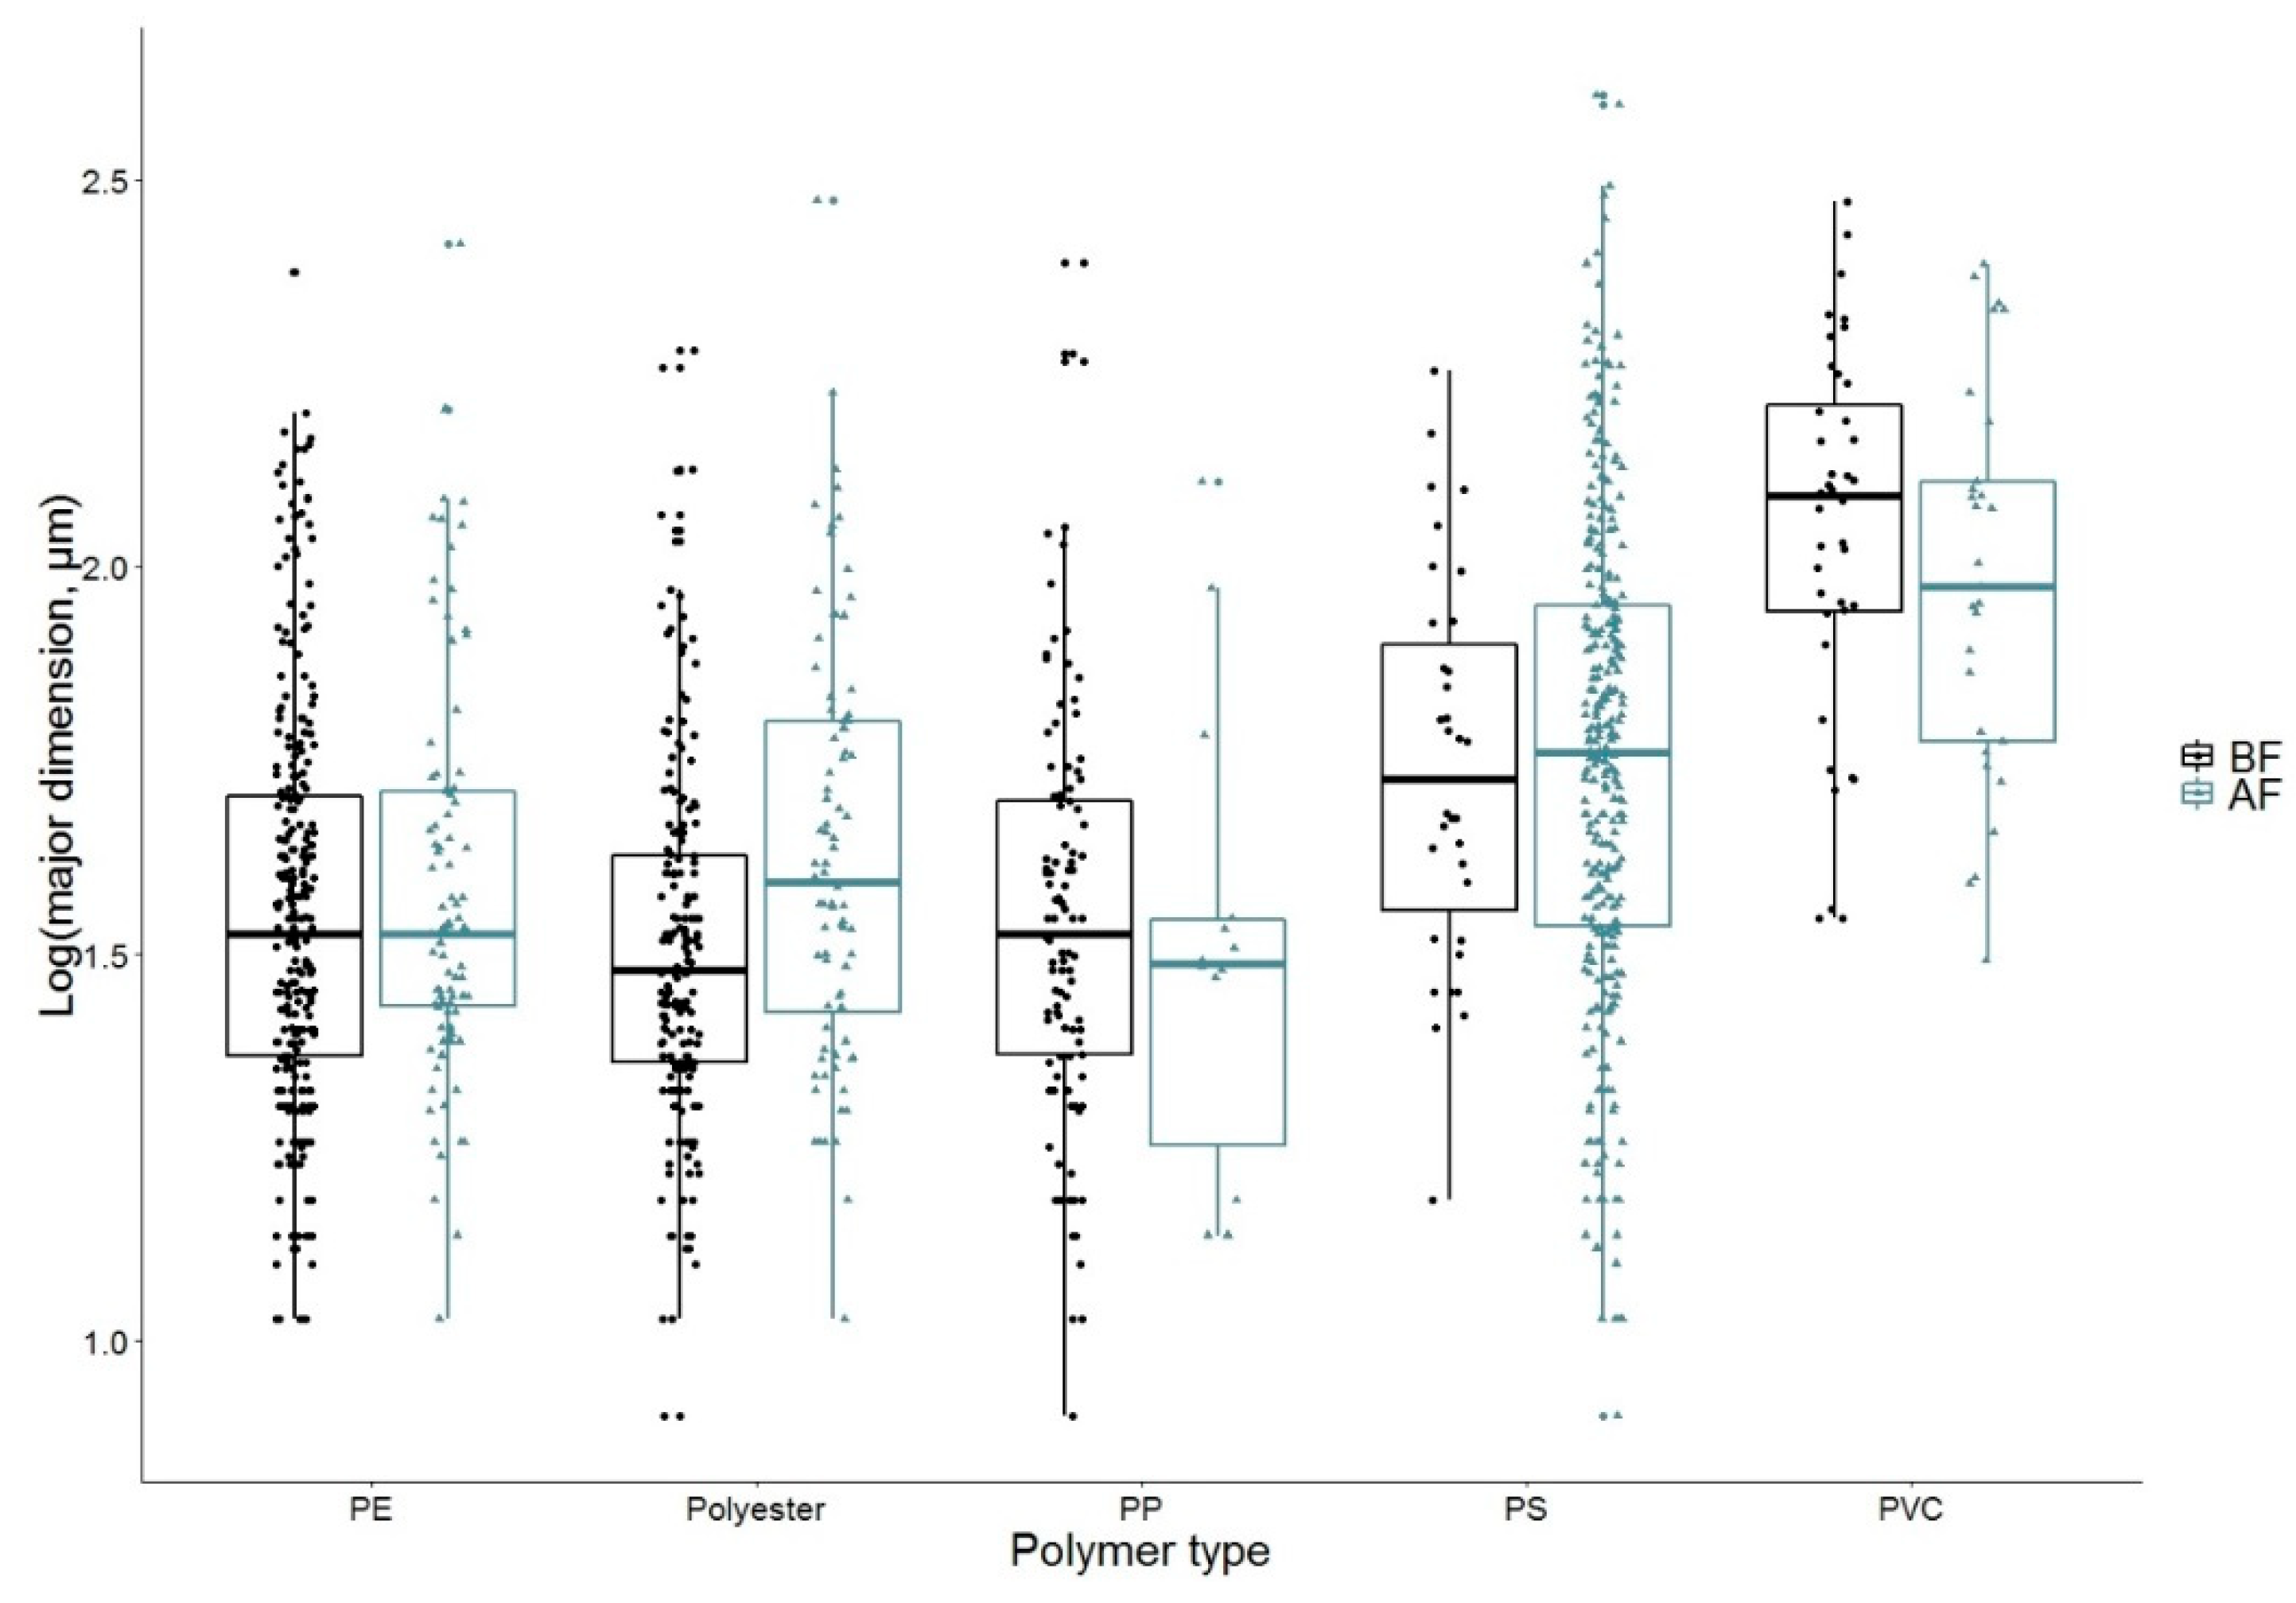
Figure 4 shows the distribution characteristics of the logarithm of the major dimension for the most copious polymer groups in the BF and AF samples. PVC and PS particles had the largest median major dimension in both samples. After performing the Kruskal–Wallis H-test (p = 2.2 × 10⁻¹⁶), the Dunn’s test showed that PVC and PS particles were significantly larger than MPs of other polymer groups, in both BF and AF samples. Furthermore, the size of PVC particles was significantly different from the size of PS particles. Nevertheless, the BF sizes of PE, PP, PS, and PVC particles before the filter were not significantly different from their AF sizes, as the Wilcoxon rank sum tests resulted in p-values exceeding the significance level. The exception was polyester: the same test yielded p = 3.39 × 10⁻⁴ for polyester, which indicates a difference in the sizes of BF and AF polyester samples that rise to the level of statistical significance.
4. Discussion
4.1. Removal Efficiency of the Disc Filter
The studied disc filter substantially decreased the concentration of MPs in effluent wastewater. However, other studies have shown that disc filters of similar mesh size can achieve removal rates up to 99% of MP particles [16,22], which is higher than our observed 89%.
We found higher MP concentrations in the effluent from the filter, compared to other studies that report 7 × 10⁻³ MP L−1 and 0.03 MP L−1 [21,22]. On the one hand, the size of the studied MPs can lead to such differences. For instance, [21] investigated the removal of MPs > 300 µm by a disc filter of 15 µm mesh size. Given that the concentration of MPs increases exponentially with decreasing size, one is prone to find fewer large particles than small ones, per unit volume. As the sampled volumes of wastewater are similar in the two studies, the dissimilarity in the measured MP concentrations is presumably associated with the different sizes of the examined MPs.
In addition, some analytical techniques are more effective at identifying MP particles than others. Although [22] addressed similar size ranges of particles, they reported a noticeably lower MP concentration in effluent wastewater after disc filters of 10 µm and 20 µm mesh size. Applying light microscopy in their study as an identification technique could have resulted in underestimating MP concentrations, as this approach is prone to higher uncertainty as particle size decreases [27]. The identification method used in the present study (imaging-µFTIR) can identify the material composition of particles down to the size of 10 µm more precisely and it is widely recognized as a suitable technique for analysis of small MPs [19,23,28,29,30].
4.2. Particle Size
The AF sample contained MPs that were larger, in both their major and minor dimension, than the mesh size of the disc filter. Studying the removal of nematode eggs, [31] found that eggs larger than the pore size of the disc filter could pass through the mesh. This can be associated with the flexible nature of the filter cloth. Namely, high backflush pressure can distort the mesh and press through particles greater than the pore size of the mesh [29]. It is also plausible that proper oriented and slender MPs with a diameter (minor dimension) less than 18 µm can pass through the mesh, even though their length (major dimension) exceeds that threshold [32]. However, a more likely explanation for the presence of AF MPs greater than the mesh size in both dimensions is that the specific filter at the studied WWTP was somewhat incapacitated. The filter mesh might have been faulty due to the continuous mechanical stresses it is subject to, which wears out the fabric causing disruptions that allow larger particles to pass through, or perhaps unintended bypass of wastewater has decreased the filter’s performance [32].
The size of MPs of the various polymer groups is not significantly different in the BF and AF samples, except for polyester. The differing size of polyester MPs can be traced back to the decreased number of small particles in the AF sample, compared to the BF sample, possibly owing to cake filtration. Another probable explanation is that polyester fibers shed from the filter cloth and thus were among the large polyester MPs we collected from the AF sample. As fibers are rather long in their major dimension compared to the minor dimension, the ratio of the two dimensions is expected to differ in the two samples in that case. However, the median of the ratio of the polyester particles in the BF and AF sample was principally the same (data not shown), which confutes the assumption.
4.3. Polymer Composition
Polyester, PE and PS were the dominating polymer types in both BF and AF samples corresponding to other studies finding MP particles mostly of these polymers in effluent wastewater [14,18,22]. They also reported larger fractions of PA and acrylic particles compared to our study, which can be related to the variation of wastewater.
The noticeably greater fraction of PVC by mass than by particle number in the BF sample can be related to the large size of the particles and the higher density of the material, as these two parameters were used for mass estimation. For the same reason, the larger size of PS particles also influenced their observed large mass fraction in the AF sample.
The identified MPs in both the BF and AF samples belong to the same polymer groups, albeit the proportion of the groups, relative to each other in each sample, varied by either mass or number of particles. Furthermore, the concentration of PS particles was larger in the AF sample than in the BF sample. As no sources of wastewater or stormwater treated by the studied WWTP are known to be sources of PS, the natural variation of wastewater might account for the higher abundance of PS in the AF sample, as well as for the different proportions of the other polymer groups between the BF and AF sample. Because the AF and BF samples were taken consecutively and not contemporaneously, even the short time-lag could have caused such a difference, owing to the considerable variability of wastewater quality.
4.4. The Role of Disc Filters in MP Removal
Extrapolating from the concentration of MPs in the sampled wastewater and the average wastewater flow in 2017, the disc filter at the studied WWTP received 1.05 × 10¹¹ MPs and reduced the number of discharged MPs by circa one order of magnitude by particle number. The disc system captured about 3.5 kg MP from the secondary effluent of the WWTP, containing 4.6 kg MP, and only 1.1 kg MP was released into the environment. This finding supports other studies that have shown that a disc filter is suitable for removing MPs, as well as other pollutants [33,34], from treated wastewater.
MPs accounted for a minor fraction of the SS reaching the receiving water body as the concentration of MPs related to SS was 6.35 × 10⁻⁵ mg MP (mg SS)−1 in BF wastewater and 1.0 × 10⁻⁴–3.8 × 10⁻⁵ mg MP (mg SS)−1 in AF wastewater. Furthermore, our study has shown that the studied WWTP cannot be considered as a significant contributor to MP pollution as the approximated annual MP load by treated wastewater on the aquatic environment in Denmark is 3 t [19], and this treatment plant manages about 0.5% of all Danish wastewater.
5. Conclusions
Our study demonstrates that the studied disc filter retained the vast majority of MPs from the wastewater. Even though the results suggest that the filter’s operation was somewhat compromised and some MP particles probably either bypassed or passed through the disc filter, it nonetheless achieved high removal efficiency of MPs and prevented 90 billion MPs from reaching the environment in a year. However, the necessity of implementing further wastewater treatment steps for the sole purpose of MP removal should be evaluated by comparing the contribution of a specific WWTP to MP discharge from other sources.
Author Contributions
Formal analysis, M.S.; Funding acquisition, J.V.; Methodology, M.S. and A.V.; Software, A.V. and J.V.; Visualization, M.S.; Writing—original draft, M.S.; Writing—review & editing, A.V. and J.V.
Funding
This research was funded by The Danish Environmental Protection Agency, grant number MST-619-00063.
Acknowledgments
We thank Aviaja Hansen from Krüger A/S for organizing the overall frame of the project and Chitra S. Raju for her help regarding sampling.
Conflicts of Interest
The authors declare no conflict of interest.
References
- Cole, M.; Lindeque, P.; Halsband, C.; Galloway, T.S. Microplastics as contaminants in the marine environment: A review. Mar. Pollut. Bull. 2011, 62, 2588–2597. [Google Scholar] [CrossRef] [PubMed]
- Andrady, A.L. Microplastics in the marine environment. Mar. Pollut. Bull. 2011, 62, 1596–1605. [Google Scholar] [CrossRef] [PubMed]
- Eriksson, C.; Burton, H.; Fitch, S.; Schulz, M.; van den Hoff, J. Daily accumulation rates of marine debris on sub-Antarctic island beaches. Mar. Pollut. Bull. 2013, 66, 199–208. [Google Scholar] [CrossRef] [PubMed]
- Li, J.; Liu, H.; Paul Chen, J. Microplastics in freshwater systems: A review on occurrence, environmental effects, and methods for microplastics detection. Water Res. 2018, 137, 362–374. [Google Scholar] [CrossRef] [PubMed]
- Cozar, A.; Echevarria, F.; Gonzalez-Gordillo, J.I.; Irigoien, X.; Ubeda, B.; Hernandez-Leon, S.; Palma, A.T.; Navarro, S.; Garcia-de-Lomas, J.; Ruiz, A.; et al. Plastic debris in the open ocean. Proc. Natl. Acad. Sci. USA 2014, 111, 10239–10244. [Google Scholar] [CrossRef] [Green Version]
- Eriksen, M.; Lebreton, L.C.M.; Carson, H.S.; Thiel, M.; Moore, C.J.; Borerro, J.C.; Galgani, F.; Ryan, P.G.; Reisser, J. Plastic Pollution in the World’s Oceans: More than 5 Trillion Plastic Pieces Weighing over 250,000 Tons Afloat at Sea. PLoS ONE 2014, 9, e111913. [Google Scholar] [CrossRef] [PubMed]
- Geyer, R.; Jambeck, J.R.; Law, K.L. Production, use, and fate of all plastics ever made. Sci. Adv. 2017, 3, e1700782. [Google Scholar] [CrossRef]
- Villarrubia-Gómez, P.; Cornell, S.E.; Fabres, J. Marine plastic pollution as a planetary boundary threat—The drifting piece in the sustainability puzzle. Mar. Policy 2017. [Google Scholar] [CrossRef]
- Burns, E.E.; Boxall, A.B.A. Microplastics in the aquatic environment: Evidence for or against adverse impacts and major knowledge gaps. Environ. Toxicol. Chem. 2018, 37, 2776–2796. [Google Scholar] [CrossRef] [Green Version]
- Eerkes-Medrano, D.; Thompson, R.C.; Aldridge, D.C. Microplastics in freshwater systems: A review of the emerging threats, identification of knowledge gaps and prioritisation of research needs. Water Res. 2015, 75, 63–82. [Google Scholar] [CrossRef]
- Gall, S.C.; Thompson, R.C. The impact of debris on marine life. Mar. Pollut. Bull. 2015, 92, 170–179. [Google Scholar] [CrossRef] [PubMed]
- Andrady, A.L. The plastic in microplastics: A review. Mar. Pollut. Bull. 2017, 119, 12–22. [Google Scholar] [CrossRef] [PubMed]
- Ziajahromi, S.; Neale, P.A.; Rintoul, L.; Leusch, F.D.L. Wastewater treatment plants as a pathway for microplastics: Development of a new approach to sample wastewater-based microplastics. Water Res. 2017, 112. [Google Scholar] [CrossRef] [PubMed]
- Murphy, F.; Ewins, C.; Carbonnier, F.; Quinn, B. Wastewater Treatment Works (WwTW) as a Source of Microplastics in the Aquatic Environment. Environ. Sci. Technol. 2016, 50, 5800–5808. [Google Scholar] [CrossRef] [Green Version]
- Carr, S.A.; Liu, J.; Tesoro, A.G. Transport and fate of microplastic particles in wastewater treatment plants. Water Res. 2016, 91, 174–182. [Google Scholar] [CrossRef]
- Magnusson, K.; Norén, F. Screening of Microplastic Particles in and Down-Stream a Wastewater Treatment Plant; IVL Swedish Environmental Research Institute: Stockholm, Sweden, 2014; Available online: https://www.diva-portal.org/smash/get/diva2:773505/FULLTEXT01.pdf (accessed on 17 September 2019).
- Lares, M.; Ncibi, M.C.; Sillanpää, M.; Sillanpää, M. Occurrence, identification and removal of microplastic particles and fibers in conventional activated sludge process and advanced MBR technology. Water Res. 2018, 133, 236–246. [Google Scholar] [CrossRef]
- Mintenig, S.M.; Int-Veen, I.; Löder, M.G.J.; Primpke, S.; Gerdts, G. Identification of microplastic in effluents of waste water treatment plants using focal plane array-based micro-Fourier-transform infrared imaging. Water Res. 2017, 108, 365–372. [Google Scholar] [CrossRef]
- Simon, M.; van Alst, N.; Vollertsen, J. Quantification of microplastic mass and removal rates at wastewater treatment plants applying Focal Plane Array (FPA)-based Fourier Transform Infrared (FT-IR) imaging. Water Res. 2018, 142. [Google Scholar] [CrossRef]
- Miljøstyrelsen. Punktkilder 2016; The Danish Environmental Protection Agency: Odense, Denmark, 2018; Available online: https://www2.mst.dk/Udgiv/publikationer/2018/04/978-87-93614-44-4.pdf (accessed on 17 September 2019).
- Norén, K.; Magnusson, K.; Westling, K.; Olshammar, M. Report Concerning Techniques to Reduce Litter in Waste Water and Storm Water; Swedish Meteorological and Hydrological Institute: Norrköping, Sweden, 2016; Available online: https://admin-sm.transfers.se/app/uploads/2016/10/SMED-Report_-193-2016-BAT-Microlitter.pdf (accessed on 17 September 2019).
- Talvitie, J.; Mikola, A.; Koistinen, A.; Setälä, O. Solutions to microplastic pollution—Removal of microplastics from wastewater effluent with advanced wastewater treatment technologies. Water Res. 2017, 123. [Google Scholar] [CrossRef]
- Liu, F.; Olesen, K.B.; Borregaard, A.R.; Vollertsen, J. Microplastics in urban and highway stormwater retention ponds. Sci. Total Environ. 2019, 671. [Google Scholar] [CrossRef]
- R Core Team. R: A Language and Environment for Statistical Computing; R Foundation for Statistical Computing: Vienna, Austria, 2018; Available online: http://www.R-project.org/ (accessed on 17 September 2019).
- Dinno, A. dunn.test: Dunn’s Test of Multiple Comparisons Using Rank Sums. 2017. Available online: https://CRAN.R-project.org/package=dunn.test (accessed on 19 March 2019).
- Olesen, K.B.; Stephansen, D.A.; Alst, N.; Van Vollertsen, J. Microplastics in a Stormwater Pond. Water 2019, 11, 1466. [Google Scholar] [CrossRef]
- Löder, M.G.J.; Kuczera, M.; Mintenig, S.; Lorenz, C.; Gerdts, G. Focal plane array detector-based micro-Fourier-transform infrared imaging for the analysis of microplastics in environmental samples. Environ. Chem. 2015, 12, 563–581. [Google Scholar] [CrossRef]
- Song, Y.K.; Hong, S.H.; Jang, M.; Han, G.M.; Rani, M.; Lee, J.; Shim, W.J. A comparison of microscopic and spectroscopic identification methods for analysis of microplastics in environmental samples. Mar. Pollut. Bull. 2015, 93, 202–209. [Google Scholar] [CrossRef]
- Primpke, S.; Dias, P.A.; Gerdts, G. Automated identification and quantification of microfibres and microplastics. Anal. Methods 2019, 11, 2138–2147. [Google Scholar] [CrossRef]
- Primpke, S.; Lorenz, C.; Rascher-Friesenhausen, R.; Gerdts, G. An automated approach for microplastics analysis using focal plane array (FPA) FTIR microscopy and image analysis. Anal. Methods 2017, 9, 1499–1511. [Google Scholar] [CrossRef] [Green Version]
- Gómez, M.; de la Rua, A.; Garralón, G.; Plaza, F.; Hontoria, E.; Gómez, M.A. Urban wastewater disinfection by filtration technologies. Desalination 2006, 190, 16–28. [Google Scholar] [CrossRef]
- Magnusson, K.; Jörundsdóttir, H.; Norén, F.; Lloyd, H.; Talvitie, J.; Setälä, O. Microlitter in Sewage Treatment Systems; TemaNord, Nordic Council of Ministers: Copenhagen K, Denmark, 2016; Available online: https://norden.diva-portal.org/smash/get/diva2:923936/FULLTEXT01.pdf (accessed on 17 September 2019). [CrossRef]
- Nielsen, K.; Mørch-Madsen, A.; Mikkelsen, P.S.; Eriksson, E. Effect of Disc Filtration with and without Addition of Flocculent on Nano-and Micro-Particles and Their Associated Polycyclic Aromatic Hydrocarbons in Stormwater. Water 2015, 7, 1306–1323. [Google Scholar] [CrossRef]
- Fylypchuk, V.; Induchny, S.; Pearce, P.; Fylypchuk, L.; Martynov, S. Application of Expanded Polystyrene Filter for Tertiary Treatment of Domestic Waste Effluent in the UK. J. Water Land Dev. 2017, 35, 41–47. [Google Scholar] [CrossRef]
Figure 1.
The distribution of polymers based on the number of particles (A) and mass of particles (B) in wastewater before (BF) and after (AF) disc filter treatment. The polymer group “other” denotes polycarbonate, polyurethane, ABS, epoxy, phenoxy resin, cellulose acetate, and acrylate MPs collectively.

Figure 2.
Particle size distribution of the MPs in wastewater before (BF, grey) and after (AF, light green) disc filter treatment by the particles’ major (A) and minor dimensions, (B) on a logarithmic scale. The dark green bars indicate overlaps between BF and AF data. The size of the bins is 0.1. The dashed lines denote the median particle dimension. The rug on the x-axis illustrates the distribution of data points.

Figure 3.
Frequency distribution of the size of MPs in wastewater before (BF, grey) and after (AF, light green) disc filter treatment, by the particles’ major (A) and minor dimension, (B) on a logarithmic scale. The dark green area indicates overlaps between BF and AF data. The dashed lines denote the median particle dimension. The rug on the x-axis illustrates the distribution of data points.

Figure 4.
Boxplots of the logarithm of the major dimension of the MPs of the largest polymer groups in the wastewater sample before and after the disc filter. BF denotes the sample taken before disc filter treatment, while AF indicates the post-treatment sample.
Figure 4.
Boxplots of the logarithm of the major dimension of the MPs of the largest polymer groups in the wastewater sample before and after the disc filter. BF denotes the sample taken before disc filter treatment, while AF indicates the post-treatment sample.


Table 1.
List of polymer types and natural materials used as reference spectra, in automated MP analysis.
Table 1.
List of polymer types and natural materials used as reference spectra, in automated MP analysis.
| Polymers | ||||
| Polyethylene | Vinyl copolymer | Styrene butadiene | Poly(tetrafluoroethylene) | Acrylic paints |
| Polypropylene | Ethylene vinyl acetate | Acrylonitrile butadiene styrene | Ethylene propylene diene monomer (EPDM) | PEBAX® |
| Polyester | Polyvinyl alcohol | Polycarbonate | Polyethylene glycol | Alkyd |
| Polyamide | Polyvinyl acetate | Epoxy | Poly(lactic acid) | Fouling release |
| Acrylic | Polyvinylidene chloride | Phenoxy resin | Aramid | |
| Styrene acrylonitrile | Polyurethane | Diene elastomer | Polyimide | |
| Polyvinyl chloride | Polystyrene | Poly(oxymethylene) | Polyurethane polymer dispersion varnish | |
| Natural Materials | ||||
| Protein-based | Zein | Chitin from crustacean shells | ||
| Cellulose-based | Cotton | Cellulose | Wood pine | Viscose fiber |
Table 2.
Removal efficiency of the disc filter. Concentration of MPs in mass and number of particles in effluent wastewater before it entered the filter of 18 µm pore size, and after leaving the disc filter. The particles were collected on 10 µm filter meshes from the wastewater.
Table 2.
Removal efficiency of the disc filter. Concentration of MPs in mass and number of particles in effluent wastewater before it entered the filter of 18 µm pore size, and after leaving the disc filter. The particles were collected on 10 µm filter meshes from the wastewater.
| By Number of Particles [MPs L−1] | By Mass of Particles [µg L−1] | |
|---|---|---|
| Before the filter | 29 | 1.27 |
| After the filter | 3 | 0.31 |
| Removal efficiency [%] | 89.7 | 75.6 |
Table 3.
A summary of the parameters describing the size of MPs in wastewater samples taken before (BF) and after (AF) disc filter treatment.
Table 3.
A summary of the parameters describing the size of MPs in wastewater samples taken before (BF) and after (AF) disc filter treatment.
| BF | AF | ||
|---|---|---|---|
| Major dimension [µm] | Minimum | 6.6 | 8 |
| Maximum | 296.6 | 407.1 | |
| Median | 33.5 | 47.9 | |
| Minor dimension [µm] | Minimum | 4.2 | 4.2 |
| Maximum | 145.4 | 222.8 | |
| Median | 17.8 | 24.8 | |
| Mass [ng] | Median | 44.6 | 109.5 |
© 2019 by the authors. Licensee MDPI, Basel, Switzerland. This article is an open access article distributed under the terms and conditions of the Creative Commons Attribution (CC BY) license (http://creativecommons.org/licenses/by/4.0/).
Share and Cite
MDPI and ACS Style
Simon, M.; Vianello, A.; Vollertsen, J. Removal of >10 µm Microplastic Particles from Treated Wastewater by a Disc Filter. Water 2019, 11, 1935. https://doi.org/10.3390/w11091935
AMA Style
Simon M, Vianello A, Vollertsen J. Removal of >10 µm Microplastic Particles from Treated Wastewater by a Disc Filter. Water. 2019; 11(9):1935. https://doi.org/10.3390/w11091935
Chicago/Turabian StyleSimon, Márta, Alvise Vianello, and Jes Vollertsen. 2019. "Removal of >10 µm Microplastic Particles from Treated Wastewater by a Disc Filter" Water 11, no. 9: 1935. https://doi.org/10.3390/w11091935
Note that from the first issue of 2016, this journal uses article numbers instead of page numbers. See further details here.