Article

The Influence of Riparian Corridor Land Use on the Pesquería River’s Macroinvertebrate Community (N.E. Mexico)

by
Daniel Castro-López
1,*,
Pablo Rodríguez-Lozano
2,
Rebeca Arias-Real
3,
Víctor Guerra-Cobián
4 and
Narcís Prat
1
1
Freshwater Ecology Hydrology and Management (F.E.H.M.) Research Group, Department of Evolutionary Biology, Ecology and Environmental Sciences, Faculty of Biology, Universitat de Barcelona, 08028 Barcelona, Spain
2
Department of Geography, University of the Balearic Islands, 07122 Palma, Balearic Islands, Spain
3
Department of Evolutionary Biology, Ecology and Environmental Sciences, Faculty of Biology, Universitat de Barcelona, 08028 Barcelona, Spain
4
Autonomous University of Nuevo León, Civil Engineering, International Water Centre, Av. Universidad S/n, Ciudad Universitaria, San Nicolás de los Garza Nuevo León 66455, Mexico
*
Author to whom correspondence should be addressed.
Water 2019, 11(9), 1930; https://doi.org/10.3390/w11091930
Submission received: 15 August 2019 / Revised: 11 September 2019 / Accepted: 12 September 2019 / Published: 16 September 2019

Abstract

:
The Earth’s freshwater ecosystems are currently under threat, particularly in developing countries. In Mexico, intensive land use and inadequate monitoring policies have resulted in the severe degradation of the country’s freshwater ecosystems. This study assesses how the macroinvertebrate communities in the Pesquería River, located in Northeastern Mexico, are affected by riparian land use, in order to determine their potential use as bioindicators to evaluate the macroinvertebrate integrity of the Pesquería River. First, we characterized the land use cover in the riparian channel. Second, we sampled 16 sites for benthic macroinvertebrates along the main channel during the wet and dry seasons. Third, we evaluated the influence of the riparian channel land use on the macroinvertebrate community using 42 different biological metrics. The land use characterization depicted a riparian channel mainly influenced by agricultural and urban land use. Eighty-one invertebrate taxa were identified during the study. Permutational analysis of the variance analysis confirmed significant differences across the different land use classes and the macroinvertebrate community composition while no differences were found between seasons. The indicator species analysis revealed 31 representative taxa for natural land use, 1 for urban, and 4 for agricultural land use. Our modelling analysis showed that 28 of the 42 biological metrics tested responded significantly to land use disturbances, confirming the impact of land use changes on the Pesquería River’s macroinvertebrate communities and suggesting that these metrics may have a use as bioindicators. Finally, this study may provide significant biological information for further studies in similar conditions.

1. Introduction

Nowadays, the Earth’s ecosystems and biodiversity are changing at an accelerated rate due to population growth and human activities [1,2,3]. Livestock and agriculture occupy more than a third of the world’s land surface and globally nearly 75% of freshwater is used for crop and cattle production [4]. Additionally, the total number of urban areas has more than doubled in recent years. It is projected that by 2050, there will be 25 million kilometers of paved roads [4]. The increase in agricultural and urban land use has also led to the fragmentation of the natural lands, an increment of nutrients’ load due to fertilization, and altered landscape hydrology [5,6,7,8].
The scientific community has recognized that anthropogenic activities at the landscape level gravely affect the natural conditions of freshwater ecosystems [4]. Moreover, several studies have shown that the transformation of natural areas into agricultural and/or urban areas can influence in-stream habitats, and affect the structure and composition of aquatic ecosystems [9,10,11]. It is well known that forest loss results in a low level of assimilation of nonpoint source pollutants in riparian ecosystems [12]. Agricultural practices, for example, introduce nutrients into streams, which can damage the benthic habitat [5,13]. Further, the increase in the number of impervious surfaces and wastewater treatment plants due to urbanization results in altered peak flows and the introduction of nutrients and pollutants that alter a riparian channel’s shape and water quality [8,14,15].
Biomonitoring is the use of biological indicators to evaluate the health of the environment [16]. Biological indicators are crucial for assessing the condition of freshwater ecosystems due to their sensitivity to low levels of anthropogenic stress. [17]. They are also suitable for testing the effects of pollution in experimental studies [18]. Benthic macroinvertebrate communities are the organisms most commonly used as a biomonitoring tool [18,19]. They can indicate a specific ecosystem’s health by highlighting changes in the diversity and species composition [13,19,20]. Furthermore, some species have long life cycles, which can be used to trace the effects of pollution over longer periods, and their sensitivity to land use changes have made them a useful tool for biomonitoring programs [18,19,21,22,23].
Biological metrics are parameters that are calculated to represent some of the aspects of the structure and function of the biological community in a given ecosystem [18,24]. Biological metrics vary according to anthropogenic impacts. The term “Multimetric indexes” has come to be used to refer to the use of combined biological metrics, which can offer a more detailed picture of the response to anthropogenic impacts [25]. Multimetric indexes that assess the macroinvertebrate benthic community are considered one of the most effective methods for evaluating the biological condition of freshwater ecosystems [20,21,26]. The first phase of multimetric index development consists of selecting a set of biological metrics that show a response to multiple stressors. For instance, it is well documented that rivers impacted by agricultural land use present a loss in their riparian vegetation. This increases the availability of nutrients, which results in greater algal and periphyton production, and also changes the benthic assemblage composition [13,27]. In addition, the increase in agricultural land use has also been changing benthic communities dominated by shredders to one of grazers [5,28,29]. Further, rivers affected by urban land use present an increase in the amount and variety of pollutants in runoff, plus an erratic hydrology due to the increased impervious surface areas, and an increment increase in water temperatures due to the loss of riparian vegetation. Heightened imperviousness in river areas increase the proportions of collectors-gatherers, while proportions of filterers, scrapers, and shredders decrease [5,9,13]. Macroinvertebrate functional feeding groups exposed to impervious surfaces show a decrease in the assemblage of scrapers because of the low availability of food (i.e., periphyton). However, the availability of fine particulate food resources increases the presence of collectors/gatherers in the stream [9]. The different stress factors affecting freshwater ecosystems concurrently result in different biological responses, which also vary in each ecoregion. The importance of the creation and intercalibration of different indexes for each major ecoregion is, therefore, paramount [30,31].
Since 1974, the Mexican National Water Commission (CONAGUA) has monitored freshwater ecosystems using only physicochemical parameters. The development of biological metrics using macroinvertebrate communities and other biological groups is thus still needed to better assess the ecological status of Mexican freshwater ecosystems. This lack of evaluation can be explained by a combination of different factors: (i) the lack of taxonomic and ecological information regarding several key benthic macroinvertebrate taxa, (ii) the difficulty of finding riparian ecosystems without evidence of anthropogenic pressures that can act as reference sites [32], and (iii) the fact that biomonitoring techniques are not included in the approved water evaluation methods outlined by the Mexican government [33]. In light of this situation, the scientific community in Mexico has developed studies using benthic macroinvertebrates as bioindicators [32]. However, just a few have applied a multimetric approach in the evaluation of the ecological state of Mexican rivers [34,35,36]. Regarding the geographical coverage of these studies, just the central part of the country has been evaluated, there are no studies reported of ecological evaluation using benthic macroinvertebrates from the North and South of Mexico [32]. According to the Mexican Priority Hydrological Regions (PHR) program [33], the Pesquería River Sub-basin (PR) is a priority case for ecological evaluation given the high level of environmental degradation that has been caused by anthropogenic activity in the surrounding region.
Within this context, the overarching goal of this study was to test how the macroinvertebrate communities in the PR are affected by different land use categories, and to assess their potential use as bioindicators to evaluate the PR’s ecological status. In order to do so, we first characterized the land use of the Pesquería River’s riparian buffer to establish the natural and anthropogenic influences on the river. Second, we determined the response of the macroinvertebrate communities to different land uses by examining their community assemblages and a set of biological metrics. Next, the macroinvertebrate communities in the Pesquería River were evaluated using the said biological information. Finally, we discuss the potential use of the most significant biological metrics as tools for evaluating the ecological status of the Pesquería River, and their possible applications in other ecohydrological contexts.

2. Methodology

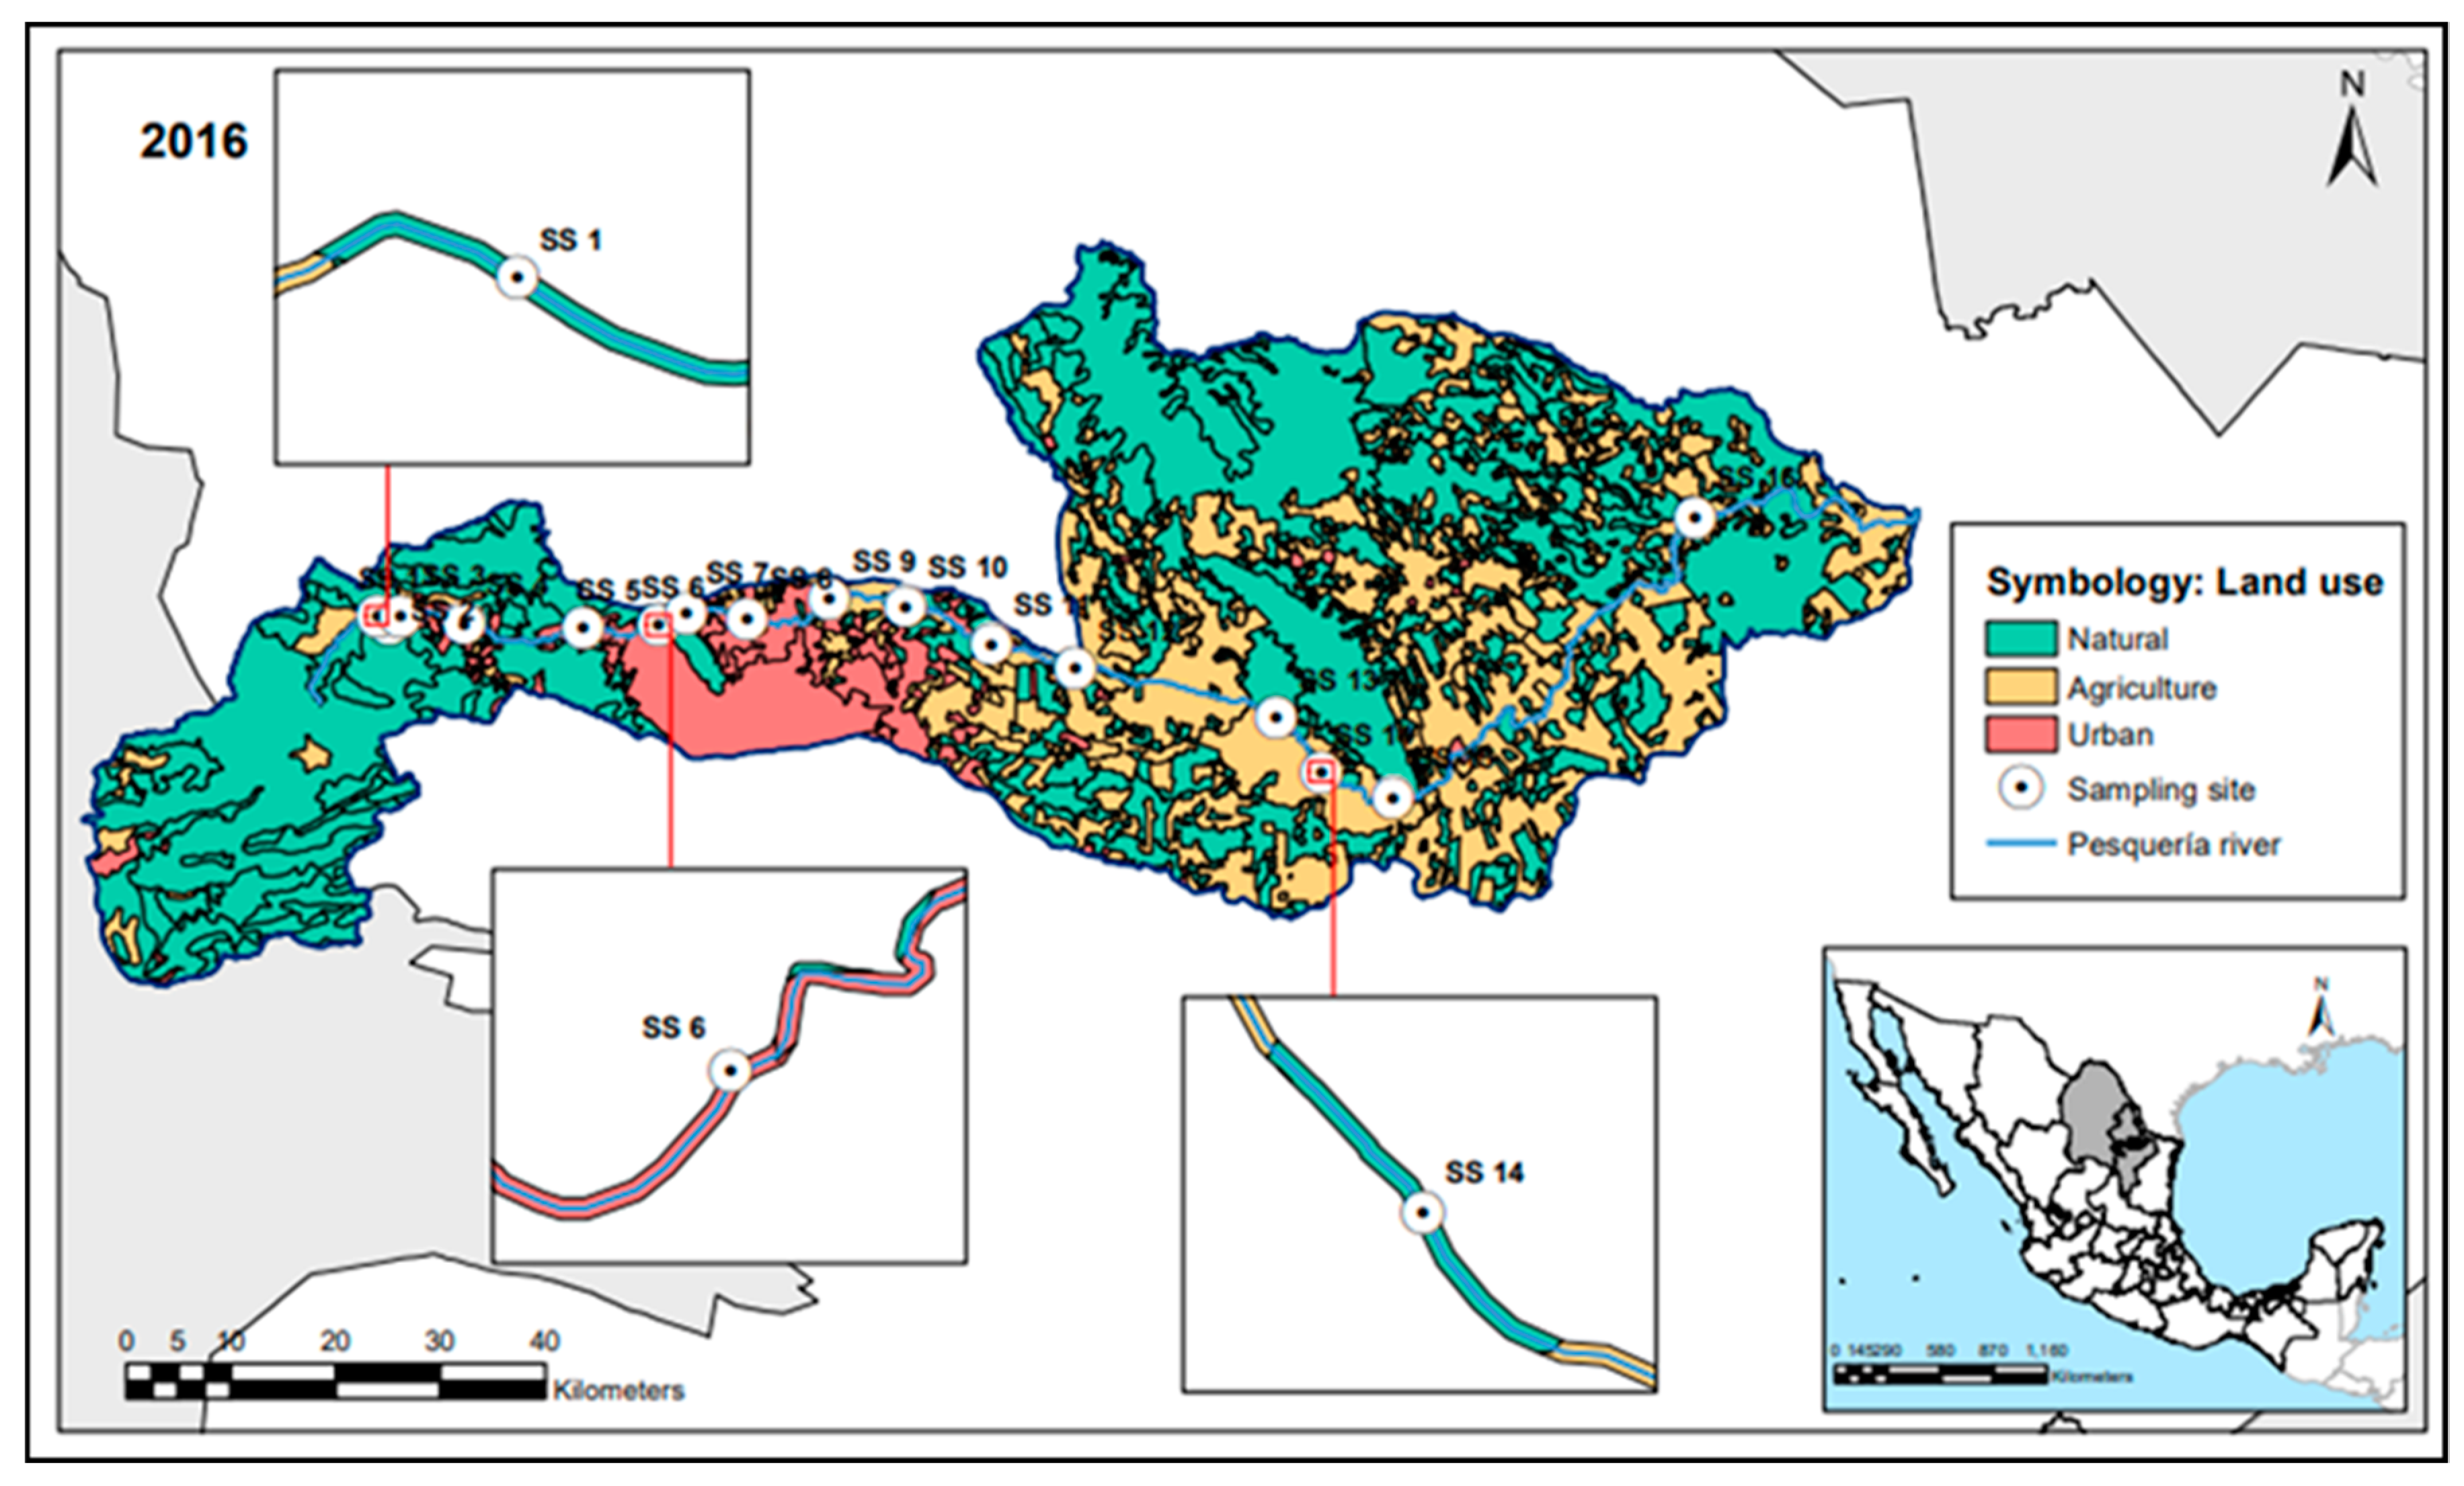
2.1. Study Area: The Pesquería River

This study was conducted in the Pesquería River (PR), located in Northeastern Mexico. The river flows through the states of Coahuila and Nuevo León (24-Bravo-Conchos Hydrological region). The PR has a catchment area of 5255.56 km2, and its main course is 288.22 km in length. The mainstem flows through the Monterrey city metropolitan area. The PR’s annual average flow is 2.04 m3/s [37]. Its mean elevation is 542 m a.s.l. with an average gradient of 0.4%. The climate is semi-arid [38], with an average temperature of 20–24 °C [39]. The PR has a total annual rainfall of between 400–700 mm. The wet season is from May to October, while the remaining months, November to April, are dry [40]. The predominant vegetation is sub-montane scrub with Mesquite vegetation typical of sandy deserts, plus halophilic vegetation [33]. Citrus production, livestock, aquaculture, and rainfed agriculture are the main economic activities along the PR [33,41]. The natural water conditions of the PR present characteristics consistent with loamy basins and an elevated concentration of salt in the water (mesohaline habitats), as well as vegetation and fauna typical of semi-arid zones [37,42,43]. In order to corroborate this, we measured salinity and conductivity at each sampling site.

2.2. Riparian Buffer Land Use and Sampling Site Characterization

We used the Geographical information from the digital map database of the INEGI (National Institute of Statistics and Geography of Mexico) to obtain the main land use data for the PR, considering its entire drainage area [44,45]. Using the protocol for the assessment of the hydro-morphological quality of rivers (HIDRI protocol [46]), land use cover in the PR area was grouped into three categories (Figure 1): natural, urban, and agricultural, in order to evaluate the quality of the riparian channel [46].
Next, 16 sampling sites (each 100 m long) were strategically selected along 180 km of the PR’s main channel, which included the headwaters of the river and sites before or after human settlements or agricultural areas. Then, the land use proportion for the riparian area of each sampling site was calculated, taking into consideration a 50 m (width) buffer zone along both sides of the channel upstream of each site (Figure 1) [46,47,48]. Furthermore, we measured the distance from headwaters (DFH) of each sampling site to see if the macroinvertebrate community was influenced by the land use or by the longitudinal natural variability of river conditions (i.e., the river continuum concept) [49,50].
The resulting riparian zone of each sampling site was classified as natural, agricultural, or urban according to the following criteria [46]: (i) Natural when more than 75% of the land use cover was unaltered, thus the sum of urban and agricultural land use does not exceed 25%, (ii) Agricultural when more than 50% of the land was used for farming, and (iii) Urban when more than 50% of the land was used for urban areas/human settlement (Supplementary Material A/Table S1 [44,46,51]). Arc Map 10.1 was used for this analysis [52]. To corroborate the land use typology previously proposed for each sampling site and to detect punctual impacts (i.e., wastewater sewages, industrial sewages, human settlements), aerial photographs were obtained via drone (Supplementary Material A/Figure S1).

2.3. Macroinvertebrate Sampling, Taxonomic Identification, and Biological Metrics

We took samples of the benthic macroinvertebrate community at each sampling site during the wet season (August 2015) and dry season (February 2016). The multi-habitat kick-net sampling method was used [53]. A D-frame net (0.5 m wide with 250-µm mesh) was used to collect a 1 L sample per site, combining 20 kick samples (~0.5 m2/sample), which were taken in proportion with the microhabitat types (i.e., hard substrate, woody debris, aquatic macrophytes, vegetated bank margins and sand/other fine sediment) present in each 100 m reach [54]. The samples were preserved in 10% formaldehyde and transported to the laboratory [53]. Once in the laboratory, we counted the macroinvertebrates and identified them at the lowest possible taxonomic level [55,56,57,58]. Taxonomic resolution was primarily to the genus level, with some taxa identified to species level. Some Diptera and Hirudinae were identified to the family level (e.g., Chironomidae, Erpobdebilldae), while Oligochaeta, Ostracoda, Cladocera, and Copepoda were identified at higher taxonomic levels.
We considered 42 candidate metrics generally used in studies of macroinvertebrate responses to anthropogenic pressures in Mexico and elsewhere ([20,21,36,59,60,61,62], see Table 1). These metrics represented a range of structural and functional macroinvertebrate community characteristics, including diversity, species composition, and trophic structure. Metrics of tolerance of pollution were not considered given the lack of precise taxonomic information for this region [32]. All these metrics were grouped into four different categories that relate to different attributes of the macroinvertebrate assemblages [57]: taxonomic richness, taxonomic composition, diversity indexes, and functional feeding groups’ (FFG) metrics (Table 1). Regarding the FFG analysis, an “FFG x sampling sites” array was created [56,57,58,63,64,65], where taxa were substituted by the FFG to which they belong. Then, the number of different taxa (richness) and the relative abundance (percentage) of each FFG was calculated for each site [57,58,63,64,65].

2.4. Data Analysis

We began by exploring the aquatic macroinvertebrate community structure in relation to land use categories (agricultural, natural, and urban). To do so, we performed a non-metric multidimensional scaling (NMDS) based on square root relative abundances and Bray–Curtis distance. Then, following the sqrt-transformation of the macroinvertebrate relative abundance data, we used permutational multivariate analysis of variance (PERMANOVA, ‘adonis2’ function in R) on the Bray–Curtis distance matrix in order to test differences in macroinvertebrate community composition across types of land use and different seasons [66,67]. To define the indicator taxa for each land use category, we used the indicator species analysis (IndVal) established by Dufrene and Legendre [68]. This analysis generates an indicator value index (IV) for each taxon and land use category. The indicator calculation is based on specificity and fidelity. To perform these tests, we used the packages vegan, labdsv, and ade 4 in R [66,69,70].
To evaluate the response of the 42 biological metrics to land use, we followed the protocol outlined by Feld et al. [71]. First, we checked any outliers in the data, the variable distributions (skewness), and the assumption of normality (Bartlett and Shapiro test). For the variables that did not fulfil the assumptions of normality and homoscedasticity, we transformed the original data using a square root transformation (Supplementary Material B/Table S1). Second, to quantify the effects and significance of land use, season, DFH, and their interactions with the biological metrics, we fit linear mixed models (LMMs) and linear models (LMs). Next, from these models, we selected the final model for each biological metric, choosing those with the greatest explanatory capacity and parsimony (i.e., lower Akaike Information Criterion values, [72]). For each LMM, we considered land use, season, DFH, and their interactions as fixed effects and the sampling site as random effects. We validated the final model by visually checking any residuals for normality and homoscedasticity [73]. When the null hypothesis had been rejected, in order to explore the differences between each land use category, we performed post hoc Tukey pairwise comparisons using the ‘multcomp’ package in R. To calculate the determination coefficients, we followed the methodology proposed by Nakagawa and Schielzeth [74].
Since one of our aims was to detect macroinvertebrate-based metrics that can potentially be used as bioindicators for land use disturbances, we selected the metrics that better responded to the different types of land use in the PR. Therefore, we selected those biological metrics in which the models’ (LMMs or LMs) response to land use presented significant results (p < 0.05). Within all metrics that varied significantly according to land use disturbances, we highlighted those with higher determination coefficients and the most ecological relevance for the PR [75]. All the statistical analyses were performed using the R statistical software [76], version 3.4.1, with the significance level set at p < 0.05 for all tests [77]. The datasets used in this study are available in Supplementary Material B/Table S2.

3. Results

3.1. Land Use Characterization in the Pesquería River (PR)

Georeferenced tools and aerial photographs corroborated that the typology of land use for each sampling site was in line with our previous land use classification (natural, urban, and agricultural). These tools also showed small strips of riparian forest/vegetation in impacted areas (Supplementary Material A/Table S2). We also located the discharge of six wastewater treatment plants (WWTP), three water stabilization ponds (WSP), clandestine garbage dumps (CD), and the presence of salt from indirect industrial waste (Supplementary Material A/Table S3). The average salinity value for natural land use was 0.90 (±0.02) ppt, while it was 2.50 (±0.54) ppt for urban land use and 1.13 (±0.06) ppt for agricultural land use. With regards to conductivity, the average value for natural land use was 1758 (±44) μS/cm, 5272 (±1058) μS/cm for urban land use, and 2187 (±116) μS/cm for agricultural land use. In terms of riparian zone land use, three sampling sites were classified as natural (sites 1 to 3), six as urban (sampling sites 4 to 9), and seven as agricultural land use (sites 10 to 16, Supplementary Material A/Table S3).

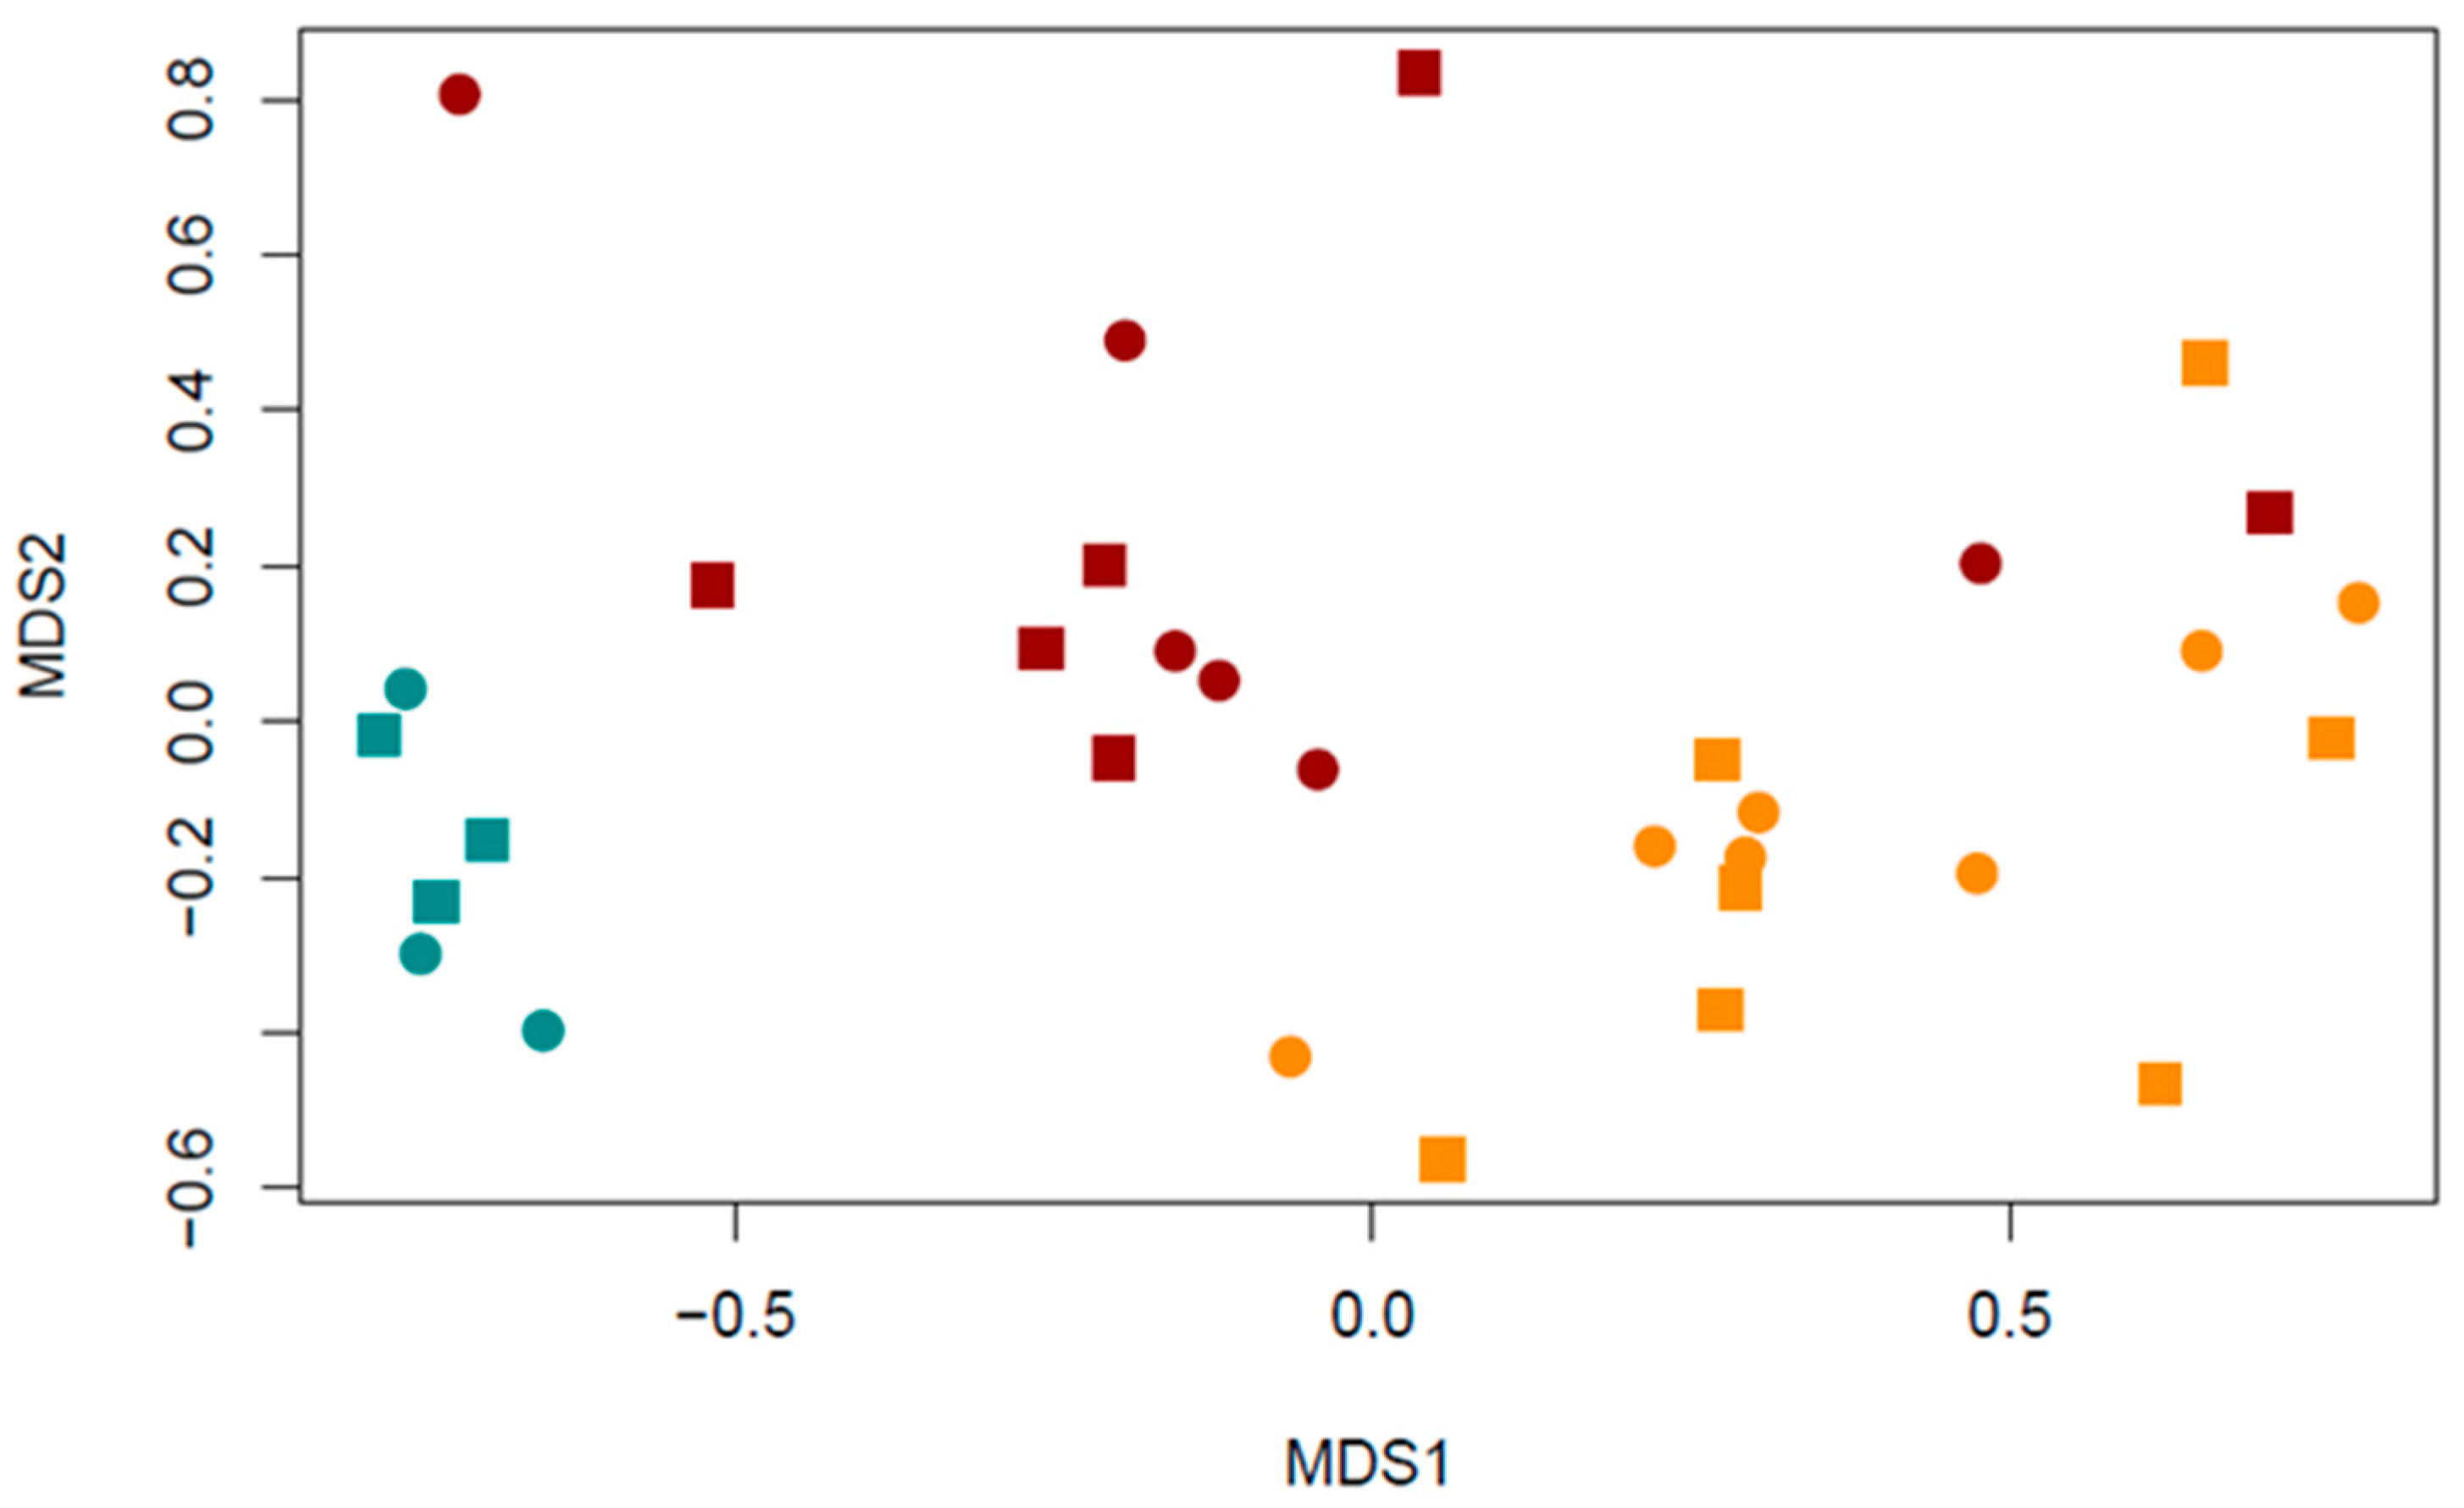
3.2. Aquatic Macroinvertebrate Community Structure and Land Use

Eighty-one different macroinvertebrate taxa were identified in the survey. Taxa richness of the PR sites ranged between 5 and 38 taxa. The average taxa richness (mean ± standard error of the mean (SEM) values) for natural sites was 35.2 (±1.04), while it was 16 (±2.06) for urban sites and 11 (±1.23) for agricultural sites (Supplementary Material B/Table S1). Biological communities are grouped on the NMDS bidimensional ordination according to the land use classification (Figure 2).
The PERMANOVA analysis confirmed that there were significant differences among macroinvertebrate communities for each land use category (Adonis, F = 8.63, R2 = 0.38, p = 0.001), while no differences were found between seasons (Adonis, F = 0.95, R2 = 0.02, p = 0.43). According to the IndVal analysis, 36 of the 81 taxa were indicators of one of the three classes of land use: 31 were indicators of natural land use, one taxon of urban land use, and four taxa of agricultural land use (Table 2).

3.3. Biological Metrics and Land Use

Forty-two biological metrics were tested in this study. Of the final models (LMMs and LMs), 39 models had land use as the only explanatory variable (fixed effects), two models presented both land use and DFH as fixed factors (% EPT and % collectors-filterers), and just one model (richness collectors-gatherers) responded to land use, DFH, and showed an interaction between land use and season (see Supplementary Material B/Table S2). Thus, we discarded those models that responded significantly to DFH, keeping only those with biological metrics that responded to the different categories of land use (i.e., 28 metrics).
Within the metrics of taxonomic richness, richness (LMM, R2c = 0.7, R2m = 0.94, p < 0.001) decreased in areas of urban and agricultural land use (55% and 68%, respectively). The EPT richness was dominated by Trichoptera and Ephemeroptera richness given the lack of Plecoptera taxa in all Pesquería River sampling sites. The EPT richness index (LMM, R2c = 0.7, R2m = 0.93, p < 0.001) showed a decrease in Urban (79%) and Agricultural (87%) land use in comparison with Natural land use. For OCH richness (LMM, R2c = 0.66, R2m = 0.89, p = 0.0015) we found the same pattern, there was a 54% reduction in areas of urban land use and 76% in agricultural areas when compared with natural land use areas. Finally, for Diptera richness, (LMM, R2c = 0.62, R2m = 0.94, p = 0.003) the same pattern was observed.
For Chironomidae plus Oligochaete abundance (LM, R2ad = 0.34, p = 0.007), a metric of taxonomic composition, we found the opposite pattern: in the sites with urban or agricultural land use, there was an increase in abundance of 126% at urban sites and 137% at agricultural sites.
All of the diversity indexes (third category) were significant, and show decreases in the presence of agricultural and urban land use. For instance, the Shannon Index base e (hereafter Shannon Index; LM, R2ad = 0.66, p < 0.001) was 49% lower for urban land use areas and 60% lower for agricultural land use areas when compared with natural land use. In the first, second, and third biological metric categories’ post hoc Tukey pairwise comparisons (Tukey HSD, p < 0.05), we observed significant differences between natural and anthropogenic (urban and agricultural) land use covers.
Regarding the functional feeding metrics, sites with agricultural and urban land uses presented a higher percentage of collector-gatherers (LM, R2ad = 0.42, p = 0.0011), compared with natural land use sites (Tukey HSD, p < 0.05). Predator richness (LMM, R2c = 0.57, R2m = 0.85, p < 0.001) decreased by 50% in sites with urban land use and by 68% in areas of agricultural land use when compared with natural land use sites (Tukey HSD, p < 0.05). Predator abundance showed a similar trend (LM, R2ad = 0.24, p = 0.006), presenting significant differences between natural and agricultural land use (Tukey HSD, p < 0.05). Herbivore species also decreased in richness (LMM, R2c = 0.59, R2m = 0.88, p = 0.007) and in relative abundance (LM, R2ad = 0.64, p < 0.001) wherever anthropogenic land use had increased. Herbivore richness presented a reduction of 60% at urban sites and 83% at agricultural sites when compared to natural sites. The relative abundance of herbivores decreased by 83% in the presence of urban land use and 97% in the presence of agricultural land use when compared with natural land use, being the only biological metric that differed across the three types of land use (Tukey HSD, p < 0.05).

4. Discussion

Our study revealed how macroinvertebrate communities within the Pesquería river mainstem respond to different land uses along the riparian channel. It showed not only how the health of the river is affected by human land use (both agricultural and urban) but also that macroinvertebrate communities may have a promising application as bioindicators to be used in future monitoring programs for semi-arid rivers in the North of Mexico. As has been documented in most human-degraded ecosystems [78,79], the ecological communities in the PR seem to be decreasing in richness, diversity, and evenness, with anthropogenic pressures affecting macroinvertebrate communities the most. Our measurements of salinity and conductivity showed that the PR headwaters show evidence of “primary and secondary salinization” in freshwater [37]. In addition, urbanization and agricultural practices have also influenced the structure of the macroinvertebrate assemblage.
The macroinvertebrate communities found in the Pesquería River are characteristic of mesohaline habitats [80,81,82]. Despite the salt present at the headwaters of the PR, IndVal analysis revealed a large number of taxa that were indicators of the natural land use typology, which at reference sites are related to higher richness values [83]. Some of these taxa have been used as bioindicators of “healthy” reference sites (e.g., Philopotamidae, Leptophlebidae) in previous studies [84,85,86]. The IndVal analysis also revealed that only Berosus sp. was characteristic of urban land use. Previous studies in Mexico reported Berosus sp. as an indicator of streams polluted with an excess of organic matter, also Berosus sp. is reported to be tolerant to salinity and total dissolved solids [87]. For agricultural land use, all IndVal representative taxa have been reported as bioindicators of habitats typically impacted by this land use typology. This study is consistent with previous studies that found that Zygoptera and Hirudinea were the most abundant taxa in sites impacted by agricultural land use. The presence of Ischnura sp. in farming ditches, for example, has often been reported [88]. Additionally, high abundances of Erpobdellidae were reported at sites influenced by agricultural land use [89]. Furthermore, high densities of chironomids and amphipods were found, which are characteristic of agricultural sites [90].
The biological metrics used in this study present similarities with the metrics used to develop multimetric indexes around the world [20,21,36,59,60,61,62]. We found that 28 of the 42 metrics tested responded significantly to land use disturbances and therefore can be potentially used as bioindicators. These metrics provided information about richness, abundance, diversity, and the trophic structure of the PR’s benthic macroinvertebrate community. For Taxonomic Richness metrics, Richness, EPT richness, OCH richness, and Diptera richness were determined to be the metrics that explained the anthropological land use impacts on the PR. These metrics have the advantage of being simple to calculate and are suitable for all ecological systems, being particularly useful metrics for biological degradation [91]. High richness values have been associated with the pristine conditions commonly found at river headwaters, while low values reflect anthropogenic impacts but also responses to natural saline systems [28,42,92]. Other metrics, such as EPT richness, OCH richness, and Diptera richness, take into account the tolerance of sensitive groups to anthropogenic disturbances and natural saline ecosystems (e.g., Plecoptera) [42].
The EPT richness in our study is only composed of Ephemeroptera and Trichoptera species that are tolerant of salinity. It is well known that Ephemeroptera species are halophobes due to their lack of physiological tolerance to salt [93,94]. However, other authors have reported that Leptophlebiidae, Baetidae, and Caenidae families are all tolerant of saline, this last taxon being the most tolerant of the three [80,95]. Interestingly, Leptophlebiidae and Caenidae, both significant indicators of natural land use according to the IndVal analysis, have previously been used as biological indicators. Leptophlebiidae has received a high score on biological indexes, while Caenidae has received an average score [84,85,96]. For Trichoptera, it is known that increased levels of salt and chlorides directly affect species richness and the abundance and biomass of caddisfly larvae [97]. Several studies around the world have demonstrated that some species of Trichoptera can live in saline waters [93,94,95,98]. In addition, in our study, the Indval analysis revealed that Philopotamidae, which is considered an indicator of good ecological quality, was indicative of natural land use [84,85,96,99]. It is well documented that Plecoptera species require relatively undisturbed conditions, and they are therefore important bioindicators for freshwater quality [100]. The use of Plecoptera as a bioindicator is not particularly useful in saline streams or ponds, since it is normally absent. Even if this order contains tolerant species, be they rare or endemic, Plecoptera overall usually presents a low species richness in saline water bodies [80,92,101,102,103]. The lack of Plecoptera in this study is probably due to the high salt concentration in the PR [37,80,92,104].
Despite the natural concentrations of salt in the PR, many Odonata, Coleoptera, and Heteroptera species are adapted to saline waters [105]. As we expected, OCH richness decreased in the presence of anthropogenic land use. IndVal analysis revealed species representative of OCH richness, which can be used as biological indicators in freshwater. For example, Gomphidae, which is representative of natural land use according to our IndVal analysis, has been reported as tolerant of saline water, as well as being a good biological indicator of high water quality. Conversely, Ischnura sp., which also has a high tolerance for salinity, was an indicator of agricultural land use, in line with previous studies [81,106]. Coleoptera presented similar circumstances. Pshephenidae was representative of natural land use according to the IndVal analysis and has been previously used as a bioindicator for good quality riparian ecosystems [85]. Heteroptera, Rhagovelia sp., and Ambrysus sp. were the only representative taxa present in our IndVal analysis for natural land use. Additionally, both have been reported as tolerant of saline environments [80,95,98,107]. According to previous studies both taxa families have also been scored as tolerant of pollution [85,108,109,110].
Previous research has indicated that Diptera richness decreases in response to anthropological land use [21]. Our IndVal analysis confirmed this observation: seven Diptera taxa were detected as indicators of natural land use, none were identified for urban land use, and only one was found for agricultural land use. Nonetheless, several studies have reported that the abundance of some Diptera species increases when anthropogenic land use begins [20]. This is directly linked to our second biological metric category, “Richness composition”. For this category, the metrics selected were Chironomidae plus Oligochaete abundance, which is the percentage of Chironomidae plus the percentage of Oligochaete, both being representative of agricultural land use in our IndVal analysis. Several authors have described an overall increase in the relative abundance of Chironomidae and Oligochaeta in the presence of urban and agricultural land use [111,112,113]. The PR sampling sites that recorded the most abundant taxa for Chironomidae and Oligochaetes (sampling sites 4, 9, 10, and 12) are all affected by the discharge from the WWTPs. It is well known that WWTPs in urban areas have “unhealthy” effects on benthic communities [113]. In addition, this study found that macroinvertebrate integrity is typically damaged in sites located immediately downstream of WWTPs.
For the diversity metrics, the Shannon Index [114] was chosen since it is considered to be a robust tool that takes into account both evenness and species richness. The higher the values of the Shannon Index, the greater the diversity and the healthier the ecosystem [114,115]. In our case, the Shannon Index showed healthy sites at the PR headwaters (sampling sites 1–3), while also singling out the most degraded sites (Supplementary Material A/Figure S2). The most impacted sites for urban land use are located after the WWTP and WSP discharges, as well as after the possible indirect discharges from industry (sampling sites 4 and 5), and after the discharge of the city’s principal WWTP (sampling site 9). Meanwhile, sites impacted by agricultural land use were located after the local WWTP and WSP (10, 11, and 12 sampling sites, Supplementary Material A/Figure S2).
Previous studies have linked macroinvertebrate-feeding ecology with environmental conditions, suggesting that the FFG’s metrics detect stressors from multiple spatial scales [36,116,117,118]. In addition, it has been observed that anthropogenic activities alter the availability of food sources, producing important variations in the distribution and relative abundance of FFG [36,57,115]. The FFG metrics selected for the PR were collector-gatherers (percentage), predators (richness and percentage), and herbivores (richness and percentage). An increase in the percentage of collector-gatherers is well documented in areas of anthropogenic land use [21,119]. In our particular case, agricultural land use sampling sites showed the highest number of collector-gatherers. IndVal analysis for the PR revealed that collector-gatherer taxa like Chironomidae and Hyalella azteca sp. were representative of agricultural land use. Additionally, previous studies have remarked that the high availability of nutrients in streams impacted by agricultural land use leads to greater algal production and moss growth, which in turn provides a suitable habitat for both taxa [5,28].
Consequently, the increase in the number of collector-gatherers alters the functional composition of the benthic macroinvertebrate community, reducing the richness and abundance of other functional groups (predators, herbivores, etc.). Nevertheless, evidence of the abundance of predators in disturbed areas remains inconclusive. While some authors have found a high density of predators in forested areas, some have observed that predators occurred more often in urban areas, whereas others have found that predators have similar distributions across different land use typologies [119,120,121,122]. In our case, the riparian forest/vegetation “strips” in sampling sites within urban land use areas served as buffers where predators can be found. Conversely, urban sites without these riparian forest/vegetation strips and sites highly impacted by WWTPs presented similar levels of abundance to agricultural land use sites with the same disturbances (Supplementary Material A/Figure S2). Finally, but importantly, herbivore abundance was the only biological metric in our study that presented significant differences across the three different typologies of land use. The percentage of herbivores is high at sites with natural land use in the PR area, but it declines drastically at urban sites, and almost disappears at sites with agricultural land use. Previous studies have shown that the abundance of herbivores was positively correlated with periphyton cover and the main substrate diameter, these aspects all being characteristic of undisturbed waters [110].
Moreover, we found that distance from headwaters was only significant for 3 of the 42 metrics tested, demonstrating that the variability of macroinvertebrate communities in the PR observed in this study is linked to land use disturbances and not to the natural longitudinal variability of the river conditions (i.e., the river continuum concept). However, we should clarify that the current study was limited by the synergistic effect of the accumulated impacts caused by urban land use, especially between urban sites and agricultural sites. All the metrics selected highlighted the differences between natural and anthropic land uses (urban and agricultural) but just one was able to distinguish the differences between natural, urban, and agricultural land use.

5. Conclusions and Challenges

The lack of watershed planning, management, and restoration activities in Mexico have allowed unregulated anthropic activities to severely affect the ecohydrological health of the country’s rivers. The biological metrics selected strongly support the notion that the PR ecosystem has been disturbed by the changes observed in the macroinvertebrate communities in response to the different riparian land uses. The PR diagnosis is in line with “urban river syndrome”, and it has the trademark characteristics of a river influenced by agricultural land use (“Agro-urban rivers”). The high rate of urbanization makes it particularly hard to find “healthy” reference sites in this region. Headwater streams in highly urbanized zones are therefore under constant threat. In spite of this, we were able to locate several riparian forest “strips” which help to mitigate the anthropogenic pressures affecting PR macroinvertebrate biodiversity. These small areas offer a great starting point for operations to recover the river’s ecological health. We also believe that the riparian zone border limit should be extended beyond the limits established in the “1992 Mexican National Water Law” [123]. The biological macroinvertebrate-based metrics selected for use in this paper are a promising tool that can be used as a first step in the construction of a Multimetric index for this river, and can hopefully be used as bioindicators of land use pressures in other semi-arid rivers in the North of Mexico. Finally, the PR is a clear example of how anthropogenic activities, a lack of regulation and a failure to safeguard river environments are threatening Mexican riparian ecosystems. Our findings have significant implications for watershed management and for the restoration of the PR, this being the first study that looks to propose biological metrics that reveal the influence of land use on the river ecosystem. Regardless of the advantages that biological metrics present, further work to improve biomonitoring efficiency in Mexico is needed. The development of taxonomic keys for Mexican fauna is urgently necessary in order to build suitable indexes for specific ecoregions.

Supplementary Materials

The following are available online at https://www.mdpi.com/2073-4441/11/9/1930/s1 Supplementary Material A, Table S1. Land use classification criteria applied on this study; Table S2. Land use classification and percentage of each site; Figure S1. Pesquería River Sub-Basin drone aerial photographs; Figure S2. Pesquería River Sub-Basin drone aerial photograph. Supplementary Material B, Table S1. Metrics data; Table S2. Discarded Metrics.

Author Contributions

Conceptualization: D.C.-L., R.A.-R., P.R.-L., V.G.-C., N.P., Data curation: D.C.-L., R.A.-R., Formal analysis: D.C.-L., R.A.-R., P.R.-L., V.G.-C., N.P., Investigation: D.C.-L., R.A.-R., P.R.-L., V.G.-C.,N.P., Methodology D.C.-L., R.A.-R., P.R.-L., V.G.-C., N.P., Supervision: D.C.L., P.R.-L, V.G.-C., N.P., Validation: D.C.-L., P.R.-L., V.G.-C., N.P., Visualization: D.C.-L., P.R.-L., V.G.-C., N.P., Writing—original draft preparation: D.C.-L., Writing—review and editing: D.C.-L., R.A.-R.,P.R.-L., V.G.-C., N.P.

Funding

The founding sponsors had no role in the design of the study; in the collection, analyses, or interpretation of data; in the writing of the manuscript; nor in the decision to publish the results.

Conflicts of Interest

The authors declare no conflict of interest.

References

  1. Sala, O.E.; Chapin, F.S.; Arme sto, J.J.; Berlow, E.; Bloomfield, J.; Dirzo, R.; Huber-Sanwald, E.; Huenneke, L.F.; Jackson, R.B.; Kinzig, A.; et al. Global biodiversity scenarios for the year 2100. Science 2000, 287, 1770–1774. [Google Scholar] [CrossRef] [PubMed]
  2. Burdon, F.J.; Munz, N.A.; Reyes, M.; Focks, A.; Joss, A.; Räsänen, K.; Altermatt, F.; Eggen, R.I.L.; Stamm, C. Agriculture versus wastewater pollution as drivers of macroinvertebrate community structure in streams. Sci. Total Environ. 2019, 659, 1256–1265. [Google Scholar] [CrossRef] [PubMed]
  3. Price, E.L.; Sertić Perić, M.; Romero, G.Q.; Kratina, P. Land use alters trophic redundancy and resource flow through stream food webs. J. Anim. Ecol. 2019, 88, 677–689. [Google Scholar] [CrossRef]
  4. Media Release: Nature’s Dangerous Decline ‘Unprecedented’, Species Extinction Rates ‘Accelerating’|IPBES. Available online: https://www.ipbes.net/news/Media-Release-Global-Assessment#_ftnref1 (accessed on 11 May 2019).
  5. Krynak, E.M.; Yates, A.G. Benthic invertebrate taxonomic and trait associations with land use in an intensively managed watershed: Implications for indicator identification. Ecol. Indic. 2018, 93, 1050–1059. [Google Scholar] [CrossRef]
  6. McLaughlin, D.L.; Kaplan, D.A.; Cohen, M.J. A significant nexus: Geographically isolated wetlands influence landscape hydrology. Water Resour. Res. 2014, 50, 7153–7166. [Google Scholar] [CrossRef]
  7. Malmqvist, B.; Rundle, S. Threats to the running water ecosystems of the world. Environ. Conserv. 2002, 29, 134–153. [Google Scholar] [CrossRef]
  8. Walsh, C.J.; Roy, A.H.; Feminella, J.W.; Cottingham, P.D.; Groffman, P.M.; Morgan, R.P. The urban stream syndrome: Current knowledge and the search for a cure. J. N. Am. Benthol. Soc. 2005, 24, 706–723. [Google Scholar] [CrossRef]
  9. Stepenuck, K.F.; Crunkilton, R.L.; Wang, L. Impacts of urban landuse on macroinvertebrate communities in Southeastern Wisconsin streams1. Jawra J. Am. Water Resour. Assoc. 2002, 38, 1041–1051. [Google Scholar] [CrossRef]
  10. Death, R.G.; Baillie, B.; Fransen, P. Effect of Pinus radiata logging on stream invertebrate communities in Hawke’s Bay, New Zealand. N. Z. J. Mar. Freshw. Res. 2003, 37, 507–520. [Google Scholar] [CrossRef]
  11. Thompson, R.M.; Townsend, C.R. Land-use influences on New Zealand stream communities: Effects on species composition, functional organisation, and food-web structure. N. Z. J. Mar. Freshw. Res. 2004, 38, 595–608. [Google Scholar] [CrossRef]
  12. Lowrance, R.; Leonard, R.; Sheridan, J. Managing riparian ecosystems to control nonpoint pollution. J. Soil Water Conserv. 1985, 40, 87–91. [Google Scholar]
  13. Allan, J.D. Landscapes and riverscapes: The influence of land use on stream ecosystems. Annu. Rev. Ecol. Evol. Syst. 2004, 35, 257–284. [Google Scholar] [CrossRef]
  14. Hollis, G.E. The effect of urbanization on floods of different recurrence interval. Water Resour. Res. 1975, 11, 431–435. [Google Scholar] [CrossRef]
  15. Pizzuto, J.E.; Hession, W.C.; McBride, M. Comparing gravel-bed rivers in paired urban and rural catchments of southeastern Pennsylvania. Geology 2000, 28, 79–82. [Google Scholar] [CrossRef]
  16. Gerhardt, A. Biomonitoring Polluted Water; Trans Tech Publications: Stafa-Zurich, Switzerland, 2000. [Google Scholar]
  17. Freshwater Biomonitoring and Benthic Macroinvertebrates; Rosenberg, D.M.; Resh, V.H. (Eds.) Springer: New York, NY, USA, 1993; ISBN 978-0-412-02251-7. [Google Scholar]
  18. Bonada, N.; Prat, N.; Resh, V.H.; Statzner, B. Developments in aquatic insect biomonitoring: A comparative analysis of recent approaches. Annu. Rev. Entomol. 2006, 51, 495–523. [Google Scholar] [CrossRef] [PubMed]
  19. Prat, N.; Ríos, B.; Acosta, R.; Rieradevall, M. Los Macroinvertebrados Como Indicadores de Calidad de las Aguas, 1st ed.; Domínguez, E., Fernández, H., Eds.; San Miguel de Tucumán Fundación Miguel Lillo: Tucumán, Argentina, 2009; ISBN 978-950-668-015-2. [Google Scholar]
  20. Villamarín, C.; Rieradevall, M.; Paul, M.J.; Barbour, M.T.; Prat, N. A tool to assess the ecological condition of tropical high Andean streams in Ecuador and Peru: The IMEERA index. Ecol. Indic. 2013, 29, 79–92. [Google Scholar] [CrossRef]
  21. Fierro, P.; Arismendi, I.; Hughes, R.M.; Valdovinos, C.; Jara-Flores, A. A benthic macroinvertebrate multimetric index for Chilean Mediterranean streams. Ecol. Indic. 2018, 91, 13–23. [Google Scholar] [CrossRef]
  22. Barbour, M.T.; Gerritsen, J.; Griffith, G.E.; Frydenborg, R.; McCarron, E.; White, J.S.; Bastian, M.L. A framework for biological criteria for Florida streams using benthic macroinvertebrates. J. N. Am. Benthol. Soc. 1996, 15, 185–211. [Google Scholar] [CrossRef]
  23. Plafkin, J.L.; Barbour, M.T.; Porter, K.D.; Gross, S.K.; Hughes, R.M. Rapid Bioassessment Protocols for Use in Streams and Rivers: Benthic Macroinvertebrate and Fish; Technincal Report No. EPA/444/4-89-001; Office of Water Regulations and Standards US EPA: Washington, DC, USA, 1989; pp. 1–34. [Google Scholar]
  24. Barbour, M.T.; Yoder, C.O. The multimetric approach to bioassessment, as used in the United States of America. Assessing the biological quality of fresh waters: RIVPACS and other techniques. In Proceedings of the International Workshop held in, Oxford, UK, 16–18 September 1997; pp. 281–292. [Google Scholar]
  25. Resh, V.H.; Norris, R.H.; Barbour, M.T. Design and implementation of rapid assessment approaches for water resource monitoring using benthic macroinvertebrates. Aust. J. Ecol. 1995, 20, 108–121. [Google Scholar] [CrossRef]
  26. Karr, J.R.; Chu, E.W. Biological Monitoring and Assessment: Using Multimetric Indexes Effectively; University of Washington: Wasahington, DC, USA, 1997. [Google Scholar]
  27. Heino, J. The importance of metacommunity ecology for environmental assessment research in the freshwater realm. Biol. Rev. 2013, 88, 166–178. [Google Scholar] [CrossRef]
  28. Delong, M.D.; Brusven, M.A. Macroinvertebrate community structure along the longitudinal gradient of an agriculturally impacted stream. Environ. Manag. 1998, 22, 445–457. [Google Scholar] [CrossRef]
  29. Rabení, C.F.; Doisy, K.E.; Zweig, L.D. Stream invertebrate community functional responses to deposited sediment. Aquat. Sci. 2005, 67, 395–402. [Google Scholar] [CrossRef]
  30. Pont, D.; Hughes, R.M.; Whittier, T.R.; Schmutz, S. A predictive index of biotic integrity model for aquatic-vertebrate assemblages of Western, U.S. Streams. Trans. Am. Fish. Soc. 2009, 138, 292–305. [Google Scholar] [CrossRef]
  31. Herman, M.R.; Nejadhashemi, A.P. A review of macroinvertebrate- and fish-based stream health indices. Ecohydrol. Hydrobiol. 2015, 15, 53–67. [Google Scholar] [CrossRef] [Green Version]
  32. Mathuriau, C.; Silva, N.M.; Lyons, J.; Rivera, L.M.M. Fish and macroinvertebrates as freshwater ecosystem bioindicators in Mexico: Current state and perspectives. In Water Resources in Mexico: Scarcity, Degradation, Stress, Conflicts, Management, and Policy; Oswald Spring, Ú., Ed.; Hexagon Series on Human and Environmental Security and Peace; Springer: Berlin/Heidelberg, Germany, 2011; pp. 251–261. ISBN 978-3-642-05432-7. [Google Scholar]
  33. Arriaga Cabrera, L.; Aguilar Sierra, V.; Alcocer Durán, J. Aguas Continentales y Diversidad Biológica de México; Comisión Nacional para el Conocimiento y Uso de la Biodiversidad (CONABIO): Mexico City, Mexico, 2000; ISBN 970-9000-15-2. [Google Scholar]
  34. Ruiz-Picos, R.A.; Kohlmann, B.; Sedeño-Díaz, J.E.; López-López, E. Assessing ecological impairments in Neotropical rivers of Mexico: Calibration and validation of the biomonitoring working party index. Int. J. Environ. Sci. Technol. 2017, 14, 1835–1852. [Google Scholar] [CrossRef]
  35. Ruiz-Picos, R.A.; Sedeño-Díaz, J.E.; López-López, E.; Ruiz-Picos, R.A.; Sedeño-Díaz, J.E.; López-López, E. Ensambles de macroinvertebrados acuáticos relacionados con diversos usos del suelo en los ríos Apatlaco y Chalma-Tembembe (cuenca del Río Balsas), México. Hidrobiológica 2016, 26, 443–458. [Google Scholar]
  36. Weigel, B.M.; Henne, L.J.; Martínez-Rivera, L.M. Macroinvertebrate-based index of biotic integrity for protection of streams in west-central Mexico. J. N. Am. Benthol. Soc. 2002, 21, 686–700. [Google Scholar] [CrossRef]
  37. Castro-López, D.; Guerra-Cobián, V.; Prat, N. The role of riparian vegetation in the evaluation of ecosystem health: The case of semiarid conditions in Northern Mexico: The riparian forest quality in arid rivers from the north of Mexico. River Res. Appl. 2019, 35, 48–59. [Google Scholar] [CrossRef]
  38. García, E. Modificaciones al Sistema de Clasificación Climática de Köppen; Universidad Nacional Autónoma de México: Mexico City, Mexico, 2004; ISBN 970-32-1010. [Google Scholar]
  39. Ferriño, A.L.F. Delimitación de zonas federales y áreas de amortiguamiento en ríos afectados por el crecimiento urbano como estrategia para prevenir inundaciones. Epistemus Ciencia Tecnología y Salud 2016, 19, 24–33. [Google Scholar]
  40. Anuario Estadístico y Geográfico de Nuevo León 2016; Anuario Estadístico y Geográfico de los Estados Unidos Mexicanos; Anuario Estadístico y Geográfico por Entidad Federativa; Síntesis Estadísticas Municipales; Instituto Nacional de Estadística y Geografía: Mexico City, Mexico, 2017; p. 614. ISBN 978-607-739-993-3.
  41. Torres Barajas, M.; Favela Lara, S.; Alanís Flores, G.; González Rojas, J.I.; Torres Barajas, M.; Favela Lara, S.; Alanís Flores, G.; González Rojas, J.I. Dinámica de uso de suelo en una región hidrológica prioritaria de la cuenca Río Bravo, Nuevo León. Revista Mexicana de Ciencias Forestales 2018, 9, 54–79. [Google Scholar] [CrossRef]
  42. Cañedo-Argüelles, M.; Kefford, B.J.; Piscart, C.; Prat, N.; Schäfer, R.B.; Schulz, C.-J. Salinisation of rivers: An urgent ecological issue. Environ. Pollut. 2013, 173, 157–167. [Google Scholar] [CrossRef] [PubMed]
  43. Williams, W.D. Salinization of rivers and streams: An important environmental hazard. Ambio 1987, 15, 180–185. [Google Scholar]
  44. INEGI. Conjunto De Datos Vectoriales De Uso Del Suelo y Vegetación Escala 1:250,000, Serie VI (Capa Unión); Instituto Nacional de Estadística y Geografía (INEGI): Aguascalientes, Mexico, 2016. [Google Scholar]
  45. INEGI. Simulador de Flujos de Agua de Cuencas Hidrográficas; INEGI: Aguascalientes, Mexico, 2017. [Google Scholar]
  46. Munné, A.; Solá, C.; Pagés, J. Protocolo para la valoración de la calidad hidromorfológica de los ríos; Agencia Catalana de l Aigua: Barcelona, Spain, 2006; p. 82. [Google Scholar]
  47. Valera, C.A.; Pissarra, T.C.T.; Filho, M.V.M.; do Valle Júnior, R.F.; Oliveira, C.F.; Moura, J.P.; Sanches Fernandes, L.F.; Pacheco, F.A.L. The buffer capacity of riparian vegetation to control water quality in anthropogenic catchments from a legally protected area: A critical view over the Brazilian new forest code. Water 2019, 11, 549. [Google Scholar] [CrossRef]
  48. Broadmeadow, S.; Nisbet, T.R. The effects of riparian forest management on the freshwater environment: A literature review of best management practice. Hydrol. Earth Syst. Sci. Discuss. 2004, 8, 286–305. [Google Scholar] [CrossRef]
  49. Vannote, R.L.; Minshall, G.W.; Cummins, K.W.; Sedell, J.R.; Cushing, C.E. The river continuum concept. Can. J. Fish. Aquat. Sci. 1980, 37, 130–137. [Google Scholar] [CrossRef]
  50. Tomanova, S.; Tedesco, P.; Campero, M.; Van Damme, P.; Moya, N.; Oberdorff, T. Longitudinal and altitudinal changes of macroinvertebrate functional feeding groups in neotropical streams: A test of the river continuum concept. Fundam. Appl. Limnol. 2007, 170, 233–241. [Google Scholar] [CrossRef]
  51. Alanís-Rodríguez, E.; Jimenez-Pérez, J.; González-Rodríguez, H.; Canizales-Velázquez, P.A.; Mora-Olivo, A.; Mata Balderas, J.M.; Hernandez Salas, J. Composition, structure and diversity of shrublands in central Nuevo Leon, Mexico. Bot. Sci. 2015, 93. [Google Scholar] [CrossRef] [Green Version]
  52. Esri. ArcGIS 10.2 for Desktop 1999–2013 Esri Inc.; Environmental Systems Research Institute: Redlands, CA, USA, 2013. [Google Scholar]
  53. MAGRAMA. Protocolo de Muestreo y Laboratorio de Fauna Bentónica de Invertebrados en Ríos Vadeables; Secretaría General Técnica. Centro de Publicaciones: Madrid, Spain, 2013. [Google Scholar]
  54. Barbour, M.T.; Stribling, J.B.; Verdonschot, P.F.M. The multihabitat approach of USEPA’s rapid bioassessment protocols: Benthic macroinvertebrates. Limnética 2006, 25, 839–850. [Google Scholar]
  55. Domiguez, E.; Fernandez, H.R. Macroinvertebrados Bentónicos Sudamericanos; Fundacion Miguel Angel Lillo: Tucuman, Argentina, 2009; ISBN 978-950-668-015-2. [Google Scholar]
  56. Lanza-Espino, G.; de la Pulido, S.H. Organismos Indicadores de la Calidad del Agua y de la Contaminación (Bioindicadores); Plaza y Valdes: Madrid, Spain, 2000; ISBN 978-968-856-853-8. [Google Scholar]
  57. Merritt, R.W.; Cummins, K.W.; Daly, H.V.; Wiggins, G.B.; Berg, M.B.; Snider, R.J. An Introduction to Aquatic Insects of North America, 4th ed.; Kendall/Hunt Publishing Co, U.S.: Dubuque, IA, USA, 2008. [Google Scholar]
  58. Tachet, H. Invertébrés d’eau Douce: Systématique, Biologie, Écologie; CNRS Editions: Paris, France, 2010; ISBN 978-2-271-06945-0. [Google Scholar]
  59. Macedo, D.R.; Hughes, R.M.; Ferreira, W.R.; Firmiano, K.R.; Silva, D.R.O.; Ligeiro, R.; Kaufmann, P.R.; Callisto, M. Development of a benthic macroinvertebrate multimetric index (MMI) for neotropical savanna headwater streams. Ecol. Indic. 2016, 64, 132–141. [Google Scholar] [CrossRef]
  60. Edegbene, A.O.; Elakhame, L.A.; Arimoro, F.O.; Osimen, E.C.; Odume, O.N. Development of macroinvertebrate multimetric index for ecological evaluation of a river in North Central Nigeria. Environ. Monit. Assess 2019, 191, 274. [Google Scholar] [CrossRef]
  61. da Silveira de Oliveira, R.B.; Mugnai, R.; da Silva Pereira, P.D.; de Souza, N.F.; Baptista, D.F. A predictive multimetric index based on macroinvetebrates for Atlantic Forest wadeable streams assessment. Biota Neotropica 2019, 19. [Google Scholar] [CrossRef]
  62. Lu, K.; Wu, H.; Xue, Z.; Lu, X.; Batzer, D.P. Development of a multi-metric index based on aquatic invertebrates to assess floodplain wetland condition. Hydrobiologia 2019, 827, 141–153. [Google Scholar] [CrossRef]
  63. Tomanova, S.; Goitia, E.; Helešic, J. Trophic levels and functional feeding groups of macroinvertebrates in neotropical streams. Hydrobiologia 2006, 556, 251–264. [Google Scholar] [CrossRef]
  64. Ramírez, A.; Gutiérrez-Fonseca, P.E. Functional feeding groups of aquatic insect families in Latin America: A critical analysis and review of existing literature. Revista Biología Tropical 2014, 62, 155. [Google Scholar]
  65. Poff, N.L.; Olden, J.D.; Vieira, N.K.M.; Finn, D.S.; Simmons, M.P.; Kondratieff, B.C. Functional trait niches of North American lotic insects: Traits-based ecological applications in light of phylogenetic relationships. J. N. Am. Benthol. Soc. 2006, 25, 730–755. [Google Scholar] [CrossRef]
  66. Oksanen, J.; Blanchet, F.G.; Friendly, M.; Kindt, R.; Legendre, P.; Mcglinn, D. Vegan: Community Ecology Package. R package version 2.0-2. 2017. Available online: https://www.researchgate.net/publication/ 282247686 (accessed on 6 June 2019).
  67. Anderson, M.J. A new method for non-parametric multivariate analysis of variance. Austral Ecol. 2001, 26, 32–46. [Google Scholar]
  68. Dufrêne, M.; Legendre, P. Species assemblages and indicator species:The need for a flexible asymmetrical approach. Ecol. Monogr. 1997, 67, 345–366. [Google Scholar] [CrossRef]
  69. Thioulouse, J.; Dray, S.; Dufour, A.-B.; Siberchicot, A.; Jombart, T.; Pavoine, S. Multivariate Analysis of Ecological Data with Ade4; Springer: New York, NY, USA, 2018; ISBN 978-1-4939-8848-8. [Google Scholar]
  70. Roberts, D. Labdsv: Ordination and Multivariate Analysis for Ecology. R package version 1.7-0. 2015. Available online: https://github.com/cran/labdsv/commit/a56af17c747fd1480a0cac60818928776fc07edf (accessed on 5 May 2019).
  71. Feld, C.K.; Segurado, P.; Gutiérrez-Cánovas, C. Analysing the impact of multiple stressors in aquatic biomonitoring data: A cookbook with applications in R. Sci. Total Environ. 2016, 573, 1320–1339. [Google Scholar] [CrossRef]
  72. Akaike, H. Information theory and an extension of the maximum likelihood principle. In Proceedings of the Second International Symposium on Information Theory, Akademiai Kaido, Budapest, Hungary, 2–8 September 1973; Akademiai Kaido: Budapest, Hungary, 1973. [Google Scholar]
  73. Zuur, A.; Ieno, E.N.; Walker, N.; Saveliev, A.A.; Smith, G.M. Mixed Effects Models and Extensions in Ecology with R; Springer Science & Business Media: Berlin/Heidelberg, Germany, 2009; ISBN 978-0-387-87458-6. [Google Scholar]
  74. Nakagawa, S.; Schielzeth, H. A general and simple method for obtaining R2 from generalized linear mixed-effects models. Methods Ecol. Evol. 2013, 4, 133–142. [Google Scholar] [CrossRef]
  75. Gutiérrez-Cánovas, C.; Escribano-Ávila, G. Inferencia estadística a partir de varios modelos y su utilidad en ecología. Revista Ecosistemas 2019, 28, 118–120. [Google Scholar]
  76. Team R.C.R. A Language and Environment for Statistical Computing; R Foundation for Statistical Computing: Vienna, Austria, 2017. [Google Scholar]
  77. Racine, J.S. RStudio: A platform-independent IDE for R and sweave. J. Appl. Econ. 2012, 27, 167–172. [Google Scholar] [CrossRef]
  78. Johnson, R.C.; Jin, H.-S.; Carreiro, M.M.; Jack, J.D. Macroinvertebrate community structure, secondary production and trophic-level dynamics in urban streams affected by non-point-source pollution. Freshw. Biol. 2013, 58, 843–857. [Google Scholar] [CrossRef]
  79. Hillebrand, H.; Bennett, D.M.; Cadotte, M.W. Consequences of dominance: A review of evenness effects on local and regional ecosystem processes. Ecology 2008, 89, 1510–1520. [Google Scholar] [CrossRef] [PubMed]
  80. Rutherford, J.C.; Kefford, B.J. Effects of Salinity on Stream Ecosystems: Improving Models for Macroinvertebrates; CSIRO: Canaberra, Australia, 2005. [Google Scholar]
  81. Velasco, J.; Millán, A.; Hernández, J.; Gutiérrez, C.; Abellán, P.; Sánchez, D.; Ruiz, M. Response of biotic communities to salinity changes in a Mediterranean hypersaline stream. Saline Syst. 2006, 2, 12. [Google Scholar] [CrossRef] [PubMed]
  82. Zinchenko, T.D.; Golovatyuk, L.V. Salinity tolerance of macroinvertebrates in stream waters (review). Arid Ecosyst. 2013, 3, 113–121. [Google Scholar] [CrossRef]
  83. Fierro, P.; Bertrán, C.; Tapia, J.; Hauenstein, E.; Peña-Cortés, F.; Vergara, C.; Cerna, C.; Vargas-Chacoff, L. Effects of local land-use on riparian vegetation, water quality, and the functional organization of macroinvertebrate assemblages. Sci. Total Environ. 2017, 609, 724–734. [Google Scholar] [CrossRef] [PubMed]
  84. Acosta, R.; Ríos, B.; Rieradevall, M.; Prat, N. Propuesta de un protocolo de evaluación de la calidad ecológica de ríos andinos (CERA) y su aplicación a dos cuencas en Ecuador y Perú. Limnética 2009, 28, 35–64. [Google Scholar]
  85. Roldán, G. Revista de la Academia Colombiana de Ciencias Exactas Físicas y Naturales; Ministerio de Educación Nacional: Bogota, Columbia, 1999; pp. 375–387. [Google Scholar]
  86. Junqueira, V.M.; Campo, S.C.M. Adaptation of the BMWP for water quality evaluation to Rio das Velhas watershed (Minas Gerais, Brazil). Acta Limnologica Brasiliense 1998, 10, 125–135. [Google Scholar]
  87. Santiago-Fragoso, S.; Sandoval-Manrique, J.C. Coleópteros acuáticos y su relación con la dinámica fisicoquímica del Río Cuautla (Tramo Tetelcingo-Anenecuilco), Morelos, México. Hidrobiológica 2001, 11, 19–29. [Google Scholar]
  88. Twisk, W.; Noordervliet, M.A.W.; ter Keurs, W.J. Effects of ditch management on caddisfly, dragonfly and amphibian larvae in intensively farmed peat areas. Aquat. Ecol. 2000, 34, 397–411. [Google Scholar] [CrossRef]
  89. Koperski, P. Testing the suitability of leeches (Hirudinea, Clitellata) for biological assessment of lowland streams. Pol. J. Ecol. 2005, 53, 65–80. [Google Scholar]
  90. Burcher, C.L.; Benfield, E.F. Physical and biological responses of streams to suburbanization of historically agricultural watersheds. J. N. Am. Benthol. Soc. 2006, 25, 356–369. [Google Scholar] [CrossRef]
  91. Roy, A.H.; Rosemond, A.D.; Paul, M.J.; Leigh, D.S.; Wallace, J.B. Stream macroinvertebrate response to catchment urbanisation (Georgia, U.S.A.). Freshw. Biol. 2003, 48, 329–346. [Google Scholar]
  92. Kefford, B.J.; Marchant, R.; Schäfer, R.B.; Metzeling, L.; Dunlop, J.E.; Choy, S.C.; Goonan, P. The definition of species richness used by species sensitivity distributions approximates observed effects of salinity on stream macroinvertebrates. Environ. Pollut. 2011, 159, 302–310. [Google Scholar] [CrossRef]
  93. Short, T.M.; Black, J.A.; Birge, W.J. Ecology of a saline stream: Community responses to spatial gradients of environmental conditions. Hydrobiologia 1991, 226, 167–178. [Google Scholar] [CrossRef]
  94. Gallardo-Mayenco, A. Freshwater macroinvertebrate distribution in two basins with different salinity gradients (Guadalete and Guadaira river basins, south-western Spain). Int. J. Salt Lake Res. 1994, 3, 75–91. [Google Scholar] [CrossRef]
  95. Kay, W.R.; Halse, S.A.; Scanlon, M.D.; Smith, M.J. Distribution and environmental tolerances of aquatic macroinvertebrate families in the agricultural zone of southwestern Australia. J. N. Am. Benthol. Soc. 2001, 20, 182–199. [Google Scholar] [CrossRef]
  96. Naranjo López, C.; González Lazo, D.D.; Garcés González, G.; Brandimarte, A.L.; Muñoz Riveaux, S.; Musle Cordero, Y. Una metodología rápida y de fácil aplicación para la evaluación de la calidad del agua utilizando el índice BMWP-Cub para ríos cubanos. Tecnura 2005, 9, 65–76. [Google Scholar]
  97. Kholmogorova, N.V. Transformation Macrozoobenthos in the Small Rivers of Udmurtia Affected by Oil Mining, Extended Abstract of Cand. Sci. (Biol.). Ph.D. Dissertation, Kazan Federal University, Kazan, Russia, 2009. [Google Scholar]
  98. Piscart, C.; Moreteau, J.-C.; Beisel, J.-N. Biodiversity and structure of macroinvertebrate communities Along a small permanent salinity gradient (Meurthe River, France). Hydrobiologia 2005, 551, 227–236. [Google Scholar] [CrossRef]
  99. Figueroa, R.; Palma, A.; Ruiz, V.; Niell, X. Análisis comparativo de índices bióticos utilizados en la evaluación de la calidad de las aguas en un río mediterráneo de Chile: Río Chillán, VIII región. Revista Chilena de Historia Natural 2007, 80, 225–242. [Google Scholar] [CrossRef]
  100. Stewart, K.W. Chapter 205—Plecoptera: Stoneflies. In Encyclopedia of Insects, 2nd ed.; Academic Press: San Diego, CA, USA, 2009. [Google Scholar]
  101. Sánchez-Fernández, D.; Abellán, P.; Mellado, A.; Velasco, J.; Millán, A. Are water beetles good indicators of biodiversity in mediterranean aquatic ecosystems The case of the segura river basin (SE Spain). Biodivers. Conserv. 2006, 15, 4507–4520. [Google Scholar] [CrossRef]
  102. Moreno, J.L.; Suárez, M.L.; Vidal-Abarca, M.R. Valor ecológico de las ramblas como sistemas acuáticos singulares. In ‘Tomo extraordinario, 125 Aniversario de la Real Sociedad Española de Historia Natural’; Real Sociedad Española de Historia Natural: Madrid, Spain, 1996; pp. 411–414. [Google Scholar]
  103. Abellán, P.; Sánchez-Fernández, D.; Velasco, J.; Millán, A. Assessing conservation priorities for insects: Status of water beetles in southeast Spain. Biol. Conserv. 2005, 121, 79–90. [Google Scholar] [CrossRef]
  104. Kefford, B.J.; Buchwalter, D.; Cañedo-Argüelles, M.; Davis, J.; Duncan Richard, P.; Hoffmann, A.; Thompson, R. Salinized rivers: Degraded systems or new habitats for salt-tolerant faunas. Biol. Lett. 2016, 12, 20151072. [Google Scholar] [CrossRef] [PubMed]
  105. Kefford, B.J.; Papas, P.J.; Nugegoda, D. Relative salinity tolerance of macroinvertebrates from the Barwon River, Victoria, Australia. Mar. Freshw. Res. 2003, 54, 755–765. [Google Scholar] [CrossRef] [Green Version]
  106. MINAE. Reglamento Para la Evaluación y Clasificación de la Calidad de Cuerpos de Agua Superficiales; Technical Report No. 33903; La Gaceta: San José, Costa Rica, 2007; pp. 1–21. [Google Scholar]
  107. Davis, J.R. The creeping water bugs (Hemiptera: Naucoridae) of Texas. Southwest. Nat. 1996, 41, 1–26. [Google Scholar]
  108. Alba Tercedor, J.; Jáimez-Cuéllar, P.; Álvarez, M.; Avilés, J.; Bonada i Caparrós, N.; Casas, J.; Mellado, A.; Ortega, M.; Pardo, I.; Prat i Fornells, N.; et al. Caracterización del estado ecológico de ríos mediterráneos ibéricos mediante el índice IBMWP (antes BMWP’). Limnetica 2002, 21, 175–185. [Google Scholar]
  109. Ríos-Touma, B.; Acosta, R.; Prat, N. The andean biotic index (ABI): Revised tolerance to pollution values for macroinvertebrate families and index performance evaluation. Rev. De Biol. Trop. 2014, 62, 249–273. [Google Scholar] [CrossRef]
  110. Alvarez, L.F.; Roldan, G. Estudio del orden Hemiptera (Heteroptera) en el departamento de Antioquia en diferentes pisos altitudinales. Actualidades Biológicas 1983, 12, 31–46. [Google Scholar]
  111. Paul, M.J.; Meyer, J.L. Streams in the Urban Landscape. Annu. Rev. Ecol. Syst. 2001, 32, 333–365. [Google Scholar] [CrossRef]
  112. Freeman, P.L.; Schorr, M.S. Influence of watershed urbanization on fine sediment and macroinvertebrate assemblage characteristics in Tennessee Ridge and valley streams. J. Freshw. Ecol. 2004, 19, 353–362. [Google Scholar] [CrossRef]
  113. Dyer, S.D.; Wang, X. A comparison of stream biological responses to discharge from wastewater treatment plants in high and low population density areas. Environ. Toxicol. Chem. 2002, 21, 1065–1075. [Google Scholar] [CrossRef] [PubMed]
  114. Shannon, C.E. A mathematical theory of communication. Bell Syst. Tech. J. 1948, 27, 379–423. [Google Scholar] [CrossRef]
  115. Serrano Balderas, E.C.; Grac, C.; Berti-Equille, L.; Armienta, H.M.A. Potential application of macroinvertebrates indices in bioassessment of Mexican streams. Ecol. Indic. 2016, 61, 558–567. [Google Scholar] [CrossRef]
  116. Cummins, K.W. Structure and function of stream ecosystems. BioScience 1974, 24, 631–641. [Google Scholar] [CrossRef]
  117. Kerans, B.L.; Karr, J.R. A benthic index of biotic integrity (B-IBI) for rivers of the Tennessee valley. Ecol. Appl. 1994, 4, 768–785. [Google Scholar] [CrossRef]
  118. Wallace, J.B.; Webster, J.R. The role of macroinvertebrates in stream ecosystem function. Annu. Rev. Entomol. 1996, 41, 115–139. [Google Scholar] [CrossRef] [PubMed]
  119. Miserendino, M.L.; Masi, C.I. The effects of land use on environmental features and functional organization of macroinvertebrate communities in Patagonian low order streams. Ecol. Indic. 2010, 10, 311–319. [Google Scholar] [CrossRef]
  120. Miserendino, M.L.; Pizzolon, L.A. Interactive effects of basin features and land-use change on macroinvertebrate communities of headwater streams in the Patagonian Andes. River Res. Appl. 2004, 20, 967–983. [Google Scholar] [CrossRef]
  121. Hepp, L.U.; Santos, S. Benthic communities of streams related to different land uses in a hydrographic basin in southern Brazil. Environ. Monit. Assess 2009, 157, 305–318. [Google Scholar] [CrossRef]
  122. Fu, L.; Jiang, Y.; Ding, J.; Liu, Q.; Peng, Q.-Z.; Kang, M.-Y. Impacts of land use and environmental factors on macroinvertebrate functional feeding groups in the Dongjiang River basin, southeast China. J. Freshw. Ecol. 2016, 31, 21–35. [Google Scholar] [CrossRef]
  123. Ley de Aguas Nacionales (L.A.N.). Comisión Nacional del Agua. Diario Oficial de la Federación. 01 de diciembre de 1992 México. Available online: http://www.diputados.gob.mx/LeyesBiblio/ref/lan.htm (accessed on 6 June 2018).
Figure 1. Illustration of the riparian buffer preparation.
Water 11 01930 g001
Figure 2. The Pesquería River non-metric multidimensional scaling (NMDS) based on square root relative abundances and Bray–Curtis distance. (NMDS stress value = 0.13). All the sampling sites represented by “square” are from the wet season sampling campaign and “circle” is used for the dry season sampling campaign. Each land use class is represented, with natural in blue, urban in dark red, and agricultural in orange.
Water 11 01930 g002
Table 1. Biological metrics categories and their expected response to anthropogenic pressures [20,21,59,60,61,62].
Biological MetricsExpected Response to Anthropogenic Activities
Category I “Taxonomic richness”
RichnessDecrease
Rarified RichnessDecrease
Richness OCH (odonata + coleoptera + heteroptera)Decrease
Richness EPT (ephemeroptera + plecoptera + trichoptera)Decrease
Richness EPT/(richness EPT + richness OCH)Decrease
Richness EphemeropteraDecrease
Richness TrichopteraDecrease
Richness OdonataDecrease
Richness ColeopteraDecrease
Richness DipteraDecrease
Richness Diptera wihout chironomidaeDecrease
Richness GasteropodaDecrease
Richness non-insect taxa (amphipoda + copepoda + ostracoda + gateropoda + oligochaeta + hirudinea)Decrease
Category II “Taxonomic composition”
% OCH (odonata + coleoptera + heteroptera)Decrease
% EPT (ephemeroptera + plecoptera + trichoptera)Decrease
% EPT/(% EPT + % OCH)Decrease
% EphemeropteraDecrease
% TrichopteraDecrease
% OdonataDecrease
% ColeopteraDecrease
% DipteraIncrease
% Diptera wihout chironomidaeDecrease
% GasteropodaDecrease
% Non-insect taxa (amphipoda + copepoda + ostracoda + gateropoda + oligochaeta + hirudinea)Increase
% Baetidae/% EPTDecrease
% Baetidae/% EphemeropteraDecrease
% Hydropsychidae/% EPTDecrease
% Hydropsychidae/% EphemeropteraDecrease
% ChironomidaeIncrease
% OligochaetaIncrease
% Chironomidae + % OligochaetaIncrease
Categoty III “Diversity indexes”
Shannon’s Diversity using base eDecrease
Simpson’s DiversityDecrease
Pielou’s EvennessDecrease
Category IV “Functional feeding groups”
Richness Collectors-GatherersDecrease
% Collectors-GatherersIncrease
Richness PredatorsDecrease
% PredatorsDecrease
Richness HerbivoresDecrease
% HerbivoresDecrease
Richness Collectors-FilterersDecrease
% Collectors-FilterersDecrease
Table 2. Results of the indicator species analysis (IndVal), maximum IV significance (IV is the individual value), associated to land use class for each species (NAT for Natural, URB for Urban, and AGR for agricultural land use).
ORDERTAXACLASSIVp-Value
OdonataOphiogomphusNAT10.001
TrichopteraOxyethiraNAT10.001
HemipteraAmbrysusNAT0.990.001
EphemeropteraBaetisNAT0.900.001
DipteraAtrichpogonNAT0.830.001
ColeopteraMacrelmisNAT0.810.001
HemipteraRhagoveliaNAT0.780.001
TrichopteraAgryaleaNAT0.730.007
TrichopteraChimarraNAT0.670.002
ColeopteraPsephenusNAT0.670.002
EphemeropteraFarrodesNAT0.660.004
EphemeropteraTricorythodesNAT0.660.001
TrichopteraMayatrichiaNAT0.660.002
MegalopteraCorydalusNAT0.650.001
DipteraLimoniiaNAT0.650.002
DipteraStratiomysNAT0.650.001
DipteraCeratopogonNAT0.620.011
OdonataNehalenniaNAT0.610.028
LepidopteraPetrophilaNAT0.60.009
EphemeropteraCaenisNAT0.570.002
GasteropodaM. tuberculataNAT0.530.025
EphemeropteraCamelobaetisNAT0.500.003
ColeopteraCymbioditaNAT0.500.007
DipteraHemerodromiaNAT0.500.008
OdonataMacrothemisNAT0.460.007
ColeopteraLutrochusNAT0.460.013
EphemeropteraCallibaetisNAT0.450.007
TrichopteraLeucotrichiaNAT0.430.012
ColeopteraParacymusNAT0.330.035
DipteraA. fransiscanusNAT0.330.039
DipteraEuparhypusNAT0.330.023
ColeopteraBerosusURB0.790.001
AmphipodaHyallela aztecaAGR0.690.003
HirudineaErpobdellidaeAGR0.640.002
DipteraChironomusAGR0.450.012
OdonataIschnuraAGR0.360.029

