Article

Physically Based Estimation of Rainfall Thresholds Triggering Shallow Landslides in Volcanic Slopes of Southern Italy

1
Dipartimento di Scienze della Terra, dell’Ambiente e delle Risorse (DiSTAR), University of Naples Federico II, Complesso Universitario di Monte Sant’Angelo, Via Cinthia, Edificio L1, 80126 Naples, Italy
2
U.S. Geological Survey, 1711 Illinois St., Golden 80401, CO, USA
*
Author to whom correspondence should be addressed.
Water 2019, 11(9), 1915; https://doi.org/10.3390/w11091915
Submission received: 28 July 2019 / Revised: 2 September 2019 / Accepted: 6 September 2019 / Published: 14 September 2019
(This article belongs to the Special Issue The Role of Water in Shallow and Deep Landslides)

Abstract

:
On the 4th and 5th of March 2005, about 100 rainfall-induced landslides occurred along volcanic slopes of Camaldoli Hill in Naples, Italy. These started as soil slips in the upper substratum of incoherent and welded volcaniclastic deposits, then evolved downslope according to debris avalanche and debris flow mechanisms. This specific case of slope instability on complex volcaniclastic deposits remains poorly characterized and understood, although similar shallow landsliding phenomena have largely been studied in other peri-volcanic areas of the Campania region underlain by carbonate bedrock. Considering the landslide hazard in this urbanized area, this study focused on quantitatively advancing the understanding of the predisposing factors and hydrological conditions contributing to the initial landslide triggering. Borehole drilling, trial pits, dynamic penetrometer tests, topographic surveys, and infiltration tests were conducted on a slope sector of Camaldoli Hill to develop a geological framework model. Undisturbed soil samples were collected for laboratory testing to further characterize hydraulic and geotechnical properties of the soil units identified. In situ soil pressure head monitoring probes were also installed. A numerical model of two-dimensional variably saturated subsurface water flow was parameterized for the monitored hillslope using field and laboratory data. Based on the observed soil pressure head dynamics, the model was calibrated by adjusting the evapotranspiration parameters. This physically based hydrologic model was combined with an infinite-slope stability analysis to reconstruct the critical unsaturated/saturated conditions leading to slope failure. This coupled hydromechanical numerical model was then used to determine intensity–duration (I-D) thresholds for landslide initiation over a range of plausible rainfall intensities and topographic slope angles for the region. The proposed approach can be conceived as a practicable method for defining a warning criterion in urbanized areas threatened by rainfall-induced shallow landslides, given the unavailability of a consistent inventory of past landslide events that prevents a rigorous empirical analysis.

Graphical Abstract

1. Introduction

The city of Naples (southern Italy), the regional capital and the third most populous city of Italy with about one million inhabitants, is an emblematic urban setting highly vulnerable to a variety of geohazards, such as volcanic eruptions, bradyseism, earthquakes, coastal erosion, sinkholes, floods, and landslides. Due to uncontrolled growth of the city after the Second World War, which accelerated in the 1970s, peripheral zones exposed to natural hazards, such as floods and landslides, were progressively occupied, inducing a consequent increase of risk [1]. Subsequently, in recent years, repeated rainfall-induced shallow landslides, involving ash-fall pyroclastic soil covers on steep slopes, have impacted these recently urbanized areas [2]. One of the most important landslide events occurred on the 4th and 5th of March 2005 with about 100 shallow landslides on the slopes of Camaldoli Hill (458 m a.s.l.), which looms above the northern sector of the Naples’ urban area (Figure 1). Landslides at Camaldoli Hill occurred as soil slips [3] that evolved into debris avalanches [4], but in most cases, stopped on slopes or at footslopes and did not evolve into debris flows [4]; however, even cases of hyperconcentrated flows or debris floods were observed in the urban area’s drainage network. These landslides primarily involved the surficial pedogenized soil horizons of the volcaniclastic deposits forming the present-day soil, namely the A and B pedological soil horizons [5]. Although none of these landslides caused fatalities or significant damage, they represent an alarming reminder about the potential threat for the population living along the foothill areas surrounding the city of Naples. As an example of such a hazard in the territory of Naples, more than 300 mass movements occurred in January 1997 on steep slopes across the entire city [2,6], thus demonstrating the widespread potential for slope instability under heavy rainstorms.

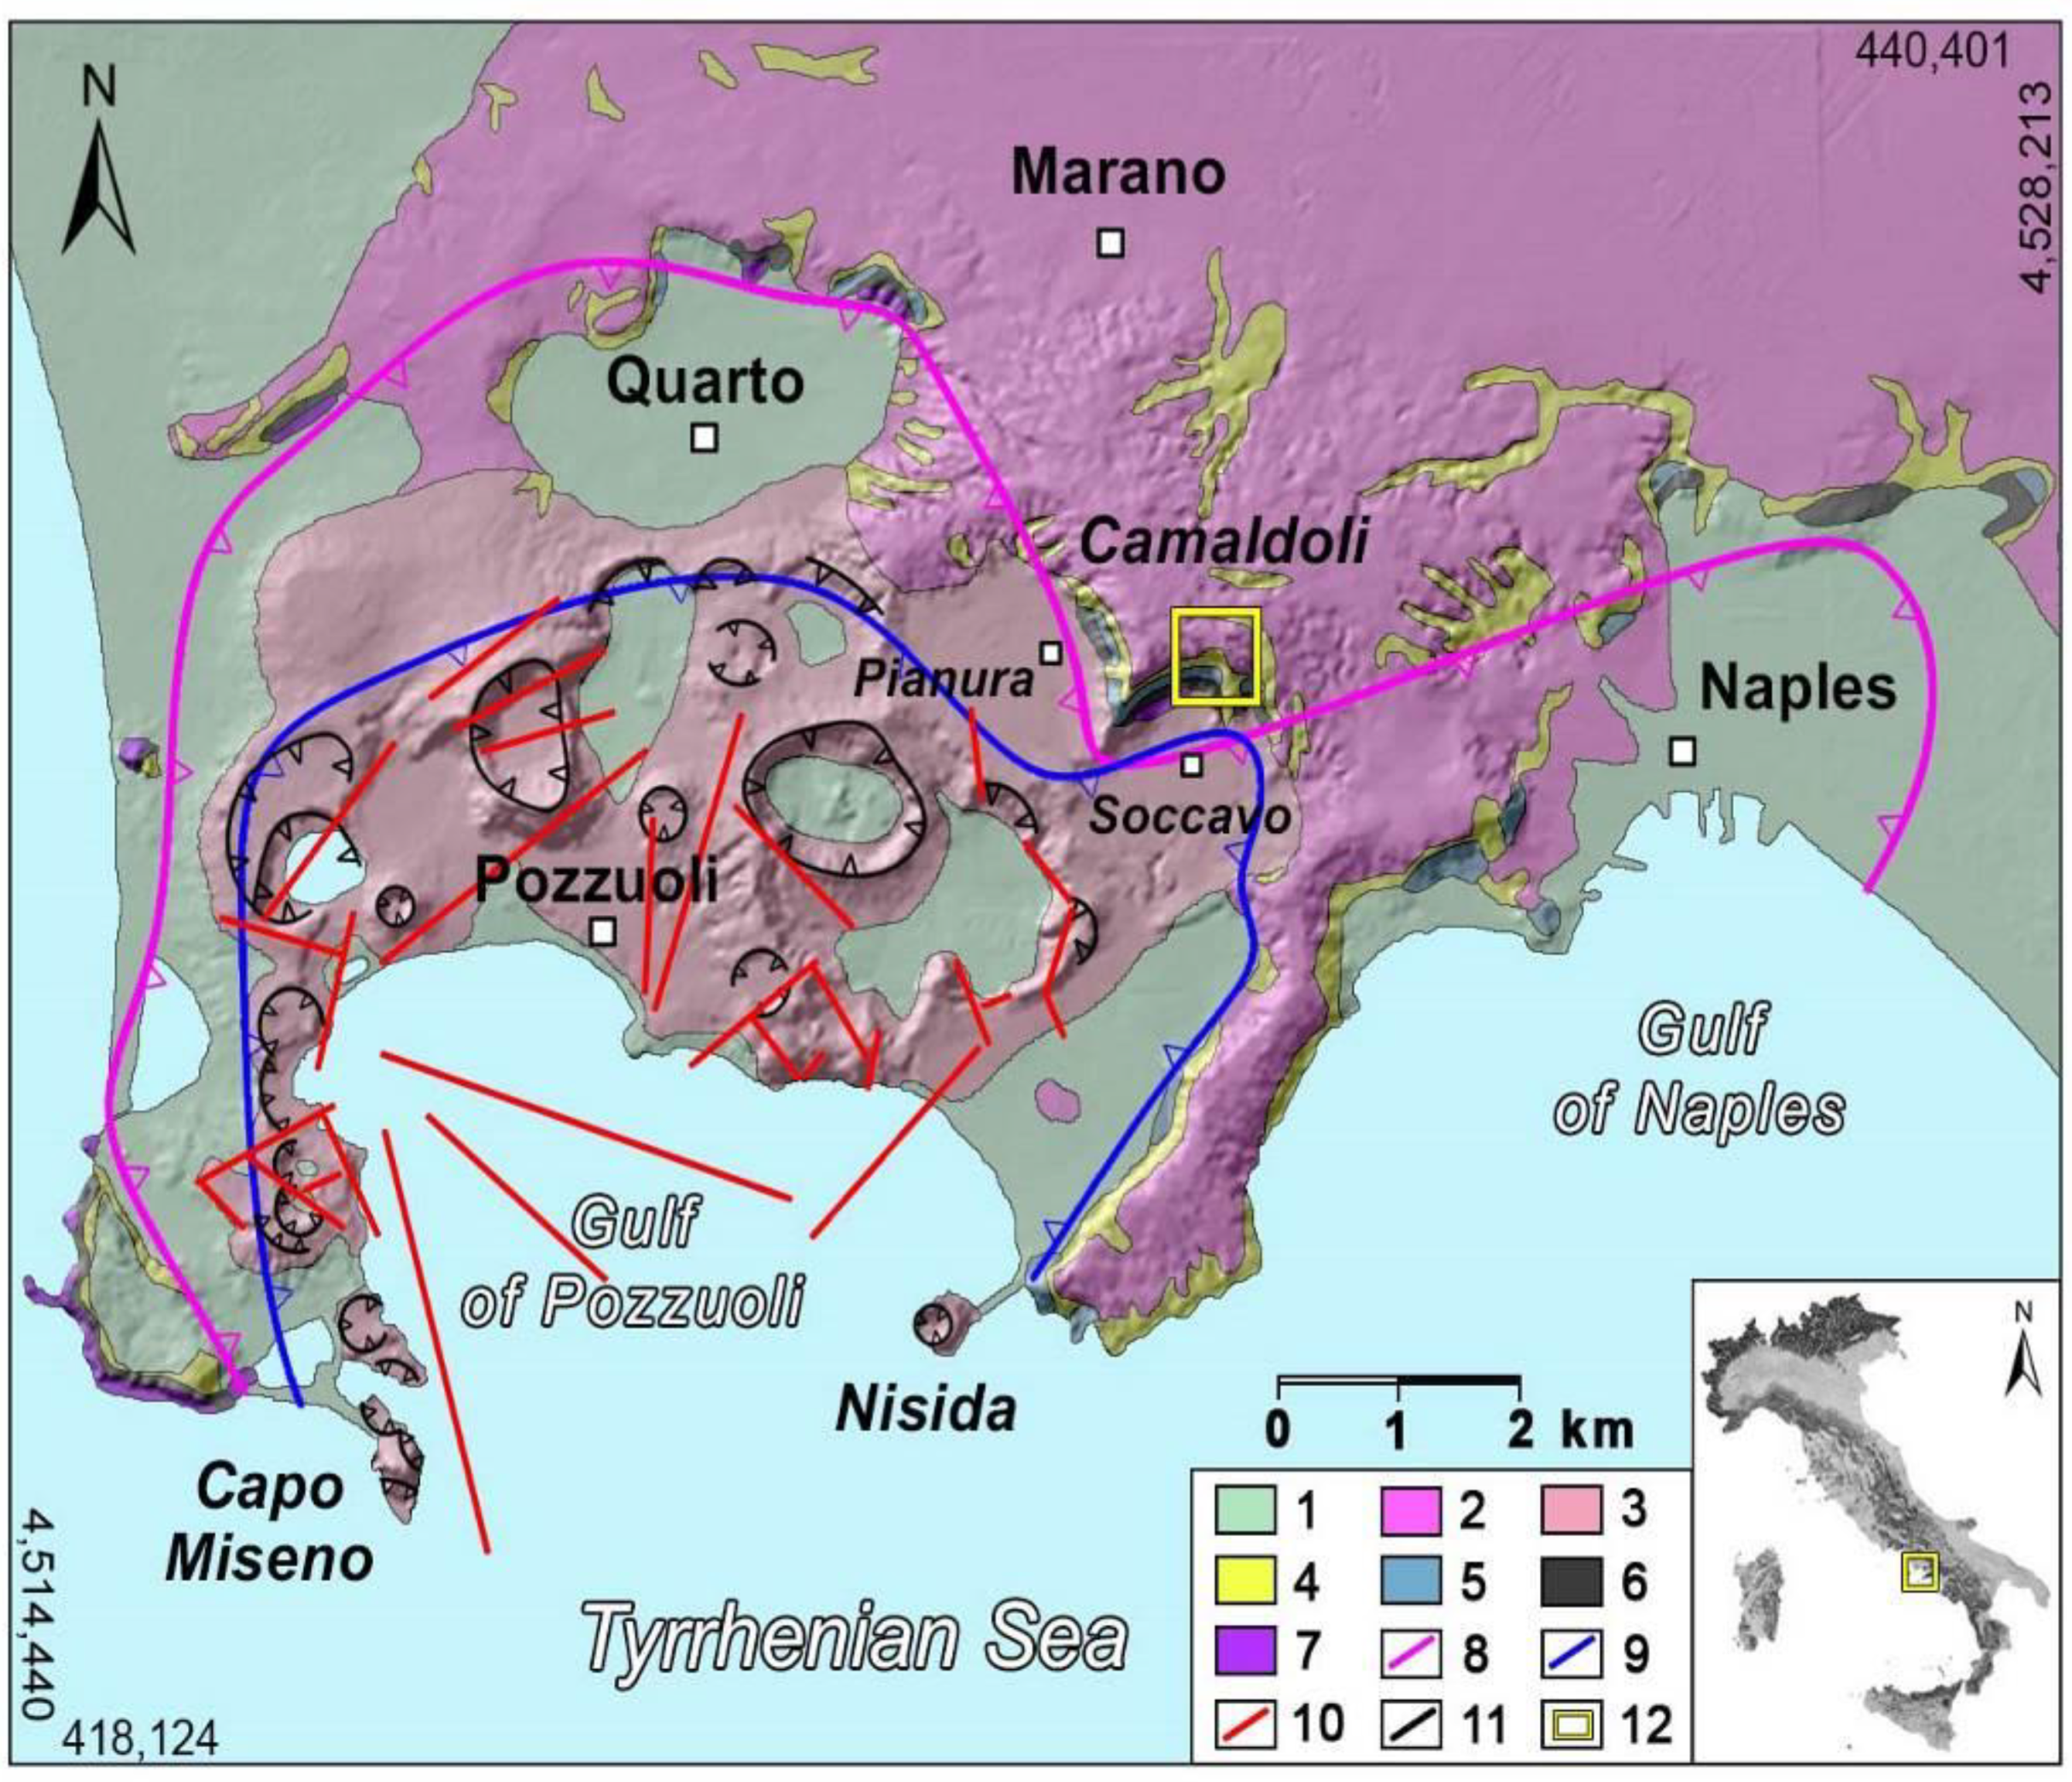
1.1. Geological Setting

Camaldoli Hill is a remnant of a volcanic structure formed by a volcaniclastic series deposited during the different activity phases of the Phlegrean Fields volcanoes [7]. The series has a south-dipping attitude of about 10°, which is lower than the typical topographic slope angles of 35° to 80°. The representative stratigraphic setting of the sample area exhibits a thick, multilayered unconsolidated volcaniclastic series overlying a bedrock formed by tuff rock masses. The volcaniclastic sequence is characterized by alternating pedogenized, fine ash (or cineritic), and pumiceous horizons, deriving from different cycles of eruptive and dormant phases of the Phlegrean Fields volcanoes. The geological and geomorphological setting of Phlegrean Fields has resulted from constructive volcanic and destructive volcano–tectonic events (Figure 2), as well as sea-level fluctuations [8,9]. The principal geologic structure of this area is formed by a large caldera deriving from two main collapses, related to the eruptions of the Campanian Ignimbrite (CI; 39 k-years B.P.) [10] and the Neapolitan Yellow Tuff (NYT; 15 k-years B.P.) [11]. After these principal volcanic events, no fewer than 70 minor explosive eruptions occurred within the Phlegrean Fields caldera, which were clustered in three periods of volcanic activity and ending with the last low-intensity Monte Nuovo eruption (1538 A.D.).
The area is also affected by the bradyseism phenomena with cyclical uplift and subsidence, which has favored erosional and depositional marine processes [7]. The resulting morpho-structural setting of Phlegrean Fields is characterized by several coastal and internal plains located at different elevations and often bordered by very steep slopes.

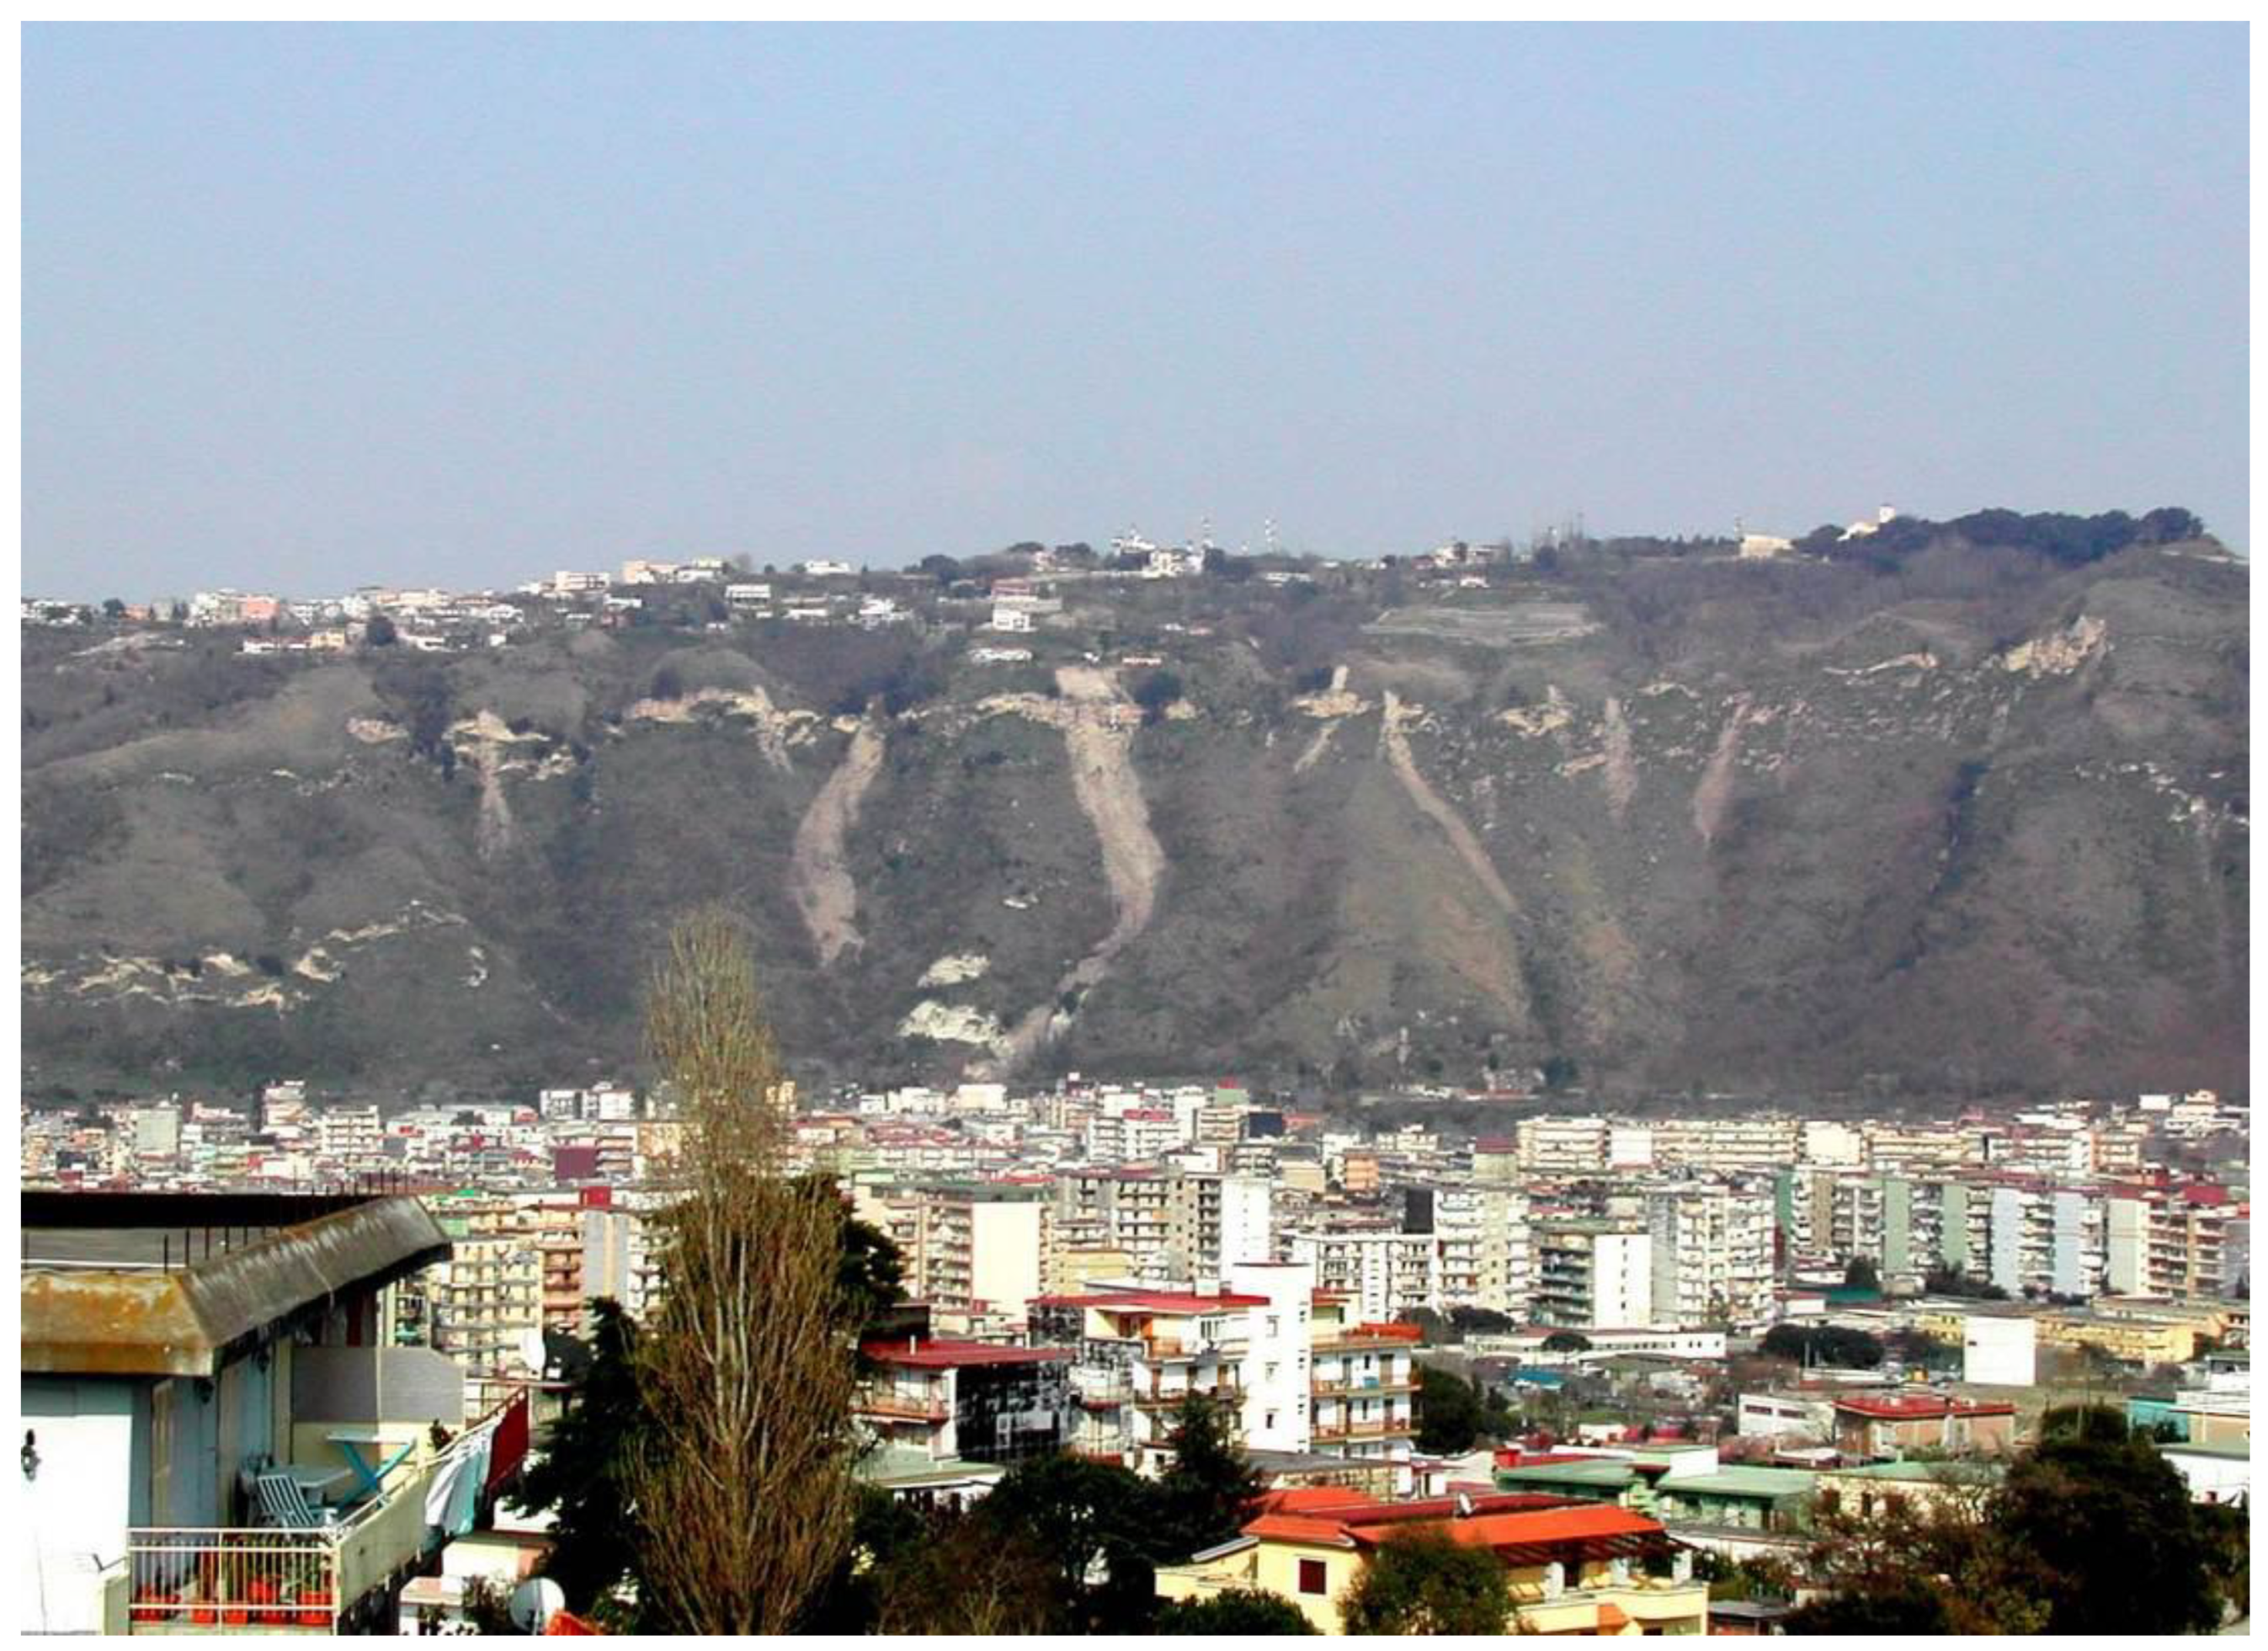
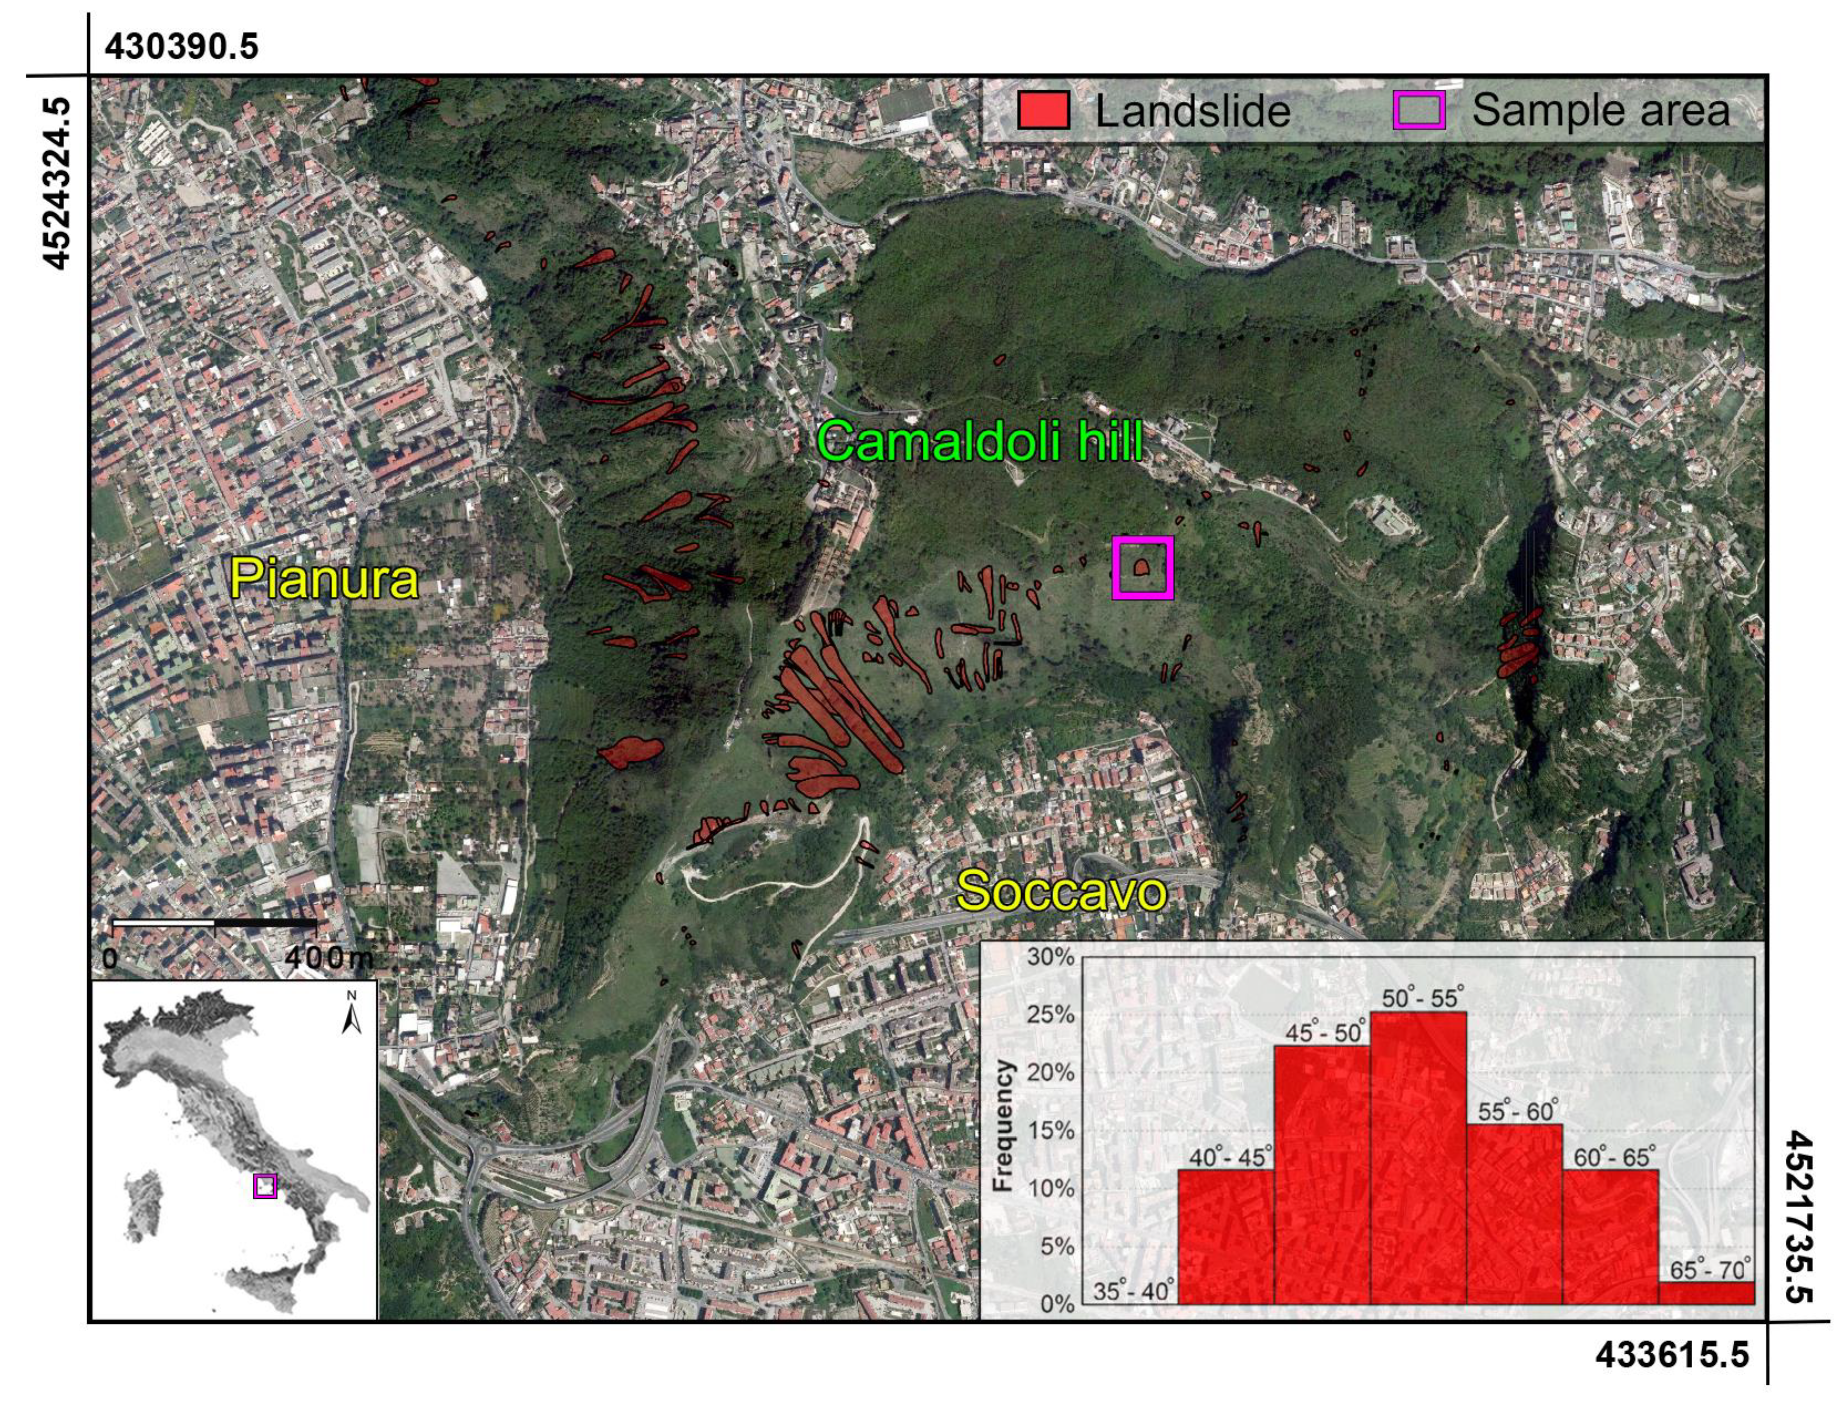
1.2. Landslides Processes

Due to widespread steep geomorphological settings of volcano structures, slope instabilities with different triggering mechanisms and kinematics occur across the area, involving both lithified (tuff and effusive volcanic rocks) and incoherent materials (present-day soil and loose pyroclastic deposits). The latter are prone to flow-like shallow landslides triggered by long-duration and/or intense rainfall events, particularly if preceded by significant rainy periods. These landslides have a complex style [12] because they are initiated by planar slides, which involve shallower pyroclastic soil horizons, and then evolve downslope by means of debris avalanches or debris flows.
The shear strength of these volcaniclastic soils and of the shallowest pedogenized present-day soil are influenced primarily by seasonal and short-term variability of soil pore-water pressures that control the apparent cohesion and tensile strength, and secondly, by plant-root systems that provide additional slope reinforcement [13,14]. In the unsaturated domain, the increase of pore pressure implies a decrease of shear strength because of both apparent cohesion and effective stress reduction [15], which can be critical for slope stability. In the last two decades, numerous studies have focused on mechanisms of deadly debris flows involving ash-fall pyroclastic covers in the carbonate mountain ranges nearby Naples and surrounding Somma Vesuvius volcano, such as those that occurred in the 5th and 6th of May 1998 catastrophic event [16]. However, processes that trigger shallow landslides in soils of pyroclastic origins mantling a volcaniclastic bedrock remain poorly characterized.

1.3. Scope of the Research
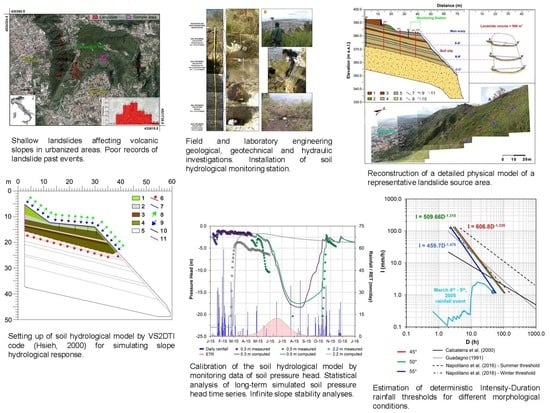
Given that Naples’ peripheral urban areas are exposed to dangerous effects of shallow flow-like landslides occurring along steep volcanic slopes of the Phlegrean Fields, the principal objectives of this study are to advance the understanding of antecedent and triggering hydrological conditions leading to onset of slope instability and to estimate an Intensity-Duration (I-D) rainfall threshold [17] to be used for establishing an early warning system in areas underlain by volcanic bedrock.
The study relies on detailed field observations and laboratory tests used to develop a geologic framework model of a test area on the Camaldoli Hill, as well as in situ soil hydrological monitoring to assess hillslope hydrologic response to rainfall and evapotranspiration. These site characterization and monitoring data are used to parameterize and calibrate a physically based model simulating the hydrological response of the pyroclastic soil cover under different rainfall and antecedent soil hydrological conditions. The hydrologic model, after a calibration based on the soil hydrological monitoring data, is used to estimate slope stability for three representative topographic conditions, considering the infinite slope approach. These representative slope models, expressing the potential range of critical unsaturated/saturated hydrological conditions leading to slope failures, are then used to construct I-D thresholds for shallow landslide initiation across a range of potential rainfall conditions (e.g., [18,19,20,21,22]).
The proposed approach and results obtained are intended to achieve two relevant goals. The first is to advance the knowledge about physical modelling, mechanisms, and hydrological processes controlling rainfall-induced shallow landslides occurring along volcanic slopes. These are topics not considered by the high number of studies carried out in the last two decades in the Campania region (southern Italy), which were chiefly focused on the Sarno-type debris flows [16] involving ash-fall pyroclastic soils covering a carbonate bedrock. The second is to propose a practicable method for defining a warning criterion in urbanized areas threatened by rainfall-induced shallow landslides, given the unavailability of a consistent inventory of past landslide events that prevents any rigorous empirical analysis.

2. Data and Methods

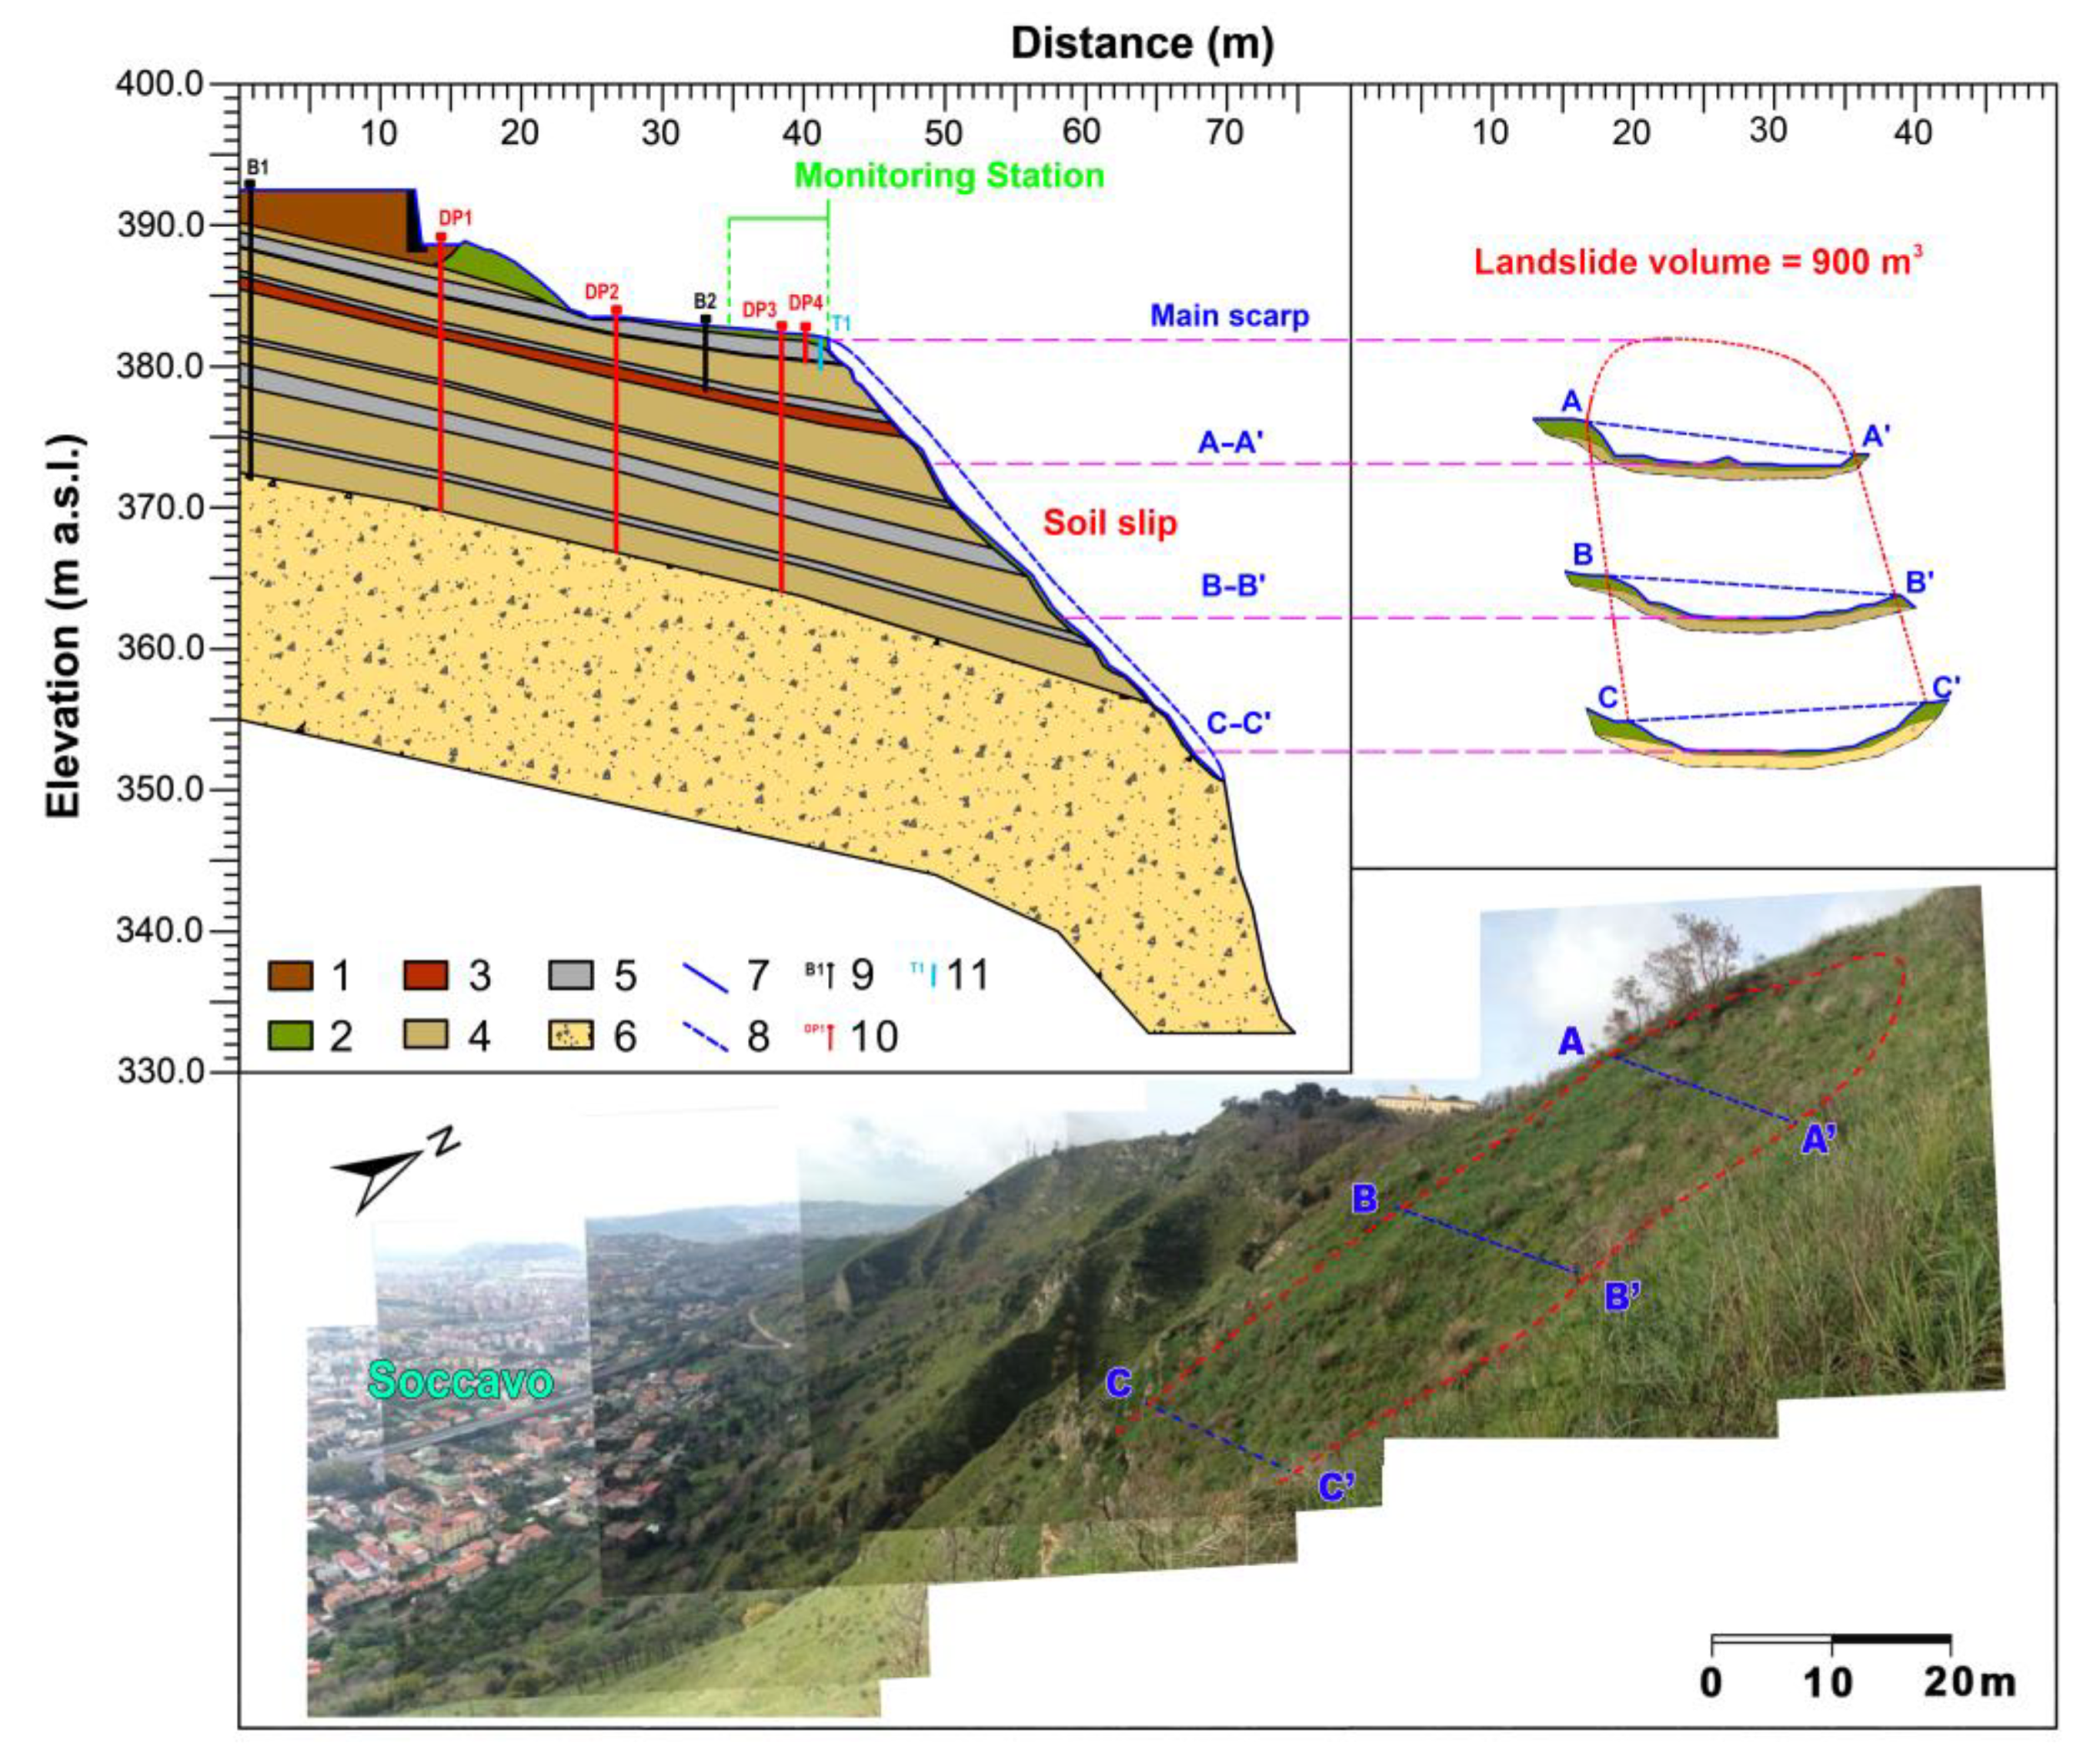
2.1. Field Site Characterization

The studied site is located along the southern slope of Camaldoli Hill, which looms directly above the Soccavo borough of Naples (Figure 3). Detailed site characterizations and monitoring activities were carried out across the source area of a shallow landslide that occurred during the 4th and 5th of March 2005 rainstorm. It was identified as being highly representative of the typical stratigraphic and geomorphological settings by surveying the source areas of other landslides that occurred during the 4th and 5th of March rainstorm. Additionally, the well-preserved morphological structures of the landslide, such as the main scarp and lateral flanks, allowed for reliable field measurements and observations. Therefore, physical and numerical modelling of this landslide was considered to consistently describe the general slope stability conditions of the whole area. Another motivation in choosing to study this landslide is the close proximity (about 50 m) to a rain gauge station belonging to the meteorological network of the regional Civil Protection.
In this area, field observations indicated that the landslide involved mainly the present-day soil A and B horizons [5], which extended down to a depth of about 1.8 m and developed over the volcaniclastic series forming the hill. Moreover, the area is characterized by a vegetation cover including evergreen bamboo, ginestre bushes, sparse holm oak trees, and seasonal shrubby vegetation. Morphologically, the studied landslide area is characterized by a gently sloping crown zone with slope angle values varying from 5° to 35°, while downslope of the landslide scarp, in a slope sector corresponding to the landslide depletion zone, by steeper slope conditions ranging from 50° to 55°, which were surveyed using Global Position System/ Global Navigation Satellite System (GPS/GNSS) topographic measurements. At the base of this landslide sector, a near-vertical rocky cliff formed by outcrops of the NYT was observed. The correspondence between the slope angle in the source area and the median value estimated for other source areas of March 2005 landslides (Figure 3) further supports the representativeness of morphological conditions of this landslide source area.
Different in situ investigations consisting of a 20 m deep borehole (Table 1), hand-dug exploratory trenches, dynamic penetrometer tests, and topographic surveys (Figure 4) were carried out to reconstruct an engineering–geological model of the landslide source area (Figure 5).
Disturbed and undisturbed specimens of the shallowest soil horizons of the volcaniclastic series (present-day soil and uppermost fine ash soil horizon) were collected at different depths (down to 4 m) by hand-dug trial pits and using specifically designed steel sampler boxes.
Samples were tested in the laboratory to measure the grain size distribution (Figure 6) using dry and wet sieving standard procedures of American Society for Testing and Materials (ASTM D421 and ASTM D422).
Among the geotechnical laboratory analyses, direct shear strength tests (ASTM D3080) were also attempted, but outcomes obtained were disregarded due to the effects of a small fraction of coarse pumiceous lapilli pyroclasts with an equivalent diameter up to 20 mm, which caused unreliable results due to crushing and dilatancy phenomena. To resolve this problem, bibliographic results of shear strength characterization of volcaniclastic soils of Phlegrean Fields [23] were considered. Moreover, soil water retention curves (SWRCs) were determined using the Tempe Pressure Cell Apparatus (Soil Moisture Inc., Goleta, CA, USA) (Figure 7a) and unsaturated properties for the van Genuchten 1980 [24] formula were estimated with the RETention Curve code (RETC) [25]. Finally, given the sensitivity of the laboratory tests regarding the mechanical disturbance of specimens collected, saturated hydraulic conductivity (Ksat) was measured in situ using an open single ring [26] with a diameter of 0.25 m and Amoozemeter infiltration tests [27] executed at various depths down to 2.50 m using boreholes with a diameter of 0.085 m drilled into the volcaniclastic series (Figure 7b).

2.2. Field Soil Hydrologic Monitoring

Soil pressure head dynamics were continuously monitored from January 2015 to December 2015 at a location upslope of the landslide source area. Two types of sensors with different measurement ranges were used. Two tensiometers with pressure transducers (0 to −9.0 m range; Spectrum Technologies, Inc., Aurora, IL, USA) and two Watermark sensors (0 to −20.4 m range; Spectrum Technologies, Inc.) were deployed at four different depths within the shallowest part of the volcaniclastic series (Table 2). Installation depths were identified to take into account the local stratigraphic setting, the slope hydrological dynamics, and the different functioning range of the two types of sensors. Therefore, in the shallower present-day soil horizon, which is primarily involved in the slope hydrological response and in landsliding, two tensiometers and one Watermark sensor were installed. However, in the deeper fine ash soil horizons with less sensitive hydrologic response dynamics, only one Watermark sensor was installed at a depth below the limited length that the tensiometer tubes would allow. No sensors were installed in the pumiceous lapilli soil horizons due to their coarse grain size, which did not allow for a proper hydraulic continuity with the probes. The instruments recorded soil pressure head values with a 10–15 min periodicity controlled by automatic dataloggers (Watchdog, Spectrum Technologies, Inc.), which were buried in plastic enclosure boxes to protect them from humidity, wildfire (very frequent in this area), and damage from grazing animals. Rainfall, air temperature, and relative humidity data needed for the assessment of evapotranspiration rates at the daily time scale were obtained from a weather station managed by the Civil Protection Department (Station ID# 18891, Napoli Camaldoli), located about 50 m upslope from the monitoring area, whose recording interval was 10 min.

2.3. Physically Based Model Setup and Calibration

The hillslope scale assessment of the hydrologic response related to slope stability at the field site was performed using the numerical code VS2DTI, which is a physically based model of variably saturated subsurface flow in two dimensions [28]. The model setup was based on a longitudinal cross-section of the slope passing through the landslide axis using the pre-landslide topography, which was reconstructed by extending the present-day soil (A and B soil horizons) to intersect the extrapolated land surface (Figure 5).
According to field observations in the source area, shallow landslides that occurred on the slopes of Camaldoli Hill usually involved only the present-day soil, with a thickness of less than 2 m, so the domain of the VS2DTI model was not extended below the depth of 10 m (Figure 8). Unsaturated and saturated hydraulic properties of materials forming the slope model were assigned by considering fitting parameters of the van Genuchten (1980) SWRC model and saturated hydraulic conductivity (Ksat), obtained using in situ infiltration tests (Figure 7; Table 3).
The boundary conditions included a vertical flux across the ground surface, to which variable daily rainfall and evapotranspiration rates were assigned. The downstream and basal boundaries of the model domain were set as seepage faces, considering the absence of an impermeable horizon. The upstream boundary was set as a no-flow boundary due to existence of a paved road, which prevented infiltration processes as well as downslope water flux. Four vertical measurement profiles were selected, aligned along a longitudinal transect (Figure 8). Each profile consisted of 10 observation nodes located every 0.20 m in depth, as well as at the four depth values corresponding to the vertical position of the instrument locations (Table 2), to facilitate the direct comparison of monitored and simulated soil pressure heads. The initial pressure head values used for the simulations were set equal to the maximum values of the winter period measured by the soil hydrological station from January 2015 (Table 4), which were consistent with typical winter values measured by other authors in the Phlegrean slopes [13,23,29], varying between −1.5 m and −4.0 m. Time-varying parameters controlling water losses by evapotranspiration including rooting depth (RD), root activity at base (RAB), root activity at top (RAT), and the root pressure head (RPH) were set according to field observations regarding the depth of the root zone and seasonality of shrubby vegetation cover whose evapotranspiration demand was added, from March to September, to that of the evergreen bamboo, ginestre bushes, and holm oak trees (Table 5). RPH was set according to the usual limit recognized for the permanent wilting point (−150 m) [30]. The monthly evapotranspiration rate was calculated using Thornthwaite’s equation [31] and upscaled to the daily time scale.
Focusing on the understanding of the seasonal hydrological response of the slope, the model was run considering the daily time scale, which involved aggregating the 10-min monitoring data for each day. Moreover, the model was calibrated by iteratively adjusting the temporal distribution of daily evapotranspiration to minimize the sum of squared residuals between monitored pressure heads and simulated values for the 2015 hydrological year (Figure 9).
The greatest part of water loss due to evapotranspiration was assumed to occur from the late spring to the late summer when rainfall is limited and plants actively transpire. Subsequently, rainfall and air temperature data from January 2006 to December 2015, collected by the regional meteorological network of the Civil Protection Department (Station ID# 18891, Napoli Camaldoli), were used as model forcing to extend the calibrated hydrological model for this longer historical period before the soil hydrologic monitoring (Figure 10).
For this long-term simulation, an initial pressure head distribution based on the in situ monitoring data of January 2015 was used.
The pressure head time series, simulated for the period from January 2006 to December 2015, were analyzed statistically (Table 6) to identify a range of plausible pressure head conditions during both rainy and dry seasons to be used as the initial hydrological condition of the numerical modelling.

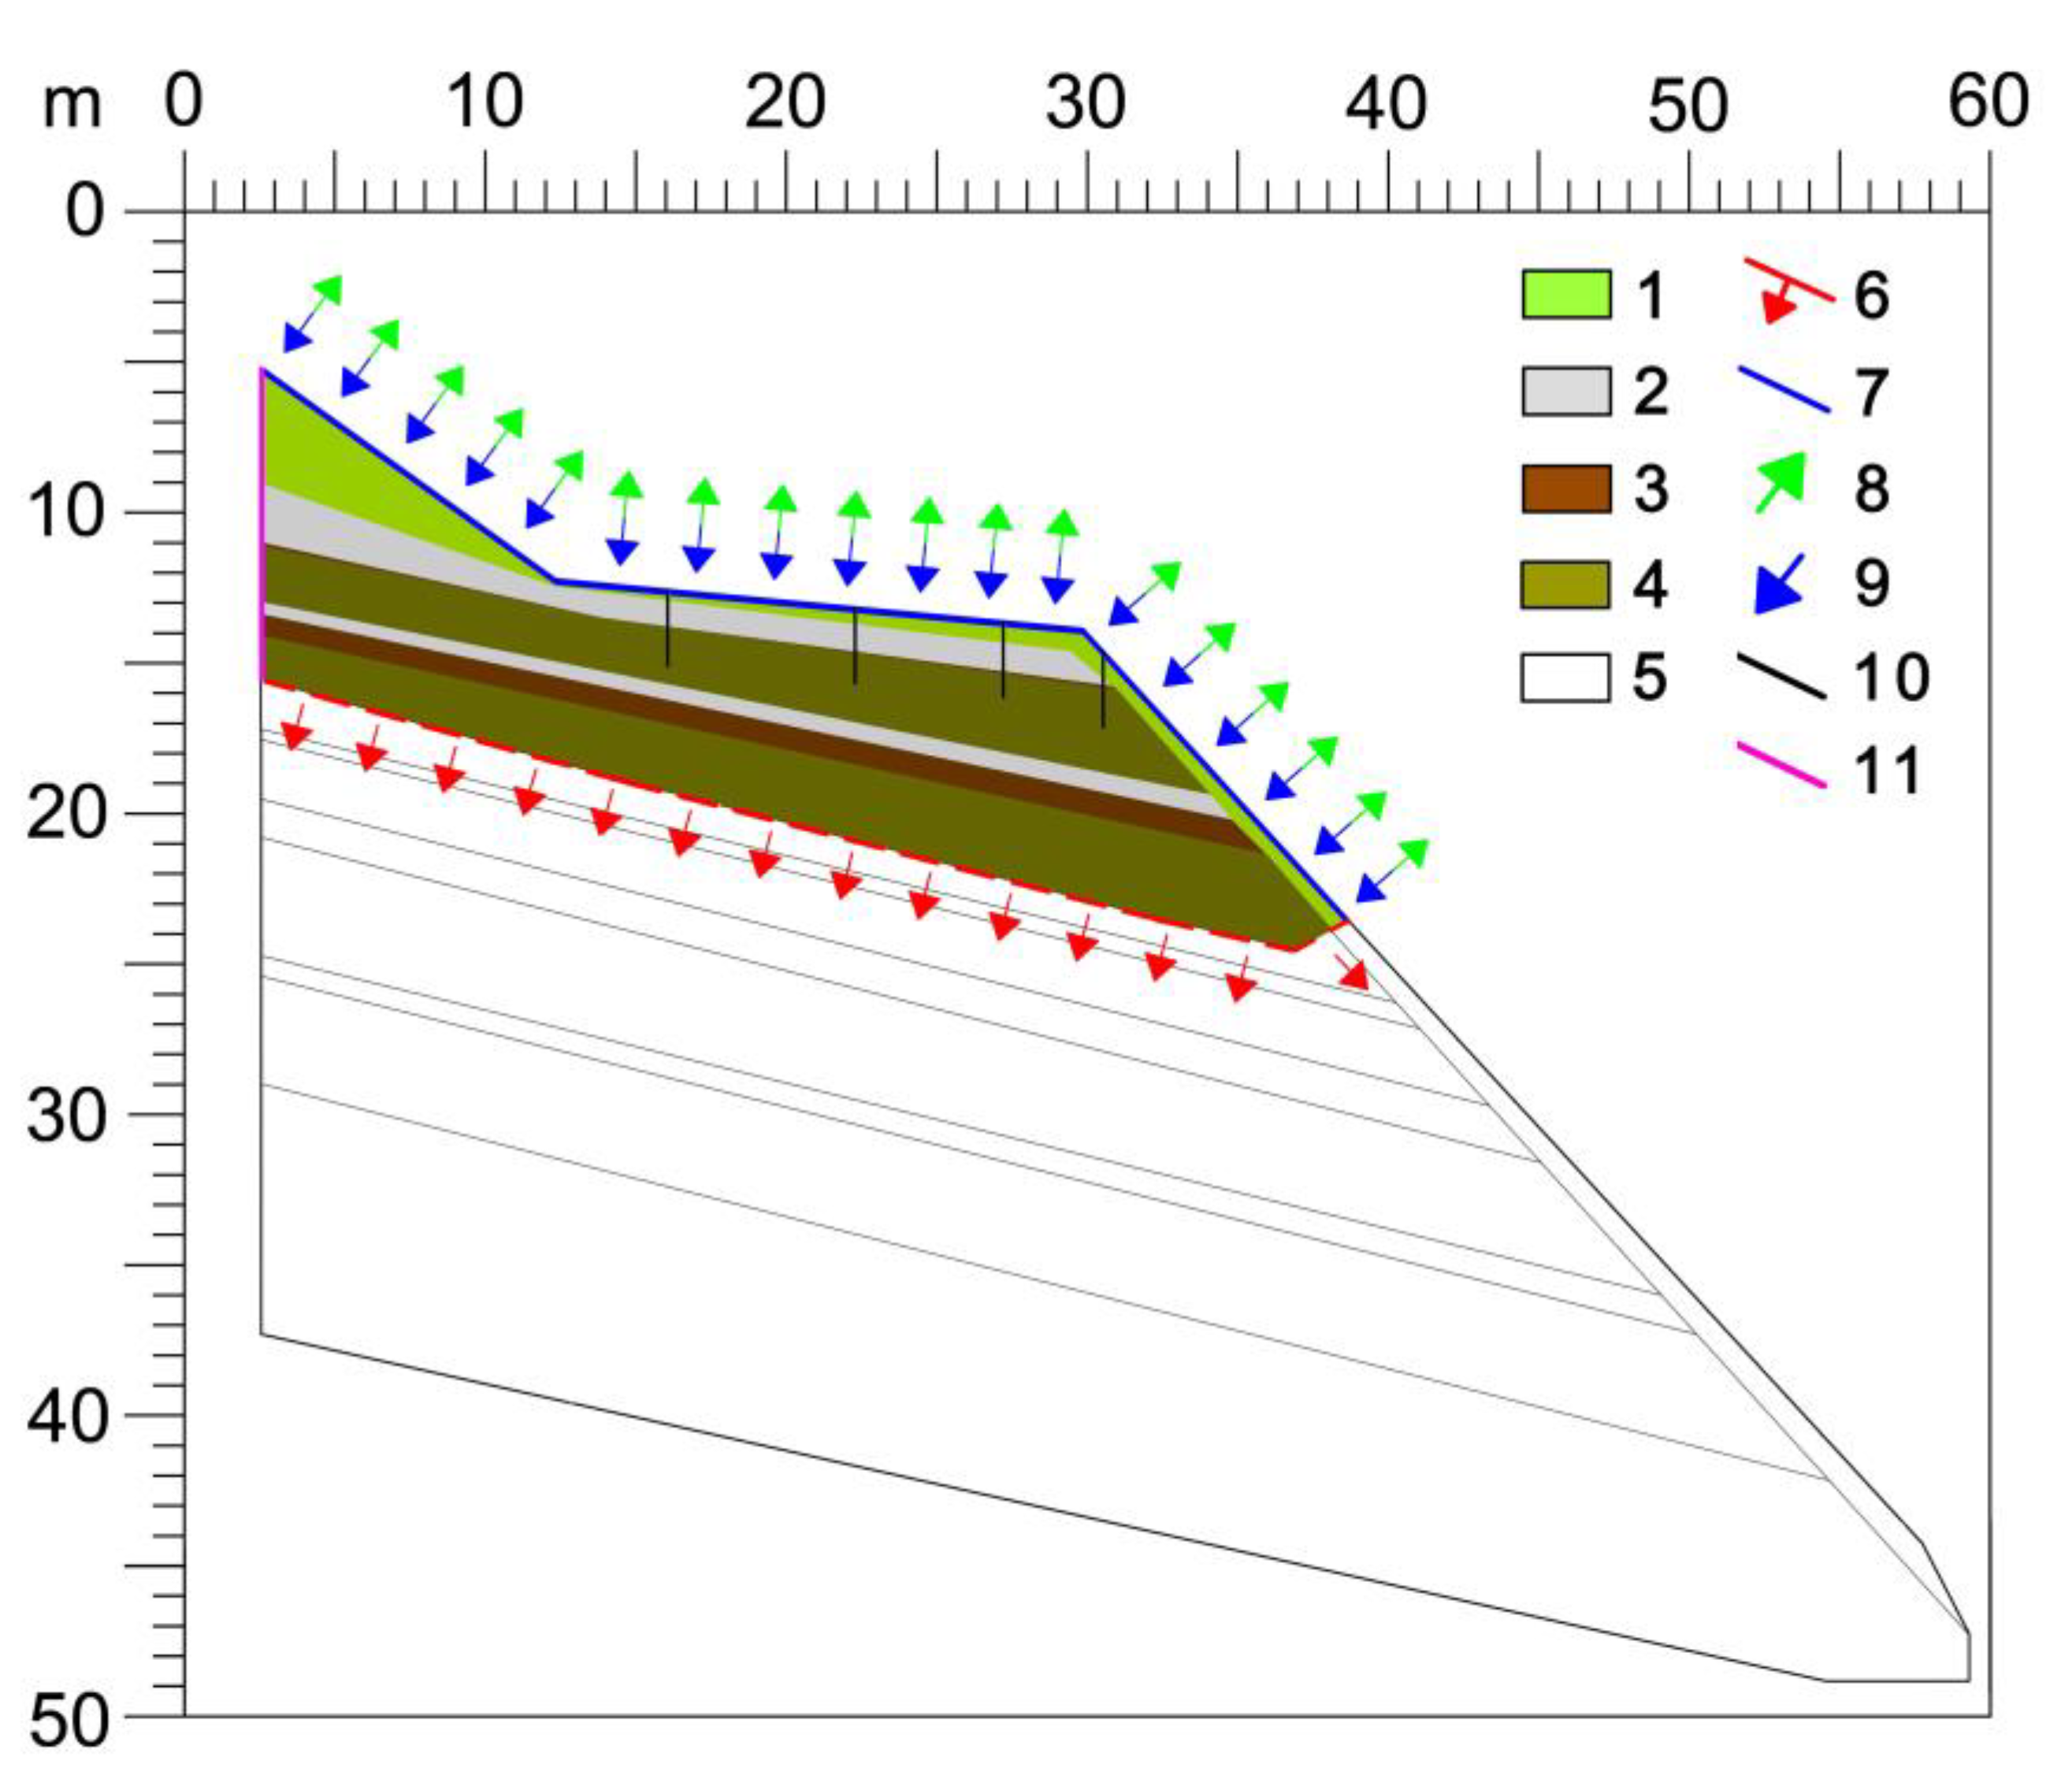
2.4. Slope Stability and Deterministic Rainfall Thresholds

Based on soil hydrological properties and calibration of the long-term hydrological slope model reconstructed in the source area of the studied landslide (Figure 8), three generic constant hillslope models, representing a range of landslide geomorphological settings on the slopes of Camaldoli Hill, were also modelled using VS2DTI. These three hillslope models were set with an overall length of 40 m and slope angle values of 45°, 50°, and 55°, respectively (Figure 11), in accordance with statistics carried out on morphological features of the landslide source areas (Figure 3).
Stratigraphic settings of these models were based on field observations and measurements carried out at landslide scars and depletion zones of landslides that occurred in March 2005, as well as of other shallow landslides known in the Phlegrean Fields area [13,23,29]. Specifically, a constant depth of the present-day soil (A and B soil horizons) equal to 1.8 m was considered.
Based on the outcomes of long-term hydrological modelling and geotechnical characterization, the infinite slope approach [15,32] was used to assess slope stability. Shear strength parameters of the present-day soil were taken from literature values [29] (Table 7). The slope stability for the infinite slope was calculated by considering variable driving forces, which are controlled by a variable water content (θ) of pyroclastic soils and the related variable unit weight (γ). The state of stress due to unsaturated conditions was considered by using the suction stress concept [33] and the unified effective stress criterion for both saturated and unsaturated conditions [34]. According to this criterion, suction stress, σs, is considered equivalent to the pore-water pressure in saturated conditions (Equation (1)), while corresponding to the product of degree of effective saturation and matric suction for partially saturated conditions (Equation (2)):
σ s = ( u a u w )        u a u w 0
σ s = θ e ( u a u w )        u a u w > 0
where ua—pore air pressure and uw—pore water pressure.
Therefore, the factor of safety (FoS) for the infinite slope stability [32] is given by:
F o S =   c + [ ( σ u a ) σ s ] tan φ σ   tan β
where c’—drained cohesion, σ—total stress, φ’—drained friction angle, and β—slope angle.
Seven different constant rainfall intensities of 2.5, 5.0, 10, 20, 40, 60, and 80 mm/h were applied to each of the three slope models with a transient time step of 600 s (10 min) to identify the critical durations of rainfall leading to instability that result from infinite slope stability analyses. Values of constant rainfall intensities were chosen to cover a wide range, up to extreme values, and with a geometric progression, i.e., being equally spaced in the logarithm scale, used for the intensity–duration (I-D) thresholds. The constant intensities were conceived as being representative of mean values to simplify real rainfall events. Specifically, the rainfall duration determined for the rainfall thresholds indicates the time between the beginning of rainfall and the first simulated time step with an FoS below 1.0.
Similarly, the duration of rainfall that led to landslide initiation during the observed storm in March 2005 showed the average intensity developing through time (based on cumulative rainfall) and ultimately the I-D values that corresponded to the time of landslide triggering.
The initial, or antecedent, soil hydrological conditions used for the simulations reflected the representative seasonal values of the soil pressure heads, which were estimated using a statistical analysis of the monitoring time series. The combinations of intensity and critical duration values, which corresponded to the time at which FoS dropped below unity, were then used to reconstruct deterministic I-D rainfall thresholds for landslide initiation. Differently from the classical empirical approach [17], in which thresholds are identified using a lower boundary curve enveloping I-D points, associated with landslide occurrences, or using a statistical/probabilistic approach also analyzing I-D data with no landslide events, in this case, thresholds were identified as curves interpolating deterministic I-D points obtained via the slope stability analysis.

3. Results

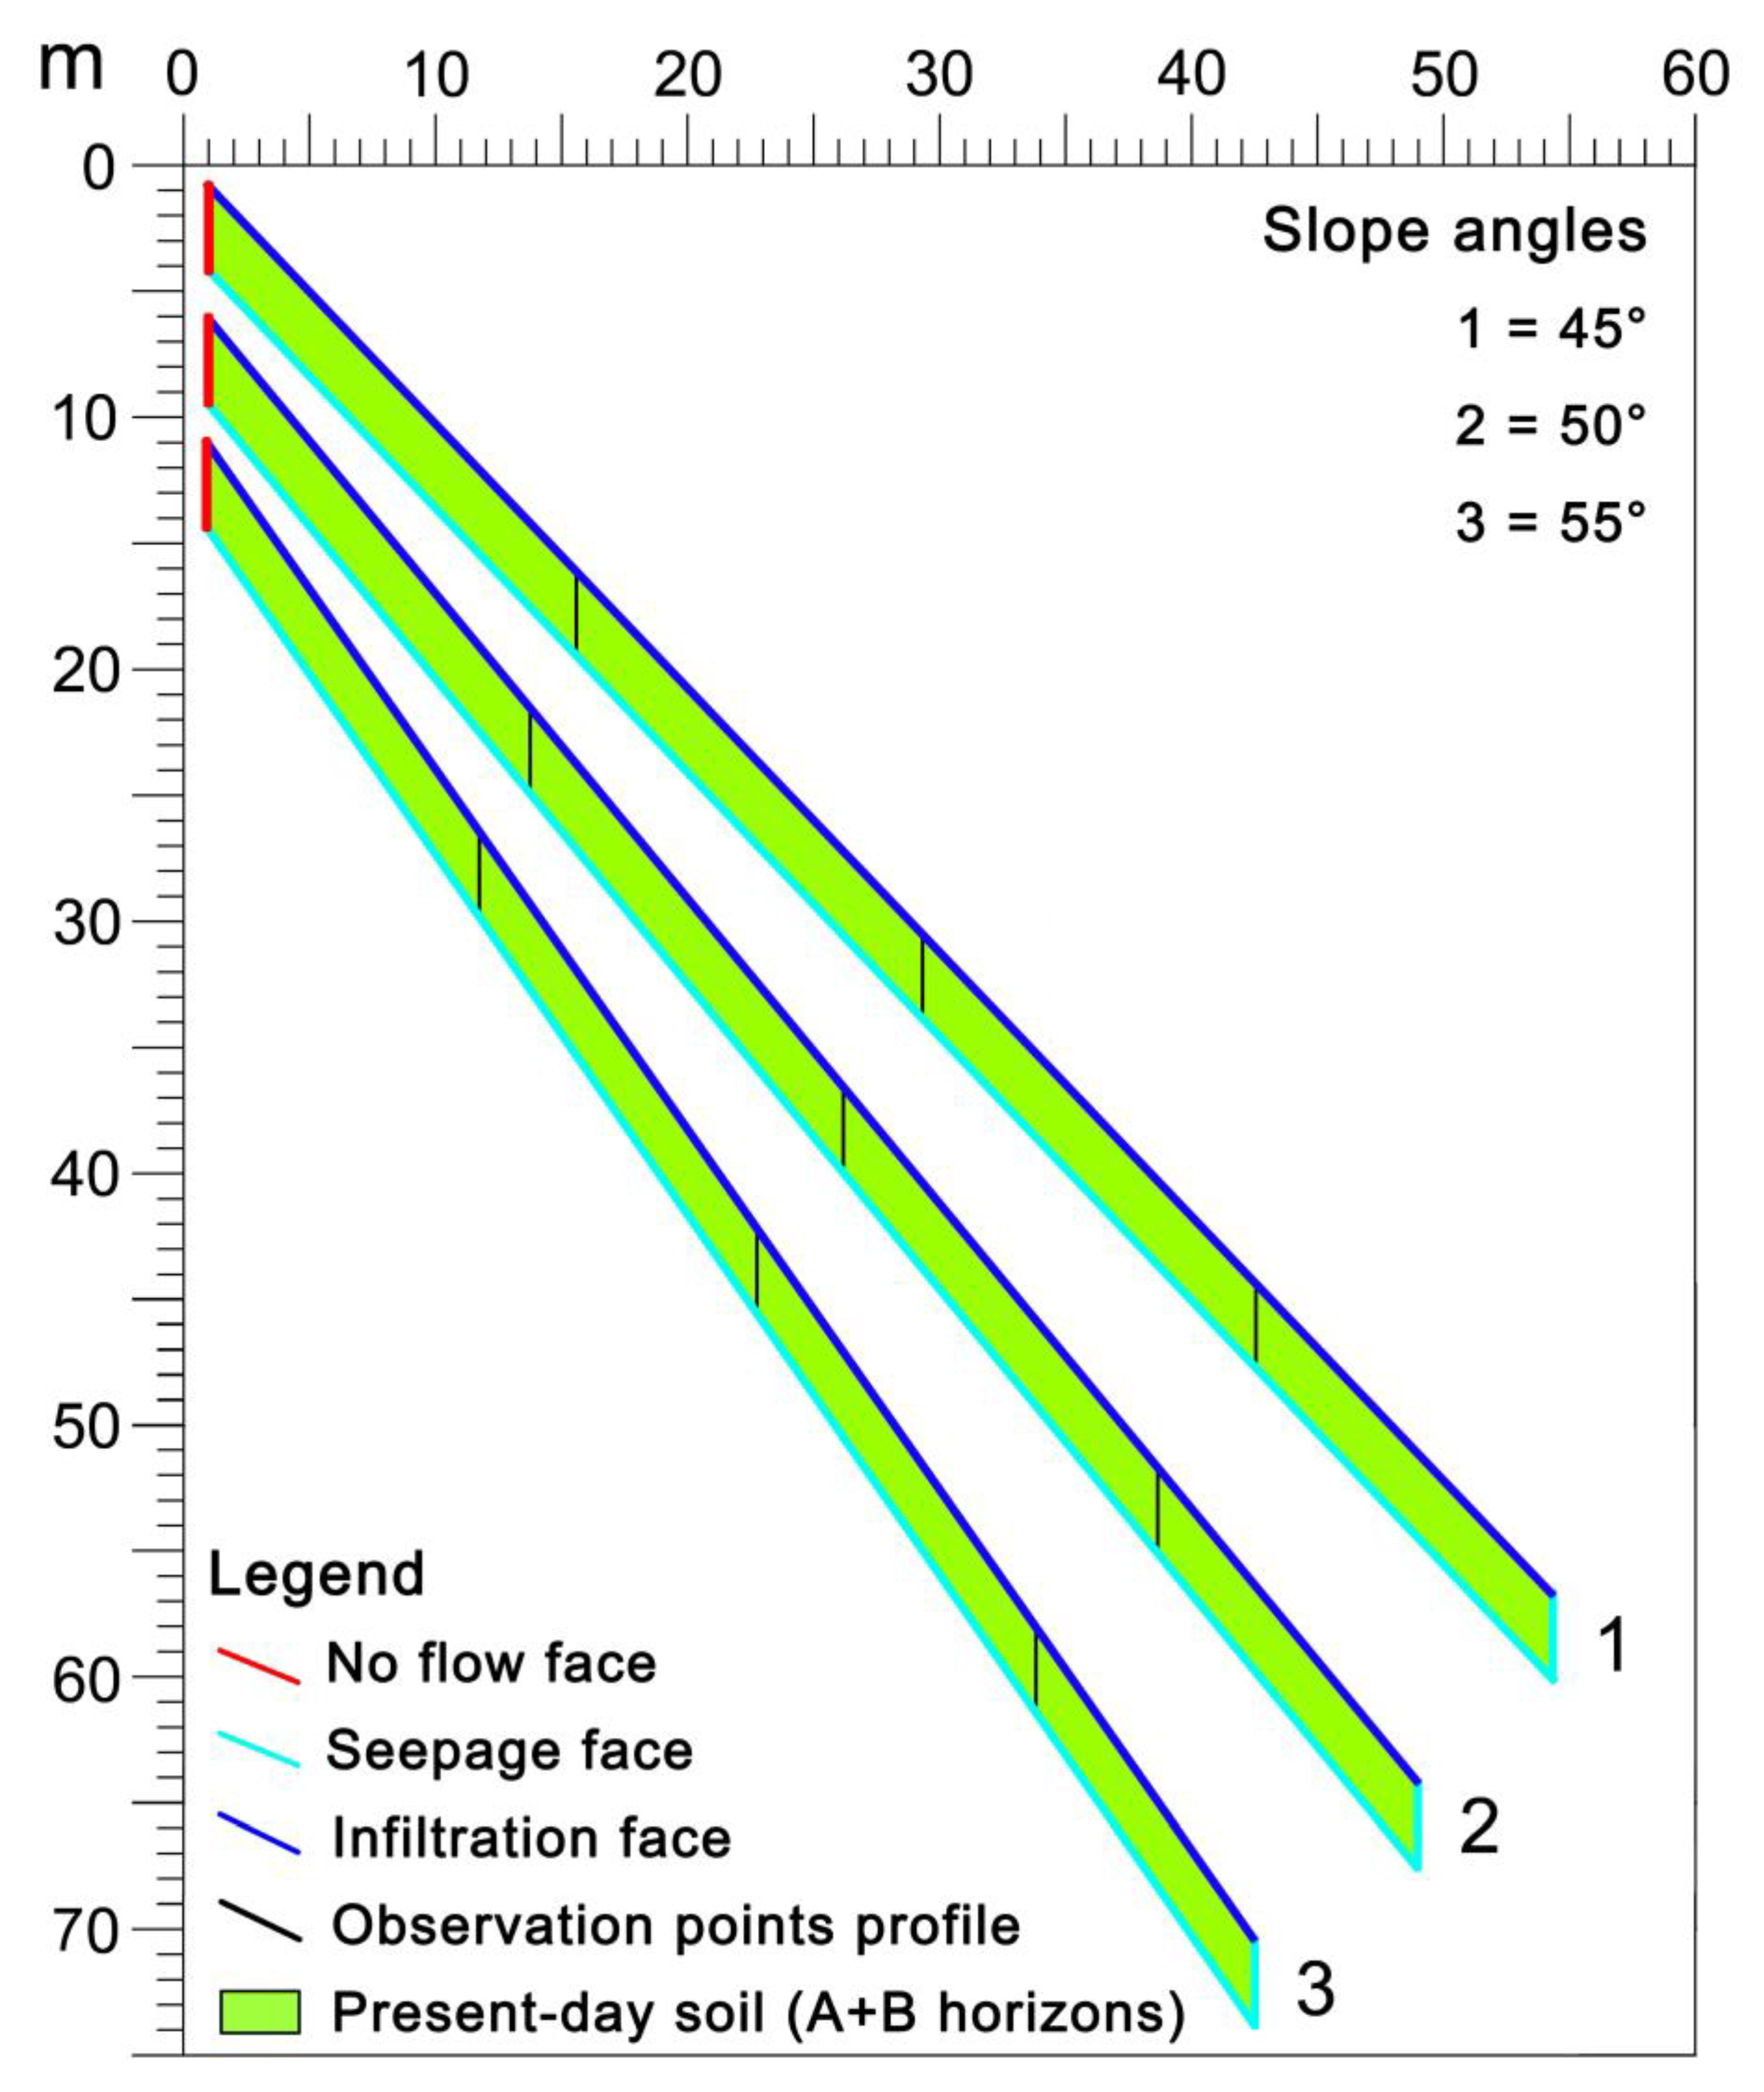
3.1. Geologic Framework Model

The stratigraphic setting of the source area of the landslide studied is formed by a surficial loose sandy gravel with silt (SM), corresponding to the pedogenized present-day soil (A and B soil horizons), overlapping dense silty sand (SM, C soil horizon), formed by fine ash, sometimes with gravel (GP) intercalations (pumiceous lapilli) (Table 1). The present-day soil is formed by the weathering and pedogenesis of local pyroclastic series and subordinately by colluvial deposits transported during heavy rainfall events. As assessed regarding dynamic resistance [35], measured using dynamic penetrometer tests, the present-day soil is characterized by the lowest shear strength while the underlying dense fine ash horizon has contrasting higher values. A median dynamic resistance value varied around 1 MPa for the overlying soil horizon and ranged between 3 and 4 MPa for the deeper underlying ashy soil horizon. Since the overlying horizon is chiefly involved in landsliding, its physical and shear strength properties were considered for the slope stability analysis (Table 7).
The highest values of saturated hydraulic conductivity (Ksat) were found for the shallowest part of the present-day soil (as high as 2.92 × 10⁻⁴ m/s), while intermediate Ksat values were found for the paleosol intercalated between the pumiceous lapilli and fine ash soil (4.45 × 10⁻⁵ m/s), whereas relatively low Ksat values were found for the fine ash soil horizon (as low as 1.57 × 10⁻⁷ m/s) (Table 2).

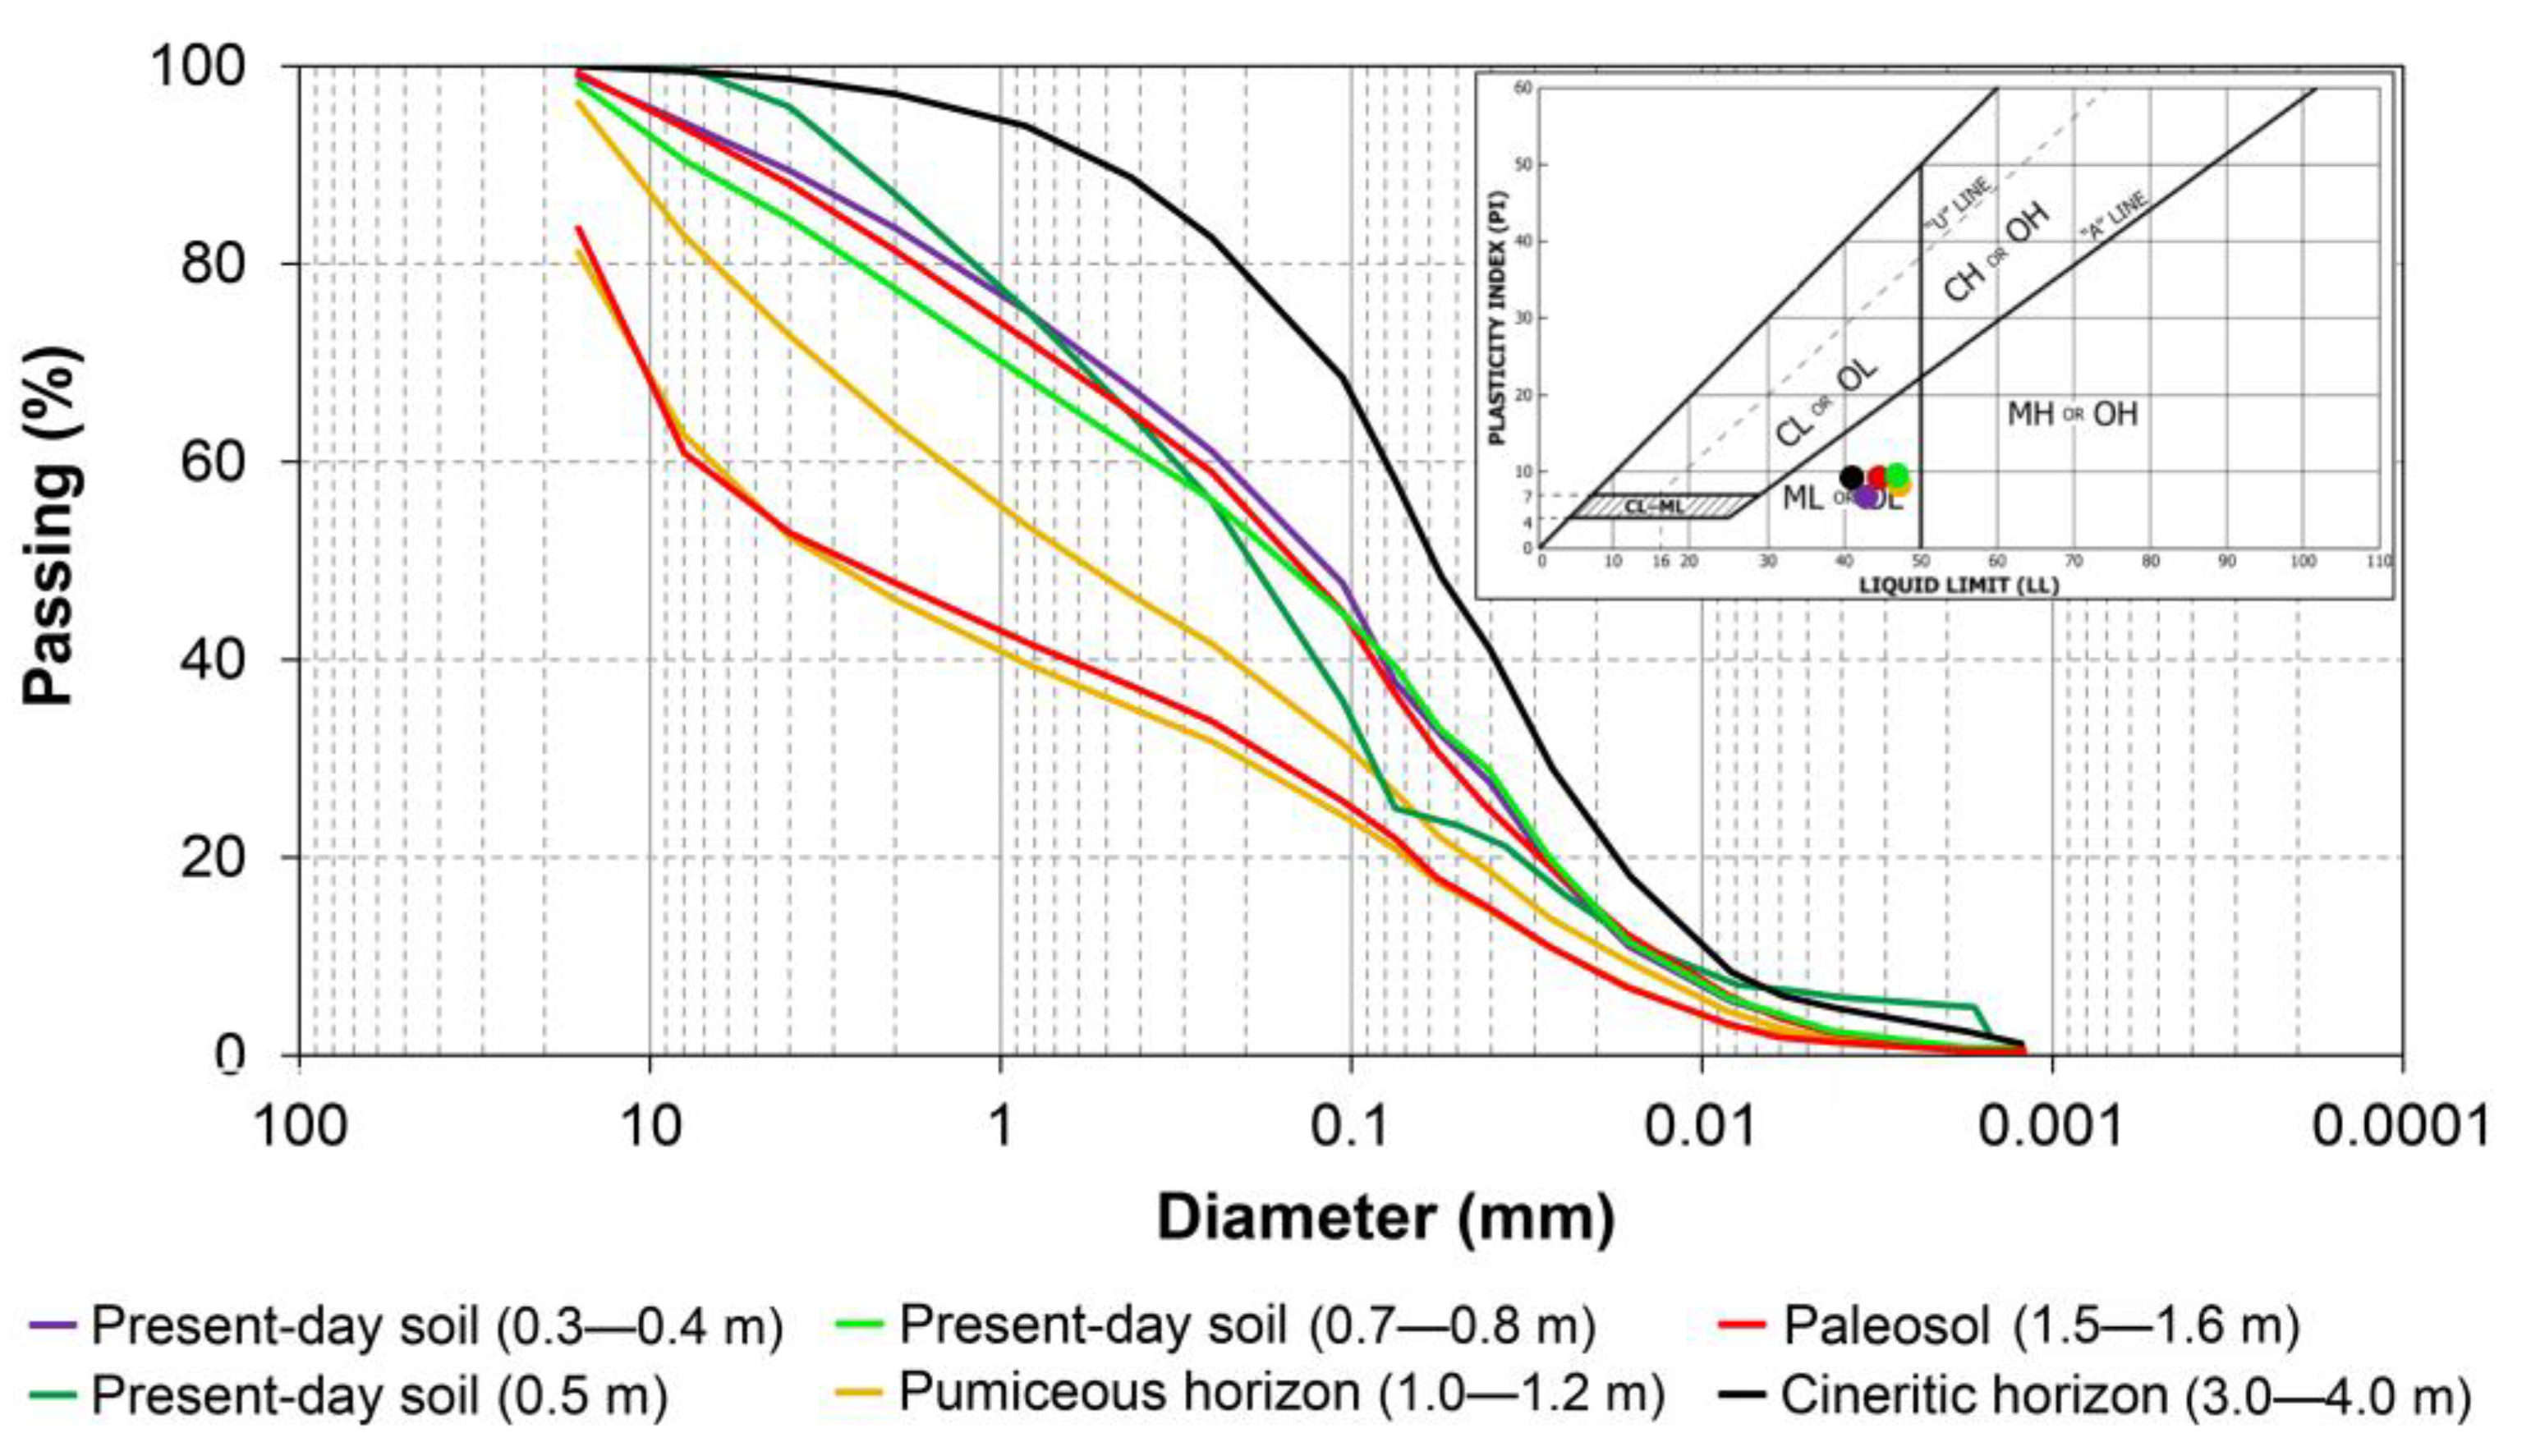
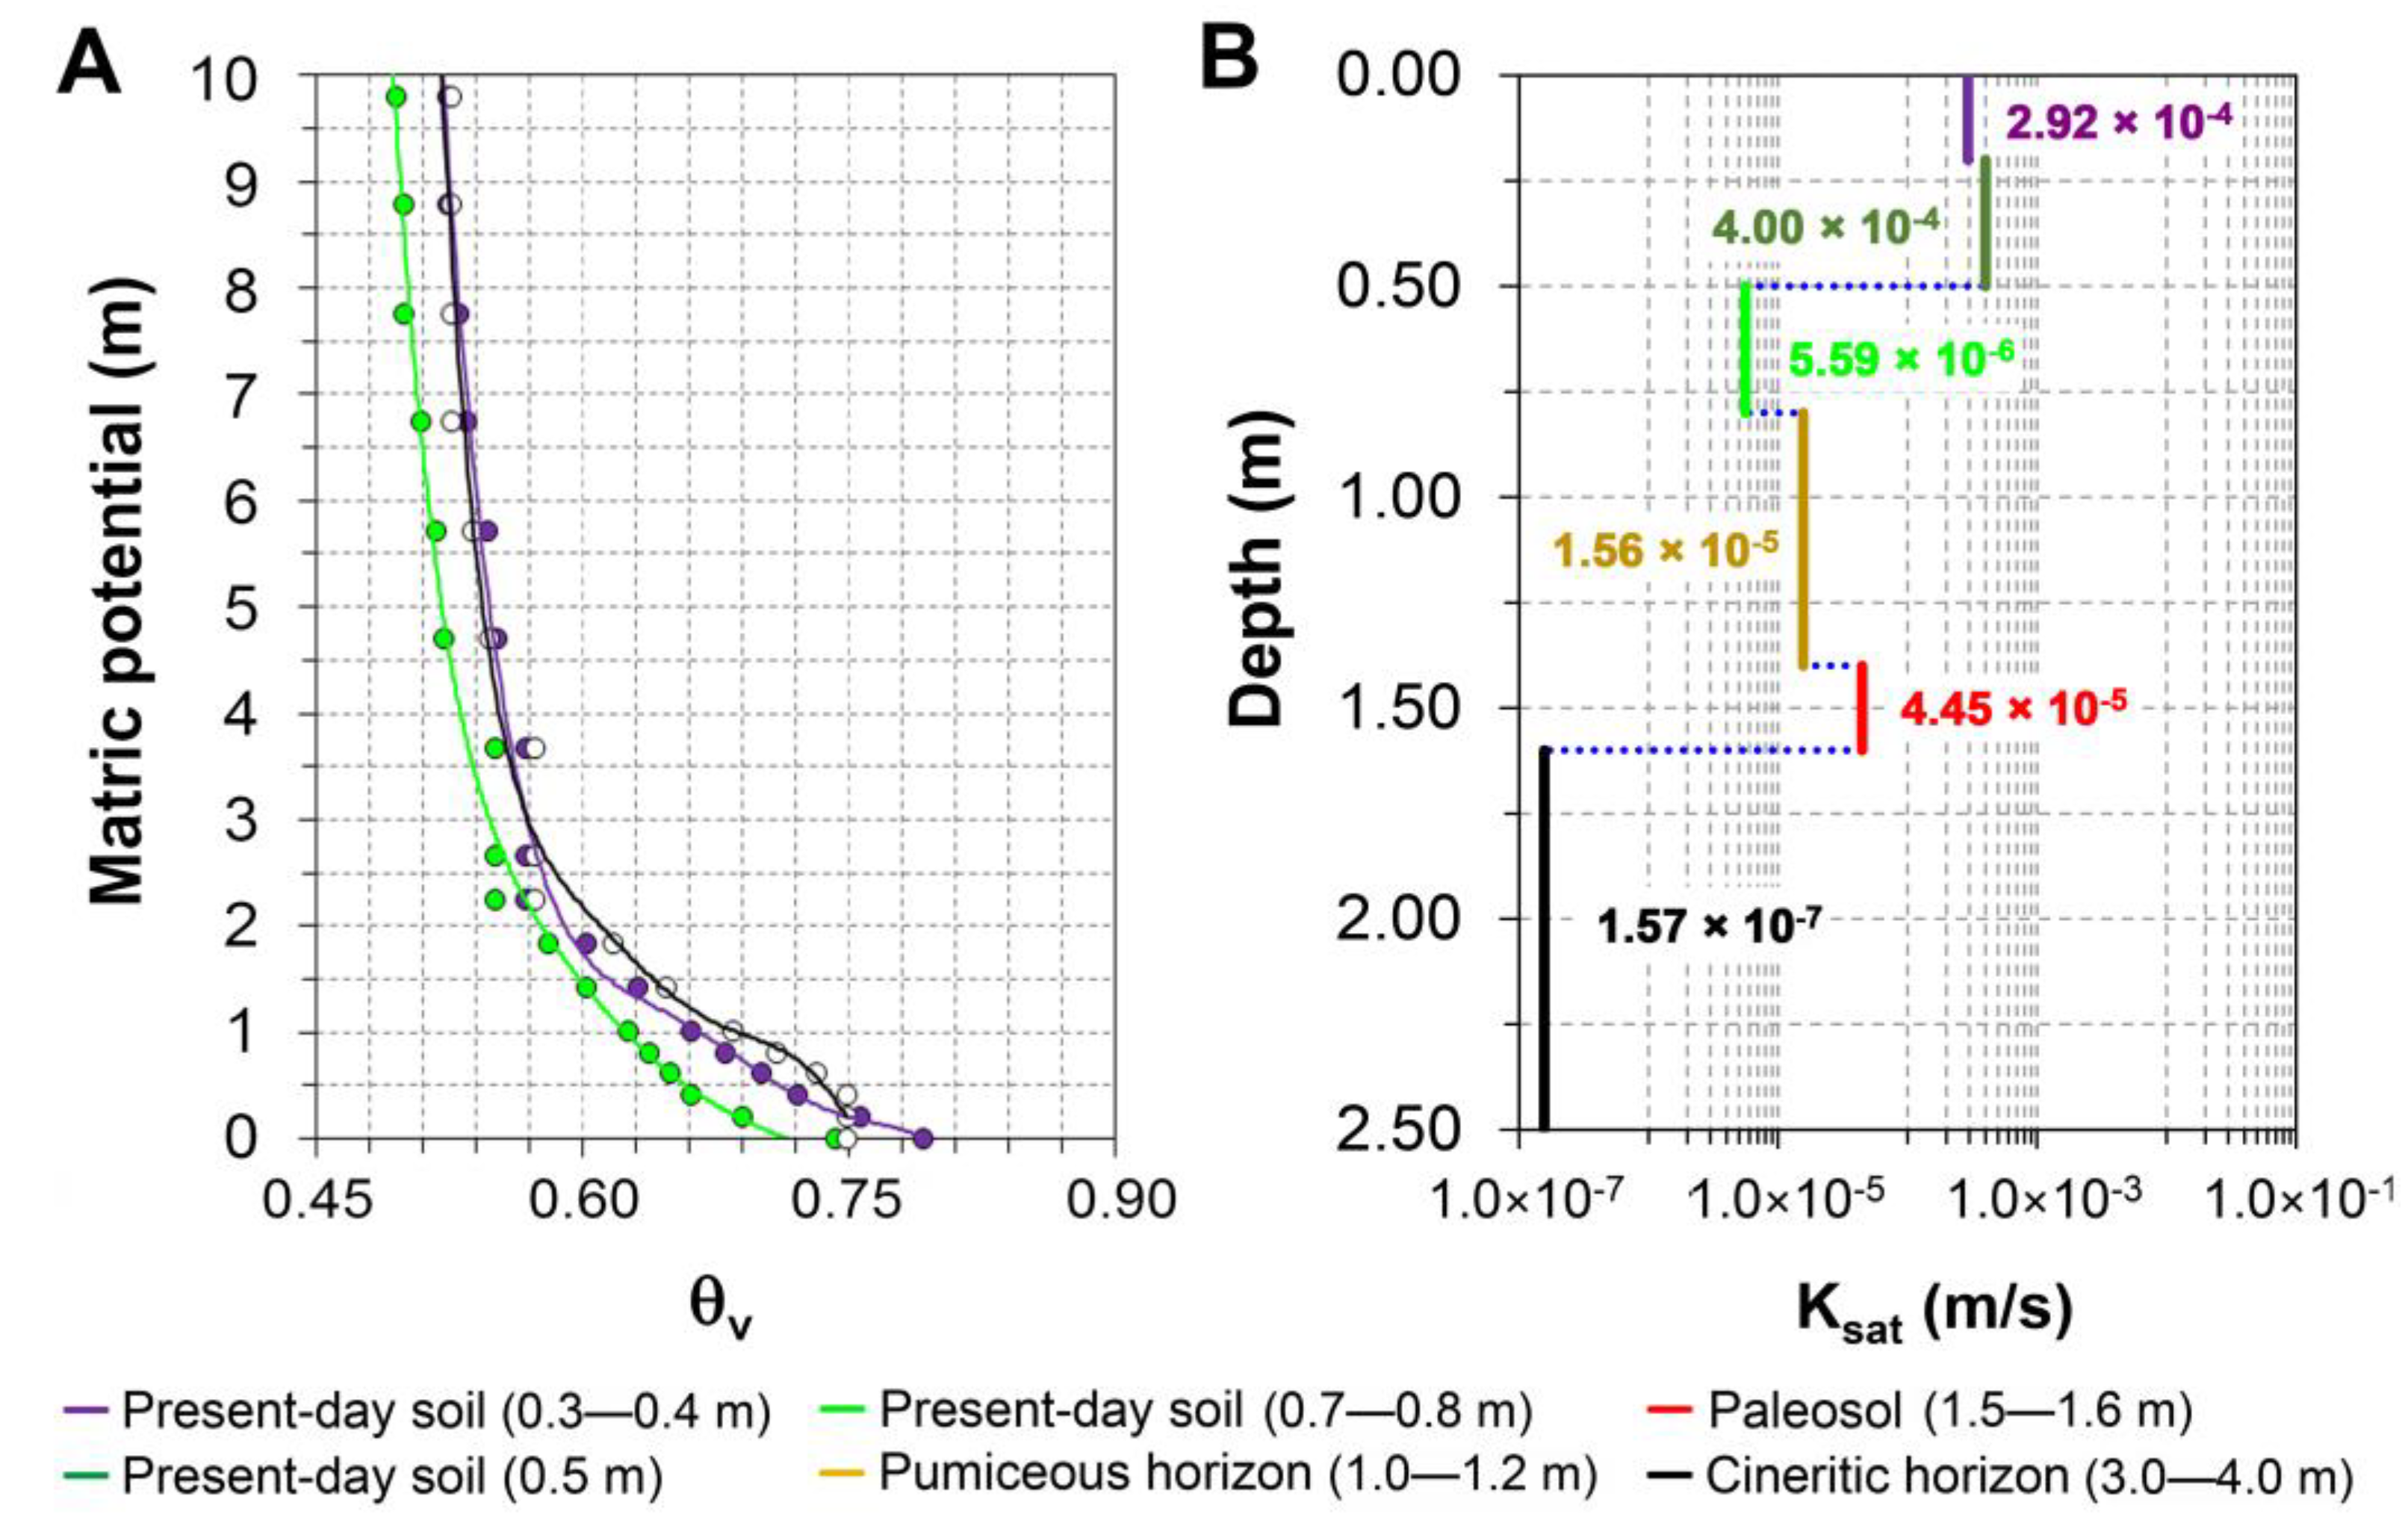
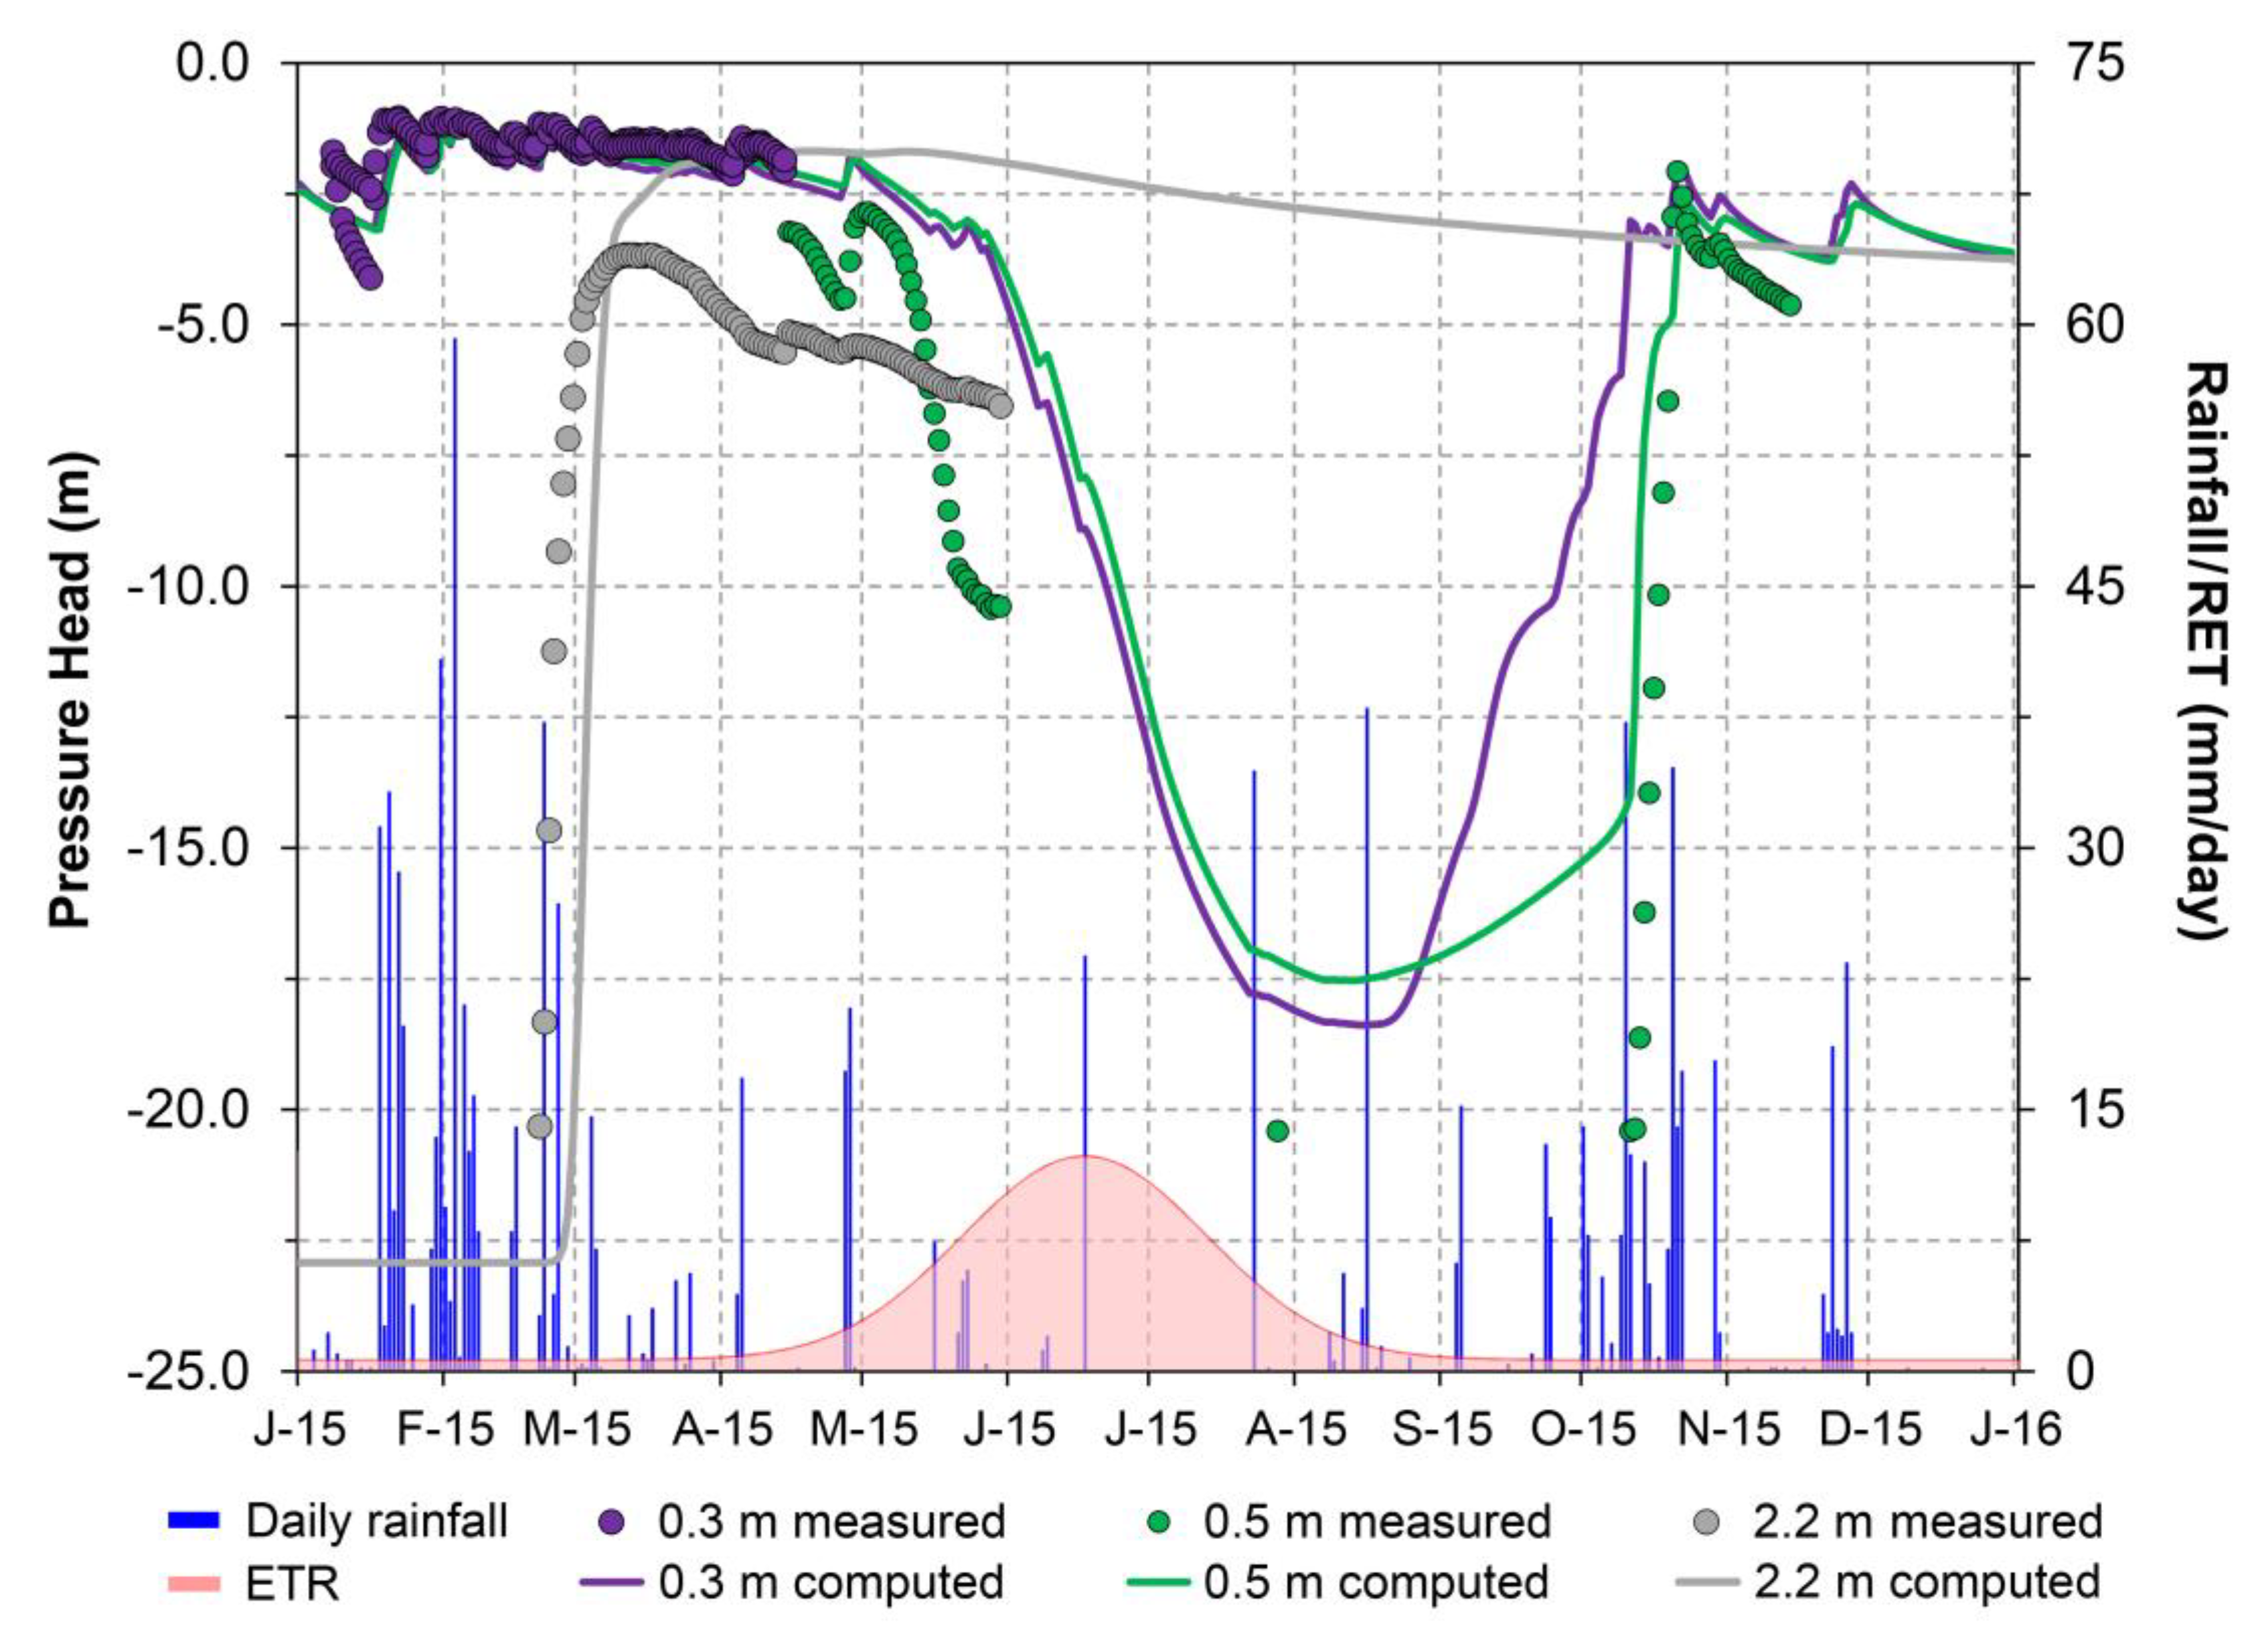
3.2. Hydrological Response of Volcaniclastic Soil Horizons

Hydrological monitoring time series, from January 2015 to December 2015 (Figure 9 and Table 4), revealed the hydrological response dynamics within the shallowest part of the volcaniclastic series (down to 2.2 m) due to the seasonal variations of rainfall and evapotranspiration processes. During the monitoring period, the recording was almost continuous except for a few periods, during which, accidental damage caused by grazing animals, maintenance work, or exceedance of the functioning range of sensors caused brief data gaps, which did not affect the comprehension of the soil pressure head (h) dynamics nor the evaluation of the numerical hydrologic model.
The soil pressure head time series revealed the slope hydrological response at different depths and time scales. Analysis of the pressure head time series for the entire soil column showed a constant unsaturated condition and a seasonal hydrological behavior characterized by wide fluctuations, whose amplitude decreased with depth (Figure 9). Maximum fluctuations of soil pressure head values were observed in the shallowest soil horizons (present-day soil), though significant but damped variations were also recognized in the deeper ones (fine ash soil horizon).
During the winter and early spring of 2015 (rainy period), the highest values of soil pressure head observed in the depth range of 0.5 m were around −2.0 m with only minor fluctuations. Then, starting from the late spring through to the late summer (dry period), the upper 0.5 m of the present-day soil exhibited a progressive and rapid decrease of soil pressure head down to and beyond the functioning limit of the Watermark sensors (h < −20.4 m). Finally, in the beginning of Autumn 2015 (rainy period), pressure head values rose rapidly again up to values similar to those recorded in the preceding winter season.
In contrast, at the depth of 2.2 m, starting from the beginning of the monitoring period, the soil pressure head below the measuring capability of the Watermark sensors (h < −20.4 m) until late winter 2015 when the arrival of the infiltration front determined its rapid rise up to a maximum value of −4.5 m, recorded in March 2015 (Figure 9). These observations demonstrate that the slope hydrological response was delayed and damped depending on depth, thus reflecting a decoupled behavior between shallow and deeper soil horizons during the rainy season.
At the daily time scale, estimated by aggregating 10-min monitoring data, during the rainy season, minor soil pressure head fluctuations were observed in the shallowest measurement points (depths of 0.3 m and 0.5 m), which were a direct response to rainfall events and with peak values not exceeding −1.0 m (Table 4). Maximum fluctuations of soil pressure heads were observed in the shallowest soil horizon (present-day soil) with values reaching the functioning limit of the Watermark sensors (−20.4 m), while more damped variations took place at the depth of 2.2 m (Table 4).

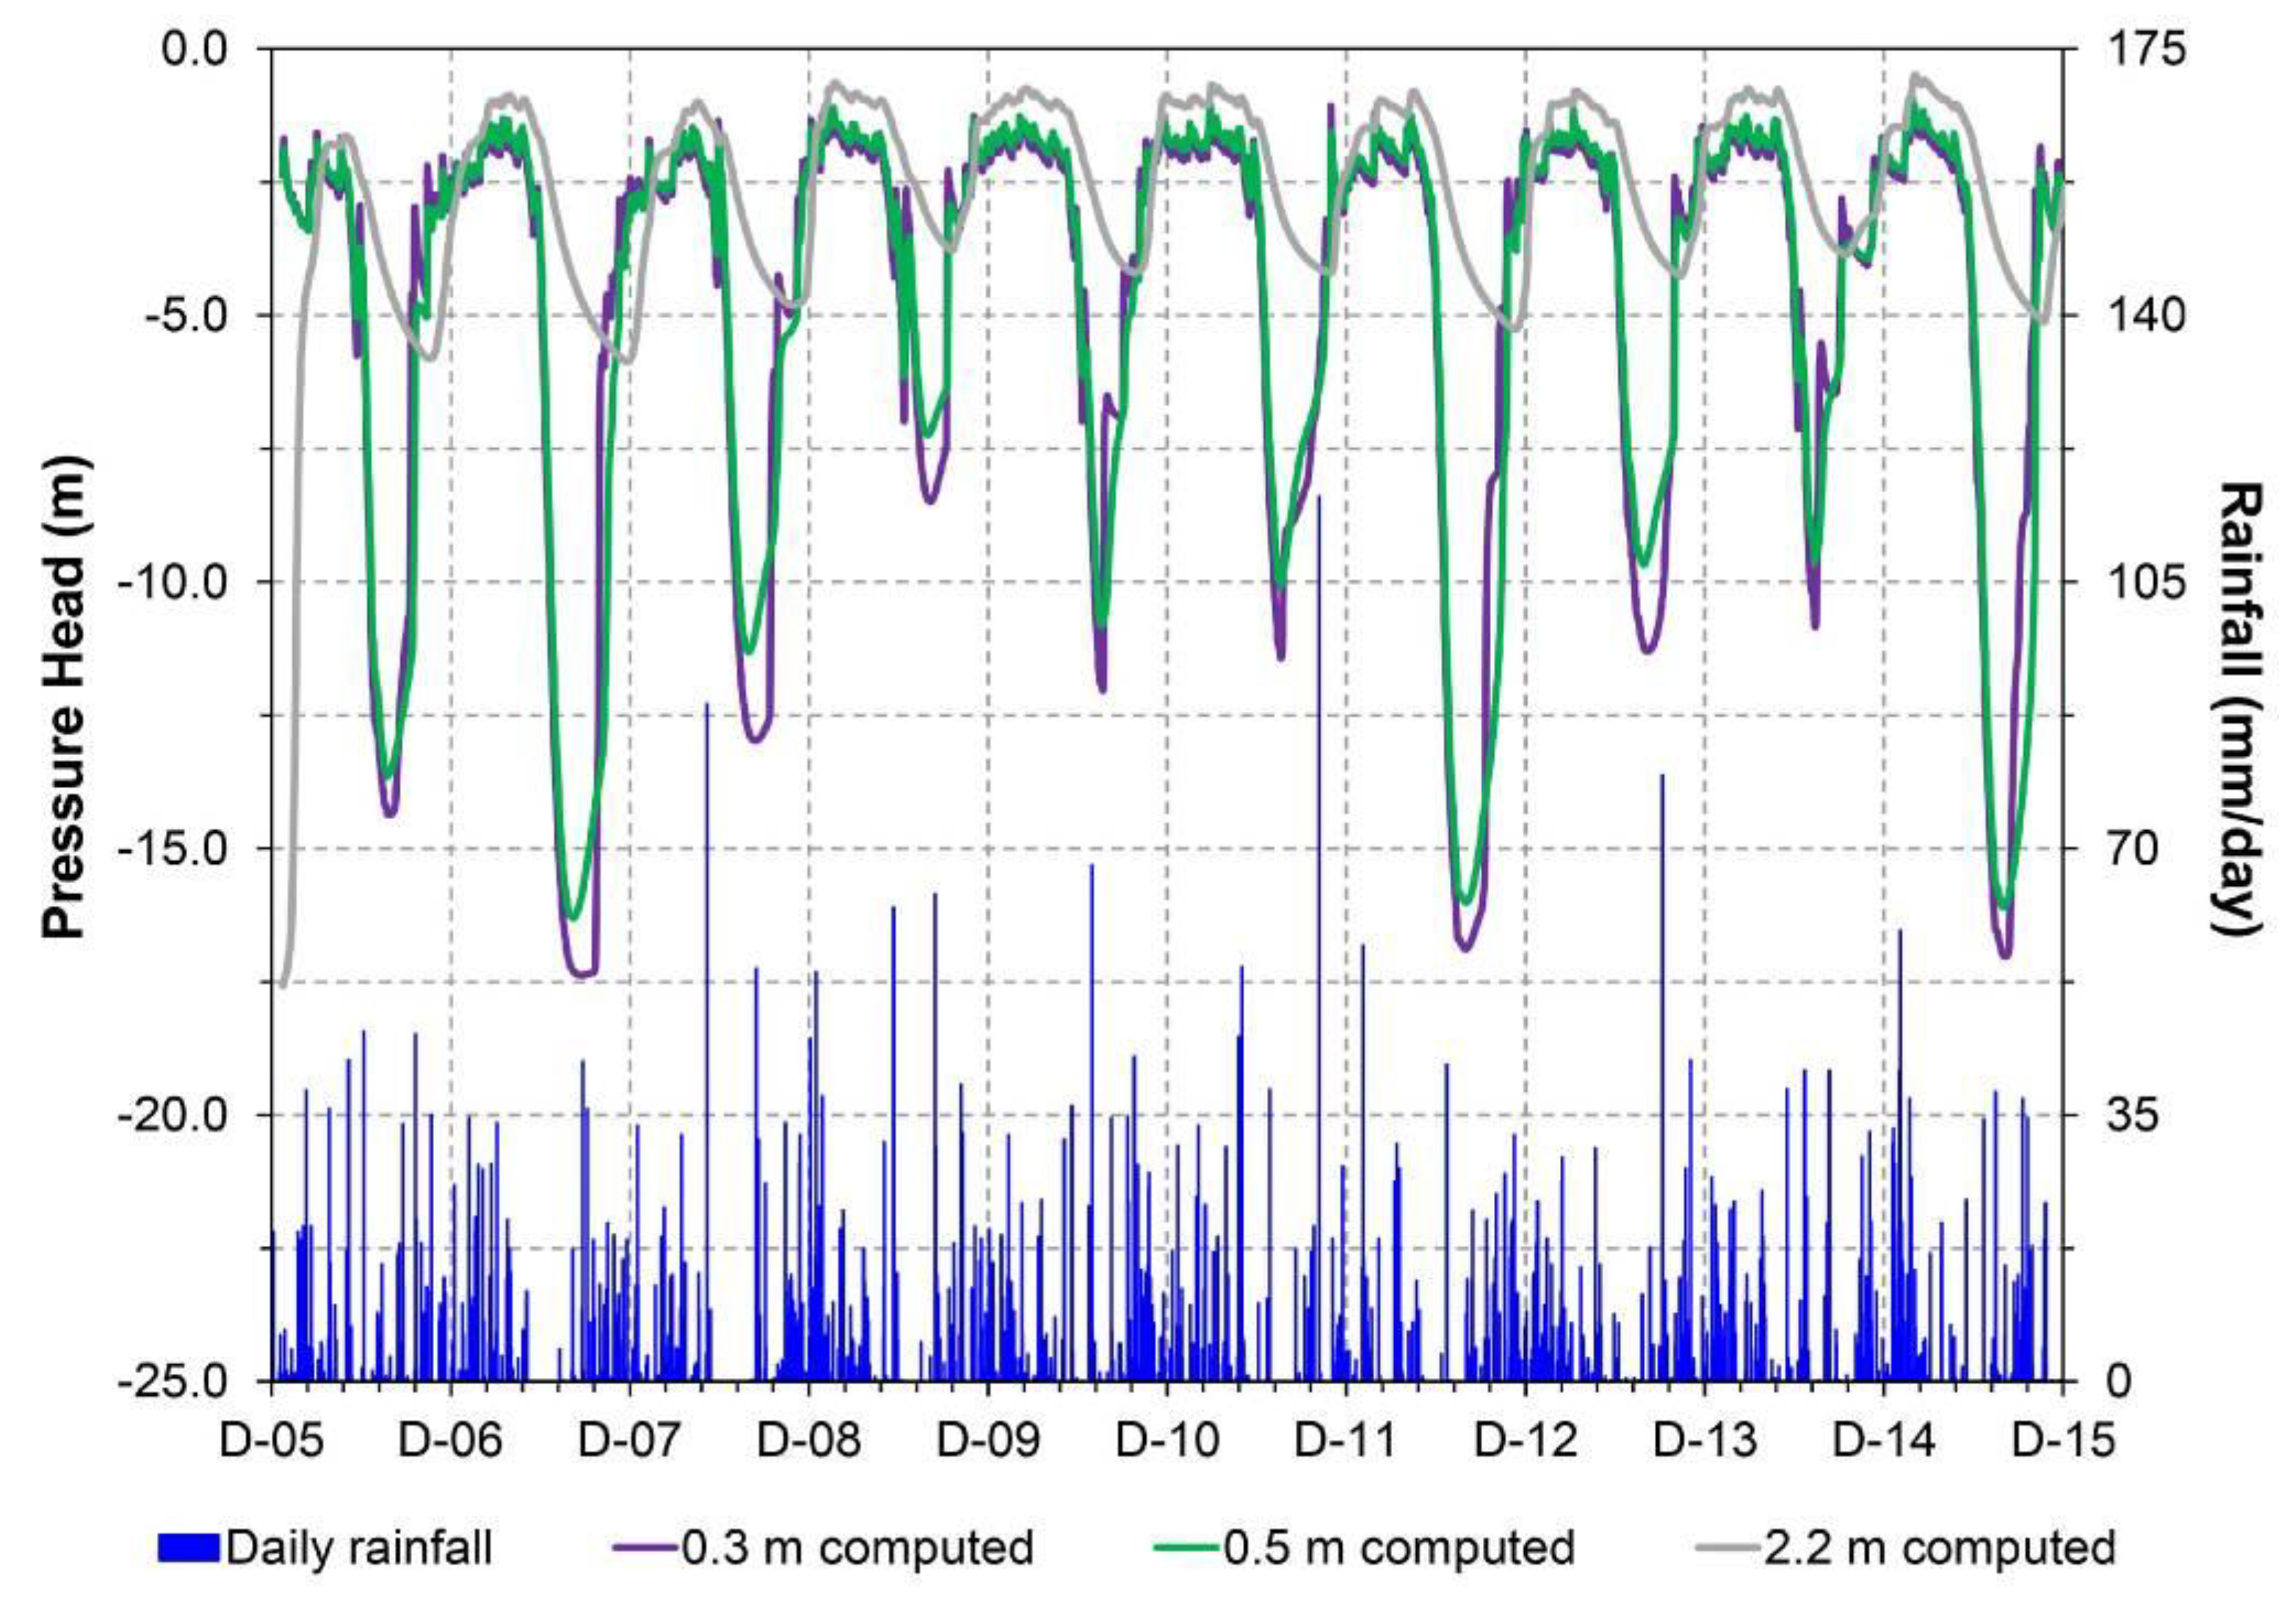
3.3. Hydrological Modelling

During the two rainy periods, from January to May 2015 and from October to December 2015, the numerical modelling succeeded in simulating the monitored pressure head time series, especially in the shallowest part of the volcaniclastic series (present-day soil) and replicating the dynamic hydrological response to the infiltration of rainfall events, from seasonal to daily time scales (Figure 9). The model also succeeded in simulating the delayed advance of the infiltration front, and of the drying process, at different depths, albeit with a slight temporal shift relative to the values measured. For example, the peak soil pressure head at the depth of 2.2 m was measured in February 2015 but simulated at the beginning of March 2015 (Figure 9). These discrepancies were attributed mainly to heterogeneities within the soil horizons at a scale greater than that of soil samples, such as macropores formed by root apparatuses, which can enhance the progression of the wetting front. Another influence was ascribed to differences between hysteretic drying and wetting unsaturated properties since the numerical modeling considered only the water retention properties during drying conditions, which were obtained by the Tempe Pressure Cell apparatus (Figure 7a; Table 2). Although significant hysteresis can influence slope stability estimates [36], laboratory estimates are likely to overestimate the impact of hysteresis on slope stability relative to field conditions [37]. The model reached the best adaptation to measured data with a Root Mean Square Error (RMSE) value of 0.46 m and a correlation coefficient between the variables of 0.857.
Beginning from late April 2015, simulations somewhat overestimated the pressure head during its progressive decline at a depth of 0.5 m. Despite the differences between modelled and measured data during this period of steady drying, a similar trend and timing of seasonal fluctuations indicated that the combined effects of rainfall and evapotranspiration rates were adequately captured by the calibrated VS2DTI model. Similarly, during the transitional wetting period in early autumn (October 2015), the abrupt increase of soil pressure head values within the various soil horizons was also simulated successfully by the model. Although the model accurately captured the timing of transitions between winter and summer seasons, the magnitude of simulated soil pressure head values was different from the observed ones during the dry summer period (June–September 2015). These minor differences between measured and simulated soil pressure head time series during dry periods were considered acceptable since the seasonal hydrological response was replicated adequately, and the focus of this study was primarily on landslide initiation. Therefore, the calibrated model was used for long-term numerical hydrological modelling in the period 2006–2015.
The long-term modeling showed a consistent seasonal fluctuation of the soil pressure head time series characterized by summer lows and winter highs, which appeared strongly influenced by the effects of rainfall patterns, temperature variations, and evapotranspiration processes (Figure 10). Analysis of the simulated hydrologic response within the different depths of the volcaniclastic series illustrates that there were three years that exhibited substantially lower soil pressure head values during the dry period (2007, 2011, and 2015) and one exhibited a considerably higher value (2009). Nonetheless, all transitions from rainy to dry and from dry to rainy periods were characterized by the same general trends with depth that were observed during 2015. Long-term simulated soil pressure head time series were analyzed to calculate statistical parameters describing variability for rainy and dry periods by year (Table 6). Median values calculated for rainy periods were characterized by soil pressure head values ranging from −1.7 to −2.7 m, down to 0.5 m in depth, and from −1.0 to −4.0 m at 2.2 m depth. The median values calculated for dry periods showed values ranging from −6.2 to −14.3 m, down to 0.5 m in depth, and from −3.0 to −4.3 m at 2.2 m, thus demonstrating a damping effect with depth for the drying process. As observed in the field, the simulated hydrologic response at depths of 0.3 and 0.5 m exhibited fluctuations of soil pressure head values higher than those recorded at a depth of 2.2 m, which were more damped. Even in the wetter periods, maximum values of soil pressure heads did not reach saturated conditions and were limited to values lower than −1.0 m. At these two shallower depths, maximum and minimum values of soil pressure heads did not exceed −1.0 m and −16.3 m during rainy periods and −1.4 and −17.4 m during dry periods, respectively (Table 6). At the depth of 2.2 m, soil pressure heads fluctuated from −0.5 m to −17.6 m during the rainy periods and from −1.3 m to −5.2 m during the dry periods (Table 6), demonstrating a wetter and more stable condition during the dry season linked to a delayed seasonal hydrological response at greater depths.
Based on long-term numerical simulated results of the calibrated model, representative soil hydrological conditions for winter to early spring seasons (rainy period) and late spring to early autumn seasons (dry period) were identified. Considering the first conditions as the most predisposed to slope instability under heavy rainfall events, it was used for setting up the coupled hydrological numerical modelling and infinite slope stability analyses, which allowed for the estimation of deterministic intensity–duration rainfall thresholds.

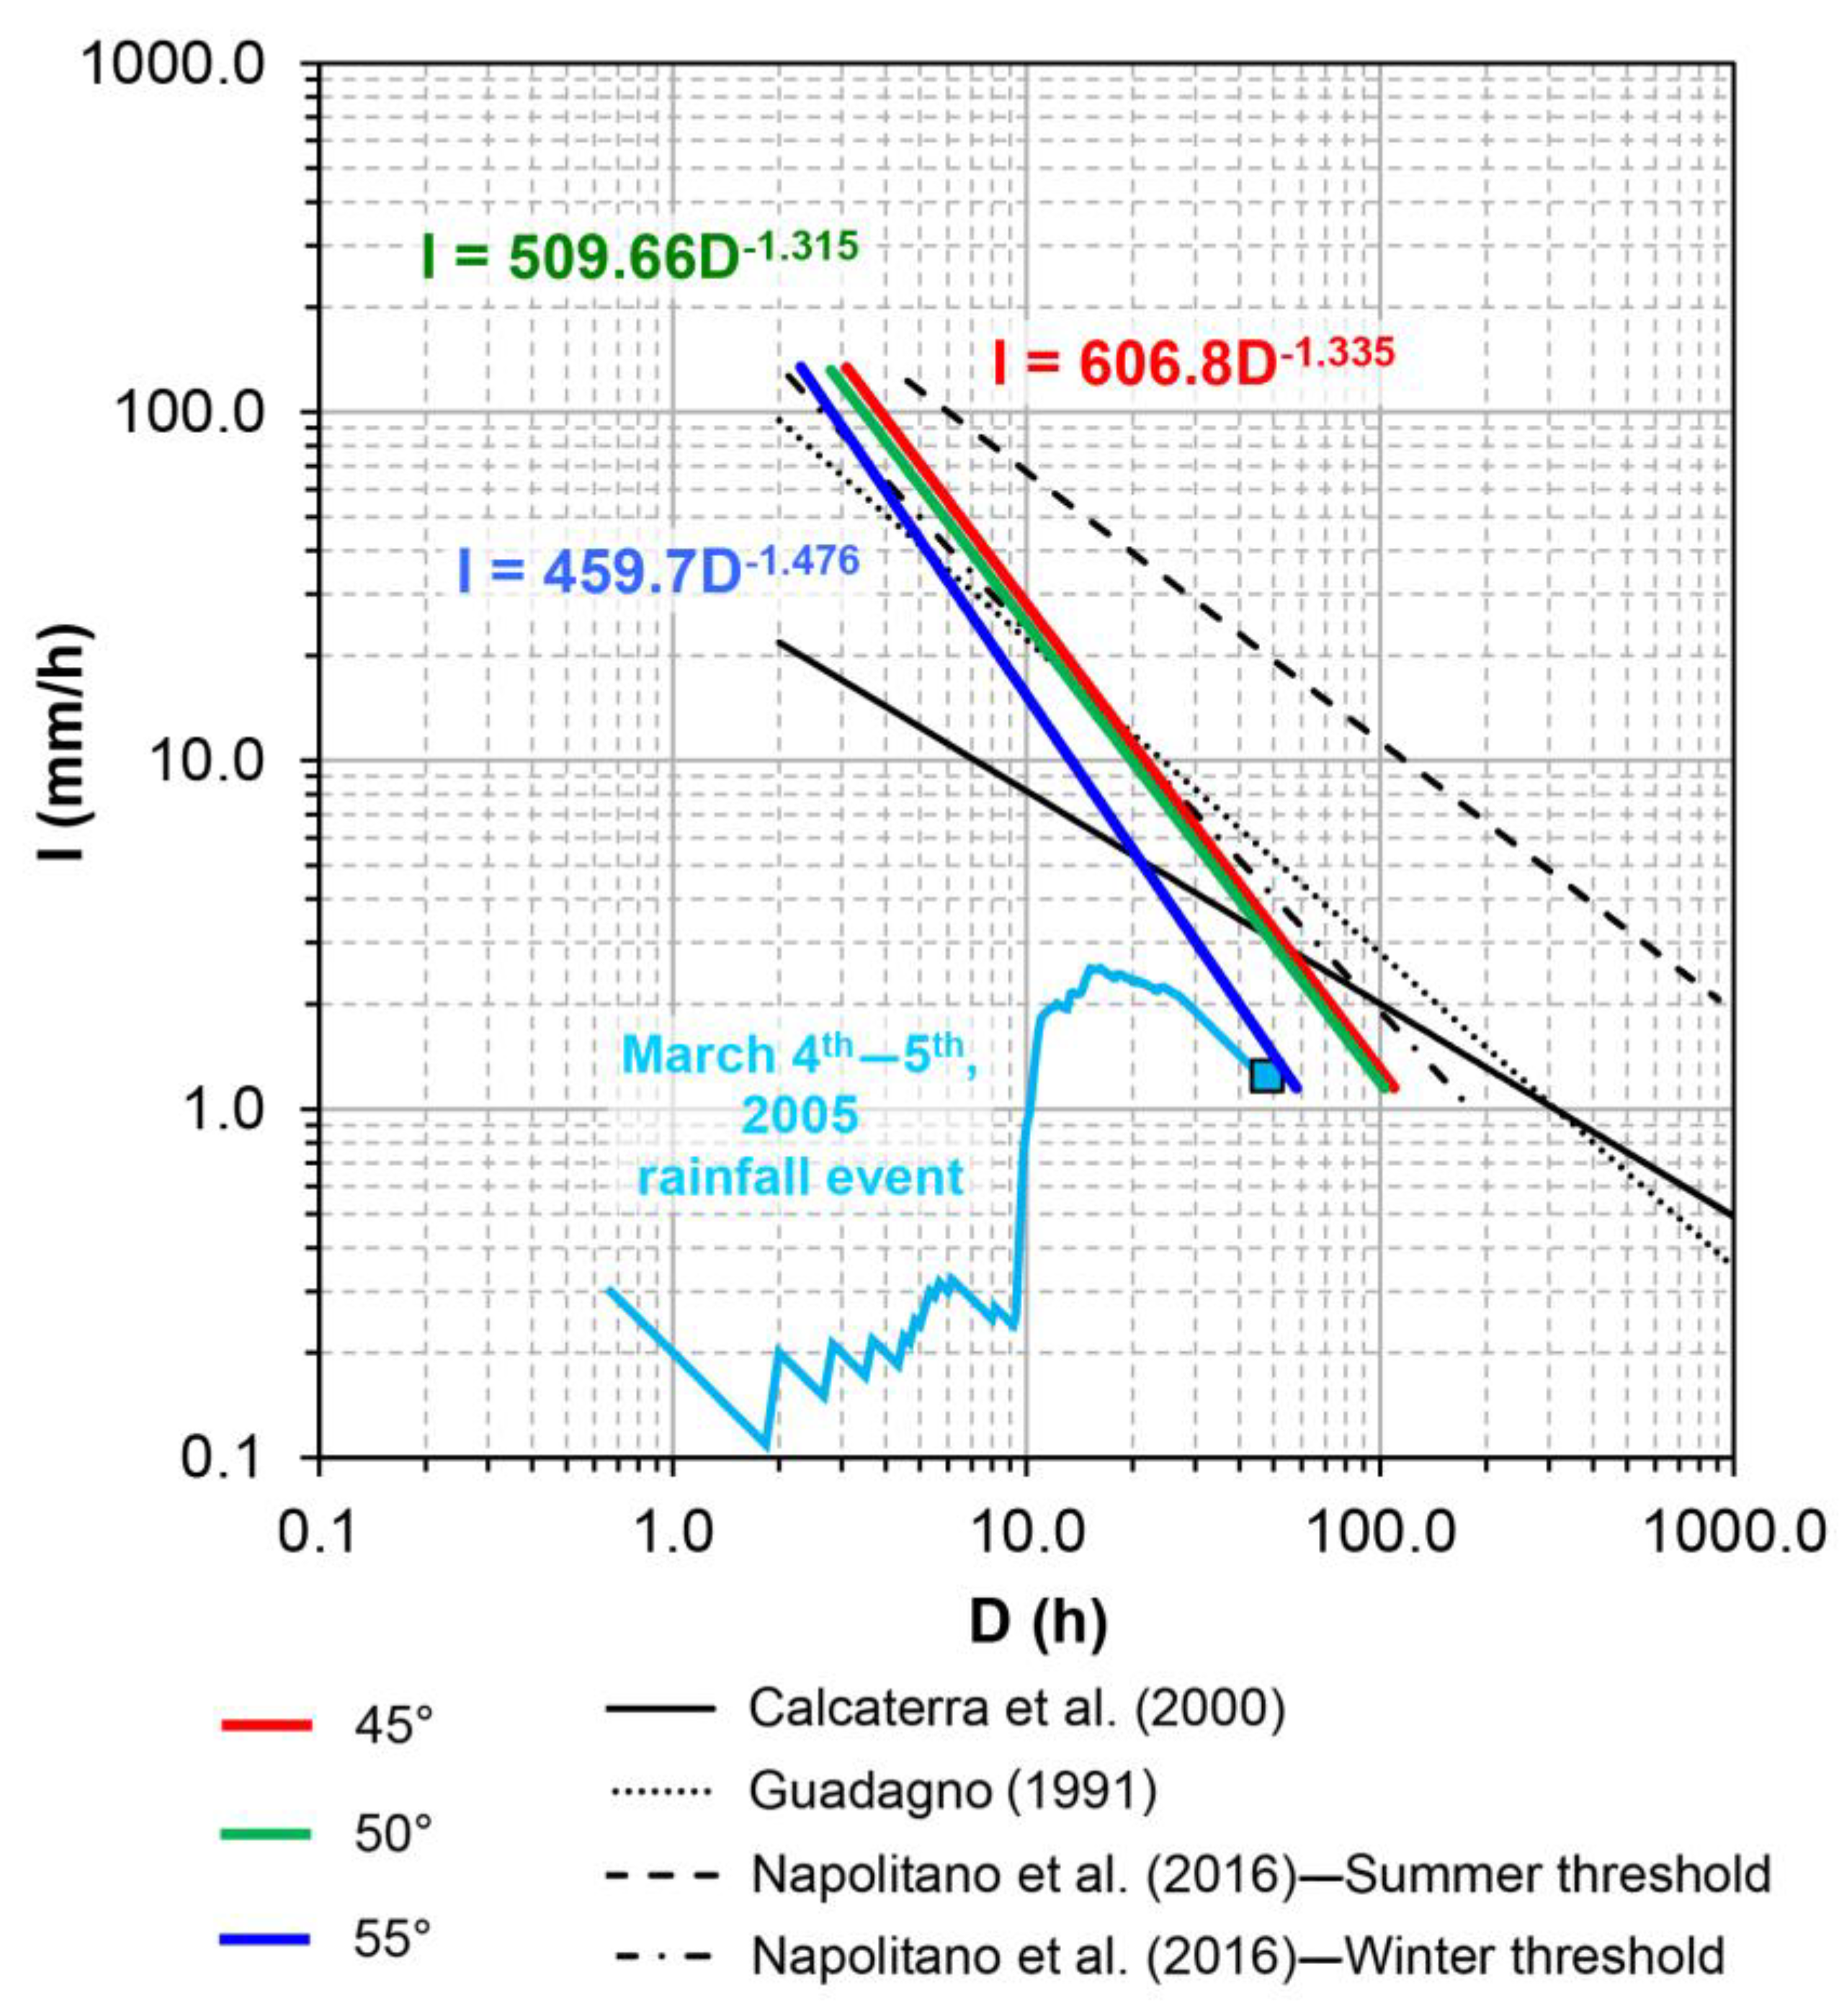
3.4. Intensity–Duration Rainfall Thresholds

Considering initial soil hydrological conditions of the pyroclastic soil cover as being representative of the rainy season, the hydrological response of the three representative slope models (45°, 50°, and 55°) was simulated by the VS2DTI code at the temporal scale of a single rainfall event. At this scope, six rainfall events with respective constant intensities of 2.5, 5.0, 10, 20, 40, and 80 mm/h were considered. The outputs of the numerical simulations were used for the calculation of the FoS under the assumption of the infinite slope condition for each slope angle. The FoS was calculated for each time step (600 s) of the numerical simulation to assess the critical duration of the rainfall event leading to slope instability (FoS = 1). The combination of rainfall intensity values and corresponding durations to slope failure indicated I-D rainfall threshold values, whose fitting using a power-law regression allowed for the estimation of deterministic rainfall thresholds for shallow landslide initiation (Figure 12).
As expected, the effect of the increase in the slope angle on the I-D rainfall thresholds was recognized with shorter durations, for the same rainfall intensity, and lower intensities, for the same duration (Figure 12). The two lower topographic slope angles (45° and 50°) exhibited very similar thresholds, whereas the steepest slope angle (55°) showed a more steeply sloping threshold.
The temporal evolution of average intensity through the duration of the rainfall event that occurred on the 4th and 5th of March 2005 at the Camaldoli Hill, recorded by the local rainfall station, was plotted against the calculated I-D rainfall thresholds. This shows that the observed event approached the thresholds for the 55° slope model at about 48 hours, which provides a basic validation of the rainfall thresholds being related to a slope model whose physical settings corresponded to those of the studied slope (Figure 5), as well as to the most frequent case of slope angle in source areas of landslides that occurred on the 4th and 5th of March 2005 (Figure 3).

4. Discussion

Results from the monitoring and numerical modelling of soil pressure heads in a sample area of the southern slope of Camaldoli Hill provide quantitative insights into the hydrological response of the A and B soil horizons involved in rainfall-induced shallow landslides in the area. The reconstructed slope models, representative of geomorphological conditions in which shallow landslides initiated, allow for a coupled modelling of slope hydrological response and stability analysis, and thus the estimation of deterministic I-D rainfall thresholds for landslide triggering, under given antecedent hydrological conditions and rainfall events.
Among the fundamental outcomes of this research was the reconstruction of a detailed engineering geological model of the studied landslide in the source area, which showed the involvement, via a slide mechanism, of the present-day soil overlying a weathered ash horizon. Such results demonstrate how the physical model of the initial slide, evolving downslope with a flow-like mechanism, was much simpler that the complex stratigraphic setting of the local bedrock because it formed simply via a two-layer system. The upper, formed by the present-day soil, is characterized by higher hydraulic conductivity and lower shear strength. The lower, comprised of weathered ash, had a lower hydraulic conductivity and higher shear strength. Therefore, also due to a condition of approximate parallelism between the slope profile and the interface between the two layers, the infinite slope model was well applicable. Moreover, considering the existence of a lower layer with low permeability, the slope hydrological response was considered controlled only by rainfall infiltration processes and not by perched groundwater circulating in the local bedrock, which was also prevented by several fine ash horizons existing in the pyroclastic series that formed the local bedrock (Figure 5).
A fundamental methodological step for the achievement of these goals was the characterization of the soil pressure head regime through a hydrological monitoring station established in the geomorphological conditions representative of the source areas of shallow landslides and the corresponding numerical modelling of hydrologic response with a coupled slope stability analysis.
In this application of the combined monitoring and modeling approach, soil pressure head monitoring data showed strong seasonal fluctuations, similar to those observed in nearby peri-volcanic areas of the Campania region that were underlain by sedimentary carbonate bedrock [20,21,22], which was to be expected in areas with a typical Mediterranean climate and vegetation. As recognized in these studies, which were based on the soil hydrological monitoring of pyroclastic coverings, also in our case study, the unsaturated condition was found to be dominant with soil pressure head values widely fluctuating from near-saturation after heavy rainfall events occurring during the winter season, down to the functioning limit of Watermark sensors (−20.0 m), which was far beyond the field capacity (about −3.0 m). Such a wide-ranging hydrological behavior of pyroclastic soil coverings is consistent with the typical Mediterranean seasonality, which also controls the cycle of vegetation cover. These results focus on the relevance of seasonal soil hydrological antecedent conditions as a factor that was strongly predisposed to or hindered slope instability during heavy rainfall events. In fact, seasonal fluctuations of soil pressure head represent a fundamental predisposing hydrological condition for rainfall events to trigger slope instabilities [38], which determines the highest probability of landslides to occur during rainy or rainy-to-dry transition periods.
In this study, the soil pressure head regime was linked to the seasonal and interannual meteorological variability through continuous modelling informed by 10 years of historical climate records (Figure 10), which showed that similar pressure head values persisted during the rainy periods across different years, while variable lower limits were reached during different summer dry periods.
The persistence of relatively wet soil conditions during the late autumn, winter, and early spring likely reflected a balance between infiltration from frequent heavy rainfall events, lower evapotranspiration demand during winter vegetation dormancy, and steady unsaturated water flow percolating downslope into the deeper soil horizons. The transition to very dry conditions between April and June reflected the combined effects of less frequent rainfall events and warmer air temperatures, which determined a higher evapotranspiration demand during the fast growth of vegetation, locally represented by bamboo and ginestre bushes, as well as shrubby vegetation. Given such a seasonal hydrological pattern, the higher antecedent soil pressure head values from the late autumn to early spring, combined with heavy and/or prolonged rainfall events, increased the potential for unsaturated throughflow and near-saturated conditions within the present-day soil. Conversely, during the dry summer period, both lower antecedent pressure head values and the lower probability of heavy and/or prolonged rainfall events reduced the potential for landslide initiation.
These general trends are consistent with previous studies focused on the stability of soils of pyroclastic origin on slopes of the Phlegrean Fields area [13,23,29]. However, during the dry season, typically occurring from June to September, measured soil pressure head values as low as −20.4 m were significantly below the values previously observed, which corresponded to the functioning limit of the tensiometers used (about −8.0 m).
During the wetter season, saturation conditions were not recorded at depths of 0.3, 0.5, or 2.2 m, although saturation may have been reached transitorily in the upper few centimeters (<0.10 m) during heavy rainfall events, when lower antecedent soil pressure heads and unsaturated hydraulic conductivity of the deeper soil horizons can produce a capillary barrier effect [39]. Soil pressure heads in the uppermost part of the present-day soil cover varied more rapidly than in the deeper zone, where hydrological response was delayed and dampened. Specific conditions, such as composite layering of the surficial volcaniclastic series (alternating pumiceous lapilli and fine ash horizons), spatial variability of soil horizon thickness, and slope angle (up to 60°) controlled the soil pore pressure within hillslopes during rainfall events. Furthermore, the progressive decrease of saturated hydraulic conductivity with depth, in the shallowest part of the volcaniclastic series, and the low permeability of the fine ash soil horizon favored ephemeral throughflow processes, especially during the wet season and under heavy rainfall events.
Results of the calibrated hydrologic modelling reproduced the overall patterns of the 2015–2016 monitoring data, especially during the rainy and rainy/dry transition periods, and for the shallower soil horizons. However, the model was less successful in consistently replicating the hydrological response of deeper soil horizons, especially during the dry period and for the lowest soil pressure head range, detected only using the Watermark sensors (Figure 9). Major discrepancies were attributable to heterogeneities of soil horizons occurring at a scale exceeding the soil sample dimensions, such as macropores formed by root apparatuses, while the minor ones were generated by the setting of the hydrological model, based on parameters of the SWRC estimated during drying conditions only. Notwithstanding these differences, results of the numerical modelling were acceptable for simulating the hydrological response of shallower soil horizons during the rainy period with soil pressure head values very frequently exceeding −2.5 m (Figure 9). Moreover, relative to previous hydrological modelling carried out for idealized slope models [23,29], this study used physically based models of the landslide zones that were consistent with field geological observations of complex layering.
The plausibility of results of this deterministic approach was confirmed through the comparison of the I-D rainfall thresholds with recorded rainfall during the 4th and 5th of March 2005 landslides (Figure 12). In particular, I-D values of this triggering rainfall event approach those calculated for the 55° slope threshold, which was consistent with the steeper portions of the landslide at the field monitoring station. The deterministic I-D rainfall thresholds for the three slope angles exhibited similar trends, although they were quite different from those reported in the literature (Figure 12). In fact, they showed higher rainfall intensity and duration values and steeper thresholds than other rainfall thresholds reconstructed for the peri-Vesuvian area using empirical approaches [16,40]. More similarities were instead recognized with winter deterministic I-D rainfall thresholds estimated for the Sarno Mountains in the Campania region [38]. These observations suggest that slopes of the Camaldoli Hill may be less susceptible to landsliding during short, high-intensity storms, but also potentially more susceptible to longer, low-intensity rainfall, as was observed during the March 2005 landslide events. Considering the comparison with the Sarno case [38], the higher rainfall intensity occurring over shorter durations (Figure 12) likely reflected the high hydraulic conductivity and rapid drainage of the present-day soil horizon (A and B soil horizons), which was mostly involved in the slope failures at Camaldoli Hill. Instead, the higher steepness of the I-D rainfall thresholds was due to a lower mean thickness of soil horizons involved in the active hydrologic processes, which lead to landsliding. Furthermore, the present-day soil was characterized by friction angle values that were lower than the slope angle and incoherent materials with contributions of apparent cohesion, derived largely from unsaturated conditions and root strength. During heavy and/or prolonged rainfall events, the infiltration process causes the increase of pressure heads up to near-saturation values within the present-day soil, which consequently reduces (or eliminates) this apparent cohesion. The corresponding reduction of the shear strength thus contributes to landslide triggering, especially for higher slope angles.
The proposed approach is consistent with a recent research trend aimed at the assessment of hazards from rainfall-induced shallow landslides using the estimation of hydrological thresholds, which employ monitoring and physically based modelling of the soil hydrological regime [38,41,42,43]. In particular, the results advance the understanding of the hydrological condition leading to shallow landsliding in the geomorphological framework of the volcanic slopes of the Campania region, which has been poorly studied so far. Furthermore, results highlight the exposure of urbanized areas, such as the Soccavo and Pianura boroughs of Naples, to dangerous effects of rapid to very rapid shallow landslides. In contrast to debris flows involving ash-fall pyroclastic deposits covering carbonate mountains in the Campania region of southern Italy [44], for which a sufficient number of landslide events and corresponding rainfall measurements allowed for the application of empirical approaches, the historical record of past landslides in the Phlegrean Fields area is scarce, thus limiting the use of such empirical methods. Therefore, the most promising approach for developing an early warning system based on rainfall conditions, is the estimation of deterministic rainfall thresholds using physically based modelling, which can be supported by monitoring of the soil hydrological regime and slope stability analysis.

5. Conclusions

The 4th and 5th of March 2005 rainfall-induced landslide event involving volcaniclastic soils mantling the Camaldoli hillslopes demonstrated that shallow and rapid landsliding is one of the principal geohazards affecting volcanic slopes of the Phlegrean Fields volcanic area of southern Italy. Given the scarce information on records of past landslide occurrences and related rainfall measurements, which prevented the application of an empirical approach (e.g., Caine [17]), this study advances the quantitative understanding of the hydrological triggering conditions in this complex geologic setting. Detailed field characterization and soil hydrological monitoring, along with a physically based modelling of hillslope hydrologic response and slope stability, were developed to estimate deterministic intensity–duration (I-D) rainfall thresholds for landslide early warning systems.
This approach has already been used successfully for different ash-fall pyroclastic soils mantling sedimentary carbonate mountains that surround the Somma–Vesuvius volcano [22,38,41], but the present application illustrates important differences in the I-D thresholds for landslides in soils of a pyroclastic origin, developed over a layered volcaniclastic substratum. In particular, results suggest that these typical soils of volcanic slopes of the Phlegrean Fields are less susceptible to landsliding during shorter, high-intensity rainfall events than global averages.
The proposed deterministic approach for estimating I-D thresholds is a viable alternative to the more traditional empirical approach, especially in cases with few or inconsistent data of historical landslide occurrences and related rainfall records [45]. Moreover, the deterministic approach can resolve problems related to insufficient or biasing datasets and can incorporate the seasonal or even daily variations in antecedent soil moisture (e.g., Thomas et al. [43]). In such a view, results from this study represent an effort to reduce uncertainty [46] in the existing empirical rainfall thresholds for landslide initiation, which are still used in the volcanic and peri-volcanic areas of the Campania region for civil protection purposes, despite considerable variations in geology and hillslope hydrology across the region. This suggests the approach in this study could be used in similar contexts with sufficient information on material properties and hydrogeologic setting for improving landslide early warning systems.
Finally, the approach proposed in this research can support an early warning system for shallow landslide initiation, based on real-time monitoring of rainfall or now-casting using a meteorological radar technique, which can be considered specific to the geomorphological framework to which it is applied.

Author Contributions

Conceptualization, P.D.V., B.B.M., R.L.B. and D.C.; Data curation, F.F., R.T. and E.D.C.; Formal analysis, P.D.V., B.B.M., R.L.B., V.A. and D.C.; Funding acquisition, D.C.; Investigation, F.F., R.T. and E.D.C.; Methodology, F.F., P.D.V., V.A. and R.T.; Project administration, D.C.; Resources, D.C.; Software, F.F.; Supervision, B.B.M. and R.L.B.; Validation, B.B.M., R.L.B. and V.A.; Visualization, D.C.; Writing—original draft, F.F., P.D.V. and R.T.; Writing—review & editing, P.D.V., B.B.M. and R.L.B..

Funding

This research was supported by the PRIN Project (2010–2011) “Time-Space prediction of high impact landslides under changing precipitation regimes” funded by the Ministry for Education, University and Research (MIUR-Italy) and coordinated by Prof. F.M. Guadagno (University of Sannio, Italy) and the Ph.D. Program (20142018) of the Dipartimento di Scienze della Terra, dell’Ambiente e delle Risorse, University of Naples Federico II.

Acknowledgments

We thank Ing. Matteo Gentilella, chief of the Centro Funzionale Decentrato of Regione Campania, Settore Programmazione e Interventi Protezione Civile of Napoli, for providing thermo-pluviometric data. Jonathan Godt provided valuable feedback on an earlier version of this manuscript.

Conflicts of Interest

The authors declare no conflict of interest. Furthermore, any use of trade, firm, or product names is for descriptive purposes only and does not imply endorsement by the U.S. Government.

References

  1. Di Martire, D.; De Rosa, M.; Pesce, V.; Santangelo, M.A.; Calcaterra, D. Landslide hazard and land management in high-density urban areas of Campania region, Italy. Nat. Hazards Earth Syst. Sci. 2012, 12, 905–926. [Google Scholar] [CrossRef] [Green Version]
  2. Calcaterra, D.; Coppin, D.; de Vita, S.; Di Vito, M.A.; Orsi, G.; Palma, B.; Parise, M. Slope processes in weathered volcaniclastic deposits within the city of Naples: The Camaldoli Hill case. Geomorphology 2007, 87, 132–157. [Google Scholar] [CrossRef]
  3. Campbell, R.H. Soil slips, debris flows, and rainstorms in the Santa Monica Mountains and vicinity, southern California. In US Geological Survey Professional Paper; U.S. Government Printing Office: Washington, DC, USA, 1975; Volume 851, p. 51. [Google Scholar]
  4. Hungr, O.; Evans, S.G.; Bovis, M.J.; Hutchinson, J.N. A review of the classification of landslides of flow type. Environ. Eng. Geosci. 2001, 7, 221–238. [Google Scholar] [CrossRef]
  5. United States Department of Agriculture (USDA). Keys to Soil Taxonomy, 12th ed.; United States Department of Agriculture, Natural Resources Conservation Service, Government Printing Office: Washington, DC, USA, 2014; 372p.
  6. Calcaterra, D.; de Riso, R.; Nave, A.; Sgambati, D. The role of historical information in landslide hazard assessment of urban areas: The case of Naples (Italy). In Proceedings of the 1st European Conference on Landslides, Prague, Czech Republic, 24–26 June 2002; Rybar, J., Stemberk, J., Wagner, P., Eds.; CRC Press: London, UK, 2002; pp. 129–135, ISBN 9789058093936. [Google Scholar]
  7. Orsi, G.; De Vita, S.; Di Vito, M. The restless, resurgent Campi Flegrei nested caldera (Italy): Constraints on its evolution and configuration. J. Volcanol. Geotherm. Res. 1996, 74, 179–214. [Google Scholar] [CrossRef]
  8. Bartole, R. Tectonic structures of the Latian–Campanian shelf (Tyrrhenian Sea). Boll. Oceanol. Teor. Appl. 1984, 2, 197–230. [Google Scholar]
  9. Pappalardo, L.; Civetta, L.; D’Antonio, M.; Deino, A.; Di Vito, M.A.; Orsi, G.; Carandente, A.; de Vita, S.; Isaia, R.; Piochi, M. Chemical and isotopical evolution of the Phlegraean magmatic system before the Campanian Ignimbrite (37 ka) and the Neapolitan Yellow Tuff (12 ka) eruptions. J. Volcanol. Geotherm. Res. 1999, 91, 141–166. [Google Scholar] [CrossRef]
  10. De Vivo, B.; Rolandi, G.; Gans, P.B.; Calvert, A.; Bohrson, W.A.; Spera, F.J.; Belkin, A.E. New constraints on the pyroclastic eruption history of the Campanian volcanic plain (Italy). Mineral. Pet. 2001, 73, 47–65. [Google Scholar] [CrossRef]
  11. Scarpati, C.; Perrotta, A.; Lepore, L.; Clvert, A. Eruptive history of Neapolitan Volcanoes: Constraints from 40Ar–39Ar dating. Geol. Mag. 2013, 150, 412–425. [Google Scholar] [CrossRef]
  12. Cruden, D.M.; Varnes, D.J. Landslides types and processes. In Landslides: Investigation and Mitigation; Turner, A.K., Schuster, R.L., Eds.; Transportation Research Board, Special Report 247; National Research Council, National Academy Press: Washington, DC, USA, 1996; pp. 36–75. [Google Scholar]
  13. Evangelista, A.; Scotto di Santolo, A.; Lombardi, G. Previsione dell’innesco di fenomeni franosi nelle coltri piroclastiche Della città di Napoli. In Proceedings of the XXIII Congresso Nazionale di Geotecnica, Padova, Italy, 16–18 May 2007. (In Italian). [Google Scholar]
  14. Scotto di Santolo, A. Analysis of a steep slope in unsaturated pyroclastic soil. In Unsaturated Soils for Asia; Balkema: Rotterdam, The Netherlands, 2000; ISBN 9058091392. [Google Scholar]
  15. Lu, N.; Godt, J.W. Hillslope Hydrology and Stability; Cambridge University Press: New York, NY, USA, 2013; 458p, ISBN 978-1107021068. [Google Scholar]
  16. Guadagno, F.M.; Revellino, P.; Grelle, G. The 1998 Sarno landslides: Conflicting interpretations of a natural event. In Proceedings of the 5th International Conference on Debris-Flow Hazards “Mitigation, Mechanics, Prediction and Assessment”, Padua, Italy, 14–17 June 2011. [Google Scholar]
  17. Caine, N. The rainfall intensity-duration control of shallow landslides and debris flows. Geogr. Ann. 1980, 62A, 23–27. [Google Scholar]
  18. De Vita, P.; Napolitano, E.; Godt, J.; Baum, R. Deterministic estimation of hydrological thresholds for shallow landslide initiation and slope stability models: case study from the Somma-Vesuvius area of southern Italy. Landslides 2013, 10, 713–728. [Google Scholar] [CrossRef]
  19. Mirus, B.B.; Smith, J.B.; Baum, R.L. Shallow Landslide Assessment of Coastal Bluffs along Puget Sound using a Physics-Based Hydro-Mechanical Model. In Landslides: Putting Experience, Knowledge and Emerging Technologies into Practice; De Graff, J.V., Shakur, A., Eds.; Association of Environmental & Engineering Geologists (AEG): Roanoke, VA, USA, 2017; pp. 442–454. ISBN 978-0-9897253-7-8. [Google Scholar]
  20. Fusco, F.; De Vita, P.; Napolitano, E.; Allocca, V.; Manna, F. Monitoring the soil suction regime of landslide prone ash-fall pyroclastic deposits covering slopes in the Sarno area (Campania—Southern Italy). Rend. Online Soc. Geol. It. 2013, 24, 146–148. [Google Scholar]
  21. Fusco, F.; De Vita, P. Hydrological monitoring of ash-fall pyroclastic soil mantled slopes in Campania (Southern Italy). In Advancing Culture of Living with Landslides; Mikoš, M., Arbanas, Z., Yiin, Y., Sassa, K., Eds.; Springer International Publishing: New York, NY, USA, 2017. [Google Scholar]
  22. Fusco, F.; De Vita, P.; Allocca, V. Hydro-geomorphological modelling of ash-fall pyroclastic soils for debris flow initiation and groundwater recharge in Campania (Southern Italy). Catena 2017, 158, 235–249. [Google Scholar] [CrossRef]
  23. Evangelista, A.; Nicotera, M.V.; Scotto di Santolo, A. Experimental on Theoretical Investigation on matric suction measurements in pyroclastic soils. In Proceedings of the International Conference on Fast Slope Movement-Prediction and Prevention for Risk Mitigation, Naples, Italy, 11–13 May 2003. [Google Scholar]
  24. Van Genuchten, M.T. A closed form equation for predicting the hydraulic conductivity of unsaturated soils. Soil Sci. Soc. Am. 1980, 44, 892–898. [Google Scholar] [CrossRef]
  25. Van Genuchten, M.T.; Leij, F.J.; Yates, S.R. The RETC Code for Quantifying Hydraulic Functions of Unsaturated Soils; EPA/600/2-91/065, R.S.; U.S. Environmental Protection Agency: Ada, OK, USA, 1991; Volume 83.
  26. Bouwer, H. Intake rate: Cylinder infiltrometer. In Methods of Soil Analysis: Part 1; Klute, A., Ed.; SSSA: Madison, WI, USA, 1986; pp. 825–844. [Google Scholar]
  27. Amoozegar, A.; Warrick, A.W. Hydraulic conductivity of saturated soils: Field methods. In Methods of Soil Analysis: Part 1, 2nd ed.; Klute, A., Ed.; Agronomy Monogr. 9; ASA, SSSA: Madison, WI, USA, 1986. [Google Scholar]
  28. Hsieh, P.A.; Wingle, W.; Healy, R.W. VS2DI—A Graphical Software Package for Simulating Fluid Flow and Solute or Energy Transport in Variably Saturated Porous Media. Water-Resour. Invest. Rep. 2000. [Google Scholar] [CrossRef]
  29. Evangelista, A.; Scotto di Santolo, A. Analysis and Field Monitoring of Slope Stability in Unsaturated Pyroclastic Soil Slopes in Napoli, Italy. In Proceedings of the Fifth International Conference on Case Histories in Geotechnical Engineering, New York, NY, USA, 13–17 April 2004. [Google Scholar]
  30. Kirkham, M.B. Principles of Plant and Soil Water Relations; Elsevier: Manhattan, KS, USA, 2015; p. 500. ISBN 978-0-12-420022-7. [Google Scholar]
  31. Thornthwaite, C.W. An Approach toward a Rational Classification of Climate. Geogr. Rev. 1948, 38, 55–94. [Google Scholar] [CrossRef]
  32. Skempton, A.W.; De Lory, F.A. Stability of natural slopes in London Clay. In Selected Papers on Soil Mechanics; Thomas Telford: London, UK, 1957; Volume 2, pp. 378–381. [Google Scholar]
  33. Lu, N.; Likos, W.J. Unsaturated Soil Mechanics; Wiley: New York, NY, USA, 2004; 556p. [Google Scholar]
  34. Lu, N.; Godt, J.W.; Wu, D.T. A closed-form equation for effective stress in unsaturated soil. Water Resour. Res. 2010, 46, 1–14. [Google Scholar] [CrossRef]
  35. Sanglerat, G. The Penetrometer and Soil Exploration. In Developments in Geotechnical Engineering; Elsevier Publishing: New York, NY, USA, 1972; Volume 1. [Google Scholar]
  36. Chen, P.; Mirus, B.B.; Lu, N.; Godt, J.W. Effect of hydraulic hysteresis on the stability of infinite slopes under steady infiltration. J. Geotech. Geoenviron. Eng. 2017. [Google Scholar] [CrossRef]
  37. Ebel, B.A.; Godt, J.W.; Lu, N.; Coe, J.A.; Smith, J.B.; Baum, R.L. Field and laboratory hydraulic characterization of landslide-prone soils in the Oregon Coast Range and implications for hydrologic simulation. Vadose Zone J. 2018, 17, 1800078. [Google Scholar] [CrossRef]
  38. Napolitano, E.; Fusco, F.; Baum, R.L.; Godt, J.W.; De Vita, P. Effect of antecedent-hydrological conditions on rainfall triggering of debris flows in ash-fall pyroclastic mantled slopes of Campania (Southern Italy). Landslides 2016. [Google Scholar] [CrossRef]
  39. Mancarella, D.; Doglioni, A.; Simeone, V. On capillary barrier effects and debris slide triggering in unsaturated layered covers. Eng. Geol. 2012, 147–148, 14–27. [Google Scholar] [CrossRef]
  40. Calcaterra, D.; Parise, M.; Palma, B.; Pelella, L. The influence of meteoric events in triggering shallow landslides in pyroclastic deposits of Campania, Italy. In Landslides in Research, Theory and Practice; Thomas Telford Publishing: London, UK, 2000; pp. 209–214. [Google Scholar]
  41. De Vita, P.; Fusco, F.; Tufano, R.; Cusano, D. Seasonal and Event-Based Hydrological and Slope Stability Modeling of Pyroclastic Fall Deposits Covering Slopes in Campania (Southern Italy). Water 2018, 10, 1140. [Google Scholar] [CrossRef]
  42. Mirus, B.B.; Morphew, M.D.; Smith, J.B. Developing Hydro-Meteorological Thresholds for Shallow Landslide Initiation and Early Warning. Water 2018, 10, 1274. [Google Scholar] [CrossRef]
  43. Thomas, M.A.; Mirus, B.B.; Collins, B.D. A physics-based approach to identify thresholds for rainfall-induced shallow landsliding. Geophys. Res. Lett. 2018, 45, 9651–9661. [Google Scholar] [CrossRef]
  44. De Vita, P.; Fusco, F.; Napolitano, E.; Tufano, R. Physically-based models for estimating rainfall triggering debris flows in Campania (Southern Italy). In Advancing Culture of Living with Landslides; Mikoš, M., Arbanas, Z., Yiin, Y., Sassa, K., Eds.; Springer International Publishing: New York, NY, USA, 2017. [Google Scholar]
  45. De Vita, P.; Piscopo, V. Influences of hydrological and hydrogeological conditions on debris flows in peri-Vesuvian hillslopes. Nat Hazards Syst Sci. 2002, 2, 27–35. [Google Scholar] [CrossRef]
  46. Nikolopoulos, E.I.; Crema, S.; Marchi, L.; Marra, F.; Guzzetti, F.; Borga, M. Impact of uncertainty in rainfall estimation on the identification of rainfall thresholds for debris flow occurrence. Geomorphology 2014, 221, 286–297. [Google Scholar] [CrossRef]
Figure 1. Landslides occurred on the 4th and 5th of March 2005 along the western slope of Camaldoli Hill facing the Pianura borough of Naples.
Water 11 01915 g001
Figure 2. Geological setting of Phlegrean Fields area in southern Italy (modified from Orsi et al. [7]): (1) alluvial deposits; (2) distal volcanic deposits, younger than the Neapolitan Yellow Tuff (NYT) eruption (14 k-years B.P.), mostly characterized by ash-fall products; (3) proximal volcanic deposits, younger than the NYT eruption (14 k-years B.P.), mostly composed of pyroclastic flow and/or surge; (4) NYT deposits (14 k-years B.P.); (5) volcanic pre-NYT deposits (39–14 k-years B.P.); (6) Campanian Ignimbrite (CI) deposits (39 k-years B.P.); (7) volcanic pre-CI deposits (older than 39 k-years B.P.); (8) supposed CI caldera rim; (9) supposed NYT caldera rim; (10) fault; (11) crater rim of volcanic vents younger than 14 k-years B.P.; and (12) study area of monitoring site. Note: UTM 33N– WGS84 coordinates labelled in upper right- and lower left-hand corners of the inset map.
Water 11 01915 g002
Figure 3. Aerial imagery showing the location of the monitoring site and landslides that occurred during the 4th and 5th of March 2005 on the slopes of Camaldoli Hill. Inset graph shows the frequency histogram of slope angle values in landslide source areas.
Water 11 01915 g003
Figure 4. Photo of field surveys and observations at the monitoring site: (A) stratigraphic column, progressive manual digging, and sampling at different depths; (B) topographic survey; (C) Amoozegar permeameter tests; and (D) setting of the soil hydrologic monitoring station.
Water 11 01915 g004
Figure 5. Engineering–geological model of the sample area reconstructed using field investigations. The geometry of the landslide depletion zone and location of the soil hydrological monitoring station are also shown. Keys to numbers: (1) earth-fill behind retaining wall, (2) present-day soil (A and B soil horizons), (3) paleosol, (4) fine ash horizon, (5) pumiceous horizon, (6) Neapolitan Yellow Tuff (15 k-yrs B.P.), (7) present-day slope profile, (8) reconstructed pre-landslide slope profile, (9) borehole (20-m deep), (10) dynamic penetrometer tests, and (11) monitoring station area.
Water 11 01915 g005
Figure 6. Grain size and consistency limits of volcaniclastic soil horizons (present-day soil horizons, pumiceous horizon, paleosol, and cineritic horizons) sampled at different depths.
Water 11 01915 g006
Figure 7. Unsaturated and saturated properties characterization: (A) soil water retention curves (SWRCs), and (B) saturated hydraulic conductivity (Ksat) measured along a vertical profile.
Water 11 01915 g007
Figure 8. Setup of the numerical hydrological model in VS2DTI [28]: (1) present-day soil (A and B soil horizons), (2) pumiceous soil horizon, (3) paleosol, (4) fine ash horizon, (5) zone external to the model’s domain, (6) possible seepage face, (7) rainfall/evapotranspiration boundary, (8) evapotranspiration out-flow, (9) rainfall in-flow, (10) observation points vertical profiles, and (11) no-flow boundary.
Water 11 01915 g008
Figure 9. Measured and simulated pressure head values for the 2015 hydrological year showing all negative values (unsaturated conditions). Daily rainfall and optimized evapotranspiration rates (ETR) are also shown. The daily time scale for rainfall was obtained from a weather station managed by the Civil Protection Department (Station ID# 18891, Napoli Camaldoli), located about 50 m upslope from the monitoring area. The x-axis represents abbreviated months-years.
Water 11 01915 g009
Figure 10. Simulated pressure head for a 10-year period (December 2005–December 2015), obtained using the model calibrated through pressure head data monitored in the 2015 hydrological year showing all negative values (unsaturated conditions). The daily time scale for rainfall was obtained from a weather station managed by the Civil Protection Department (Station ID# 18891, Napoli Camaldoli) located about 50 m upslope from the monitoring area. The x-axis represents abbreviated months-years.
Water 11 01915 g010
Figure 11. Slope models parametrized using field and laboratory characterizations, representative of three different slope angles (45°, 50°, and 55°), used for the reconstruction of the geometrical setting in VS2DTI modeling and slope stability analysis.
Water 11 01915 g011
Figure 12. Deterministic intensity–duration (I-D) rainfall thresholds obtained for the Camaldoli Hill sample area. Thresholds obtained for 45°, 50°, and 55° slope angles were compared with evolving average rainfall intensity during the March 4th and 5th, 2005, rainfall event and other regional rainfall thresholds from the literature.
Water 11 01915 g012
Table 1. Reference stratigraphic setting of the sample area derived from the borehole drilling B1 (Figure 5). Classification by the Unified Soils Classification System (USCS) of each soil horizon is also shown.
Range Depth (m)Lithological DescriptionHorizon
0.00‒1.00Very loose soil of pyroclastic origin, highly pedogenized, with sparse weathered pumiceous lapilli. Enriched with organic content and pervaded by dense root apparatuses. Dark brown colored (SM).Present-day soil
(A and B soil horizons)
1.00‒2.50Very loose lapilli made of white pumice with low degree of weathering (GP), mixed subordinately with greenish fine ash which increases to the top (GM). Agnano Monte Spina eruption (4 k-years B.P.).Pumice
2.50‒2.60Soil of pyroclastic origin constituted by fine to coarse ash and subordinately by pumiceous lapilli and carbonized organic remnants. Paleosol (SM). Brown-red to dark red colored.Paleosol
2.60‒4.60Coarse ashes with fine ash matrix (SM) and alternating pumiceous lapilli (GW). Grey-greenish colored. Agnano eruption (4 k-years B.P.).Ash / Pumice
4.60‒5.10Pumiceous lapilli with low degree of weathering and lithic fragments (GP). White colored. Agnano eruption (4 k-years B.P.).Pumice
5.10‒6.10Soil of pyroclastic origin made of fine to coarse ash and subordinately by pumiceous lapilli and carbonized organic matter. Paleosol (SM). Brown-yellowish colored.Paleosol
6.10‒9.60Alternation of fine ash (SM) and coarse sand (GP) with subordinately pumiceous lapilli and burned organic matter. Grey-greenish colored. Pisani eruption (5 k-years B.P.).Ash
9.60‒10.0Very loose, light-grey pumiceous lapilli layer with low degree of weathering (GP) and greenish ash increasing to the top (SM). Pisani eruption (5 k-years B.P.).Pumice
10.00‒11.50Alternating fine (SM) and coarse (GM) ashes with subordinately pumiceous lapilli and carbonized organic matter. Greenish colored. Minopoli eruption (8 k-years B.P).Ash
11.50‒13.50Very loose pumiceous lapilli with a low degree of weathering and lithic fragments (GW). Light grey colored. Pomici Principali eruption (10 k-years B.P.).Pumice
13.50‒17.00Fine ash layer (SM) with pumiceous lapilli, lithic fragments, and carbonized organic matter. Grey-greenish colored. Uncertain eruption.Ash
17.00‒17.50Very loose pumiceous lapilli with a low degree of weathering (GP) and fine ash content increasing to the top (GM). Grey-greenish colored.Pumice
17.50‒20.00Coarse ash with white-yellowish pumiceous lapilli and lithic fragments (SM). Layered texture related to the different grain sizes. Grey-greenish colored. Loose facies of Neapolitan Yellow Tuff eruption (15 k-years B.P.).Ash
>20.00 Lithified facies of Neapolitan Yellow Tuff eruption (15 k-years B.P.). Yellowish colored.Tuff
Table 2. Distribution of tensiometer and Watermark sensors used for pressure head monitoring, depending on soil horizons.
HorizonDepth Range (m)Tensiometer Depth (m)Watermark Sensor Depth (m)
Present-day soil0.0‒1.80.5 and 1.30.3
Fine ash 1.8‒2.2-2.2
Table 3. Saturated (Ksat) and unsaturated parameters for the van Genucthen’s formula for the SWRC, determined for each pyroclastic soil horizon using in situ and laboratory tests, respectively. Key to symbols: Ksat—hydraulic conductivity, θs—saturated volumetric water content, θr—residual volumetric water content, and α and n—van Genuchten 1980 [24] model fitting parameters estimated using the RETC code [25].
HorizonKsat (m/s)θsθrαn
Present-day soil2.92 × 10−40.6190.1803.0801.670
Pumiceous layer2.82 × 10−40.5820.0014.2001.430
Paleosol4.45 × 10−50.6160.1600.9302.320
Fine ash layer1.57 × 10−70.5640.1600.9302.320
Table 4. Minimum, median, and maximum soil pressure head values (m) recorded during the 2015 monitoring period. The rainy period was related to the period October–May 2015, while the dry period was June–September 2015.
DepthRainy PeriodDry Period
MinMedianMaxMinMedianMax
(m)(m)(m)(m)(m)(m)(m)
0.3−4.1−1.6−1.0---
0.5−20.4−4.2−2.1---
2.2−20.3−5.4−3.7−20.4−20.4−20.4
Table 5. Root parameters used in VS2DTI model to simulate plant transpiration and soil moisture abstraction from the volcaniclastic soil cover. Key to symbols: RD—root depth, RAB—root activity at the base, RAT—root activity at the top, and RPH—root pressure head.
Period
(Month–Month)
RD
(m)
RAB
(cm−2)
RAT
(cm−2)
RPH
(m)
Jan–Feb0.30.10.1−150.0
Mar–Sep1.50.53.0−150.0
Oct–Dec0.30.10.1−150.0
Table 6. Maximum (Max), median (Med), and minimum (Min) values of the simulated soil pressure head regime obtained with long-term modelling (2006–2015). Rainy periods were October–May, while dry periods were June–September.
Descriptive Statistical ParameterDepth2006200720082009201020112012201320142015
Max0.3 m−1.6−1.3−1.3−1.0−1.3−1.1−1.2−1.2−1.3−1.0Rainy period
Med−2.7−2.5−2.5−1.9−1.9−2.0−2.3−2.1−2.0−2.4
Min−5.8−16.3−6.0−4.3−4.2−7.1−8.1−7.5−4.1−7.0
Max0.5 m−1.7−1.3−1.5−1.0−1.2−1.0−1.2−1.1−1.3−0.9
Med−2.7−2.3−2.4−1.7−1.8−1.9−2.1−2.0−1.9−2.5
Min−5.0−14.1−8.3−3.7−4.5−6.8−12.9−7.4−3.9−16.3
Max2.2 m−1.6−0.9−1.0−0.6−0.7−0.7−0.8−0.8−0.7−0.5
Med−4.0−1.7−2.0−1.1−1.0−1.1−1.5−1.4−1.2−1.7
Min−17.6−5.9−4.8−3.7−4.2−4.2−5.3−4.3−3.8−5.9
Max0.3 m−2.9−2.6−1.4−2.3−3.0−1.7−3.6−2.0−2.8−4.1Dry period
Med−11.7−16.8−11.6−6.9−6.8−8.5−15.7−9.9−6.3−12.1
Min−14.4−17.4−13.0−8.5−12.0−11.4−16.9−11.3−10.8−17.0
Max0.5 m−3.7−2.7−1.7−2.9−3.2−1.8−3.2−2.0−3.0−3.6
Med−12.0−14.8−9.7−6.2−7.1−7.6−14.4−8.2−6.3−14.3
Min−13.6−16.3−11.3−7.2−10.8−10.1−16.0−9.7−9.6−16.1
Max2.2 m−2.2−1.5−1.6−1.6−1.5−1.3−1.5−1.4−1.4−1.6
Med−4.3−3.9−3.4−3.0−3.4−3.2−3.8−3.2−3.3−3.8
Min−5.6−5.2−4.5−3.8−4.2−4.0−4.9−4.1−3.9−4.9
Table 7. Index and shear strength parameters (cohesion and friction angle for effective stress) of the present-day soil used for slope stability analysis. Values derive from laboratory tests and bibliographic data [29]: c’—cohesion for effective stress, φ’—internal friction angle for effective stress, γdry—dry unit weight volume, γnat—natural unit weight volume, and γsat—saturated unit weight volume.
cφγdryγnatγsat
(kPa)(°)(kN/m3)(kN/m3)(kN/m3)
034.59.5810.4115.50

