Article

Evaluation of MOD16 Algorithm over Irrigated Rice Paddy Using Flux Tower Measurements in Southern Brazil

by
Vanessa de Arruda Souza
1,2,*,
Débora Regina Roberti
2,*,
Anderson Luis Ruhoff
3,
Tamíres Zimmer
2,
Daniela Santini Adamatti
3,
Luis Gustavo G. de Gonçalves
4,
Marcelo Bortoluzzi Diaz
2,
Rita de Cássia Marques Alves
1 and
Osvaldo L. L. de Moraes
2,5
1
Centro Estadual de Pesquisas em Sensoriamento Remoto e Meteorologia, Universidade Federal do Rio Grande do Sul (UFRGS), Porto Alegre 91501-970 RS, Brazil
2
Departamento de Física, Universidade Federal de Santa Maria (UFSM), Santa Maria 97105-900 RS, Brazil
3
Instituto de Pesquisas Hidráulicas, Universidade Federal do Rio Grande do Sul (UFRGS), Porto Alegre 91501-970 RS, Brazil
4
Centro de Previsão de Tempo e Estudos Climáticos (CPTEC), Instituto Nacional de Pesquisas Espaciais (INPE), Cachoeira Paulista 12630-000 SP, Brazil
5
Centro Nacional de Monitoramento e Alertas de Desastres Naturais (CEMADEN), Instituto Nacional de Pesquisas Espaciais (INPE), São José dos Campos 12247-016 SP, Brazil
*
Authors to whom correspondence should be addressed.
Water 2019, 11(9), 1911; https://doi.org/10.3390/w11091911
Submission received: 18 July 2019 / Revised: 28 August 2019 / Accepted: 6 September 2019 / Published: 13 September 2019
(This article belongs to the Section Hydrology)

Abstract

:
Evapotranspiration (ET) is an important component of the hydrological cycle. Understanding the ET process has become of fundamental importance given the scenario of global change and increasing water use, especially in the agricultural sector. Determining ET over large agricultural areas is a limiting factor due to observational data availability. In this regard, remote sensing data has been used to estimate ET. In this study, we evaluated the Moderate-Resolution Imaging Spectroradiometer (MODIS) land surface ET product estimates (hereafter MOD16 ET – MODIS Global Terrestrial Evapotranspiration Product) over two rice paddy areas in Southern Brazil, through the ET measured using the eddy covariance technique (hereafter EC). The energy balance components were evaluated during fallow and flooded seasons showing latent heat flux dominates in both seasons. The results showed that MOD16 ET underestimated EC measurements. Overall, the RMSE (root mean square error) ranged between 13.40 and 16.35 mm 8-day−1 and percent bias (PBIAS) ranged between −33.7% and −38.7%. We also assessed the ET (measured and estimated) main drivers, with EC yielding higher correlation against observed net radiation (Rn) and global radiation (Rg), followed by air temperature (Temp) and vapor pressure deficit (VPD), whilst MOD16 ET estimates yielded higher correlation against leaf area index (LAI) and fraction of photosynthetically active radiation (fPAR). The MOD16 algorithm was forced with meteorological measurements but the results did not improve as expected, suggesting a low sensitivity to meteorological inputs. Our results indicated when a water layer was present over the soil surface without vegetation (LAI around zero), the largest differences between EC measurements and MOD16 ET were found. In this period, the expected domain of soil evaporation was not observed in MOD16 ET physical processes partition, indicating the algorithm was not able to detect areas with high soil moisture. In general, the MOD16 ET product presented low accuracy when compared against experimental measurements over flooded rice paddy, suggesting more studies are necessary, in order to reduce uncertainties associated to the land cover conditions.

1. Introduction

The increasing competition for water associated to its scarcity is becoming a threat to sustainable development [1]. In a climate changing scenario associated with an increasing global water demand for cropland production, that currently accounts for approximately 70% of the world water consumption [2], water footprint quantification is fundamental to improve water management and mitigate future freshwater scarcity [3].
One of the most challenging issues in modern global agricultural management is the proper control of the amount of water made available for plantation. To efficiently determine how much water to apply in the crop requires the knowledge of the amount of water lost. The major natural processes involving water losses include evaporation from the surface and plant transpiration, also defined as evapotranspiration (ET). Therefore, a correct estimation of ET over irrigation-based areas is critical to improve productivity while reducing water use as well as to mitigate the impact of extreme events in agriculture, such as droughts [4]. Nevertheless, determining ET over large agricultural areas is a challenging task due to limited observational data availability. The eddy covariance (EC) is the state of art technique to estimate actual ET, but it is expensive and represents a region usually ranging from 100 to 1000 m of radius [5]. To overcome footprint limitations, remote sensing techniques have been largely used to estimate ET over large areas with high spatial and temporal resolution and high accuracy [6].
Currently, several models to estimate ET using remote sensing data are available, from local and regional scales (SEBAL [7], SEBS [8], METRIC [9], ALEXI [10]) to continental and global scales (MOD16 [11], ALEXI/DisALEXI [10], JPL-PT [12], GLEAM [13,14]), over a wide range of temporal scales. According to Biggs et al. [4] models can be classified in three different categories: (i) physical models based on vegetation indices and meteorological data, (ii) energy balance models based on land surface temperature and (iii) empirical/statistical models. Several studies were conducted to evaluate the accuracy of ET derived from remote sensing using different methods [15,16,17,18,19,20], showing an overall uncertainty between 10% to 30%, when compared to ET obtained by eddy covariance measurements or to water balance. A detailed discussion of remote sensing-based ET models can be found in Gowda et al. [21], Li et al. [22] and Biggs et al. [4].
A widely used algorithm to estimate ET at continental and global scale is MOD16 (MODIS Global Terrestrial Evapotranspiration Product). The algorithm was developed by Mu et al. [11] and Mu et al. [23] based on the Penman–Monteith equation, to monitor temporal and spatial variability of ET over global land surface areas. The algorithm combines MODIS (Moderate-Resolution Imaging Spectroradiometer) 8-day and 16-day remotely sensed inputs for vegetation representation and daily Modern-Era Retrospective analysis for Research and Applications (MERRA) meteorological reanalysis data. Most of the experimental data used for calibration and validation were obtained from sites over North America (AmeriFlux and FluxNet) between 2000 and 2010 [23]. Independent validation of MOD16 ET estimation, often performed using ET obtained by eddy covariance measurements [24], have been carried out in several land cover and climatological conditions around the world. High correlations were yielded for grassland in the United Kingdom [25]; for forests in arid and polar regions in Asia [26]; for cropland and grassland in Europe [18]. Nevertheless, several authors have found moderate to low correlations for forests [18,27,28], woodland savannas [15,18], arid and semi-arid regions in the United States [29]. Only a few studies have assessed the accuracy of MOD16 ET algorithm over irrigated agricultural areas, usually focusing on rainfed cropland [4,30]. Tang et al. [28] perform a study on maize, wheat and cotton over an irrigated area, finding an underestimation of MOD16 for several crops. Hu et al. [18] assess the MOD16 algorithm performance on wheat and barley croplands, finding reasonable results for Europe. Kim et al. [26] validate the MOD16 over two (irrigated) rice paddy sites, concluding that at one site ET was underestimated whereas at the other site ET was overestimated. Biggs et al. [4] highlighted that, despite being recommended mainly for rainfed systems and areas where vegetation cover is high, MOD16 ET algorithm needs further assessment in irrigated cropland areas with high soil evaporation.
The accuracy of MOD16 ET estimates depends mainly on factors related to the model structure and its parameterization and accuracy of input data [31,32]. The Penman–Monteith equation is known for its robust framework for ET estimation because (i) it involves the main drivers of evapotranspiration; (ii) it provides an energy constraint on the evaporation rate and (iii) estimated ET fluxes are not exceedingly sensitive to any of the inputs [33]. Despite its strong theoretical basis, the Penman–Monteith equation application at larger spatial scales is hindered by micrometeorological data requirements, which are difficult to obtain over large areas [33], and by issues of scale and footprint [34].
To ensure water security and to enhance the ability to simulate hydrological and climate feedbacks in a climate change scenario, there is a need to represent ET with high precision and accuracy, improving differentiation of water use and water stress among different crops, species and ecosystems [6]. Furthermore, Baldocchi et al. [35] highlight that long-term research of energy and water fluxes over flooded rice paddy, using eddy covariance measurements, are needed to understand ET patterns and to improve water management practices. In the context of this research, the main goal was to address the question of what drivers control the ET process, performing an assessment of surface observed data and remotely sensed data, over flooded areas. To perform this evaluation, we conducted an analysis using ET obtained by EC data: (1) evaluation of the energy partitioning between latent (LE) and sensible (H) heat fluxes; (2) assessment of the seasonal evaporative fraction (Λ) pattern during fallow and flooded rice paddy cycle; and (3) assessment of the main control drivers of ET. We also sought to assess whether global ET models, specifically the MOD16 algorithm, can physically reproduce this pattern and estimate accurately ET over flooded areas. Our analysis focused on: (4) validation of MOD16 ET estimates using EC measurements during flooded and non-flooded periods; (5) evaluation of control drivers in MOD16 ET estimation; (6) comparison between MOD16 ET estimates against observed meteorological variables to address whether the algorithm can reproduce the physical process of ET; and (7) analysis of residual errors attributed to meteorological reanalysis inputs.

2. Materials and Methods

2.1. Site Description

Brazil is one of the top ten worldwide rice producers, with approximately 12.5 million tons per year and an average production of 5424 kg ha−1 and Rio Grande do Sul State, located in Southern Brazil, is responsible for more than 77% of Brazilian rice production [36]. In Rio Grande do Sul, rice production occurs generally in natural flooded regions due to its large water consumption [37]. The rice paddies are cultivated once a year, during spring and summer seasons, with soil remaining in fallow for the rest of the year. Atmospheric datasets collected from two rice paddy sites located in Rio Grande do Sul State, Brazil, were used in this research (Figure 1). An experimental site was located in Paraíso do Sul city (PRS), at 29°44′39.6″ S and 53°8′59.8″ W, altitude of 108 m (hereafter PRS site), in an area rice paddy of approximately 50 hectares (ha), with wind direction predominantly from the southeast. An experimental site was located in Cachoeira do Sul city (CAS), at 30°16′37.59″ S and 53°8′52.25″ W, altitude of 40.5 m (hereafter CAS site) in an area of approximately 1000 hectares, with wind direction predominantly from the east. In both sites, rice paddies are cultivated over large lowland areas (floodplains), using a flooding irrigation system. After rice harvesting, soil remains with spontaneous vegetation (fallow period), without crop rotation. The experimental sites are around 60 km apart.
The climate in the region is classified, according to Köppen climate classification, as humid subtropical climate (Cfa), with hot summer and without dry season (daily mean temperature greater than 22 °C) [38]. The climatological precipitation for Cachoeira do Sul is 1477.1 mm year−1 (1961–1990 according to Brazilian National Meteorological Service (INMET) in http://www.inmet.gov.br/portal/index.php?r=clima/normaisClimatologicas). The precipitation is distributed throughout the year between 83 and 157 mm by month. There is no registration of climatological precipitation for Paraíso do Sul. The land use and land cover in the study areas are dominated by grassland and evergreen broadleaf forest, whilst cropland areas (cultivated with flooded rice paddy) are mosaicked with natural vegetation. The soil type at PRS is silt loam and in CAS is sandy clay loam, both typical flooded soil where rice is grown in Rio Grande do Sul state. More details about physical properties of the soil at the experimental sites are described in Timm et al. [37] for PRS and in Diaz et al. [39] for CAS.
The period of analysis for the PRS experimental site was from July 2003 to July 2004. Rice was cultivated at the end of November 2003 and harvested at the beginning of April 2004. The measurements for the CAS experimental site span from January 2011 to December 2014. Rice was cultivated between October and November and harvested between March and April from the next year. The field was flooded until harvest, to a depth of 0.1 m. The PRS site was flooded around 30 days after seeding, while the CAS site was flooded around 30 days before seeding. During the other periods of the year, the areas were maintained in fallow and the soil remained near saturation throughout the time due to high precipitation rates.

2.2. Meteorological and Flux Tower Measurements

During the period of this study, the PRS and CAS experimental sites were equipped with flux towers measuring atmospheric variables and surface fluxes. Air temperature, wind speed components and H2O concentration were measured in high frequency to compute the vertical fluxes obtained by the EC technique. The PRS and CAS flux towers were equipped the sensors described in Table 1. Further details are described in References [37,39,40,41].
We filled the missing values of air temperature and global radiation. At PRS, data gaps were shorter than three successive hours and a simple linear interpolation was used to fill missing data. CAS site gap-filling was performed using a linear regression scheme based on meteorological measurements at a nearby station (World Meteorological Organization, WMO 86977), from the INMET. The station is located approximately 80 km from the CAS site. Climatological precipitation for both sites was obtained from INMET estimates (http://www.inmet.gov.br/).
In addition to meteorological and surface flux measurements, leaf area index (LAI) was also measured at the CAS site. LAI was measured at approximately every two weeks, for the 2010–2011 and 2011–2012 growing season using LI-3000A (LI-COR Inc., Lincoln, Nebraska) and 2014–2015 growing season using LAI-2200C Plant Canopy Analyzer (LI-COR Inc., Lincoln, Nebraska). All instruments were factory calibrated and measurements were conducted at 9:00 a.m. LAI measurements were used to evaluate and validate MOD15 estimation. The MOD15 product was used as forcing data to run the MOD16 algorithm. MOD15 validation results are presented in Figure S1.

2.3. ET Experimental Data Processing

The experimental latent heat flux (LE) was computed from EC measurements. The EC technique estimated surface fluxes using the covariance between vertical wind speed measurements and H2O (or air temperature) concentration in the atmosphere to compute LE fluxes (or sensible heat flux (H)). The EddyPro Advanced software (version 5.1, LI-COR) was used to process the flux data over half-hourly time scales. Further details of the configurations used are described in References [39,42].
The footprint of the EC was calculated using the software EddyPro Advanced according to the methodology proposed by Kljun et al. [43]. The fetch was approximately 470 m for PRS and 200 m for CAS in all directions. The flux towers were located in flat terrains with homogeneous surface for both sites, however the footprint analyses were not necessary to filter any flux data. LE and H were filtered in periods that presented physically inconsistent data [44], i.e., LE < −50 W m−2 and LE > 650 W m−2, H < −70 W m−2 and H > 300 W m−2 were removed from the analysis. During the night period, LE > 100 W m−2 was also removed. During precipitation periods, LE and H values were excluded. After data filtering, which also included malfunctioning periods, total LE data gaps accounted for 30.1% and 29.15%, for PRS and CAS sites, respectively. These percentages of gaps were similar to those found in others studies conducted in rice paddies [37,45,46]. Gap filling for H and LE missing data was performed through the REddyProc package available in RStudio software, using the following entry data: LE, H, air temperature (Temp), global radiation ( R g ). This package was developed using methods proposed by Reichstein et al. [47], further details are also described in Wutzler et al. [48].
Several studies show the imbalance between turbulent fluxes (H + LE) and available energy ( R n G; where R n is defined as net radiation and G is the soil heat flux) [35,37,42,49,50]. Many authors suggest the necessity of adjustment in the values of H and LE [51,52,53,54]. The energy balance closure can be forced using the Bowen ratio ( β ) technique, defined as β = H / L E . The residual available energy (RAE = R n H L E G ) is then distributed between H and LE to close the energy balance, using the following equations (according to Twine et al. [52]):
H = β ( R n G ) 1 +   β ,
L E = R n G 1 +   β .
For the PRS site, G was estimated through the sum of ground heat flux (Fg) and heat storage in the soil and water layer (ΔG). In this work, ΔG was estimated according to Timm et al. [37] using:
Δ G =   c s Δ T 5 d z s d t + c a Δ T 2 d z a d t
where cs is the volumetric heat capacity of soil (3.03 × 10⁶ J m−3 °C−1) and ca is the volumetric heat capacity of water (4.186 × 10⁶ J m−3 °C−1), ∆T5 and ∆T2 are the soil temperature variation at depth of 0.05 m and 0.02 m, respectively, dt is the time step; dzs is the soil layer above the soil temperature sensor and dza is the water layer. The heat storage in the water layer was calculated only for the flooded period. The values of Fg and ΔG represent 1.15% and 0.19% of the total R n , respectively, for the PRS site. For the CAS site, Fg and ΔG were not available. However, we estimated G for CAS, using a linear regression between G and Rn based on data from the PRS site, according to the following equation:
G = 0.19 × R n 17 .
To evaluate the energy partitioning between LE and H during flooded and fallow (non-flooded) periods, we also computed the evaporative fraction (Λ), defined as the amount of available energy used for evapotranspiration [55], according to the equation:
Λ = L E R n G .

2.4. MOD16 Global Evapotranspiration Algorithm

2.4.1. MOD16 Algorithm Structure

Several techniques using remote images have been developed to estimate ET rate over large areas. MOD16 algorithm was developed to estimate land surface ET [23,56,57], based on MODIS remotely sensed compositions and MERRA meteorological reanalysis data. This methodology was adapted from Cleugh et al. [33] using a Penman–Monteith approach to estimate LE. ET is given by the sum of soil evaporation ( λ Es), canopy evaporation ( λ Ec) and canopy transpiration ( λ Tc), according to the equation:
ET = λ E S + λ E C + λ T C .
Estimation of λ Es, λ Ec and λ Tc is given by Equations (7)–(9), respectively [23]:
λ E S = f w Δ × A s + ( 1 f c ) × ρ a × C P × ( e s e a ) r a s Δ + γ × r s s r a s + R H ( e s e a ) β s m ( 1 f w ) Δ × A s + ( 1 f c ) × ρ a × C P × ( e s e a ) r a s Δ + γ × r s s r a s ,
λ E c = f w Δ × A c + f c × ρ a × C P × ( e s e a ) r a w c Δ + γ × r s w c r a w c ,
λ T c = ( 1 f w ) Δ × A c + f c × ρ a × C P × ( e s e a ) r a t Δ + γ × ( 1 + r s t r a t ) ,
where Δ (Pa K−1) is the gradient of the saturation vapor pressure–temperature; fc is the vegetation cover fraction; A s and A c (W m−2) are the available energy to the soil and canopy, respectively (as A c = ( f c × R n ) and A s = ( 1 f c ) × ( R n G ) ); C P (J Kg−1 K−1) is the specific heat of the air, ( e s e a ) is the vapor pressure deficit (VPD, in Pa); γ (Pa K−1) is the psychrometric constant; β s m is a parameter related to the soil moisture constraint ( β s m = 200 [23,58]); r s s and r a s (s m−1) are the surface and aerodynamic resistance for the soil surface; r s w c and r a w c (s m−1) are the surface and aerodynamic resistance for the wet canopy evaporation and r s t and r a t (s m−1) are the surface and aerodynamic resistance for the canopy transpiration; fw is wet surface fraction, calculated as a function of ea (when relative humidity (RH, in %) is higher than 70%, with f w = R H 4 [23]), representing the fraction of canopy and soil covered by water.
The MOD16 final products provided averages of 8-day, monthly and annual potential and actual LE and ET, with spatial resolution of 1 km. MOD16 ET estimates are freely available at http://www.ntsg.umt.edu/project/mod16 and at https://search.earthdata.nasa.gov/.

2.4.2. MODIS Remotely-Sensed Inputs

MODIS 8-day and 16-day compositions, 500 m and 1 km spatial resolution, were used as MOD16 inputs: MOD15A2 LAI and fraction of photosynthetically active radiation (fPAR) [59] and combined Aqua & Terra Products: MCD43B2/B3 albedo [60] and MCD12Q1 land cover [61]. MOD15A2 [62] consists of an 8-day composite, where LAI and fPAR values are retrieved by an algorithm based on the radiative transfer process (RT). MCD43B2/B3 consists of a 16-day composition and it is used to estimate the reflected solar radiation. For both LAI/fPAR and albedo, unreliable pixels were replaced by the closest reliable pixels, using a linear interpolation technique proposed by Zhao et al. [63]. Although MOD16 relies on LAI/fPAR and albedo derived from MODIS compositions to estimate land surface ET, the evaluated algorithm is heavily dependent on land cover parameterization through the use of a Biome-Properties Look-up Table (BPLUT) related to a 14 classes land cover classification scheme (Land Cover Type 2 in the MCD12Q1 data). MCD12Q1 has an accuracy around 75%, but the range in class-specific accuracies is large (between 22.6% and 99.3% when considered errors of producer (commission) and user (omission) errors) [61]. MODIS subsets (MOD15, MCD43 and MCD12) are freely available at https://modis.ornl.gov/ and at https://search.earthdata.nasa.gov/.

2.4.3. Global Modeling and Assimilation Office (GMAO) MERRA Meteorological Reanalysis Inputs

As meteorological inputs, the current MOD16 version uses Global Modeling and Assimilation Office (GMAO) Modern-Era Retrospective analysis for Research and Applications (MERRA), with spatial resolution of 0.5° × 0.6°. Meteorological reanalysis inputs include daily total downward shortwave radiation (also defined as global radiation) (Rs), daily average air temperature (Tavg), daytime average air temperature (Tday), daily minimum air temperature (Tmin) and specific humidity (q). To combine meteorological and remote sensing inputs, meteorological reanalysis data were interpolated from spatial resolution of 0.5° × 0.6° to 1 × 1 km to match the spatial resolution of MODIS pixels and to remove abrupt changes from the meteorological reanalysis data, using a fourth power cosine function proposed by Zhao et al. [63]. The VPD based on MERRA reanalysis data (VPDMERRA) was computed as described by Mu et al. [56] and Running et al. [57].

2.5. Statistical Analysis

To evaluate and compare MOD16 ET estimates and EC measurements, we aggregated the 30-min and daily data to 8-day averages, corresponding to the MOD16 intervals. The following statistical metrics were used:
Pearson’s correlation
r = ( EC i EC ¯ ) ( ET MODIS i ET MODIS ¯ ) ( ( EC i EC ¯ ) 2 ) ( ( ET MODIS i ET MODIS ¯ ) 2 ) ,
root mean square error
RMSE = ( EC ET MODIS ) 2 n ,
Bias
bias = ( ET MODIS EC ) n ,
Percent bias
PBIAS = bias ( 1 n ) EC × 100 ,
where EC is the ET measurement obtained by the eddy covariance technique, ETMODIS is the MOD16 ET estimation and n is the number of samples. For Pearson’s correlation, we considered r ≤ 0.4 a low correlation, 0.4 < r ≤ 0.7 a moderate correlation and r > 0.7 a high correlation.

3. Results and Discussion

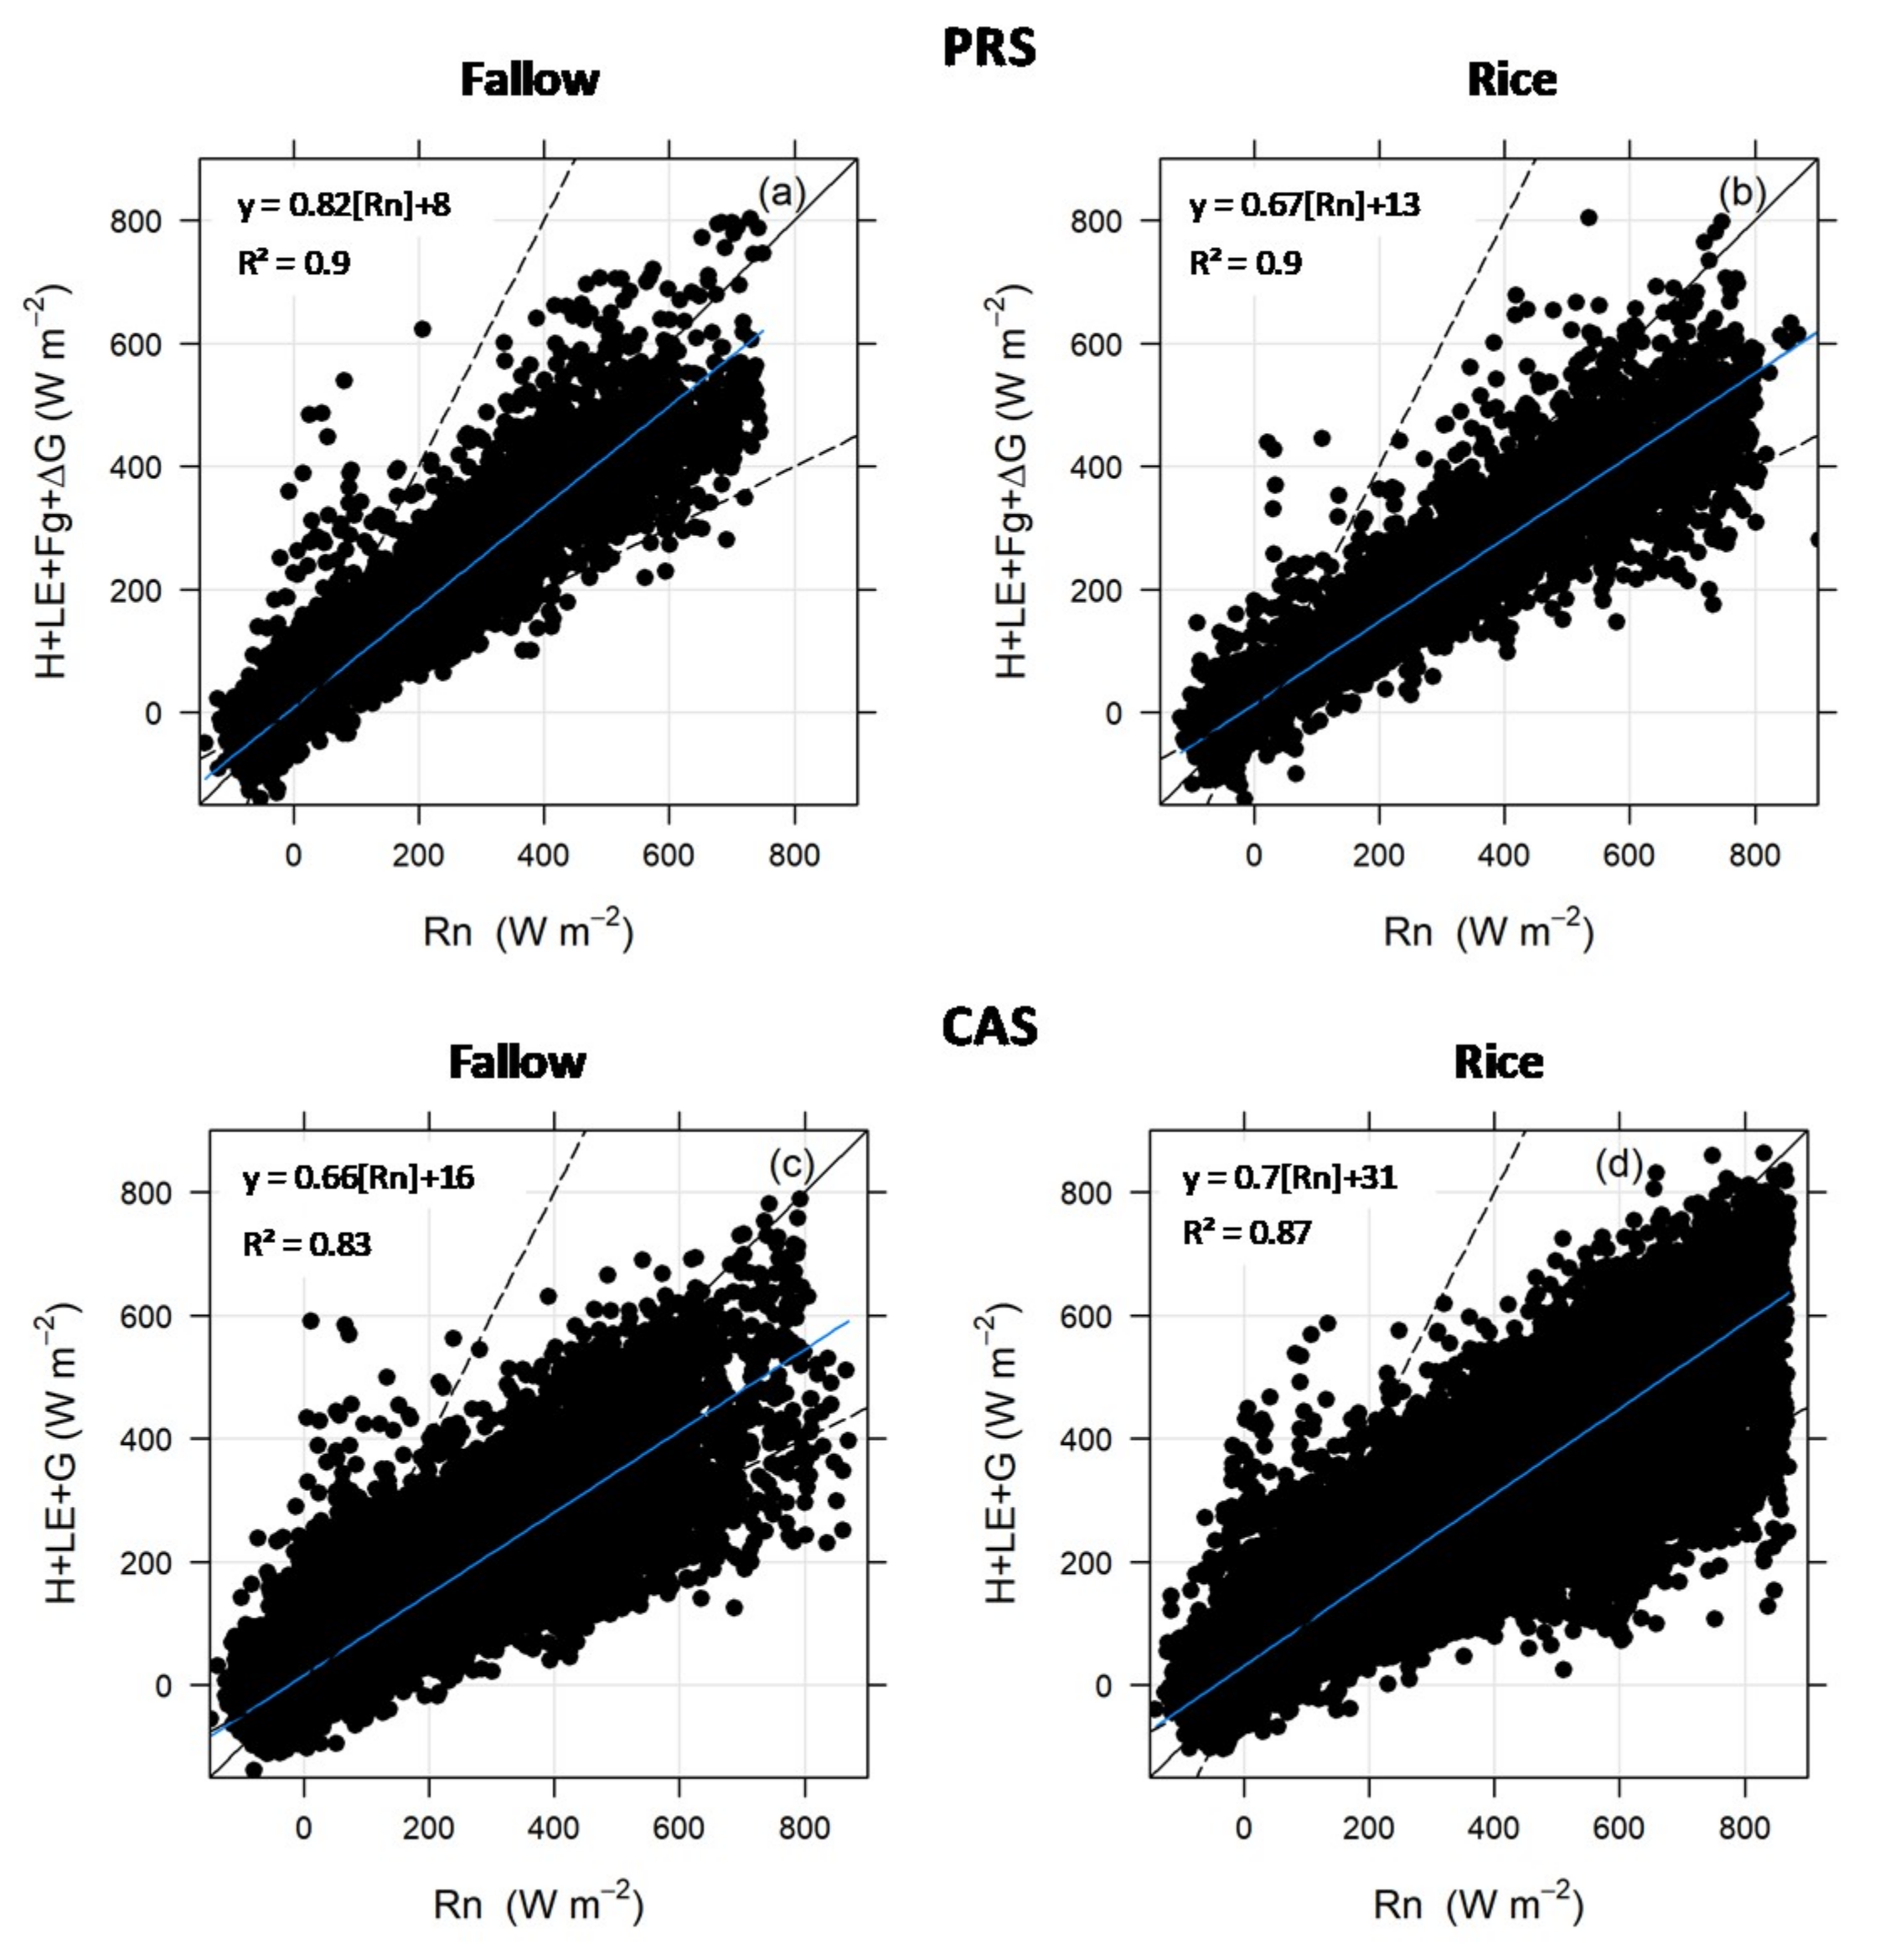
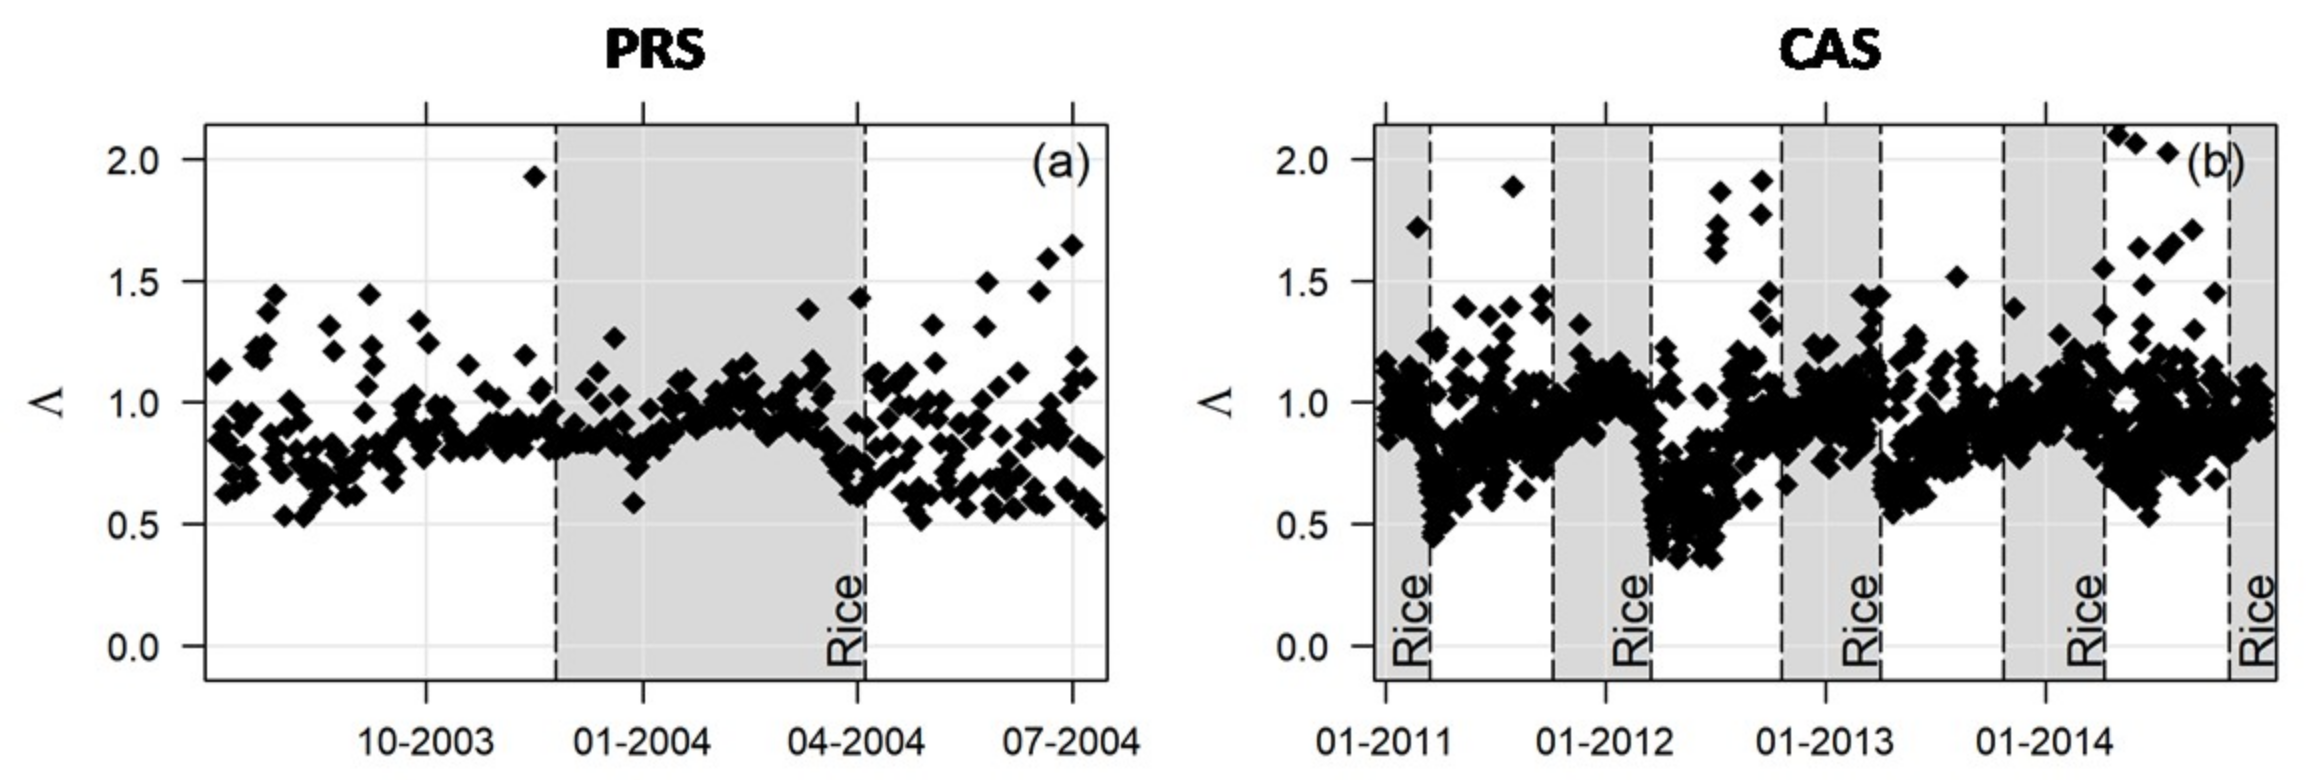
3.1. Energy Balance Analysis

Since the EC technique provides a direct measurement of LE and there is a well-documented missing energy or an energy balance closure “error”, with the turbulent fluxes (H + LE) being typically less than the 10%–30% of the available energy ( R n G ) [51,64], we evaluated the average energy balance components ( R n = H + L E + F g + Δ G , where G = F g + Δ G ) during fallow (harvest to the subsequent planting) and flooded seasons (planting to harvest) (Figure 2). At the PRS site we used measured Rn, H, LE, Fg and calculated ∆G (Equation (3)), whilst at the CAS site we used measured Rn, H and LE and estimated G (according to Equation (4)). During both flooded and fallow seasons, the energy balance closure yielded an r of 0.95 at the PRS site. On the other hand, at the CAS site, the energy balance closure yielded an r of 0.91 during the fallow season and 0.93 during the flooded season. Ikawa et al. [65] find an r value for the interannual energy balance closure between 0.85 and 0.94 over 13 years of EC measurements in irrigated crops. According to Timm et al. [37] when ∆G is not included in the energy balance analysis, lower r coefficients are typically found, suggesting that the lower energy balance closure is due to uncertainties in the estimate of heat storage capacity, especially during the irrigation season and changes in water temperature measured in a single depth [66].
The average daily values of the energy balance components (without energy balance closure) during fallow and flooded seasons are presented in Table 2. We found Rn values of 146.16 and 146.08 W m−2 for the PRS and CAS sites during flooded season, with LE values corresponding to 62% and 81% of Rn, respectively. During fallow season, we found Rn values of 67.62 and 59.84 W m−2 for the PRS and CAS sites, with LE values close to 79% and 84% of Rn, respectively. H represented 6.9% to 2.0% of Rn during irrigation season and 14.8% to 18.0% of Rn during fallow season, for PRS and CAS, respectively. The ground heat flux ( F g + Δ G ) was negative for both sites during fallow season (almost zero at PRS), representing −0.5% and −9.4% of Rn at PRS and CAS, respectively, whilst during irrigation season the ground heat flux was positive, with 3.1% and 7.3% of Rn at PRS and CAS, respectively. In general, PRS and CAS present similar behavior on the energy balance components. A detailed discussion about the energy partitioning over rice paddy, using the PRS dataset, is described in Timm et al. [37] and using the CAS dataset, is described in Diaz et al. [39].
Several studies investigate the energy partitioning and the energy balance closure problem [37,50,51,67], despite considerable uncertainties in irrigated crops, such as rice [68,69,70]. RAE represented approximately 7% of Rn during fallow season (for both sites) and 23.6% and 9.2% of Rn during flooded season for PRS and CAS, respectively. Baldocchi et al. [35] also find a difference up to 15% of RAE for interannual measurements over flooded rice.
After the energy balance closing at daily timescale, we estimated daily Λ, that presented high values, with 0.92 and 0.98 at PRS and CAS sites, respectively, during irrigation season. It indicated that almost all energy was converted to LE, reflecting high water availability and rice canopies fully developed. During fallow season, Λ decreased to 0.87 and 0.86 at the PRS and CAS sites, respectively, with a higher standard-deviation (approximately 0.22, compared to 0.13 during the irrigation season). Kar and Kumar [71] find Λ values ranging from 0.6 to 1.0 for irrigated rice crops, indicating that as rice crop emerges, and until reaching full development, the main energy partitioning driver is LAI, causing a decrease in soil evaporation and an increase in plant transpiration. Bouman et al. [72] find an increase of Λ during crop-growing season and a decreasing trend during leaf senescence and crop maturation (before harvesting). The seasonal variation of daily Λ at PRS and CAS sites is shown in Figure 3, where it can be seen that higher values were concentrated in rice growing season. In fallow season, daily Λ values increased from harvest until new growing season. This fact can be attributed to the seasonality of climatic conditions.

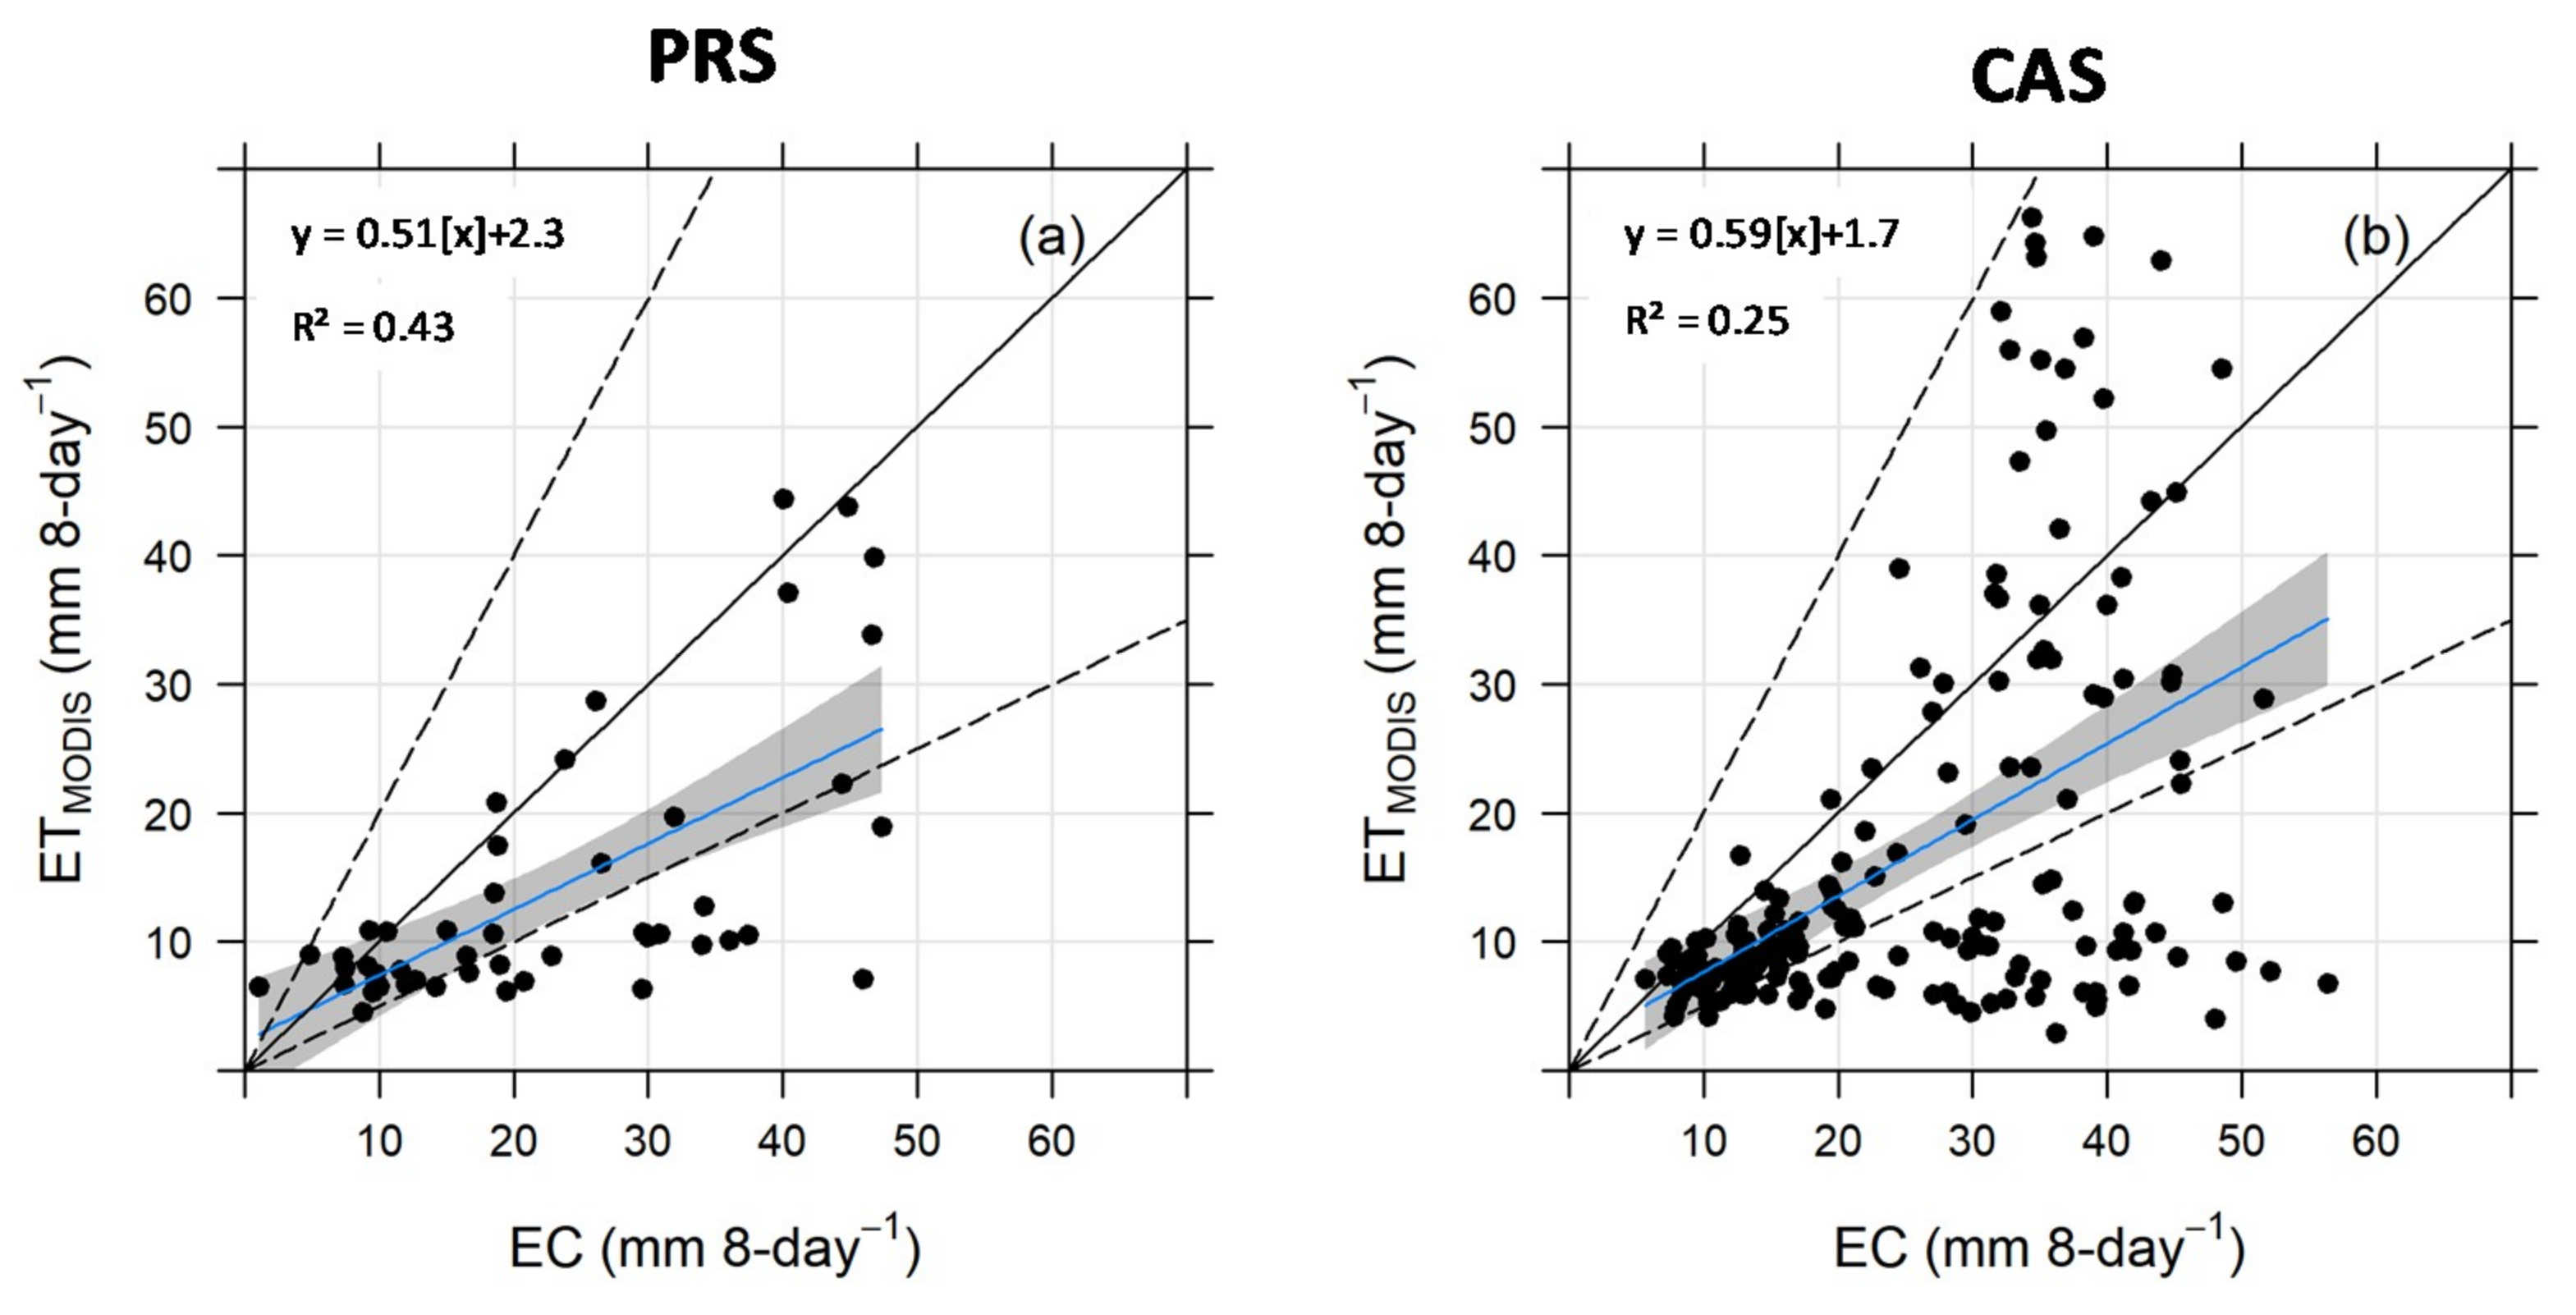
3.2. Comparison between MOD16 Evapotranspiration Estimates and Eddy Covariance Measurements

In this section, we evaluate the accuracy of MOD16 ET estimates against EC measurements (here we included the RAE partitioned between H and LE measurements) at the two flux towers sites over rice paddy areas. The performance of MOD16 (ETMODIS) was assessed at the pixel within the same location of the flux tower, with results presented in Table 3 and Figure 4a,b. When computing the correlation between EC measurements and MOD16 ET estimates, we found r values of 0.65 and 0.50, respectively, at the PRS and CAS sites. At the CAS site, the highest correlations and the lowest errors were observed during 2011 and 2012 (with r close to 0.63 for both years, RMSE between 13.55 and 14.22 mm 8-day−1). On the other hand, during 2013 and 2014, we found lower correlations and higher errors, with RMSE between 17.83 and 19.12 mm 8-day−1. Bias and PBIAS showed negative values, resulting in an overall underestimation of MOD16 ET over flooded rice paddy, for all evaluated periods at both sites. At the PRS site, MOD16 ET was underestimated by 8.77 8-day−1 resulting in PBIAS value of −38.7. Similar statistics were found at the CAS site for the 2011–2014 period and for each growing season.
The evaluation of MOD16 ET was also performed separately for fallow and flooded (rice growing) seasons (Table 3), with no correlation observed in rice growing season at the CAS site (r ≈ 0) and low correlations for the PRS site. Moderate correlation was found during the fallow season for both sites. At both sites, RMSE and bias increased from fallow to flooded season, on the other hand PBIAS decreased. During the beginning of the crop growing season, the pixels may present a spectral mixture related to land cover (vegetation) and large amount of water in soil background, compromising the accuracy of ET estimates obtained from remote sensing. This sub-pixel mixture may lead to inaccuracies in fPAR and albedo estimates, used as input parameters to MOD16 ET algorithm. This problem is reported by Kim et al. [26] when validating MOD16 estimates for different land cover classes in Asia.
The annual accumulated EC measurements and MOD16 ET estimates at the PRS and CAS sites are presented in Table 4. The MOD16 ET underestimation values ranged from 212.6 mm year−1 to 452.3 mm year-1, representing 20.7% and 43% of the EC. These results and the statistical analyses (Table 3) indicated a poor relationship between MOD16 ET estimates and EC measurements over rice paddy in Southern Brazil. The validation of MODIS ET estimates over the rice paddy sites, showed several discrepancies when compared to the EC measurements, mainly underestimating ET. Kim et al. [26] validate MOD16 in two rice paddy sites, reporting overestimation in the site located in South Korea, and underestimation in the site located in Japan, with RMSE of 6.12 and 10.69 mm 8-day−1, respectively. Khan et al. [73] assess MOD16 algorithm performance in nine EC sites in Asia, finding RMSE between 6.71 and 10.16 mm 8-day−1 over three irrigated rice sites. Overall, the r and RMSE values for the rice paddy in Southern Brazil were, in magnitude, similar or larger than those found in the reported studies. However, in this region, rice production occurs once a year, a timeline differing from the practice in Asia, where twice a year the rice is cultivated.
Several authors also evaluate MOD16 around the globe. Hu et al. [18] validated MOD16 ET product over Europe, finding a mean RMSE value of 0.76 mm day−1 (≈ 6 mm 8-day−1) and bias ranging from −0.93 to 1.11 mm day−1 with an average value of 2 mm 8-day−1. For arid regions, Ramoelo et al. [15] validate MOD16 ET in South Africa, yielding r values between 0.51 to 0.93 and RMSE lower than 9 mm 8-day−1 when compared to EC measurements. Meanwhile, Velpuri et al. [29] find monthly r values ranging from 0.40 to 0.77 and RMSE of 29.5 mm month−1 (representing an error of approximately 8 mm 8-day−1). Therefore, the MOD16 ET for dry regions is better related to EC than in wet regions, represented here for flooded areas used for rice paddy.
Despite uncertainties related to the algorithm structure and inputs, there was also uncertainty related to spatial resolution. A single MODIS pixel can represent multiple land cover conditions, whilst reanalysis data with coarse spatial resolution was not able to represent micrometeorological processes at smaller scales [30,74]. The mismatch between eddy covariance measurements and coarse spatial resolution from remote sensing data could introduce large errors, reducing ET up to 15% at large scale and 50% at pixel scale when compared to higher resolution estimates [75] due to losses on surface heterogeneity to compute surface fluxes. Therefore, lower spatial resolution can result in an increased likelihood of discrepancies between estimated and measured fluxes [76].

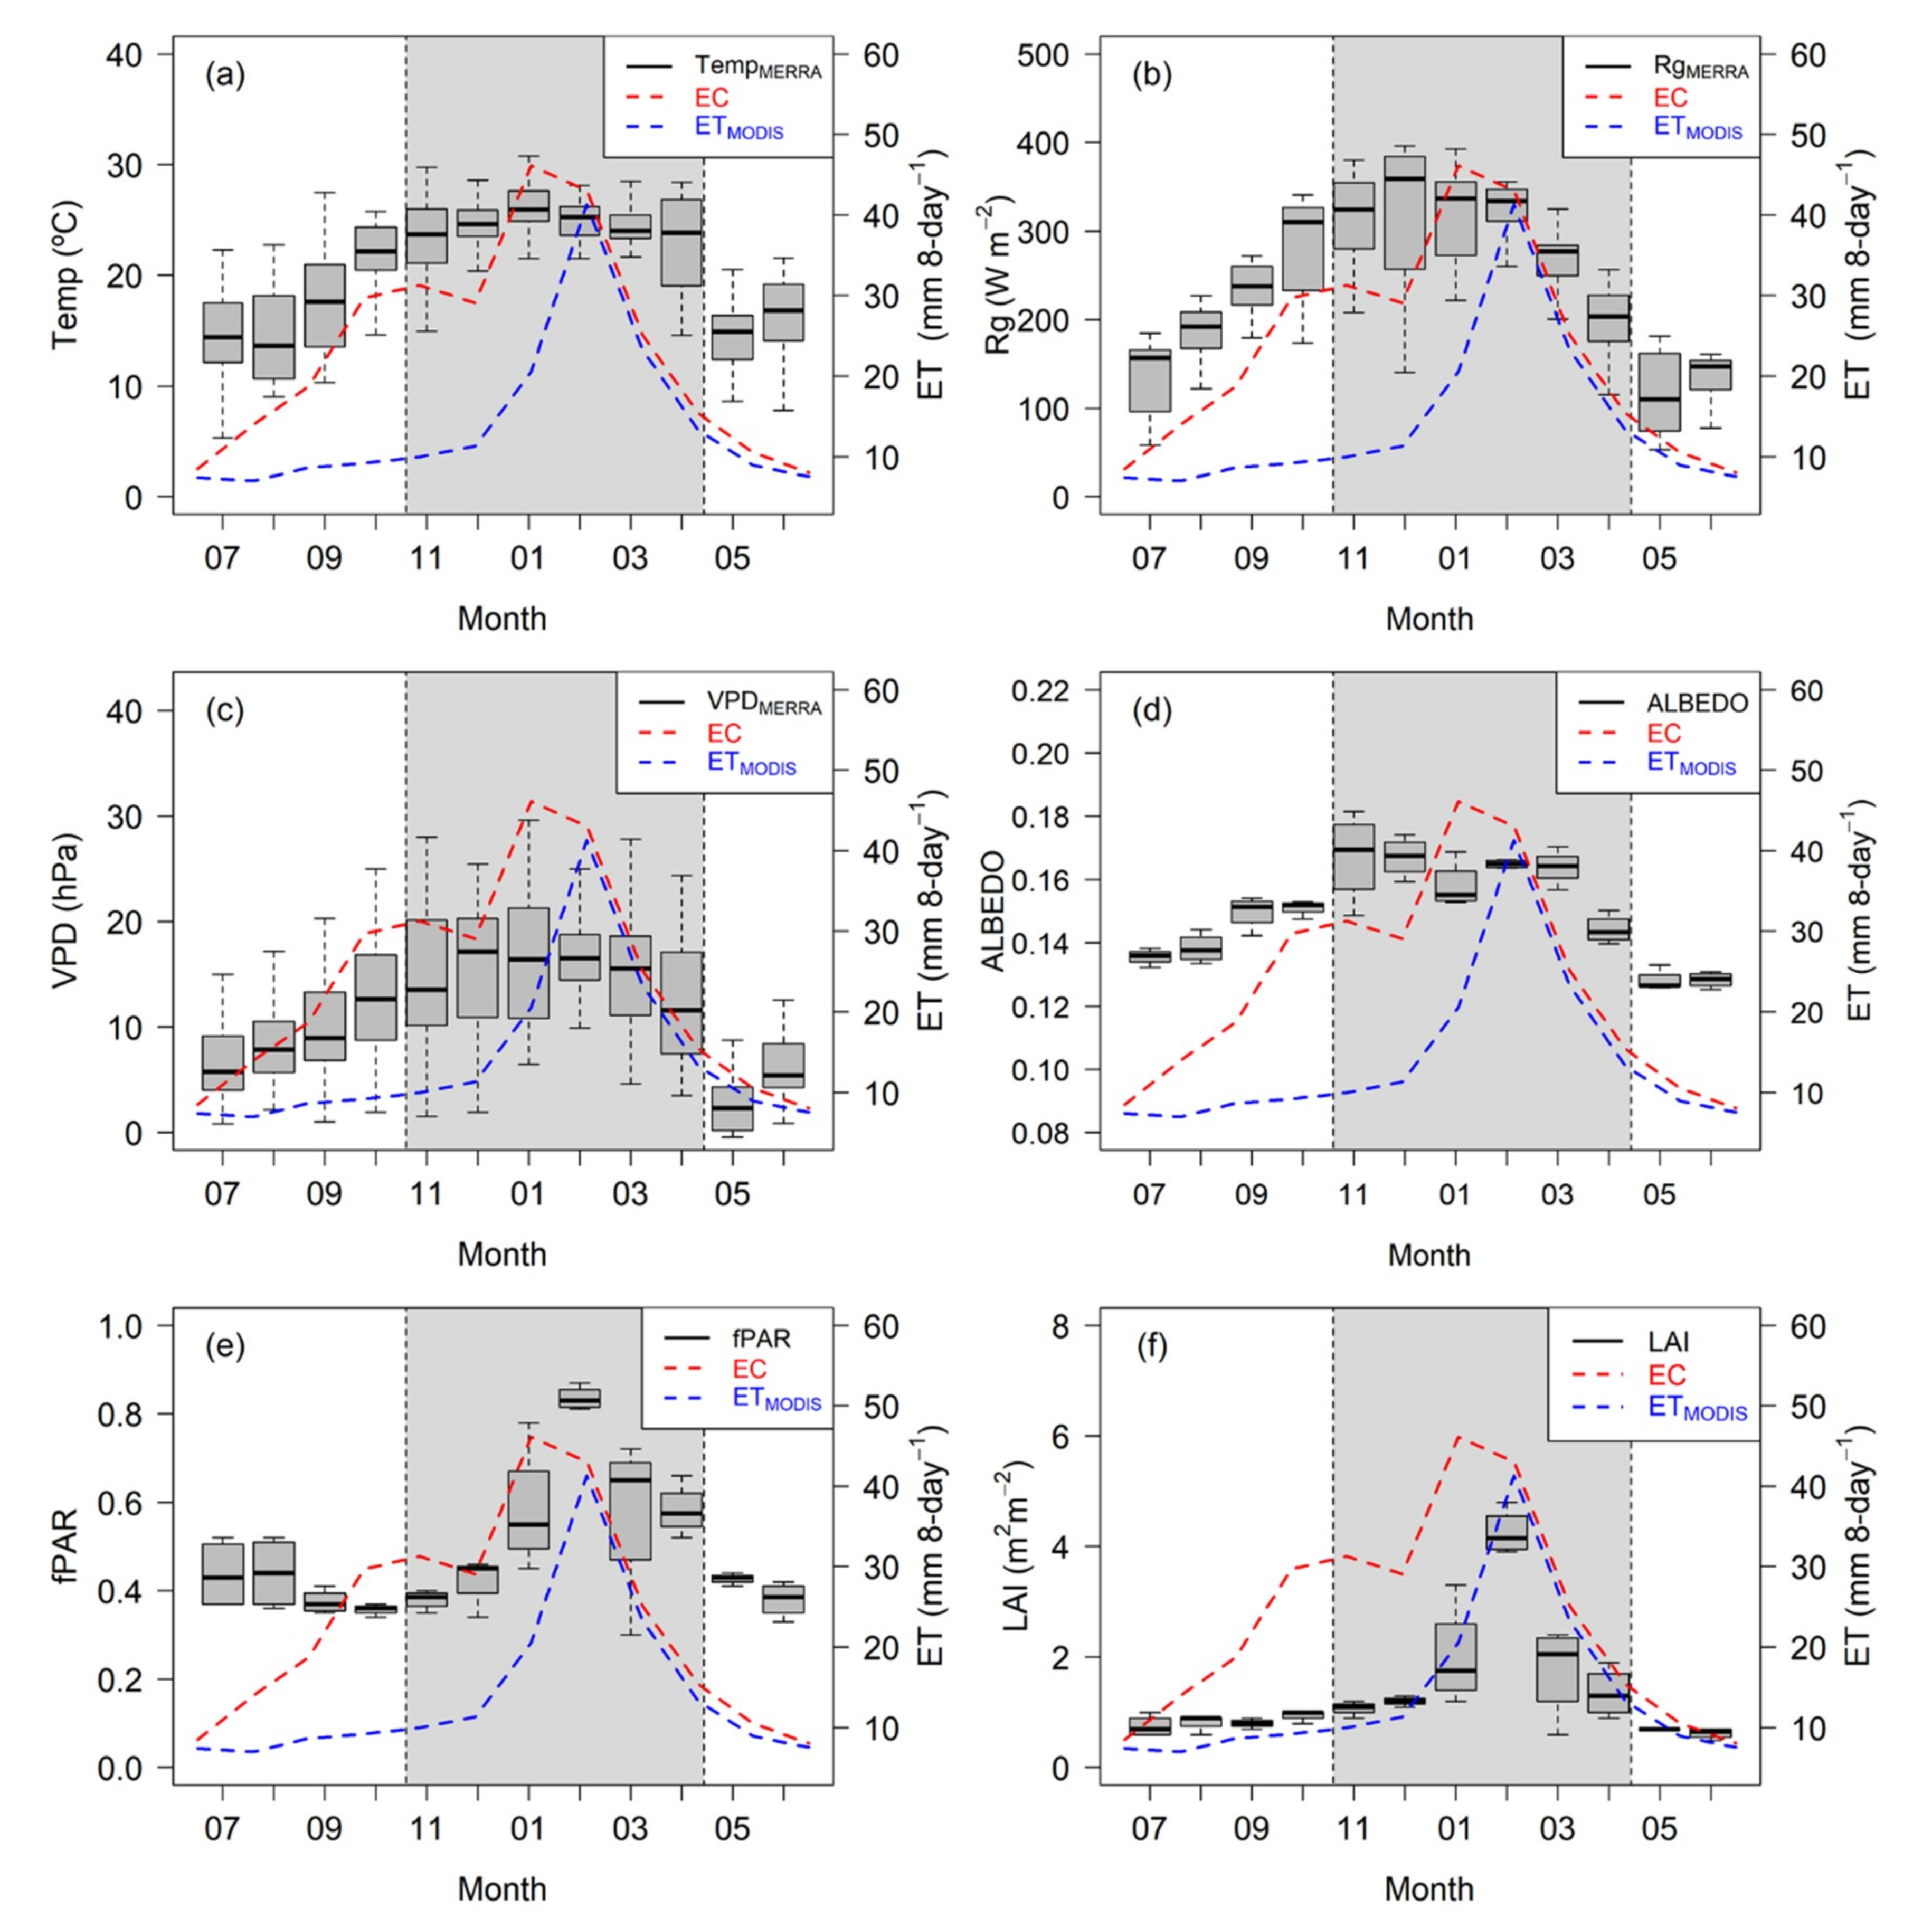
3.3. Seasonality and Climatic Drivers of Evapotranspiration

To evaluate MOD16 ET control drivers, we evaluated the cross-correlation between EC measurements, MOD16 ET estimates, measured environmental variables (Temp, R g and VPD) and MOD16 ET algorithms inputs (LAI, fPAR, and albedo from MODIS datasets and air temperature (TempMERRA), global radiation ( R g M E R R A ) and vapor pressure deficit (VPDMERRA) derived from MERRA reanalysis). The full cross-correlation is presented in Table 5. Measured environmental variables ( R g , VPD and Temp) were well correlated with EC measurements at both sites, whilst remote sensing variables (LAI, albedo and fPAR) were less correlated with EC measurements. For instance, when compared to EC measurements, R g and R n yielded correlations higher than 0.91, Temp yielded correlations higher than 0.77 and VPD yielded correlations higher than 0.65. In contrast, remote sensing estimates showed moderate to low correlations, with LAI and albedo yielding correlations between 0.37 and 0.74, respectively. Similar results were found by Fang et al. [24] for different land cover types. Our results revealed that the main drivers of measured ET were radiation, followed by Temp and VPD, with LAI showing a secondary role in measured ET. On the other hand, for MOD16 ET estimates, the main drivers were LAI and fPAR, yielding correlations higher than 0.88 for LAI and 0.80 for fPAR, with meteorological reanalysis data playing a secondary role in MOD16 algorithm.
To assess MERRA reanalysis accuracy, we compared surface meteorological data used as MOD16 inputs against observed meteorological data. A full detail of MERRA reanalysis validation is presented in Tables S1 and S2. All three MERRA reanalysis (Temp, R g and VPD) variables were overestimated at daily time steps. Temp and R g presented high accuracy, with PBIAS lower than 6.7% and 16.2% and r values higher than 0.95 and 0.87, respectively. On the other hand, VPD showed higher PBIAS (ranging from 69% to 87%) and moderate r (with values lower than 0.78), possibly related to the spatial resolution of the MERRA gridded data, that do not adequately capture subgrid meteorological scale. The VPD values, in general, are lower in wet than in dry regions [77]. Moreover, these statistical differences can be related to the methodology to compute VPD in MOD16 algorithm using a function of terrain elevation only [56,57].
The mean seasonal pattern of EC measurements, for MOD16 estimation and MERRA environmental variables at the PRS and CAS sites, are presented in Figure 5 and Figure 6, respectively. Overall, it is shown that MOD16 ET estimates followed the seasonal patterns of LAI and fPAR, whilst ET measurements presented a seasonal pattern similar to radiation components and air temperature. The greatest differences between EC and MOD16 ET were found during the spring fallow season (from September to November), with EC measurements around 20 mm 8-day−1 greater than MOD16 ET estimates. In this period, Λ values increased (Figure 3), but LAI values were still low. During the winter fallow season (from May to August), MOD16 ET products and EC measurements showed similar behaviors, but in this period, Λ and LAI values are low. In contrast, during the maximum plant development (maximum LAI), MOD16 ET estimates were higher than EC measurements at the CAS site, reaching differences near to 10 mm 8-day−1, whilst at PRS EC measurements and MOD16 ET estimates showed similar values. Overall, our results were similar to those reported by Biggs et al. [19], with larger differences in the beginning and in the middle of growing season, coincident with low LAI values and high water availability (during flooding), suggesting that MOD16 underestimates soil evaporation when soil wetness is high.

3.4. Sensitivity of MOD16 Algorithm on the Accuracy of Meteorological Data

To investigate the sensitivity of meteorological inputs on MOD16 ET estimates accuracy, we ran the MOD16 algorithm with measured meteorological forcing data and land cover parameterization as cropland [23,56,57] for the PRS and CAS sites (called “tower-driven” results), using the pixel at the same location of the flux tower to extract MODIS remotely-sensed inputs, as reported in Khan et al. [73] and Yao et al. [78]. The annual integrated values are showed in Table 4. The values were smaller than MOD16 ET at approximately 13%, on average. Therefore, using tower-driven data did not improve the results of MOD16 ET over flooded area.
The 8-day tower-driven estimates were then compared to EC ET measurements, as shown in Figure 7a,b. Tower-driven ET estimates did not indicate a high accuracy improvement, with RMSE increasing from 13.40 to 13.42 mm 8-day−1 at PRS and decreasing from 16.35 to 15.14 mm 8-day−1 at CAS, when compared to MOD16 ET estimations using MERRA reanalysis. Both estimates (using MERRA and observed meteorology) yielded similar r values (increased from 0.65 to 0.76 at PRS and from 0.50 to 0.62 at CAS) and similar bias and PBIAS (for both sites, we found BIAS increasing at ≈2 mm 8-day−1 and PBIAS increasing ≈7% for PRS and ≈10% for CAS). Other studies also suggest that tower-driven ET estimates indicate a low sensitivity of MOD16 algorithm to meteorological inputs, suggesting that biases are related to algorithm limitations, such as model structure to compute surface (rs) and/or aerodynamic (ra) resistance and canopy conductance (cc) [31,79] or to land cover parameterization [80]. In this case, further assessments are needed to improve global ET algorithms for flooded rice paddy or water-saturated soils.
The ET partitioning between λEs, λEc and λTc is presented in Figure 7c,d. In the spring fallow season (from September to November), months of preparation and sowing, LAI is minimal (i.e., without vegetation influence on surface fluxes). Moreover, with a water layer over the soil surface, mainly at the end of this period and beginning of the growing season, we expected no contribution to the final sum of ET from transpiration (λTc) and canopy evaporation (λEc), soil evaporation (λEs) being the key parameter in this period. However, this was not observed in the estimation of partition by MOD16 ET, that represented a larger contribution of λTc and λEc. In this period, we found the largest differences between EC measurements and MOD16 ET. Therefore, the equation of λEs needs adjustment in its parameterization Equation (7) to accurately describe the influence of soil moisture in the ET process, as discussed in Section 3.3. He et al. [81] describes that MOD16 algorithm does not directly represent soil moisture water supply constraints to ET, increasing significantly errors in the model. Recently, Purdy et al. [82] suggest soil moisture incorporation into of λEs improves ET estimates thus reducing uncertainties and provide a rich dataset to evaluate land surface and climate models.
Diaz et al. [39], showed the transpiration in CAS in fallow season (April to November) almost vanish, while evaporation dominates the ET. This behavior was also represented by MOD16 algorithm (Figure 7c,d). However, the processes of λEc and λTc were overestimated when LAI was close to zero, suggesting more studies in these parametrizations (Equations (8) and (9), respectively) are necessary. As expected, during the growing season (October to March), the transpiration is the dominant process for estimating ET, followed by canopy evaporation. Hossen et al. [83] find that about 70% of seasonal ET comes from transpiration in the growing season, whilst Diaz et al. [39], analyzing ET partition for the CAS site, find that around 60% of ET is due to transpiration process. Here we found 80% for PRS and 50% for CAS. However, the contribution of the water layer in the λEs during growing season should probably be greater than the estimate of λEs by the model (8% for PRS and 14% for CAS). An alternative to decrease the error in MOD16 ET estimates over flooded rice paddy is to improve the flooded fraction remotely estimated [84].

4. Conclusions

The main goal of this study was to conduct a comprehensive assessment of ET over two flooded rice paddy sites located in Southern Brazil using measured and remote sensing data, to address the main control drivers of the ET process. ET in irrigated crops is the largest consumer of the available energy. In this irrigation system, the fallow season (non-flooded) also showed a large importance for the available energy partitioning. During the irrigation season, almost all available energy was converted to LE. Since both flux tower sites are located in lowland areas (floodplains) with high water availability, the environmental measured variables indicated that the main drivers of measured ET were radiation ( R g and R n ), followed by Temp and VPD.
MOD16 ET estimations over flooded rice paddy at PRS and CAS were underestimated when compared to EC measurements, with largest differences during the rice growing season. MOD16 algorithm main control drivers were LAI and fPAR, with meteorological reanalysis playing a secondary role. This result was supported by the sensitivity analysis of the algorithm. When forced with meteorological measurements, tower-driven ET estimates did not improve accuracy as expected, yielding similar statistics when compared to the meteorological reanalysis ET estimates.
Discrepancies between MOD16 ET estimates and EC measurements may be related to several factors, including flux tower measurement errors, flux tower footprint vs. MERRA–MODIS spatial resolution and land cover parameterization of the Penman–Monteith equation, as well as algorithm limitations. The cause of underestimation observed in this study may be also associated to model structure to compute rs and cc and land cover parameterization. Since the algorithm showed a low sensitivity to VPD, possibly caused by the simple methodology used to its determination as a function of surface elevation only, further studies are necessary to improve resistance factors and ET estimates. Our findings support that vegetation-based models to estimate global ET underestimate soil evaporation and plant transpiration in saturated soils, possibly due to inaccurate land cover parameterization and resistance factors. Therefore, the MODIS algorithm to estimate land surface ET is not able to detect areas with high soil moisture, such as flooded agricultural areas, mainly because the MOD16 algorithm relies on vegetation indices as surface processes indicators and MERRA reanalysis data as an indicator of moisture stress.
Results obtained in this research can guide additional model refinements to increase the accuracy of ET estimates. Therefore, we would recommend a regional scale calibration of the MOD16 algorithm. Additionally, as an alternative to reduce the impacts of parameterization, land surface temperature or soil moisture could be included as an algorithm input, to improve ET estimates over irrigated crop. Improvements in remote-sensed ET models could bring global ET estimates closer to experimental measurements and, therefore, help to improve water management.

Supplementary Materials

The following are available online at https://www.mdpi.com/2073-4441/11/9/1911/s1, Figure S1: Comparison of measured and estimated LAI from 2009 to 2014 over irrigated cropland (rice cultivated in a flooding system). The grey boxes represent the average LAI MODIS inter-quartile range (IQR), the black tick lines represent the median and the whiskers indicate variability outside the upper and lower quartiles. Experimental LAI measurements for each growing season were interpolated to obtain values in the same time interval of MODIS. The red dots represent the mean of three LAI growing season measurements and the red line represents the fitted curve of measured LAI after planting. Table S1: Validation of MERRA reanalysis data against measured environmental variables: net radiation ( R n ), global radiation ( R g ), air temperature (Temp) and vapor pressure deficit (VPD), used as MOD16 algorithm inputs for 2004–2005 at the PRS site. Table S2: Validation of MERRA reanalysis data against measured environmental variables: net radiation ( R n ), global radiation ( R g ), air temperature (Temp) and vapor pressure deficit (VPD), used as MOD16 algorithm inputs for 2011–2014 at the CAS site.

Author Contributions

V.d.A.S. processed the remote sensing data, generated and analyzed the results. V.d.A.S., T.Z. and M.B.D. collected, processed and analyzed the eddy covariance data. V.d.A.S., T.Z., D.R.R. and A.L.R. wrote the manuscript. O.L.L.d.M. and D.R.R. conceived and designed the experiments. D.S.A. ran tower-driven MOD16. D.R.R., A.L.R. and R.d.C.M.A. supervised and advised all the research work that led to this paper. D.R.R., L.G.G.d.G., A.L.R. and D.S.A. reviewed the manuscript and conducted the English editing.

Funding

The authors acknowledge the National Council for Scientific and Technological Development (CNPq—Brazil), the Coordination for the Improvement of Higher Education Personnel (CAPES—Brazil, funding code 001), Foundation for Research of Rio Grande do Sul State (FAPERGS), Support Foundation of the Federal University of Rio Grande do Sul (FAURGS—Brazil) and Financier of Studies and Projects (FINEP—Brazil) for their financial support.

Acknowledgments

The authors acknowledge the staff of the Micrometeorology Lab of the Federal University of Santa Maria for the technical support provided, particularly relative to the flux towers and the eddy covariance instrumentation.

Conflicts of Interest

The authors declare no conflict of interest.

References

  1. Mekonnen, M.M.; Hoekstra, A.Y. Four billion people facing severe water scarcity. Sci. Adv. 2016, 2, e1500323. [Google Scholar] [CrossRef] [PubMed]
  2. Rosegrant, M.W.; Cai, X. Global Water Demand and Supply Projections Part 2. Results and Prospects to 2025. Water Int. 2002, 27, 170–182. [Google Scholar] [CrossRef]
  3. Ercin, A.E.; Hoekstra, A.Y. Water footprint scenarios for 2050: A global analysis. Environ. Int. 2014, 64, 71–82. [Google Scholar] [CrossRef] [PubMed]
  4. Biggs, T.W.; Petropoulos, G.P.; Velpuri, N.M.; Marshall, M.; Glenn, E.P.; Nagler, P.; Messina, A. Remote Sensing of Actual Evapotranspiration from Cropland: Chapter 3. In Remote Sensing Handbook, Vol. III: Remote Sensing of Water Resources, Disasters, and Urban Studies; Thenkabail, P.S., Ed.; CRC Press: Boca Raton, FL, USA, 2015; pp. 59–99. ISBN 9781482217919. [Google Scholar]
  5. Arriga, N.; Rannik, Ü.; Aubinet, M.; Carrara, A.; Vesala, T.; Papale, D. Experimental validation of footprint models for eddy covariance CO2 flux measurements above grassland by means of natural and artificial tracers. Agric. For. Meteorol. 2017, 242, 75–84. [Google Scholar] [CrossRef]
  6. Fisher, J.B.; Melton, F.; Middleton, E.; Hain, C.; Anderson, M.; Allen, R.; Mccabe, M.F.; Hook, S.; Baldocchi, D.; Townsend, P.A.; et al. The future of evapotranspiration: Global requirements for ecosystemfunctioning, carbon and climate feedbacks, agriculturalmanagement, and water resources. Water Resour. Res. 2017, 53, 2618–2626. [Google Scholar] [CrossRef]
  7. Bastiaanssen, W.G.M.; Menenti, M.; Feddes, R.A.; Holtslag, A.A.M. A remote sensing surface energy balance algorithm for land (SEBAL). 1. Formulation. J. Hydrol. 1998, 212, 198–212. [Google Scholar] [CrossRef]
  8. Su, Z. The Surface Energy Balance System (SEBS) for estimation of turbulent heat fluxes SEBS—The Surface Energy Balance. Hydrol. Earth Syst. Sci. 2002, 6, 85–99. [Google Scholar] [CrossRef]
  9. Allen, R.G.; Tasumi, M.; Morse, A.; Trezza, R.; Wright, J.L.; Bastiaanssen, W.; Kramber, W.; Lorite, I.; Robison, C.W. Satellite-Based Energy Balance for Mapping Evapotranspiration with Internalized Calibration (METRIC)—Applications. J. Irrig. Drain. Eng. 2007, 133, 380–394. [Google Scholar] [CrossRef]
  10. Anderson, M.C.; Kustas, W.P.; Norman, J.M.; Hain, C.R.; Mecikalski, J.R.; Schultz, L.; González-Dugo, M.P.; Cammalleri, C.; D’Urso, G.; Pimstein, A.; et al. Mapping daily evapotranspiration at field to continental scales using geostationary and polar orbiting satellite imagery. Hydrol. Earth Syst. Sci. 2011, 15, 223–239. [Google Scholar] [CrossRef] [Green Version]
  11. Mu, Q.; Heinsch, F.A.; Zhao, M.; Running, S.W. Development of a global evapotranspiration algorithm based on MODIS and global meteorology data. Remote Sens. Environ. 2007, 111, 519–536. [Google Scholar] [CrossRef]
  12. Fisher, J.B.; Malhi, Y.; Bonal, D.; Da Rocha, H.R.; De Araújo, A.C.; Gamo, M.; Goulden, M.L.; Rano, T.H.; Huete, A.R.; Kondo, H.; et al. The land-atmosphere water flux in the tropics. Glob. Chang. Biol. 2009, 15, 2694–2714. [Google Scholar] [CrossRef]
  13. Martens, B.; Miralles, D.G.; Lievens, H.; Van Der Schalie, R.; De Jeu, R.A.M.; Fernández-Prieto, D.; Beck, H.E.; Dorigo, W.A.; Verhoest, N.E.C. GLEAM v3: Satellite-based land evaporation and root-zone soil moisture. Geosci. Model Dev. 2017, 10, 1903–1925. [Google Scholar] [CrossRef]
  14. Moreira, A.A.; Ruhoff, A.L.; Roberti, D.R.; de Arruda Souza, V.; Rocha, H.R.; Paiva, R.C.D. Assessment of terrestrial water balance using remote sensing data in South America. J. Hydrol. 2019, 575, 131–147. [Google Scholar] [CrossRef]
  15. Ramoelo, A.; Majozi, N.; Mathieu, R.; Jovanovic, N.; Nickless, A.; Dzikiti, S. Validation of global evapotranspiration product (MOD16) using flux tower data in the African Savanna, South Africa. Remote Sens. 2014, 6, 7406–7423. [Google Scholar] [CrossRef]
  16. Chen, Y.; Xia, J.; Liang, S.; Feng, J.; Fisher, J.B.; Li, X.; Li, X.; Liu, S.; Ma, Z.; Miyata, A.; et al. Comparison of satellite-based evapotranspiration models over terrestrial ecosystems in China. Remote Sens. Environ. 2014, 140, 279–293. [Google Scholar] [CrossRef]
  17. Oliveira, P.T.S.; Nearing, M.A.; Moran, M.S.; Goodrich, D.C.; Wendland, E.; Gupta, H.V. Trends in water balance components across the Brazilian Cerrado. Water Resour. Res. 2014, 50, 7100–7114. [Google Scholar] [CrossRef] [Green Version]
  18. Hu, G.; Jia, L.; Menenti, M. Comparison of MOD16 and LSA-SAF MSG evapotranspiration products over Europe for 2011. Remote Sens. Environ. 2015, 156, 510–526. [Google Scholar] [CrossRef]
  19. Biggs, T.W.; Marshall, M.; Messina, A. Mapping daily and seasonal evapotranspiration from irrigated crops using global climate grids and satellite imagery: Automation and methods comparison. Water Resour. Res. 2016, 52, 7311–7326. [Google Scholar] [CrossRef]
  20. Maeda, E.E.; Maeda, E.E.; Ma, X.; Wagner, F.H.; Kim, H.; Oki, T. Evapotranspiration seasonality across the Amazon Basin Evapotranspiration seasonality across the Amazon Basin. Earth Syst. Dyn. 2017, 439–454. [Google Scholar] [CrossRef]
  21. Gowda, P.H.; Chavez, J.L.; Colaizzi, P.D.; Evett, S.R.; Howell, T.A.; Tolk, J.A. ET mapping for agricultural water management: Present status and challenges. Irrig. Sci. 2008, 26, 223–237. [Google Scholar] [CrossRef]
  22. Li, Z.; Tang, R.; Wan, Z.; Bi, Y.; Zhou, C.; Tang, B.; Yan, G.; Zhang, X. A Review of Current Methodologies for Regional Evapotranspiration Estimation from Remotely Sensed Data. Sensors 2009, 9, 3801–3853. [Google Scholar] [CrossRef] [PubMed] [Green Version]
  23. Mu, Q.; Zhao, M.; Running, S.W. Improvements to a MODIS global terrestrial evapotranspiration algorithm. Remote Sens. Environ. 2011, 115, 1781–1800. [Google Scholar] [CrossRef]
  24. Fang, Y.; Sun, G.; Caldwell, P.; Mcnulty, S.G.; Noormets, A.; Domec, J.C.; King, J.; Zhang, Z.; Zhang, X.; Lin, G.; et al. Monthly land cover-specific evapotranspiration models derived from global eddy flux measurements and remote sensing data. Ecohydrology 2016, 9, 248–266. [Google Scholar] [CrossRef]
  25. Srivastava, P.K.; Han, D.; Islam, T.; Petropoulos, G.P.; Gupta, M.; Dai, Q. Seasonal evaluation of evapotranspiration fluxes from MODIS satellite and mesoscale model downscaled global reanalysis datasets. Theor. Appl. Climatol. 2016, 124, 461–473. [Google Scholar] [CrossRef]
  26. Kim, H.W.; Hwang, K.; Mu, Q.; Lee, S.O.; Choi, M. Validation of MODIS 16 global terrestrial evapotranspiration products in various climates and land cover types in Asia. KSCE J. Civ. Eng. 2012, 16, 229–238. [Google Scholar] [CrossRef]
  27. Jang, K.; Kang, S.; Lim, Y.J.; Jeong, S.; Kim, J.; Kimball, J.S.; Hong, S.Y. Monitoring daily evapotranspiration in Northeast Asia using MODIS and a regional Land Data Assimilation System. J. Geophys. Res. Atmos. 2013, 118, 12927–12940. [Google Scholar] [CrossRef]
  28. Tang, R.; Shao, K.; Li, Z.L.; Wu, H.; Tang, B.H.; Zhou, G.; Zhang, L. Multiscale Validation of the 8-day MOD16 Evapotranspiration Product Using Flux Data Collected in China. IEEE J. Sel. Top. Appl. Earth Obs. Remote Sens. 2015, 8, 1478–1486. [Google Scholar] [CrossRef]
  29. Velpuri, N.M.; Senay, G.B.; Singh, R.K.; Bohms, S.; Verdin, J.P. A comprehensive evaluation of two MODIS evapotranspiration products over the conterminous United States: Using point and gridded FLUXNET and water balance ET. Remote Sens. Environ. 2013, 139, 35–49. [Google Scholar] [CrossRef]
  30. Aguilar, A.L.; Flores, H.; Crespo, G.; Mar, M.I.; Campos, I.; Id, A.C. Performance Assessment of MOD16 in Evapotranspiration Evaluation in Northwestern Mexico. Water 2018, 10, 901. [Google Scholar] [CrossRef]
  31. Ershadi, A.; Mccabe, M.F.; Evans, J.P.; Wood, E.F. Impact of model structure and parameterization on Penman-Monteith type evaporation models. J. Hydrol. 2015, 525, 521–535. [Google Scholar] [CrossRef]
  32. Yao, Y.; Liang, S.; Li, X.; Chen, J.; Wang, K.; Jia, K.; Cheng, J.; Jiang, B.; Fisher, J.B.; Mu, Q.; et al. A satellite-based hybrid algorithm to determine the Priestley-Taylor parameter for global terrestrial latent heat fl ux estimation across multiple biomes. Remote Sens. Environ. 2015, 165, 216–233. [Google Scholar] [CrossRef]
  33. Cleugh, H.A.; Leuning, R.; Mu, Q.; Running, S.W. Regional evaporation estimates from flux tower and MODIS satellite data. Remote Sens. Environ. 2007, 106, 285–304. [Google Scholar] [CrossRef]
  34. McCabe, M.F.; Wood, E.F. Scale influences on the remote estimation of evapotranspiration using multiple satellite sensors. Remote Sens. Environ. 2006, 105, 271–285. [Google Scholar] [CrossRef]
  35. Baldocchi, D.; Knox, S.; Dronova, I.; Verfaillie, J.; Oikawa, P.; Sturtevant, C.; Matthes, J.H.; Detto, M. The impact of expanding flooded land area on the annual evaporation of rice. Agric. For. Meteorol. 2016, 223, 181–193. [Google Scholar] [CrossRef] [Green Version]
  36. IBGE. Levantamento Sistemático da Produção Agrícola; Instituto Brasileiro de Geografia e Estatística, 2017. Available online: https://biblioteca.ibge.gov.br/index.php/biblioteca-catalogo?view=detalhes&id=78 (accessed on 18 November 2018). (In Portuguese)
  37. Timm, A.U.; Roberti, D.R.; Streck, N.A.; Gustavo, G.; de Gonçalves, L.; Acevedo, O.C.; Moraes, O.L.L.; Moreira, V.S.; Degrazia, G.A.; Ferlan, M.; et al. Energy Partitioning and Evapotranspiration over a Rice Paddy in Southern Brazil. J. Hydrometeorol. 2014, 15, 1975–1988. [Google Scholar] [CrossRef]
  38. Peel, M.C.; Finlayson, B.L.; McMahon, T.A. Updated world map of the Köppen-Geiger climate classification. Hydrol. Earth Syst. Sci. 2007, 11, 1633–1644. [Google Scholar] [CrossRef]
  39. Diaz, M.B.; Roberti, D.R.; Carneiro, J.V.; de Arruda Souza, V.; de Moraes, O.L.L. Dynamics of the superficial fluxes over a flooded rice paddy in southern Brazil. Agric. For. Meteorol. 2019, 276–277, 107650. [Google Scholar] [CrossRef]
  40. Acevedo, O.C.; Moraes, O.L.L.; Degrazia, G.A.; Medeiros, L.E. Intermittency and the exchange of scalars in the nocturnal surface layer. Bound. Layer Meteorol. 2006, 119, 41–55. [Google Scholar] [CrossRef]
  41. Acevedo, O.C.; Moraes, O.L.L.; Degrazia, G.A.; Fitzjarrald, D.R.; Manzi, A.O.; Campos, J.G. Is friction velocity the most appropriate scale for correcting nocturnal carbon dioxide fluxes? Agric. For. Meteorol. 2009, 149, 1–10. [Google Scholar] [CrossRef]
  42. Rubert, G.C.; Roberti, D.R.; Pereira, L.S.; Quadros, F.L.F.; Velho, H.F.D.C.; Moraes, O.L.L.D. Evapotranspiration of the Brazilian Pampa Biome: Seasonality and Influential Factors. Water 2018, 10, 1864. [Google Scholar] [CrossRef]
  43. Kljun, N.; Calanca, P.; Rotach, M.W.; Schmid, H.P. A simple parametrization for flux footprint predictions. Bound. Layer Metorol. 2004, 112, 503–523. [Google Scholar] [CrossRef]
  44. Foken, T.; Leuning, R.; Oncley, S.R.; Mauder, M.; Aubinet, M. Corrections and Data Quality Control. In Eddy Covariance; Springer: Dordrecht, The Netherlands, 2012; pp. 85–131. [Google Scholar]
  45. Alberto, M.C.R.; Buresh, R.J.; Hirano, T.; Miyata, A.; Wassmann, R.; Quilty, J.R.; Correa, T.Q.; Sandro, J. Carbon uptake and water productivity for dry-seeded rice and hybrid maize grown with overhead sprinkler irrigation. Field Crop. Res. 2013, 146, 51–65. [Google Scholar] [CrossRef]
  46. Alberto, M.C.R.; Quilty, J.R.; Buresh, R.J.; Wassmann, R.; Haidar, S.; Correa, T.Q.; Sandro, J.M. Actual evapotranspiration and dual crop coefficients for dry-seeded rice and hybrid maize grown with overhead sprinkler irrigation. Agric. Water Manag. 2014, 136, 1–12. [Google Scholar] [CrossRef]
  47. Reichstein, M.; Falge, E.; Baldocchi, D.; Papale, D.; Aubinet, M.; Berbigier, P.; Bernhofer, C.; Buchmann, N.; Gilmanov, T.; Granier, A.; et al. On the separation of net ecosystem exchange into assimilation and ecosystem respiration: Review and improved algorithm. Glob. Chang. Biol. 2005, 11, 1424–1439. [Google Scholar] [CrossRef]
  48. Wutzler, T.; Lucas-Moffat, A.; Migliavacca, M.; Knauer, J.; Sickel, K.; Šigut, L.; Menzer, O.; Reichstein, M. Basic and extensible post-processing of eddy covariance flux data with REddyProc. Biogeosciences 2018, 15, 5015–5030. [Google Scholar] [CrossRef] [Green Version]
  49. Stoy, P.C.; Mauder, M.; Foken, T.; Marcolla, B.; Boegh, E.; Ibrom, A.; Arain, M.A.; Arneth, A.; Aurela, M.; Bernhofer, C.; et al. A data-driven analysis of energy balance closure across FLUXNET research sites: The role of landscape scale heterogeneity. Agric. For. Meteorol. 2013, 171–172, 137–152. [Google Scholar] [CrossRef]
  50. Kanda, M.; Inagaki, A.; Letzel, M.O.; Raasch, S.; Watanabe, T. LES STUDY OF THE ENERGY IMBALANCE PROBLEM WITH EDDY COVARIANCE FLUXES. Bound. Layer Meteorol. 2004, 110, 381–404. [Google Scholar] [CrossRef]
  51. Wilson, K.; Goldstein, A.; Falge, E.; Aubinet, M.; Baldocchi, D.; Berbigier, P.; Bernhofer, C.; Ceulemans, R.; Dolman, H.; Field, C.; et al. Energy balance closure at FLUXNET sites. Agric. For. Meteorol. 2002, 113, 223–243. [Google Scholar] [CrossRef] [Green Version]
  52. Twine, T.E.; Kustas, W.P.; Norman, J.M.; Cook, D.R.; Houser, P.R.; Meyers, T.P.; Prueger, J.H.; Wesley, M.L. Correcting eddy covariance flux underestimates over grassland. Agric. For. Meteorol. 2000, 103, 279–300. [Google Scholar] [CrossRef]
  53. Nagler, P.; Scott, R.; Wesrenburg, C.; Cleverly, J.; Glenn, E.; Huete, A. Evapotranspiration on western U.S. rivers estimated using the Enhanced Vegetation Index from MODIS and data from eddy covariance and Bowen ratio flux towers. Remote Sens. Environ. 2005, 97, 337–351. [Google Scholar] [CrossRef]
  54. Alberto, M.C.R.; Wassmann, R.; Hirano, T.; Miyata, A.; Hatano, R.; Kumar, A.; Padre, A.; Amante, M. Comparisons of energy balance and evapotranspiration between flooded and aerobic rice fields in the Philippines. Agric. Water Manag. 2011, 98, 1417–1430. [Google Scholar] [CrossRef]
  55. Crago, R.D. Conservation and variability of the evaporative fraction during the daytime. J. Hydrol. 1996, 180, 173–194. [Google Scholar] [CrossRef]
  56. Mu, Q.; Zhao, M.; Running, S.W. MODIS Global Terrestrial Evapotranspiration (ET) Product (NASA MOD16A2/A3) Algorithm Theoretical Basis Document Collection 5; University of Montana: Missoula, MT, USA, 2013. [Google Scholar]
  57. Running, S.W.; Mu, Q.; Zhao, M.; Moreno, A. User’s Guide MODIS Global Terrestrial Evapotranspiration (ET) Product (NASA MOD16A2/A3) NASA Earth Observing System MODIS Land Algorithm, 2017. Available online: https://ladsweb.modaps.eosdis.nasa.gov/missions-and-measurements/modis/MOD16_ET_User-Guide_2017.pdf (accessed on 13 September 2019).
  58. Fisher, J.B.; Tu, K.P.; Baldocchi, D.D. Global estimates of the land-atmosphere water flux based on monthly AVHRR and ISLSCP-II data, validated at 16 FLUXNET sites. Remote Sens. Environ. 2008, 112, 901–919. [Google Scholar] [CrossRef]
  59. Knyazikhin, Y.; Glassy, J.; Privette, J.L.; Tian, Y.; Lotsch, A.; Zhang, Y.; Wang, Y.; Morisette, J.T.; Votava, P.; Myneni, R.B.; et al. MODIS Leaf Area Index (LAI) and Fraction of Photosynthetically Active Radiation Absorbed by Vegetation (FPAR) Product (MOD15) Algorithm Theoretical Basis Document; NASA: Washington, DC, USA, 1999. [Google Scholar]
  60. Strahler, A.H.; Muller, J.-P.; MODIS Sciences Team Members. MODIS BRDF/Albedo Product: Algorithm Theoretical Basis Document Version 5.0, MODIS Documentation; Boston University: Boston, MA, USA, 1999. [Google Scholar]
  61. Friedl, M.A.; Sulla-Menashe, D.; Tan, B.; Schneider, A.; Ramankutty, N.; Sibley, A.; Huang, X. MODIS Collection 5 global land cover: Algorithm refinements and characterization of new datasets. Remote Sens. Environ. 2010, 114, 168–182. [Google Scholar] [CrossRef]
  62. Myneni, R.B.; Hoffman, S.; Knyazikhin, Y.; Privette, J.L.; Glassy, J.; Tian, Y.; Votava, P.; Nemani, R.R.; Running, S.W. Global products of vegetation leaf area and fraction absorbed PAR from year one of MODIS data. Remote Sens. Environ. 2002, 83, 214–231. [Google Scholar] [CrossRef] [Green Version]
  63. Zhao, M.; Heinsch, F.A.; Nemani, R.R.; Running, S.W.; Ann, F.; Nemani, R.R.; Running, S.W. Improvements of the MODIS terrestrial gross and net primary production global data set. Remote Sens. Environ. 2005, 95, 164–176. [Google Scholar] [CrossRef]
  64. Foken, T. The energy balance closure problem: An overview. Ecol. Appl. 2008, 18, 1351–1367. [Google Scholar] [CrossRef] [PubMed]
  65. Ikawa, H.; Ono, K.; Mano, M.; Kobayashi, K.; Takimoto, T.; Kuwagata, T.; Miyata, A. Evapotranspiration in a rice paddy field over 13 crop years. J. Agric. Meteorol. 2017, 73, 109–118. [Google Scholar] [CrossRef] [Green Version]
  66. Hatala, J.A.; Detto, M.; Sonnentag, O.; Deverel, S.J.; Verfaillie, J.; Baldocchi, D.D. Greenhouse gas (CO2, CH4, H2O) fluxes from drained and flooded agricultural peatlands in the Sacramento-San Joaquin Delta. Agric. Ecosyst. Environ. 2012, 150, 1–18. [Google Scholar] [CrossRef]
  67. Aubinet, M.; Grelle, A.; Ibrom, A.; Rannik, Ü.; Moncrieff, J.; Foken, T.; Kowalski, A.S.; Martin, P.H.; Berbigier, P.; Bernhofer, C.; et al. Estimates of the Annual Net Carbon and Water Exchange of Forests: The EUROFLUX Methodology. Adv. Ecol. Res. 2000, 30, 113–175. [Google Scholar]
  68. Miyata, A.; Leuning, R.; Thomas, O.; Kim, J.; Harazono, Y. Carbon dioxide and methane fluxes from an intermittently flooded paddy field. Agric. For. Meteorol. 2000, 102, 287–303. [Google Scholar] [CrossRef]
  69. Masseroni, D.; Facchi, A.; Romani, M.; Chiaradia, E.A.; Gharsallah, O.; Gandolfi, C. Surface energy flux measurements in a flooded and an aerobic rice field using a single eddy-covariance system. Paddy Water Environ. 2015, 13, 405–424. [Google Scholar] [CrossRef]
  70. Yan, H.; Oue, H.; Zhang, C. Predicting water surface evaporation in the paddy field by solving energy balance equation beneath the rice canopy. Paddy Water Environ. 2012, 10, 121–127. [Google Scholar] [CrossRef]
  71. Kar, G.; Kumar, A. Radiation utilization efficiency and evaporative fraction of rainfed rice in eastern India. J. Agrometeorol. 2016, 18, 518. [Google Scholar]
  72. Bouman, B.A.M.; Peng, S.; Castañeda, A.R.; Visperas, R.M. Yield and water use of irrigated tropical aerobic rice systems. Agric. Water Manag. 2005, 74, 87–105. [Google Scholar] [CrossRef]
  73. Khan, M.S.; Liaqat, U.W.; Baik, J.; Choi, M. Stand-alone uncertainty characterization of GLEAM, GLDAS and MOD16 evapotranspiration products using an extended triple collocation approach. Agric. For. Meteorol. 2018, 252, 256–268. [Google Scholar] [CrossRef]
  74. Teluguntla, P.; Ryu, D.; George, B.; Walker, J.P.; Malano, H.M. Mapping Flooded Rice Paddies Using Time Series of MODIS Imagery in the Krishna River Basin, India. Remote Sens. 2015, 7, 8858–8882. [Google Scholar] [CrossRef] [Green Version]
  75. Ershadi, A.; McCabe, M.F.; Evans, J.P.; Walker, J.P. Effects of spatial aggregation on the multi-scale estimation of evapotranspiration. Remote Sens. Environ. 2013, 131, 51–62. [Google Scholar] [CrossRef]
  76. Li, F.; Kustas, W.P.; Anderson, M.C.; Prueger, J.H.; Scott, R.L. Effect of remote sensing spatial resolution on interpreting tower-based flux observations. Remote Sens. Environ. 2008, 112, 337–349. [Google Scholar] [CrossRef]
  77. Kiniry, J.R.; Landivar, J.A.; Witt, M.; Gerik, T.J.; Cavero, J.; Wade, L.J. Radiation-use efficiency response to vapor pressure deficit for maize and sorghum. Field Crop. Res. 1998, 56, 265–270. [Google Scholar] [CrossRef]
  78. Yao, Y.; Liang, S.; Li, X.; Chen, J.; Liu, S.; Jia, K.; Zhang, X.; Xiao, Z.; Fisher, J.B.; Mu, Q.; et al. Improving global terrestrial evapotranspiration estimation using support vector machine by integrating three process-based algorithms. Agric. For. Meteorol. 2017, 242, 55–74. [Google Scholar] [CrossRef]
  79. Sun, Z.; Wang, Q.; Ouyang, Z.; Watanabe, M.; Matsushita, B.; Fukushima, T. Evaluation of MOD16 algorithm using MODIS and ground observational data in winter wheat field in North China Plain. Hydrol. Process. 2007, 1206, 1196–1206. [Google Scholar] [CrossRef]
  80. Ruhoff, A.L.; Paz, A.R.; Aragao, L.E.O.C.; Mu, Q.; Malhi, Y.; Collischonn, W.; Rocha, H.R.; Running, S.W. Assessment of the MODIS global evapotranspiration algorithm using eddy covariance measurements and hydrological modelling in the Rio Grande basin. Hydrol. Sci. J. 2013, 58, 1658–1676. [Google Scholar] [CrossRef]
  81. He, M.; Kimball, J.S.; Yi, Y.; Running, S.W.; Guan, K.; Moreno, A.; Wu, X.; Maneta, M. Satellite data-driven modeling of field scale evapotranspiration in croplands using the MOD16 algorithm framework. Remote Sens. Environ. 2019, 230, 111201. [Google Scholar] [CrossRef]
  82. Purdy, A.J.; Fisher, J.B.; Goulden, M.L.; Colliander, A.; Halverson, G.; Tu, K.; Famiglietti, J.S. SMAP soil moisture improves global evapotranspiration. Remote Sens. Environ. 2018, 219, 1–14. [Google Scholar] [CrossRef]
  83. Hossen, M.S.; Mano, M.; Miyata, A.; Baten, M.A.; Hiyama, T. Surface energy partitioning and evapotranspiration over a double-cropping paddy field in Bangladesh. Hydrol. Process. 2012, 26, 1311–1320. [Google Scholar] [CrossRef]
  84. Ranghetti, L.; Cardarelli, E.; Boschetti, M.; Busetto, L.; Fasola, M. Assessment of water management changes in the Italian rice paddies from 2000 to 2016 using satellite data: A contribution to agro-ecological studies. Remote Sens. 2018, 10, 80–90. [Google Scholar] [CrossRef]
Figure 1. Land use and land cover from MODIS land cover type product (MCD12Q1) around the flux tower sites (left) and flooded rice crops highlighted in light green color located in Paraíso do Sul (PRS) (top right) and Cachoeira do Sul (CAS) (bottom right). The false-color (R6G5B4) compositions are from LANDSAT 8 OLI (Land Remote Sensing Satellite/Operational Land Imager) sensor for 28 January 2014.
Water 11 01911 g001
Figure 2. Scatterplots of the 30-min energy balance closure computed for fallow (non-flooded) (a,c) and irrigate seasons (b,d) at the PRS (top) and CAS (bottom) sites. The solid blue lines represent the linear fit of the data. The equations of the lines and R2 (coefficient of determination) value are also shown. For reference, the 1:1 line is a solid black line and the 1:0.5 and 1:2 lines are dashed.
Water 11 01911 g002
Figure 3. Daily average of evaporative fraction during fallow and flooded rice growing seasons (shadowed areas) at the PRS (a) and CAS (b) sites.
Water 11 01911 g003
Figure 4. Scatterplots of the 8-day EC measurements against MOD16 ET estimates at PRS (a) and CAS (b). The solid blue lines represent the linear fit of the data and the grey areas represent the 95% confidence intervals. The line equations and R2 value are also shown. For reference, the 1:1 line is solid black line and the 1:0.5 and 1:2 lines are dashed.
Water 11 01911 g004
Figure 5. Seasonal pattern of EC measurements, MOD16 ET estimates and environmental variables (derived from MODIS remote sensing and MERRA reanalysis) from July 2003 to June 2004 at the PRS site. The grey boxes represent the inter-quartile range (IQR), the black tick lines represent the median and the whiskers indicate variability outside the upper and lower quartiles.
Water 11 01911 g005
Figure 6. Average seasonal pattern of EC measurements, MOD16 ET estimates and environmental variables (derived from MODIS remote sensing and MERRA reanalysis) from 2011 to 2014 at the CAS site. The grey boxes represent the inter-quartile range (IQR), the black tick lines represent the median and the whiskers indicate variability outside the upper and lower quartiles.
Water 11 01911 g006
Figure 7. Scatterplots of the 8-day EC measurements against tower-driven MOD16 ET estimates at PRS (a) and CAS (b). The solid blue lines represent the linear fit of the data and the grey areas represent the 95% confidence intervals. The line equations and R2 value are also shown. For reference, the 1:1 line is a solid black line and the 1:0.5 and 1:2 lines are dashed. Evapotranspiration partitioning between canopy transpiration, wet canopy evaporation and soil evaporation over flooded cropland (rice cultivated in a flooding system) estimated using tower-driven MOD16 algorithm for 2004–2005 at PRS (c) and for 2011–2014 at CAS (d).
Water 11 01911 g007
Table 1. Sensors installed at the flux towers used in this study.
VariableSensor Model and ManufacturerPosition (m)—Sites
Wind speed components3D sonic anemometer (CSAT3, Campbell Scientific Inc., Logan, Utah)10—PRS
3—CAS
H2O concentrationOpen gas analyzer (LI-7500, LI-COR Inc., Lincoln, Nebraska)10—PRS
3—CAS
Air temperature and relative humidityThermohygrometer (HMP45C-L; Campbell Scientific Inc., Logan, Utah) 10—PRS
PrecipitationPluviometer (TB4 Rain Gauge; Campbell Scientific Inc., Logan, Utah)10—PRS
6—CAS
Net radiationNet Radiometer (NR LITE, Kipp&Zonen, Delft, The Netherlands)8—PRS
3.4—CAS
Global RadiationPyranometer (CMB6, Kipp&Zonen, Delft, The Netherlands)8—PRS
Soil temperatureThermometer (STP01 Hukseflux Thermal Sensors B.V., Delft, The Netherlands) −0.02; 0.05—PRS
Ground heat fluxHeat flux (HFP01SC-L; Hukseflux Thermal Sensors B.V., Delft, The Netherlands)−0.07—PRS
Air temperature3D sonic anemometer (CSAT3, Campbell Scientific Inc., Logan, Utah)3—CAS
Relative humidityCombined data from CSAT3 and LI-750010—PRS
Table 2. Daily averages of the energy balance components (without energy balance closure) during fallow and flooded seasons at the PRS and CAS sites.
PRSCAS
FallowRiceFallowRice
Rn (W m−2)67.62146.1659.84146.08
LE (W m−2)53.4491.0150.14118.97
H (W m−2)10.0110.0810.792.96
G (W m−2)−0.364.56−5.6310.75
RAE (W m−2)4.5334.534.5413.40
Λ ± stdev0.87 ± 0.220.92 ± 0.130.86 ± 0.210.98 ± 0.11
Table 3. Statistical analysis between MOD16 evapotranspiration (ET) estimates against eddy covariance (EC) measurements in two rice paddy sites located in Southern Brazil.
SitePeriodrRMSE (mm 8-Day−1)PBIAS (%)Bias (mm 8-Day−1)
PRS2003–20040.6513.40−38.70−8.77
CAS2011–20140.5016.35−33.70−8.26
CAS20110.6613.55−20.70−4.62
CAS20120.6114.22−43.00−9.83
CAS20130.4119.12−34.80−8.99
CAS20140.3817.83−35.60−9.58
PRSFallow0.3410.75−44.20−6.88
PRSRice0.4117.17−34.20−12.14
CASFallow0.449.49−43.30−6.93
CASRice−0.0523.04−27.6−10.22
Table 4. Annual MOD16 ET, tower-driven MOD16 ET estimates, and EC measurements at the PRS and CAS sites.
SiteYearETMODIS (mm Year−1)ETMODIS-Tower (mm Year−1)EC (mm Year−1)
PRS2003–2004665.9592.81079.6
CAS2011814.5617.61027.1
CAS2012599.4529.61051.7
CAS2013776.0642.61189.5
CAS2014796.3764.51237.2
Table 5. Cross Correlation coefficients between EC measurements, MOD16 ET products and atmospheric variables for two rice paddy sites in Southern Brazil.
ETMODISECTemp R g R n VPDLAIfPARAlbedoTempMERRARgMERRAVPDMERRA
ETMODIS10.650.570.470.540.440.920.820.480.550.470.43
EC0.510.770.910.950.810.690.500.760.770.890.75
Temp0.520.8210.680.780.820.560.480.770.990.720.77
R g 0.420.910.7810.980.860.550.350.830.700.960.82
R n 0.430.960.830.9510.870.590.400.820.790.950.83
VPD0.340.650.720.740.6710.540.400.850.840.860.92
LAI0.880.530.550.500.500.3810.920.520.570.540.56
fPAR0.800.440.510.440.430.300.9010.360.470.320.42
Albedo0.710.290.430.350.310.230.720.8610.810.880.84
TempMERRA0.520.820.980.790.830.670.580.560.4810.760.83
RgMERRA0.410.900.790.940.820.730.490.400.290.8010.86
VPDMERRA0.240.800.770.830.820.610.490.470.340.840.841
* white cells present data for PRS, whilst light grey cells present data for the CAS site and dark grey are the 1:1 cells. Units of the variables: ETMODIS and EC (mm 8-day−1); temperature (Temp) and temperature from the Modern-Era Retrospective analysis for Research and Applications (MERRA) (TempMERRA) (°C); global radiation (Rg) and RgMERRA (W m−2); vapor pressure deficit (VPD) and VPDMERRA (hPa); and leaf area index (LAI) (m2 m−2).

