Article

Flood Risk Assessment of the Wadi Nu’man Basin, Mecca, Saudi Arabia (During the Period, 1988–2019) Based on the Integration of Geomatics and Hydraulic Modeling: A Case Study

by
Ashraf Abdelkarim
1,* and
Ahmed F.D. Gaber
2,3
1
Urban Geography and Flood Risks, Research Center, Ministry of Housing, Riyadh 11461, Saudi Arabia
2
Department of Geography, Faculty of Art, Sohag University, Sohag 82524, Egypt
3
Geography and GIS Department, College of Arts, Imam Abdulrahman Bin Faisal University, Dammam 31441, Saudi Arabia
*
Author to whom correspondence should be addressed.
Water 2019, 11(9), 1887; https://doi.org/10.3390/w11091887
Submission received: 23 July 2019 / Revised: 2 September 2019 / Accepted: 4 September 2019 / Published: 11 September 2019
(This article belongs to the Special Issue Assessing Surface and Ground- Water Vulnerability and Pollution Risk)

Abstract

:
This study aims to assess the impact of flash floods in the Wadi Nu’man basin on urban areas, east of Mecca, which are subjected to frequent floods, during the period from 1988–2019. By producing and analyzing the maps of the regions, an integrated approach to geomatics and hydraulic modelling is employed. The following maps are used: Flood-prone urbanity from 1988–2019, a flood risk map of Wadi Nu’man based on a risk matrix map, and a map of the proposed protection measures and alternatives in the study area. In order to achieve these goals, changes in the land use in the Wadi Nu’man basin were monitored by analyzing successive satellite images, taken by the US satellite, Landsat, in 1988, 1998, 2013, and 2019. Using a supervised classification, with the maximum likelihood method of ERDAS IMAGINE 2016, GIS was used in the production and analysis of soil maps, and geological and hydrological groups of drainage basins, as well as the hydrological model (HEC-HMS), were applied in calculating the hydrograph curve of the Wadi Nu’man basin. The flood water volumes and flow rates were estimated based on the SCS unit hydrograph, and the rain depth was analyzed and estimated for different periods. The hydraulic modeling program (HEC-RAS) was employed, when developing a two-dimensional model to calculate the speed, depth, and spread of the flood, in order to apply the risk matrix method. The recommendations based on this study give priority to the implementation of a flood prevention plan and the protection of infrastructure by maintaining the existing flood drainage facilities and establishing new drainage facilities to protect lives, property, and infrastructure.

1. Introduction

Urbanization is the main cause of the changes that take place in hydrological and hydraulic processes and the occurrence of flooding in urban areas. It increases the total amount of runoff and its maximum flow [1,2,3,4]. Changes in the land use and land cover are affected by the human interference, such as the establishment of residential, industrial, agricultural, mining, and other infrastructure facilities. These are key processes associated with the economic and sustainable growth of any area [5]. The proper use of every part of the available areas of land is necessary for the improvement of the economic and planning status of such areas, without expanding the areas prone to risk, and this is essential for sustainable planning [5,6]. Changes of land uses and land covers, as well as their impact on the hydrological processes, have recently been some of the most prominent research topics [7,8,
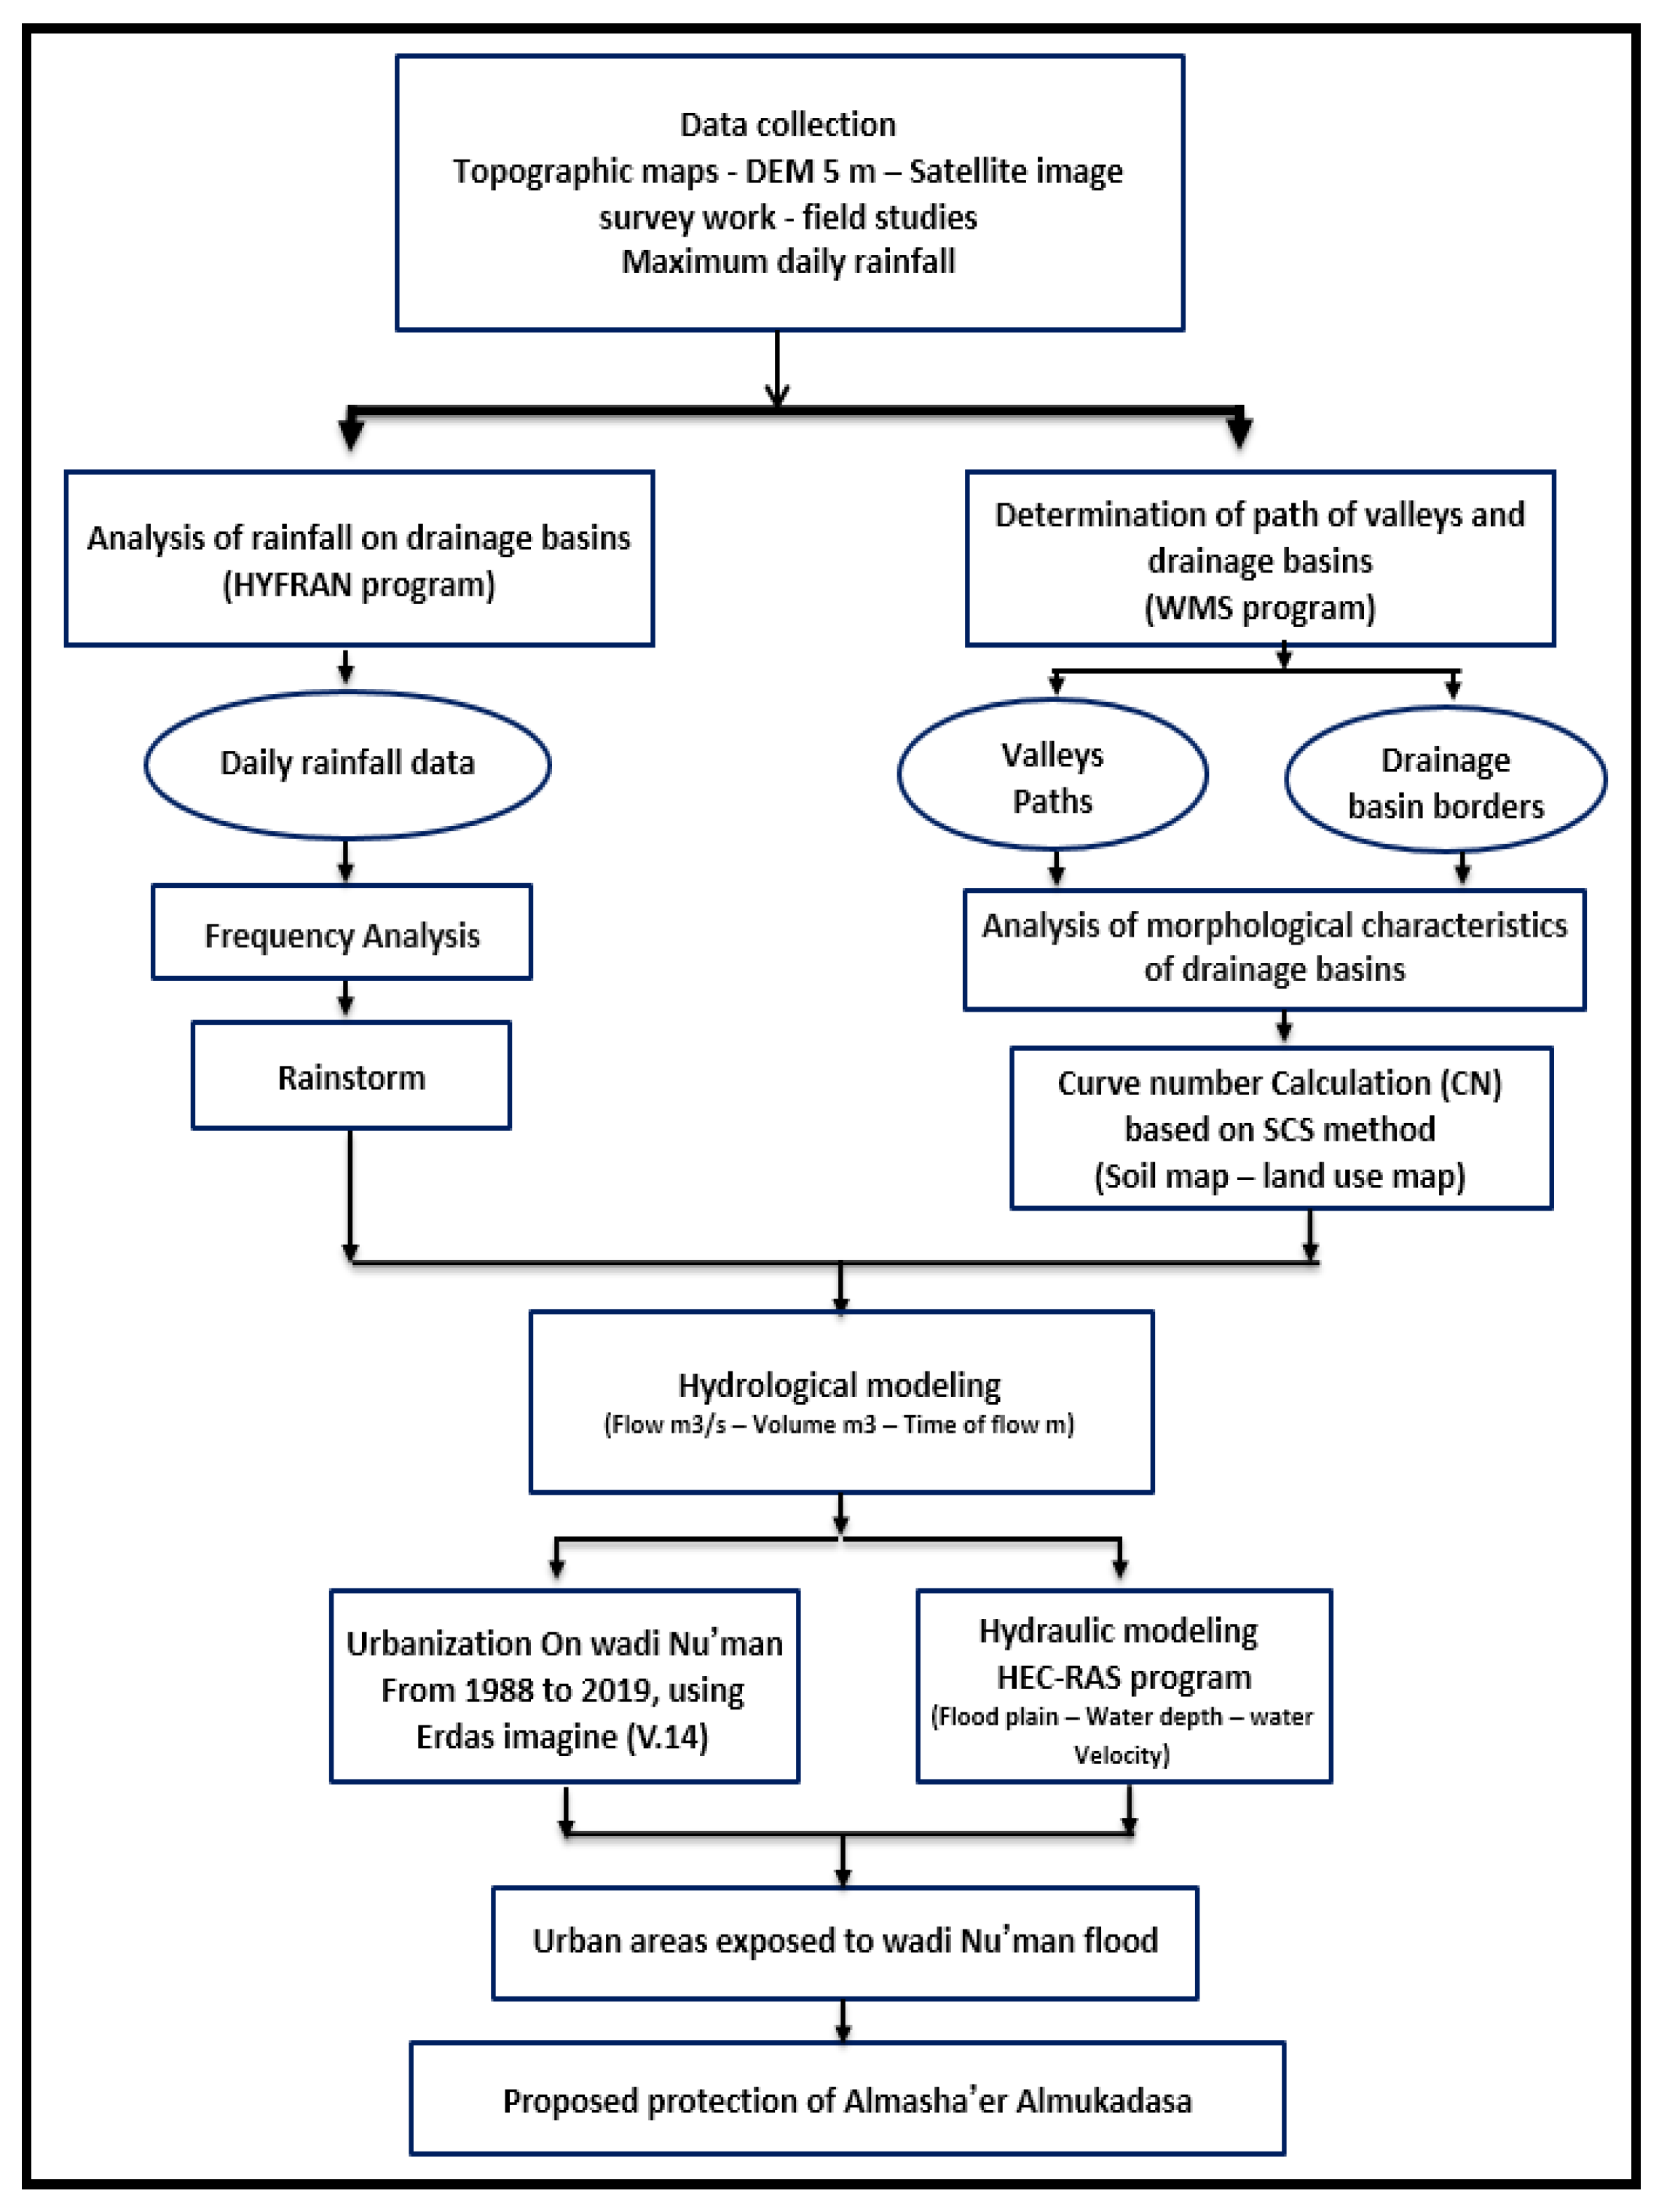
9]. Geomatic techniques, such as remote sensing (RS) and the geographic information system (GIS), as well as their integration with hydrological and hydraulic modelling, are regarded as exceptional technical tools for the modelling and urban planning of flood hazards. In the current study, ArcGIS 10.7 was used to extract quantitative information based on hydrological and hydraulic modelling results (WMS and HEC-RAS). The interpretation of satellite images, taken during the period from 1988–2019, was put forward, considering the current sections of urbanization and employing the ERDAS IMAGINE program in order to link the interpretation with the current sections of urbanization and demonstrate how it was affected by the risk of sudden floods at different times.
The identification of flood-prone areas and the development of urban flooding maps based on geomatics and hydrological and hydraulic modelling are critical for the planning process and sustainable urban development [10,11]. Flood risk maps are useful tools for spatial planning and city development, particularly in an area where it is necessary to define infrastructure guidelines for the construction of a drainage network and to ensure strict adherence to these guidelines in the construction of new urban settlements [12,13]. Contemporary trends of integrated water management and planning in urban environments involve conducting a proper risk assessment and implementing a number of preventive measures that enable the control of rainwater and drainage water movement in all of the expected hydrological systems and their subsequent drainage through the water drainage system [14]. Technically, floods cannot be controlled without a suitable assessment through flood risk mapping [15,16].
Over the past few decades, flood modelling using the hydrological and hydraulic modelling [17] programs has evolved dramatically with the advent of GIS and satellite-derived remote sensing imagery, the emergence of high-resolution digital elevation models (DEMs) and distributed hydrological models, and the development of prediction systems and the real-time monitoring of the occurrence of flooding on the Internet, which was reflected in the high-accuracy mapping of flooding in urban areas.
Researchers [18,19,
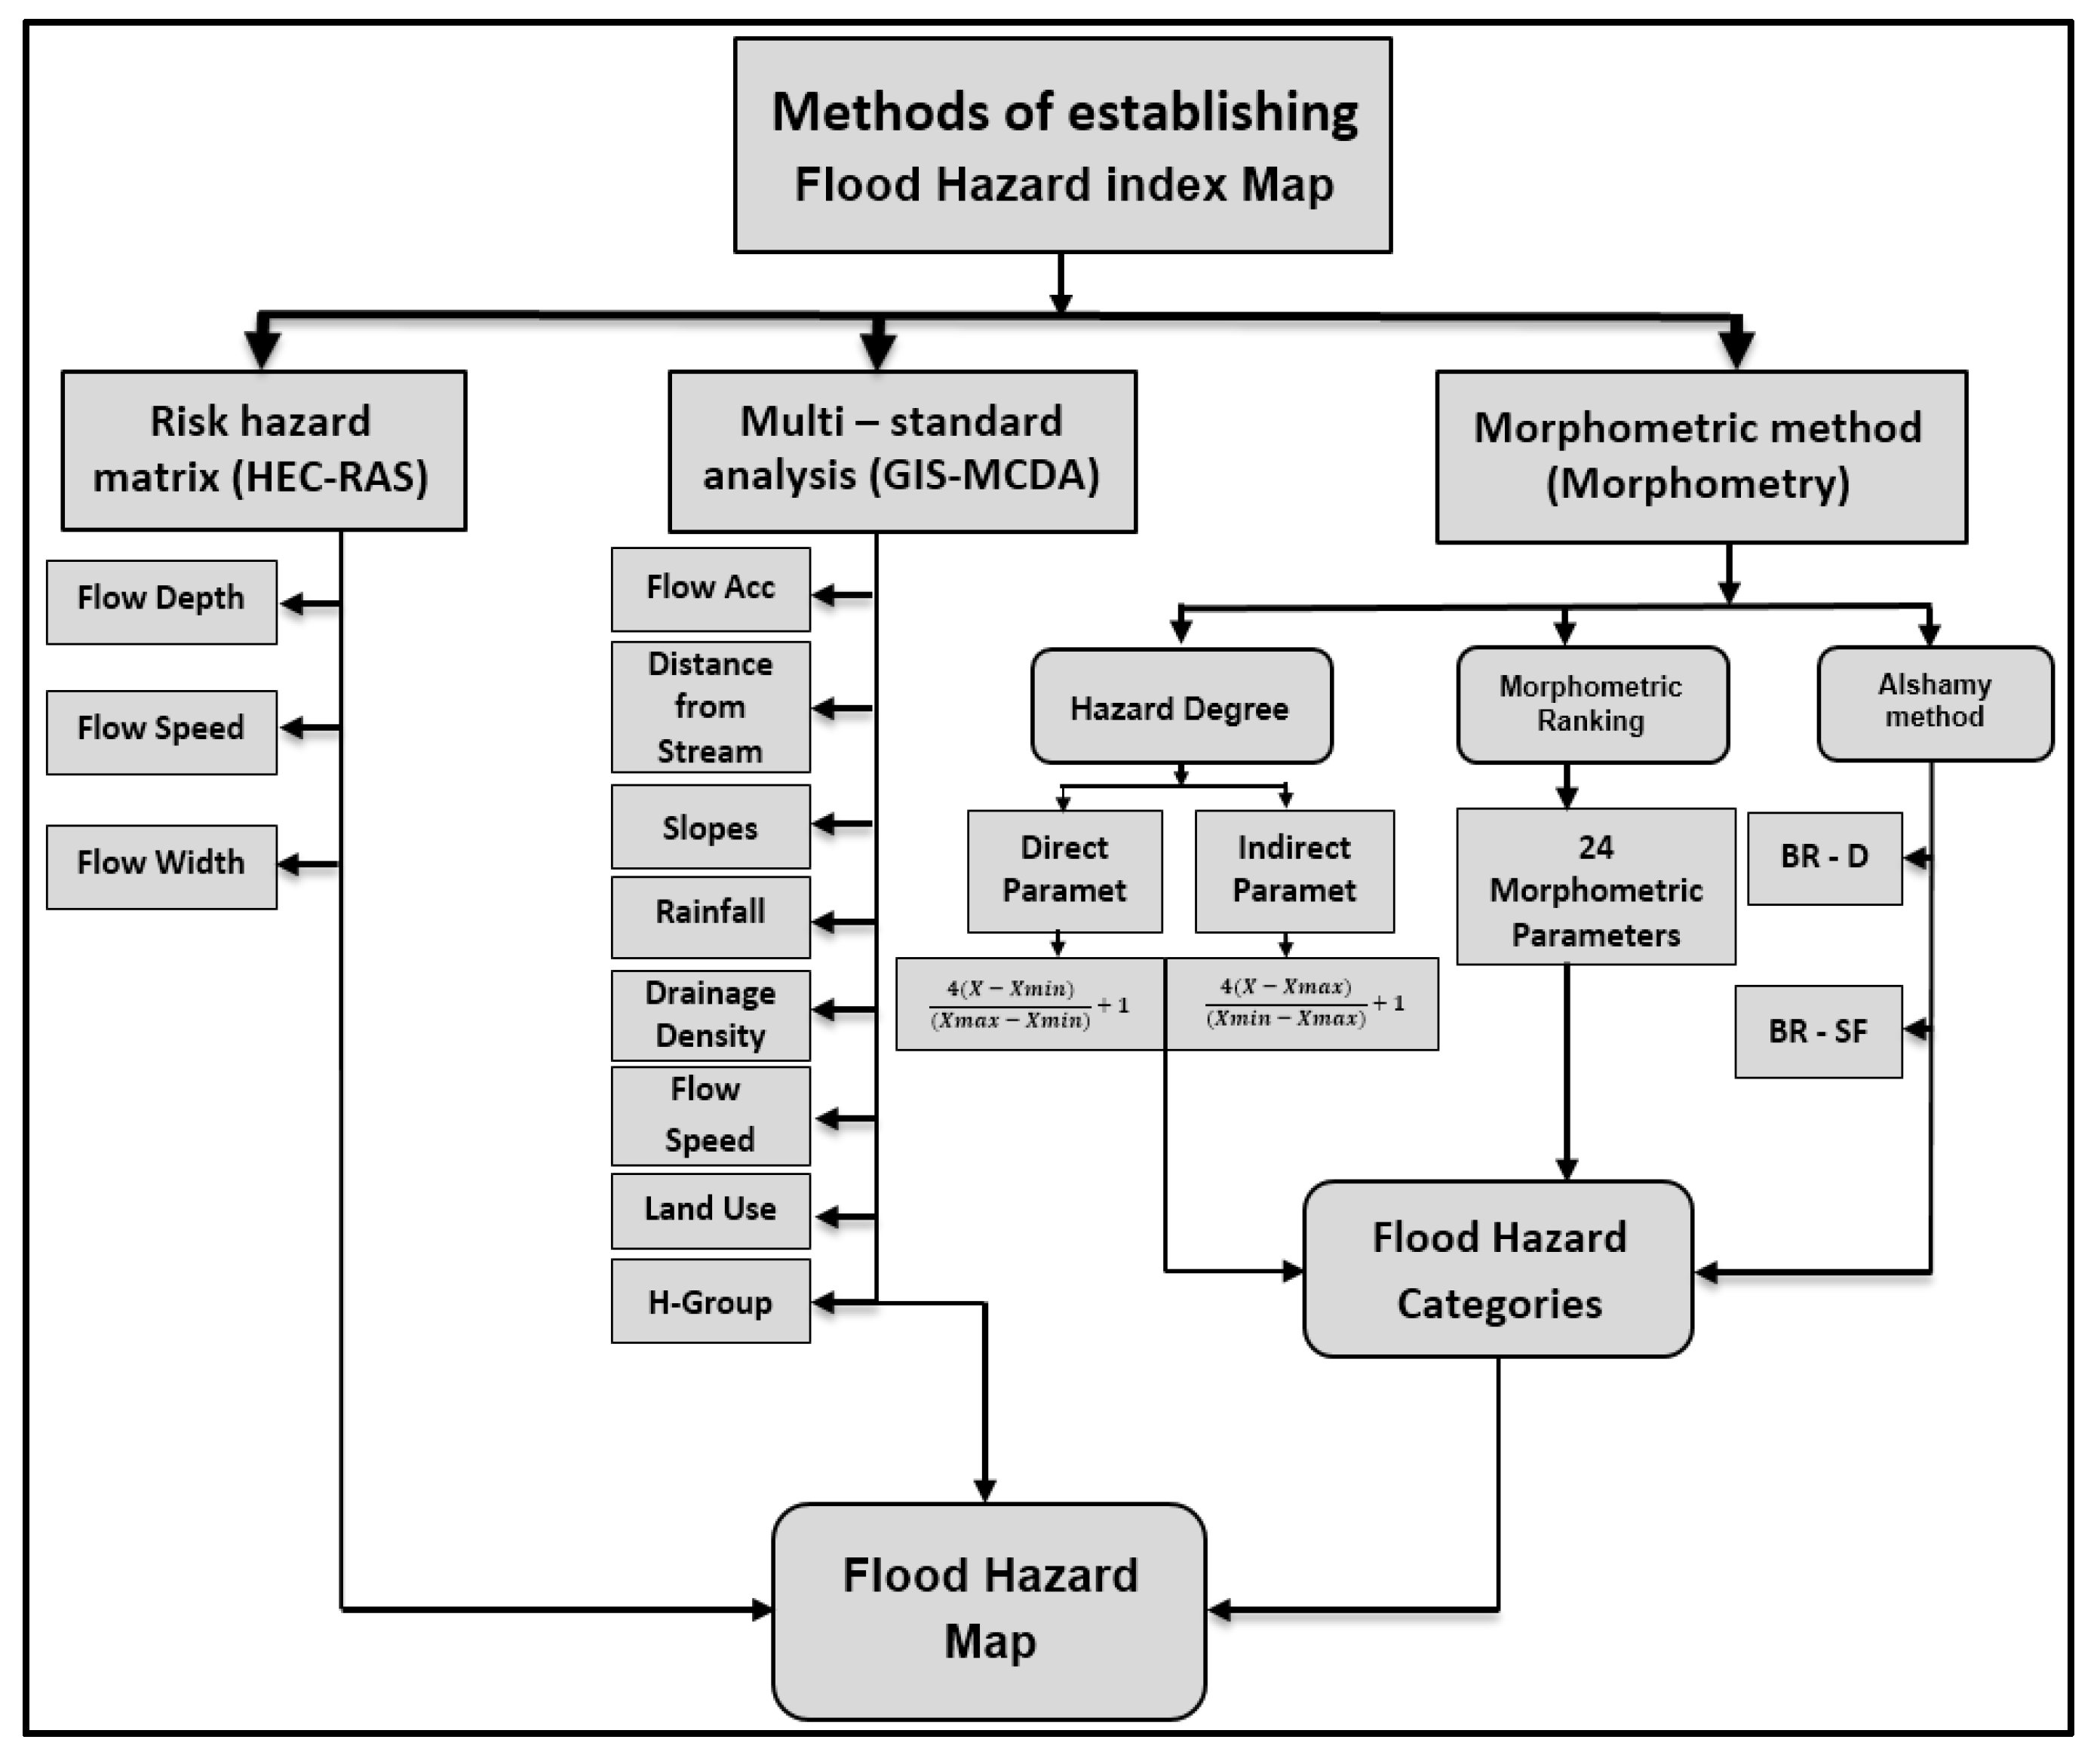
20] have used different methods and models to map natural hazards and assess the severity of sudden floods, and the five principal methods, according to the literature on flood risk modelling, are illustrated in Figure 1. Three of these methods are categorized under the morphometric methods in flood risk assessment: The Al-Shami method, the morphometric orders, and the severity level. These methods are suitable for the classification of the risks in the main and sub-basins, rather than for the classification of the risks in urban areas, and they are the most popular and most commonly applied in geographic research.
The fourth method is the multi-criteria analysis method, based on geographic information systems (GIS-MCDA), which is the method used most widely in geographic, schematic, and applied studies. It suits the modelling of the risk of flooding in urban areas, which depends on determining the criteria affecting the increased risk, and the criteria weights are based on the application of the hierarchical analysis method (AHP). A number of studies [21,22,23,24,25] showed that the AHP hierarchical analysis in the GIS environment is the most popular and the most powerful technique used in the production of flood risk maps, and it has a proper degree of accuracy and is suitable for other risk studies. Many AHP researchers describe it as an easy-to-use, cost-effective, and convenient way to assess flood risk.
The fifth method is known as the risk matrix method, which is based on the hydraulic modelling of the HEC-RAS program. It is considered as one of the most important and the best methods of modelling the risks of floods in urban areas, as it offers a two-dimensional model of the spread, depth, and velocity of the floods. These properties are not available in the single-dimensional model of the flood runoff [26,27,28,29]. While flood risk maps can be produced in multiple ways, the basic process is to use the results of the immersion analysis from single-dimensional or two-dimensional hydraulic models.
The two-dimensional immersion model is more useful than the one-dimensional model in the creation of advanced flood risk maps that are used to predict flood damage in urban areas, as the two-dimensional models can produce spatially distributed information, including the flood depth and velocity, in an area that has been exposed to flooding [30,31,32,33].
The present study used a two-dimensional hydraulic modelling risk matrix analysis method, and the hydraulic modelling of the HEC-RAS program demonstrated a high efficiency in presenting a two-dimensional model of the spread, depth, and speed of the flood water. These characteristics are not available in the one-dimensional model of the floodwaters, and the two-dimensional model has the ability to identify urban areas prone to flooding and propose design strategies. To mitigate the effects of potential flooding is of great importance for political and planning decision-makers.
This study was conducted to assess the impact of the sudden flooding of the Wadi Nu’man basin on urban areas, east of Mecca, which are exposed to frequent floods. This area is of great importance for political and planning decision-makers due to the existence of several vital places: Mash’ar Arafa, in which about 3.5 million people gather annually to perform Hajj; the headquarters of the University of Umm Al-Qura in Al-Abedia; the populous district of Al-Awali; the Al-Husseinieh area, which is a place of agricultural and residential importance; and the railway station of Al-Mash’ar Al-Haram, between Arafa and Mena. Moreover, the most important arterial roads between Mecca and Mash’ar Arafa, and between Mecca and Al-Taif, lie in this area, in addition to several modern urban complexes and residential schemes. The main objective of this study is to assess the risk of the floods in the Wadi Nu’man basin of Mecca, Saudi Arabia, during the period from 1988–2019, based on the integration of geomatics and hydraulic modelling. This is achieved by determining the extent of floods in the Wadi Nu’man basin and identifying areas prone to flood, as well as linking them to the residential expansions that occurred during the period from 1988–2019.
An innovative approach was used for the Kingdom of Saudi Arabia, based on a combination of geographic information systems (GIS), remote sensing (RS), the watershed modelling system (WMS), the hydrological modelling program of the hydrological engineers program (HEC-HMS), and the analytical system of rivers at the Center of Hydraulic Engineering (HEC-RAS). Alternative preventive measures in the area under study were proposed to help mitigate the impact of sudden floods of Wadi Nu’man on Al-Masha’er Al-Muqadasa, Umm Al-Qura university, and modern housing schemes.

2. Study Area

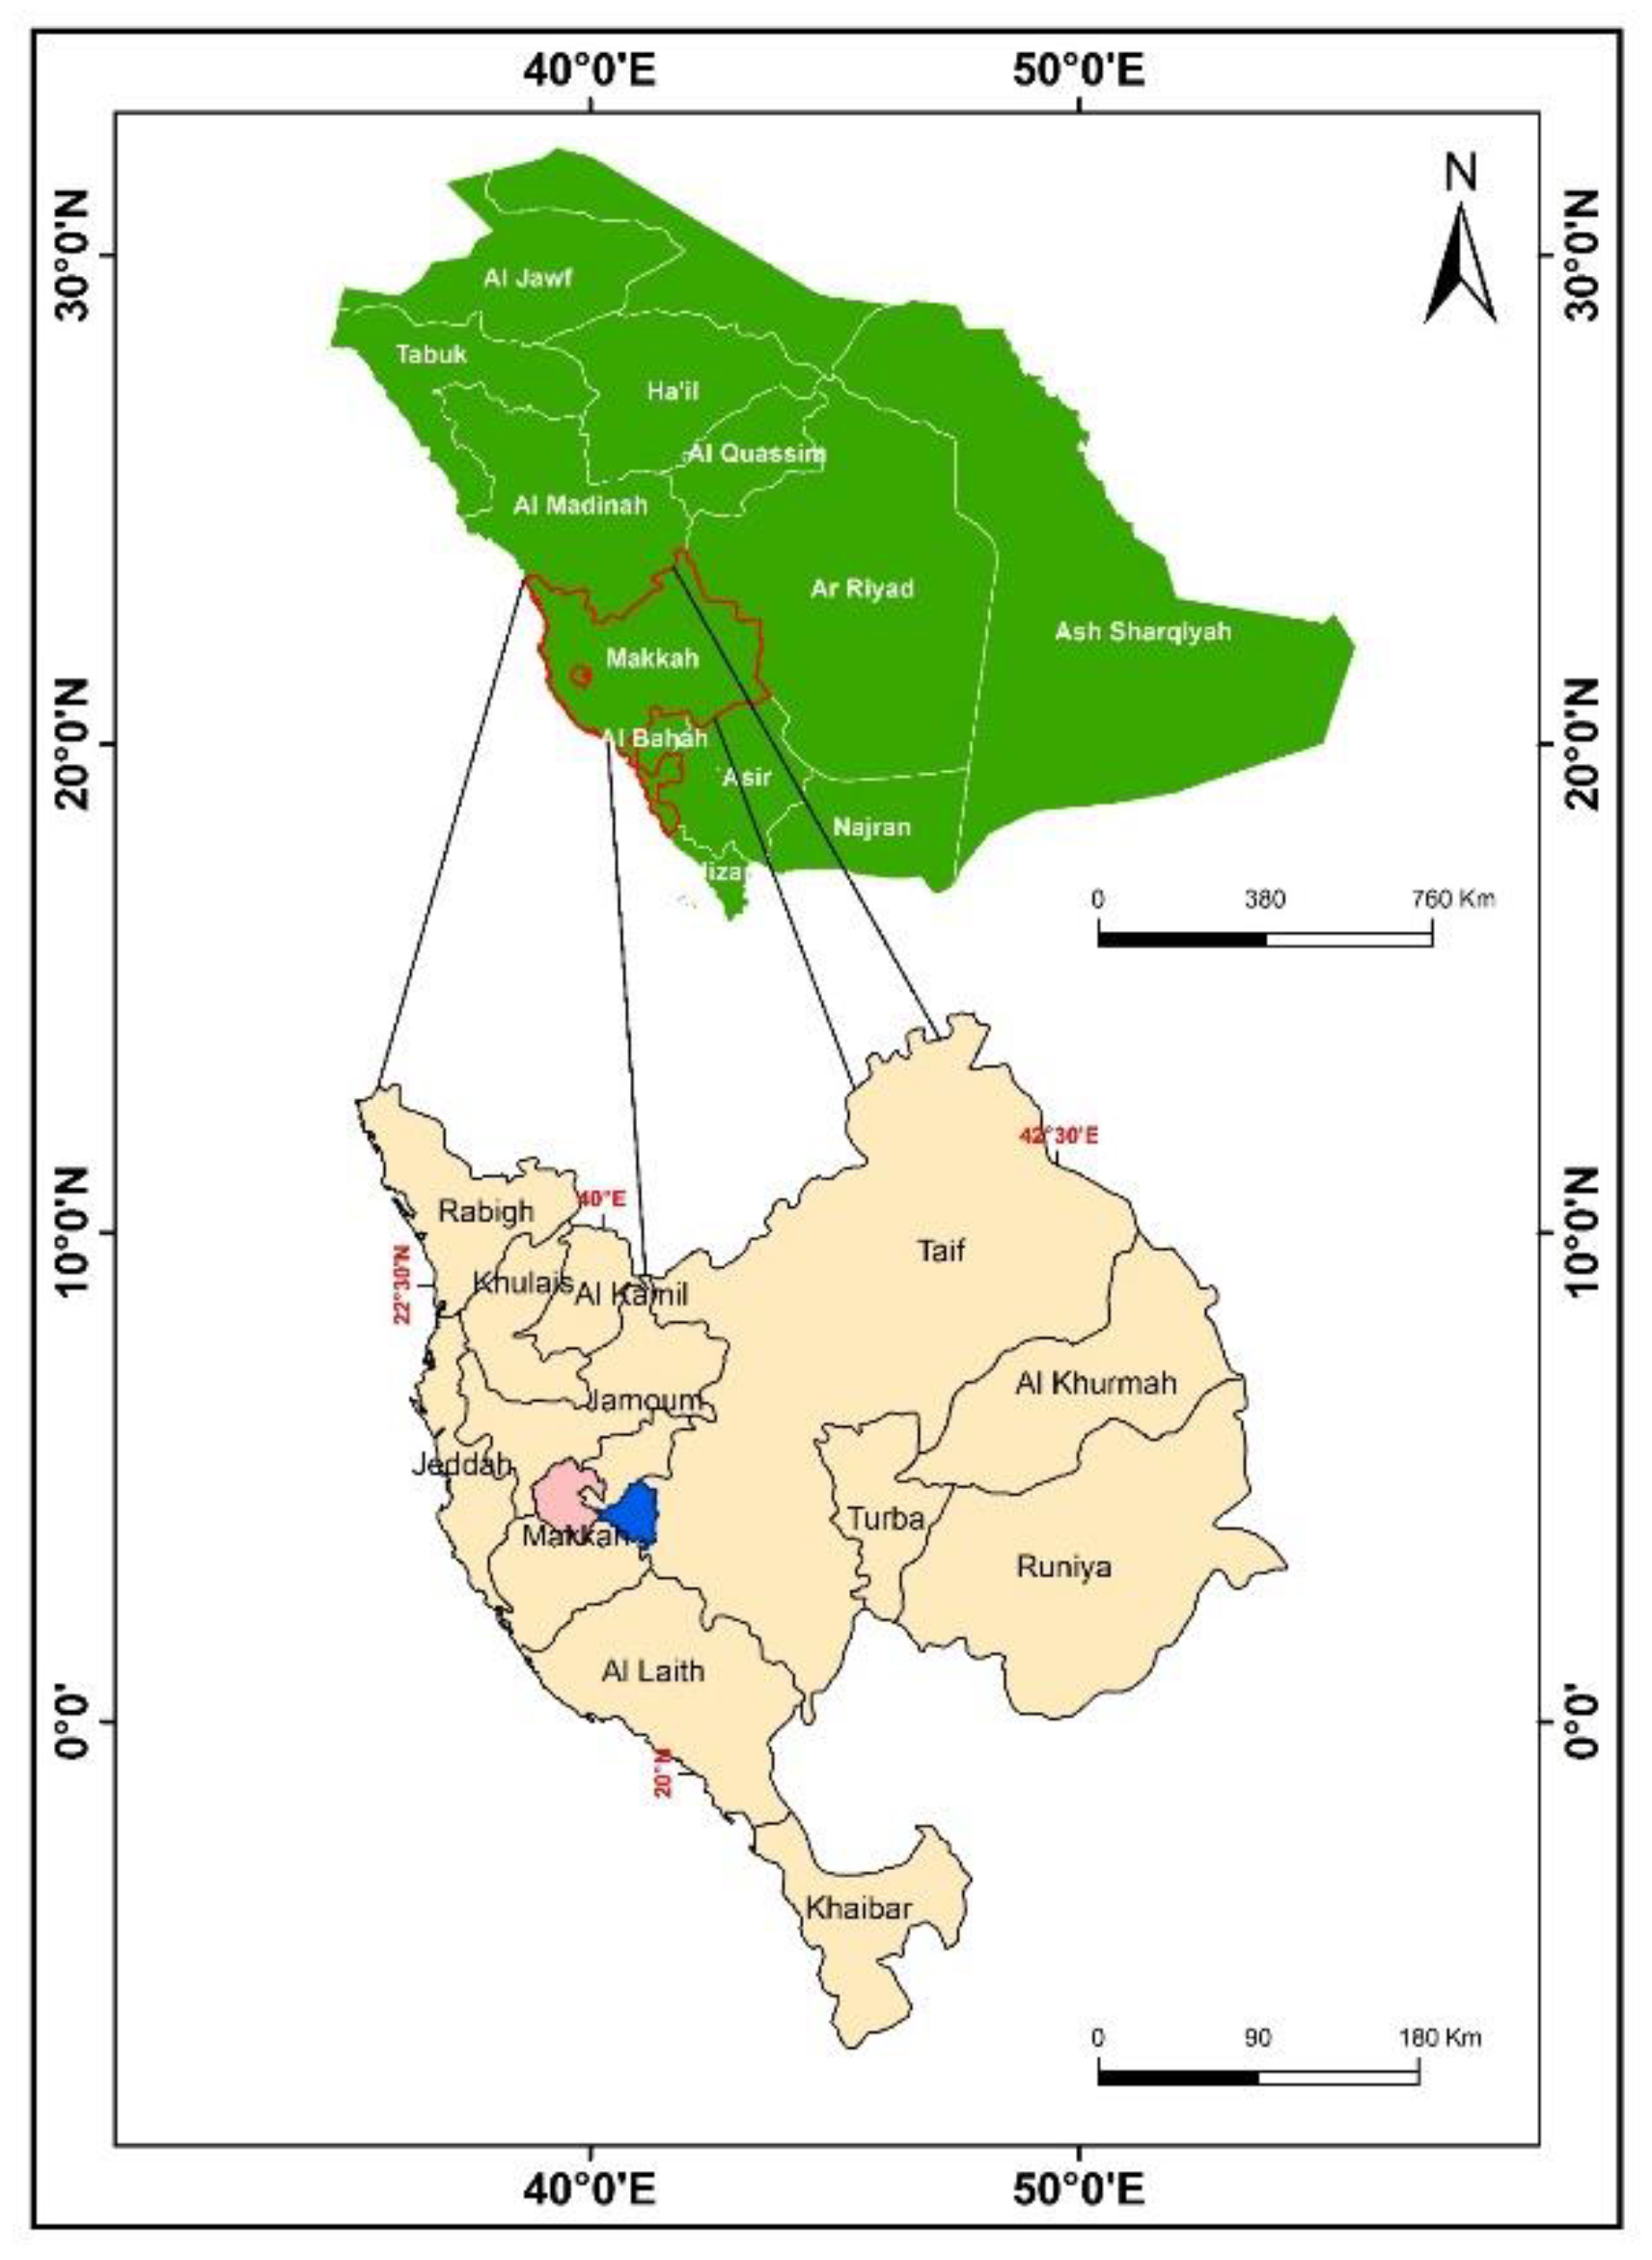
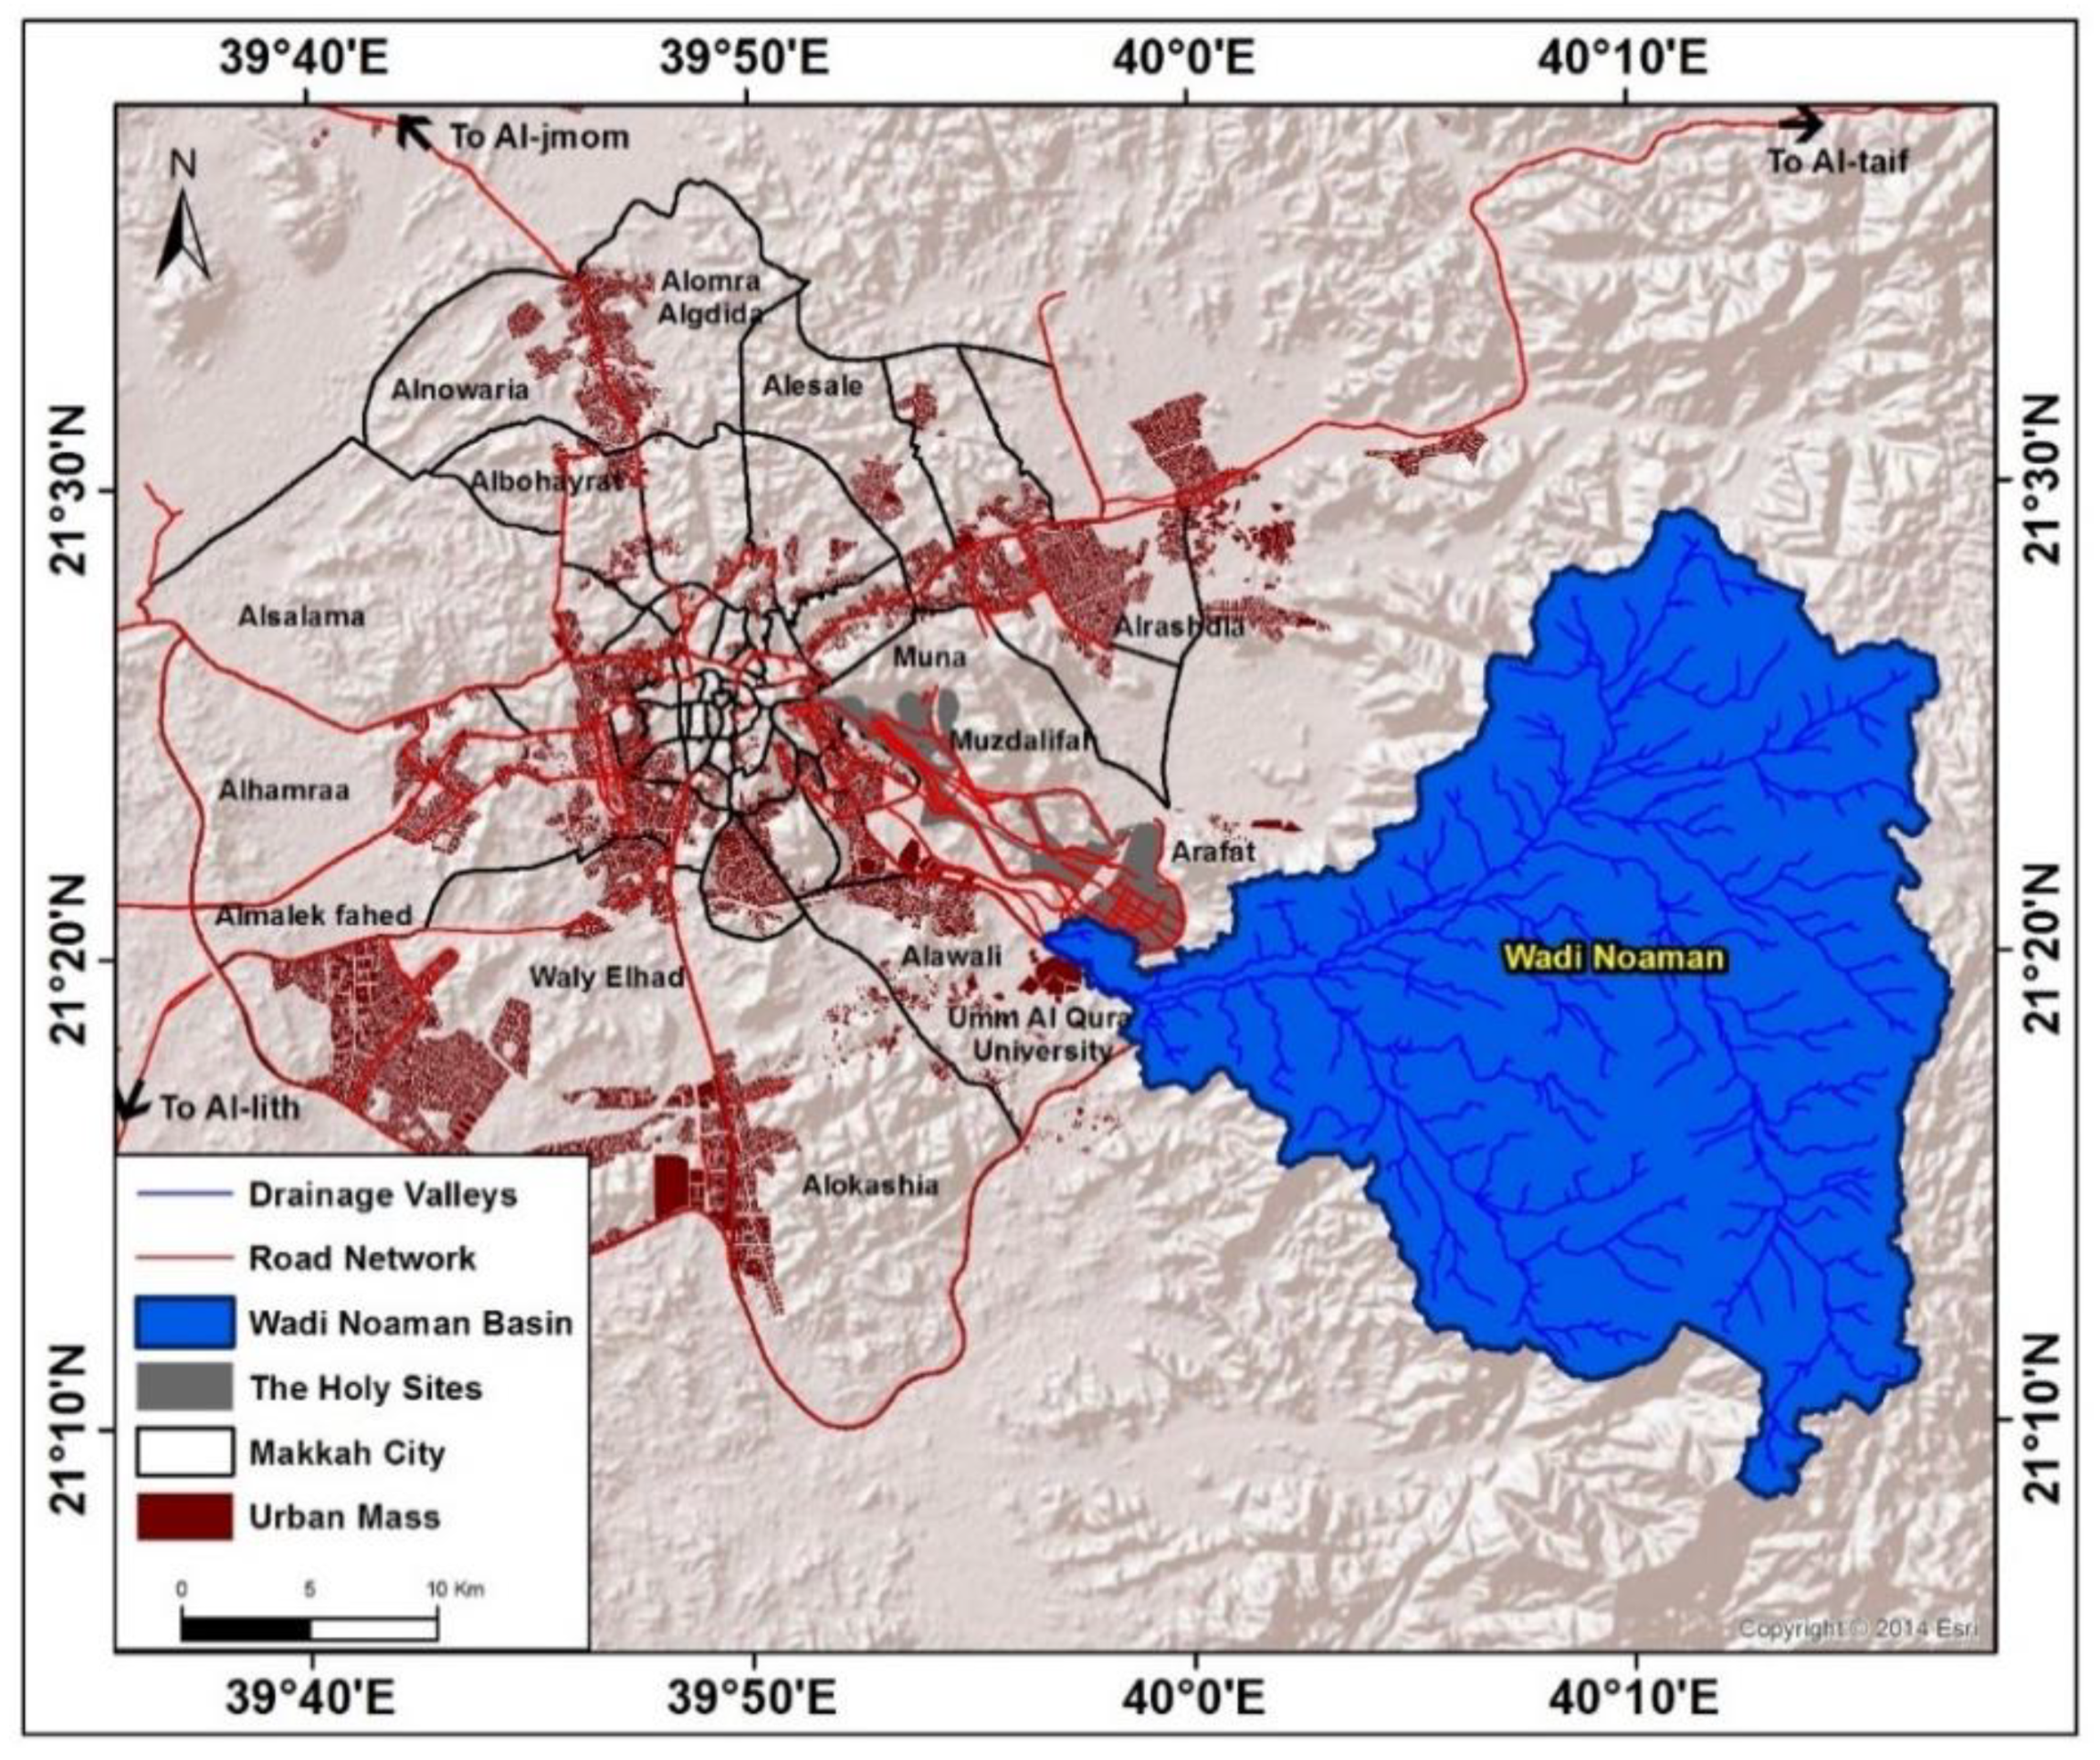
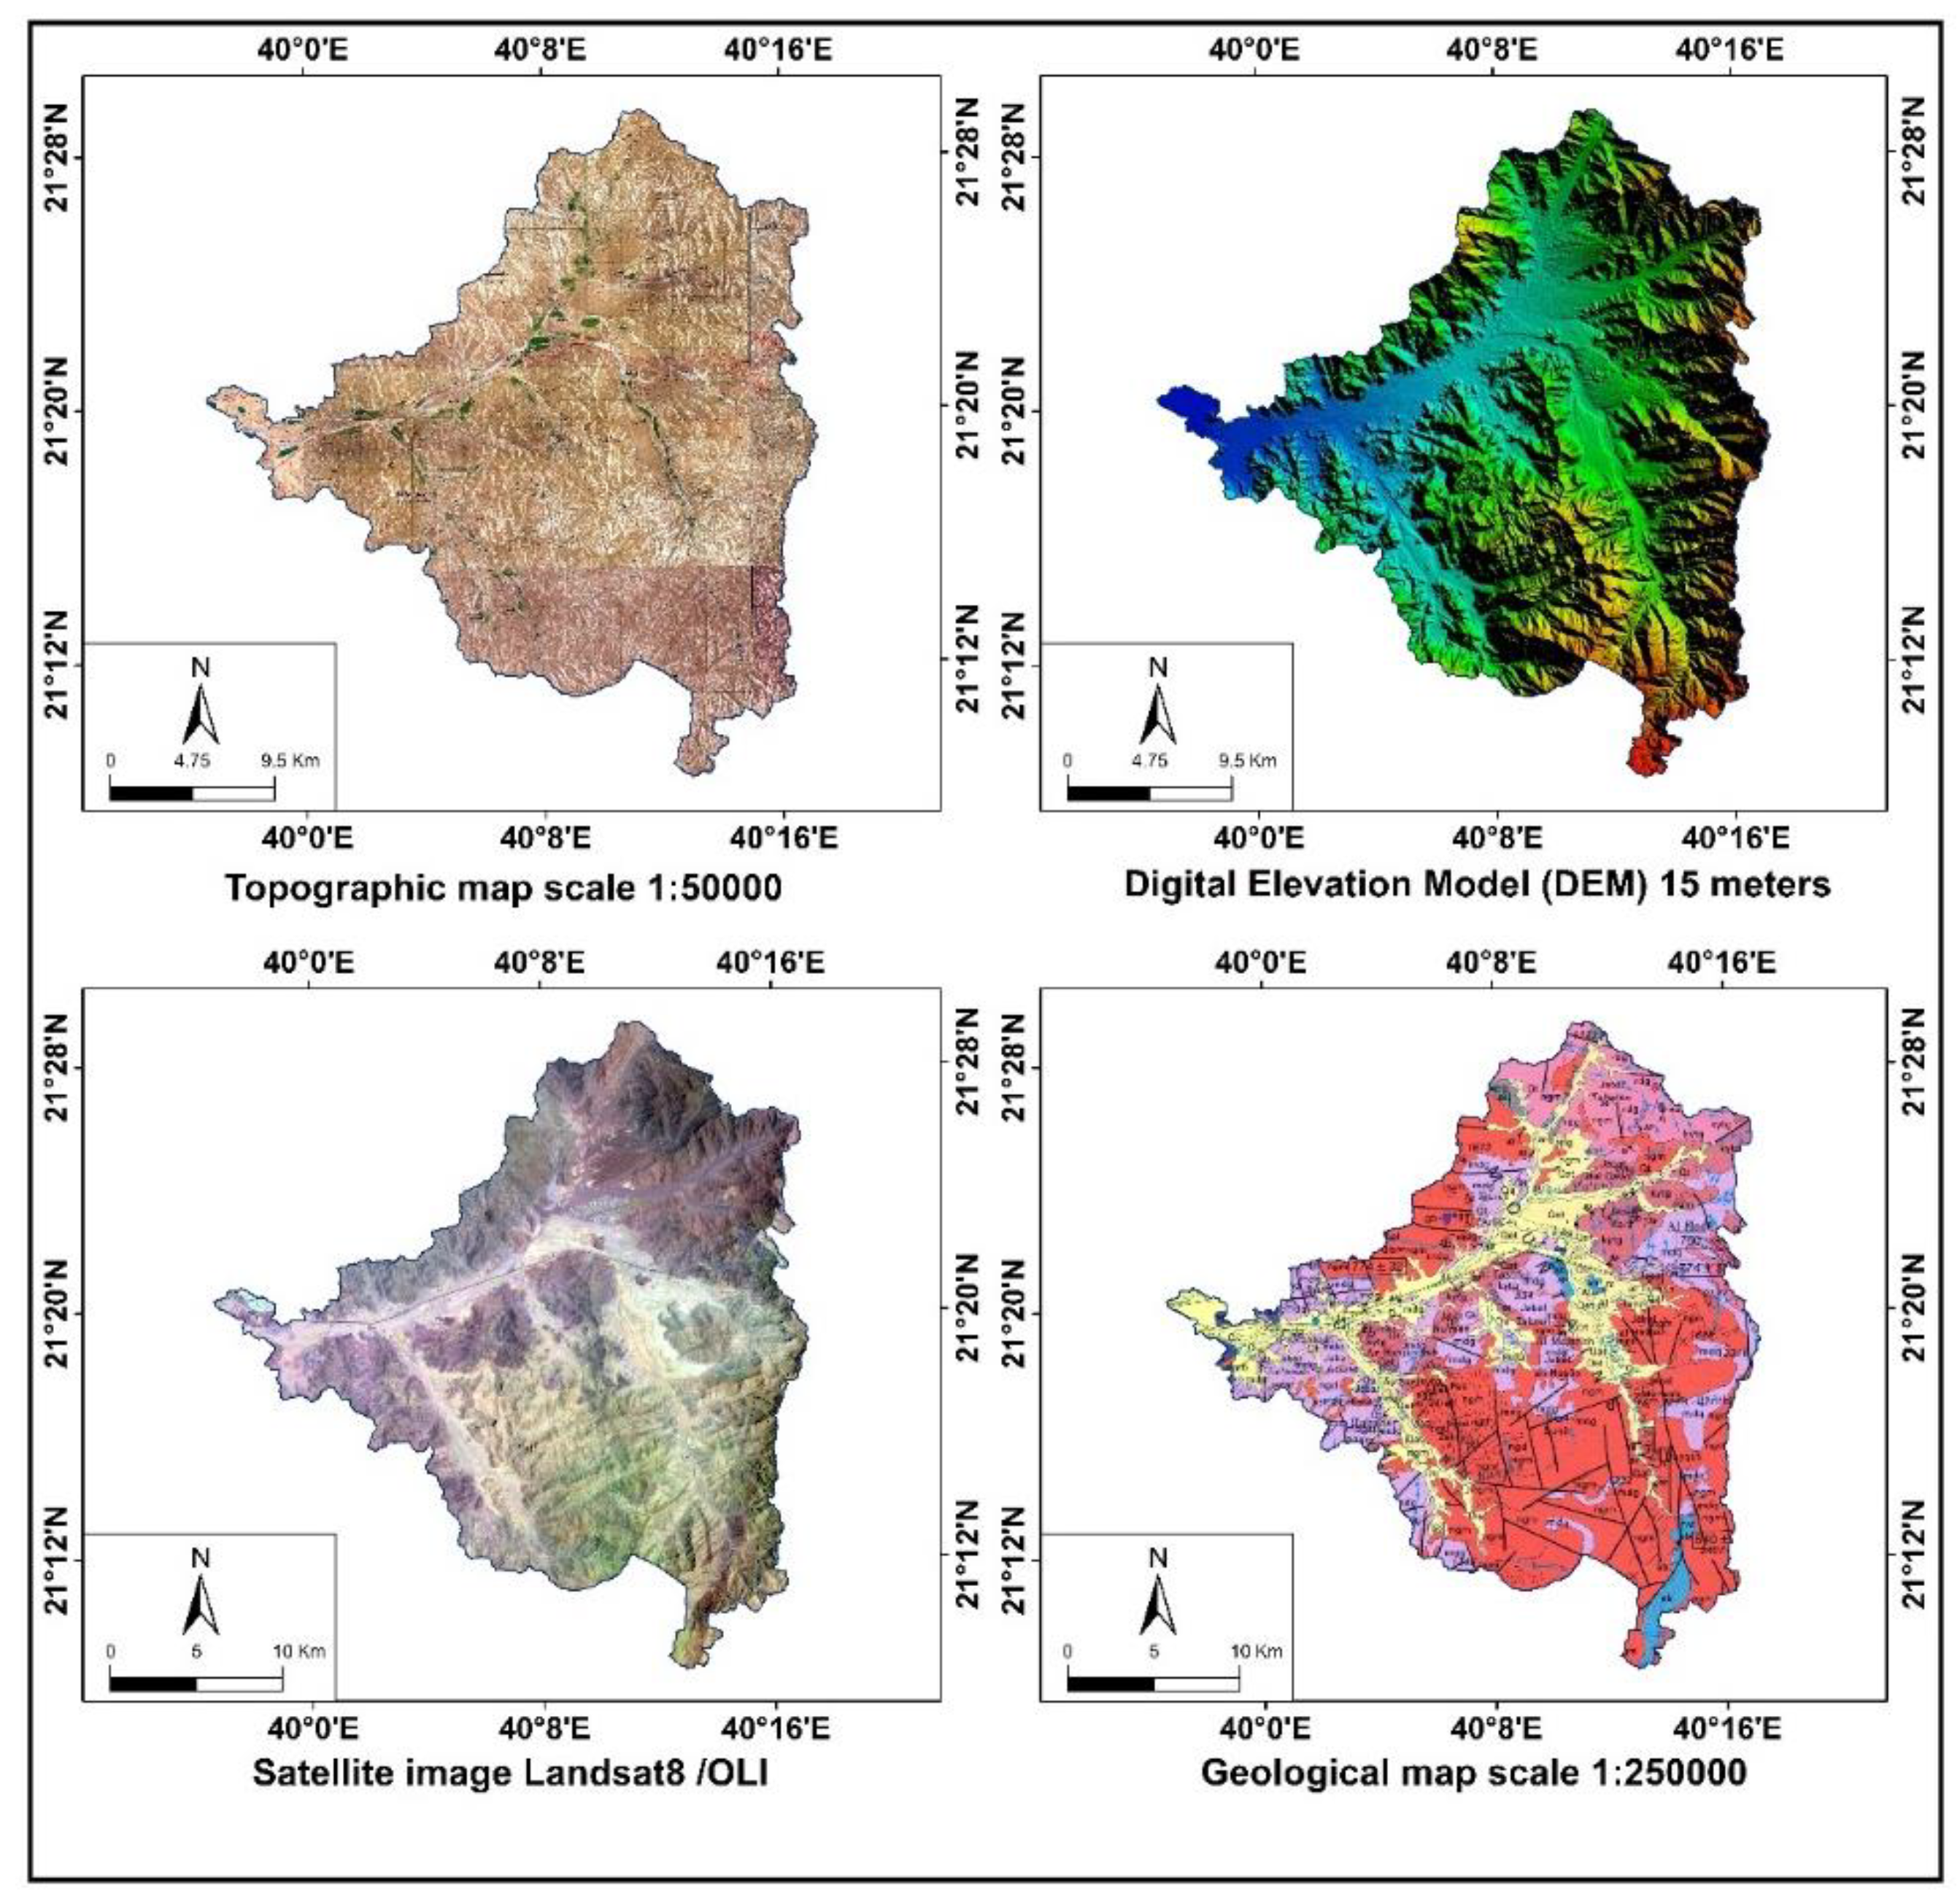
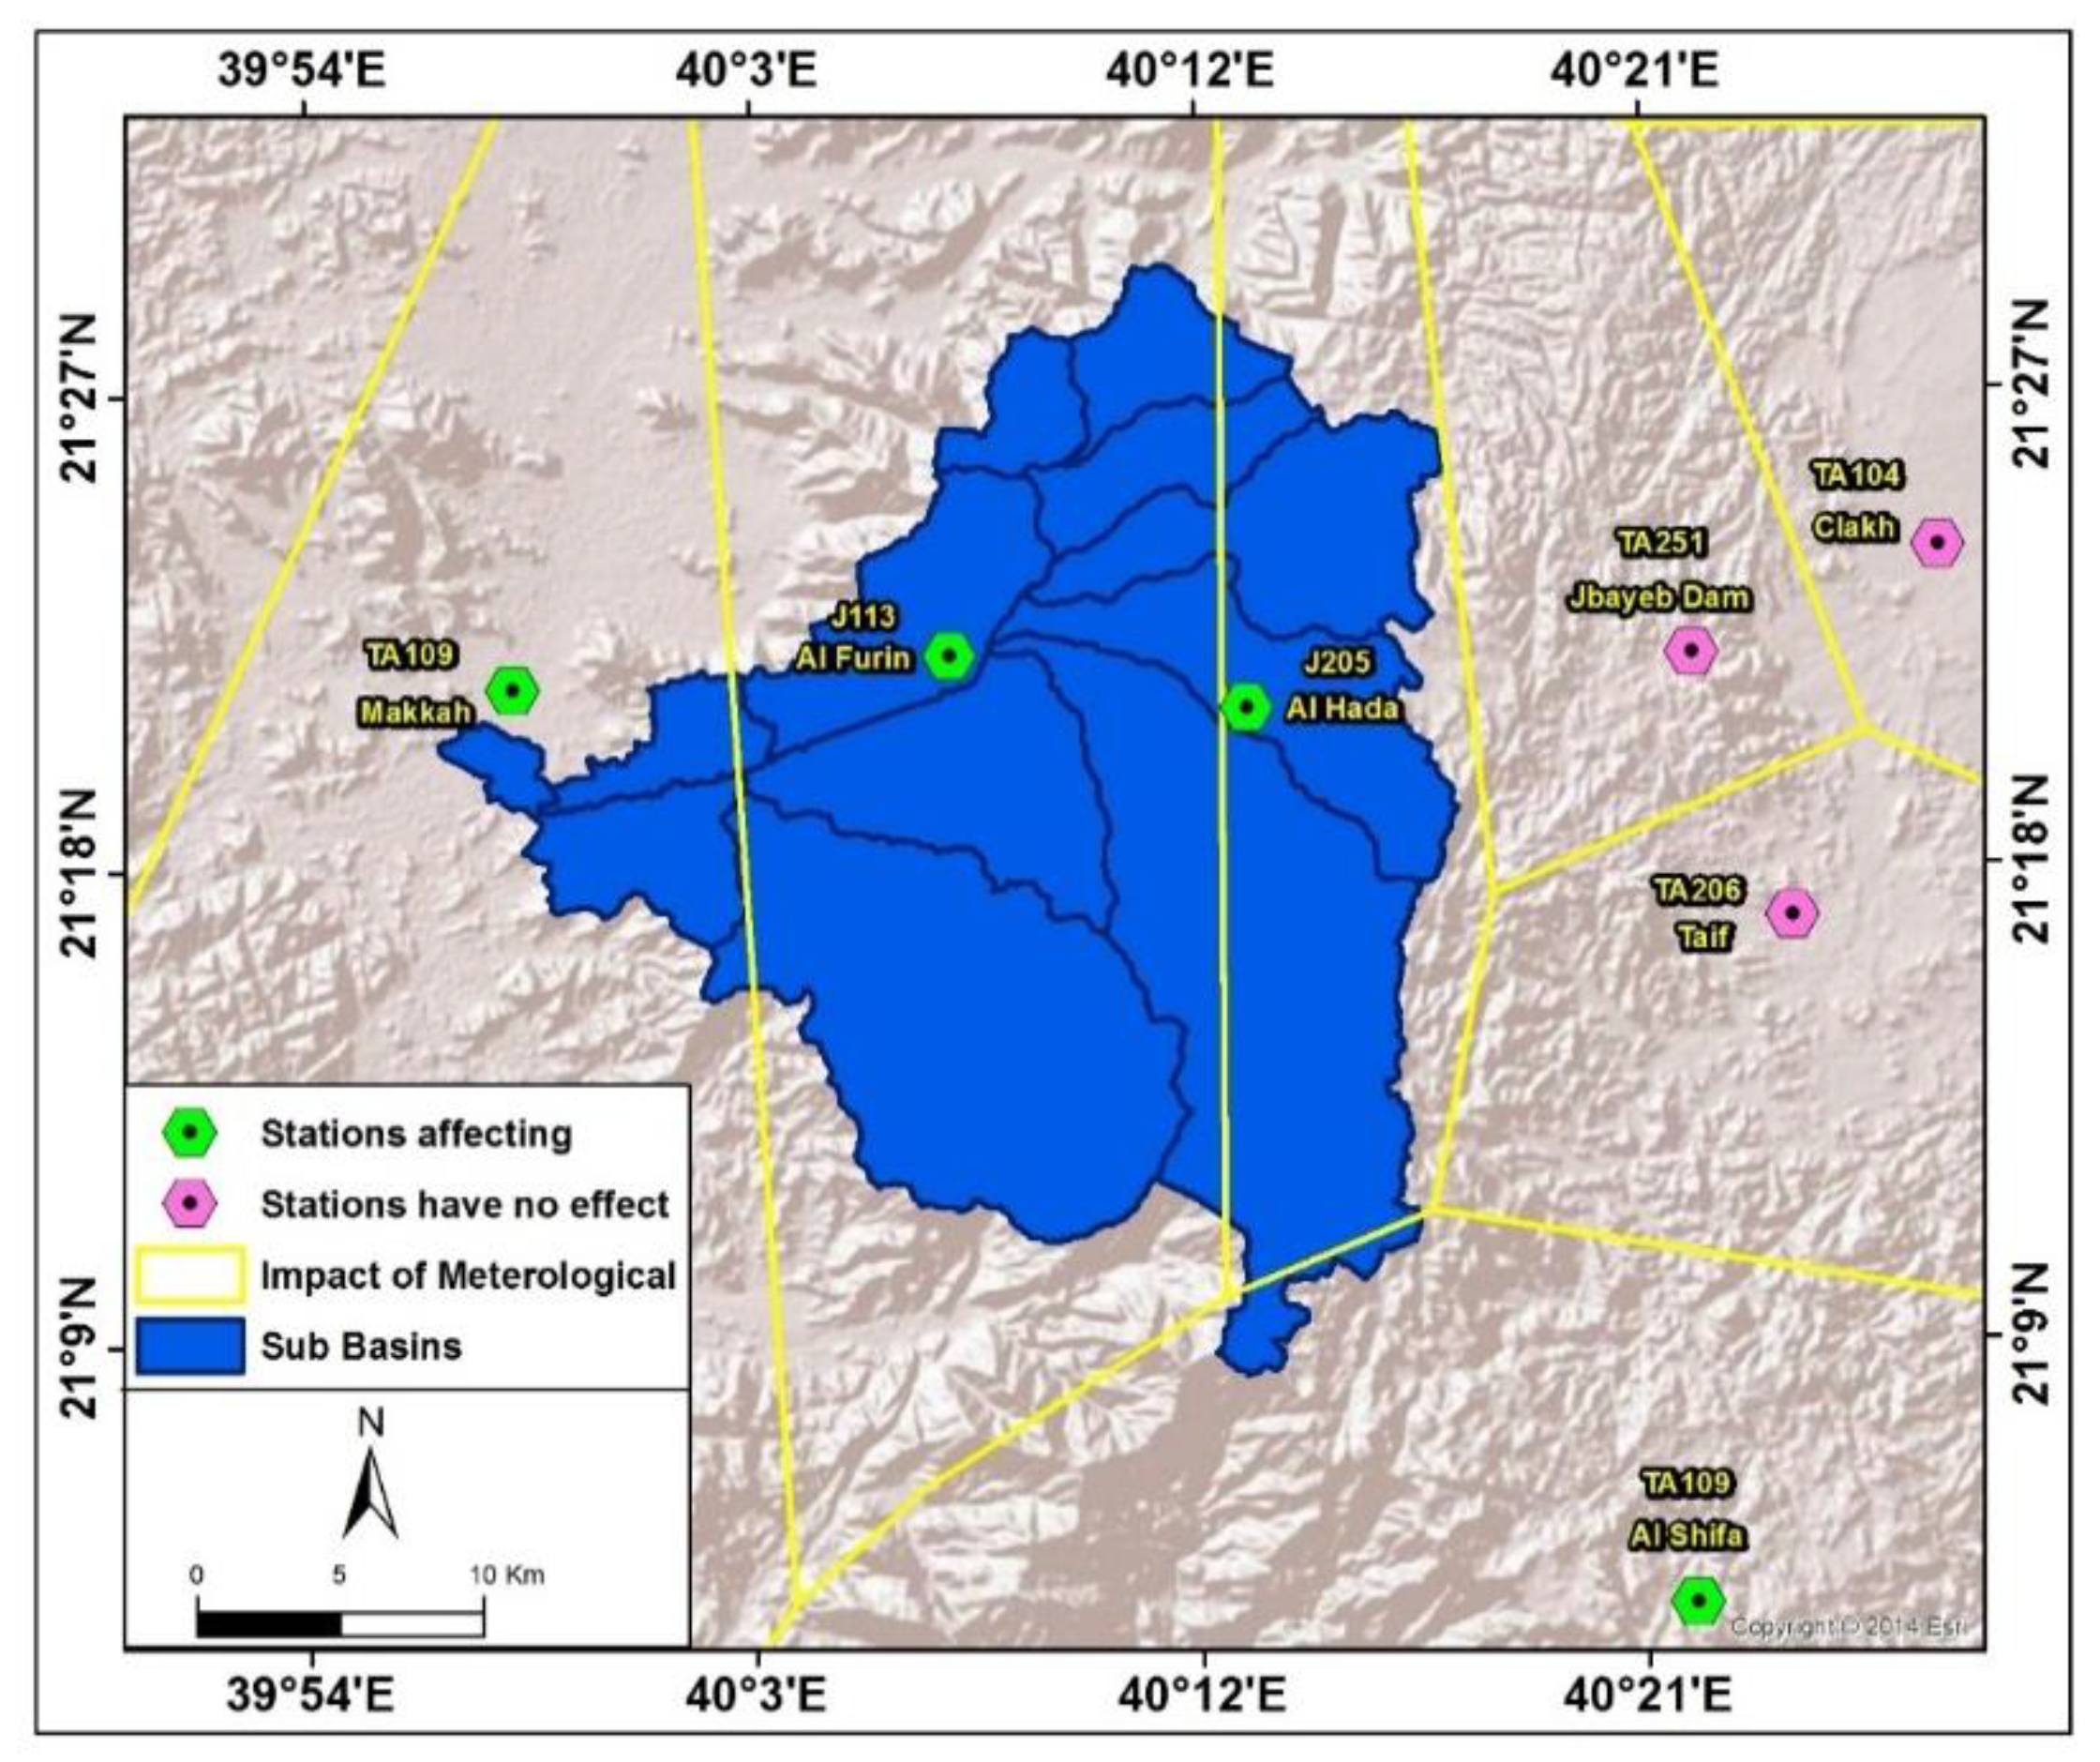
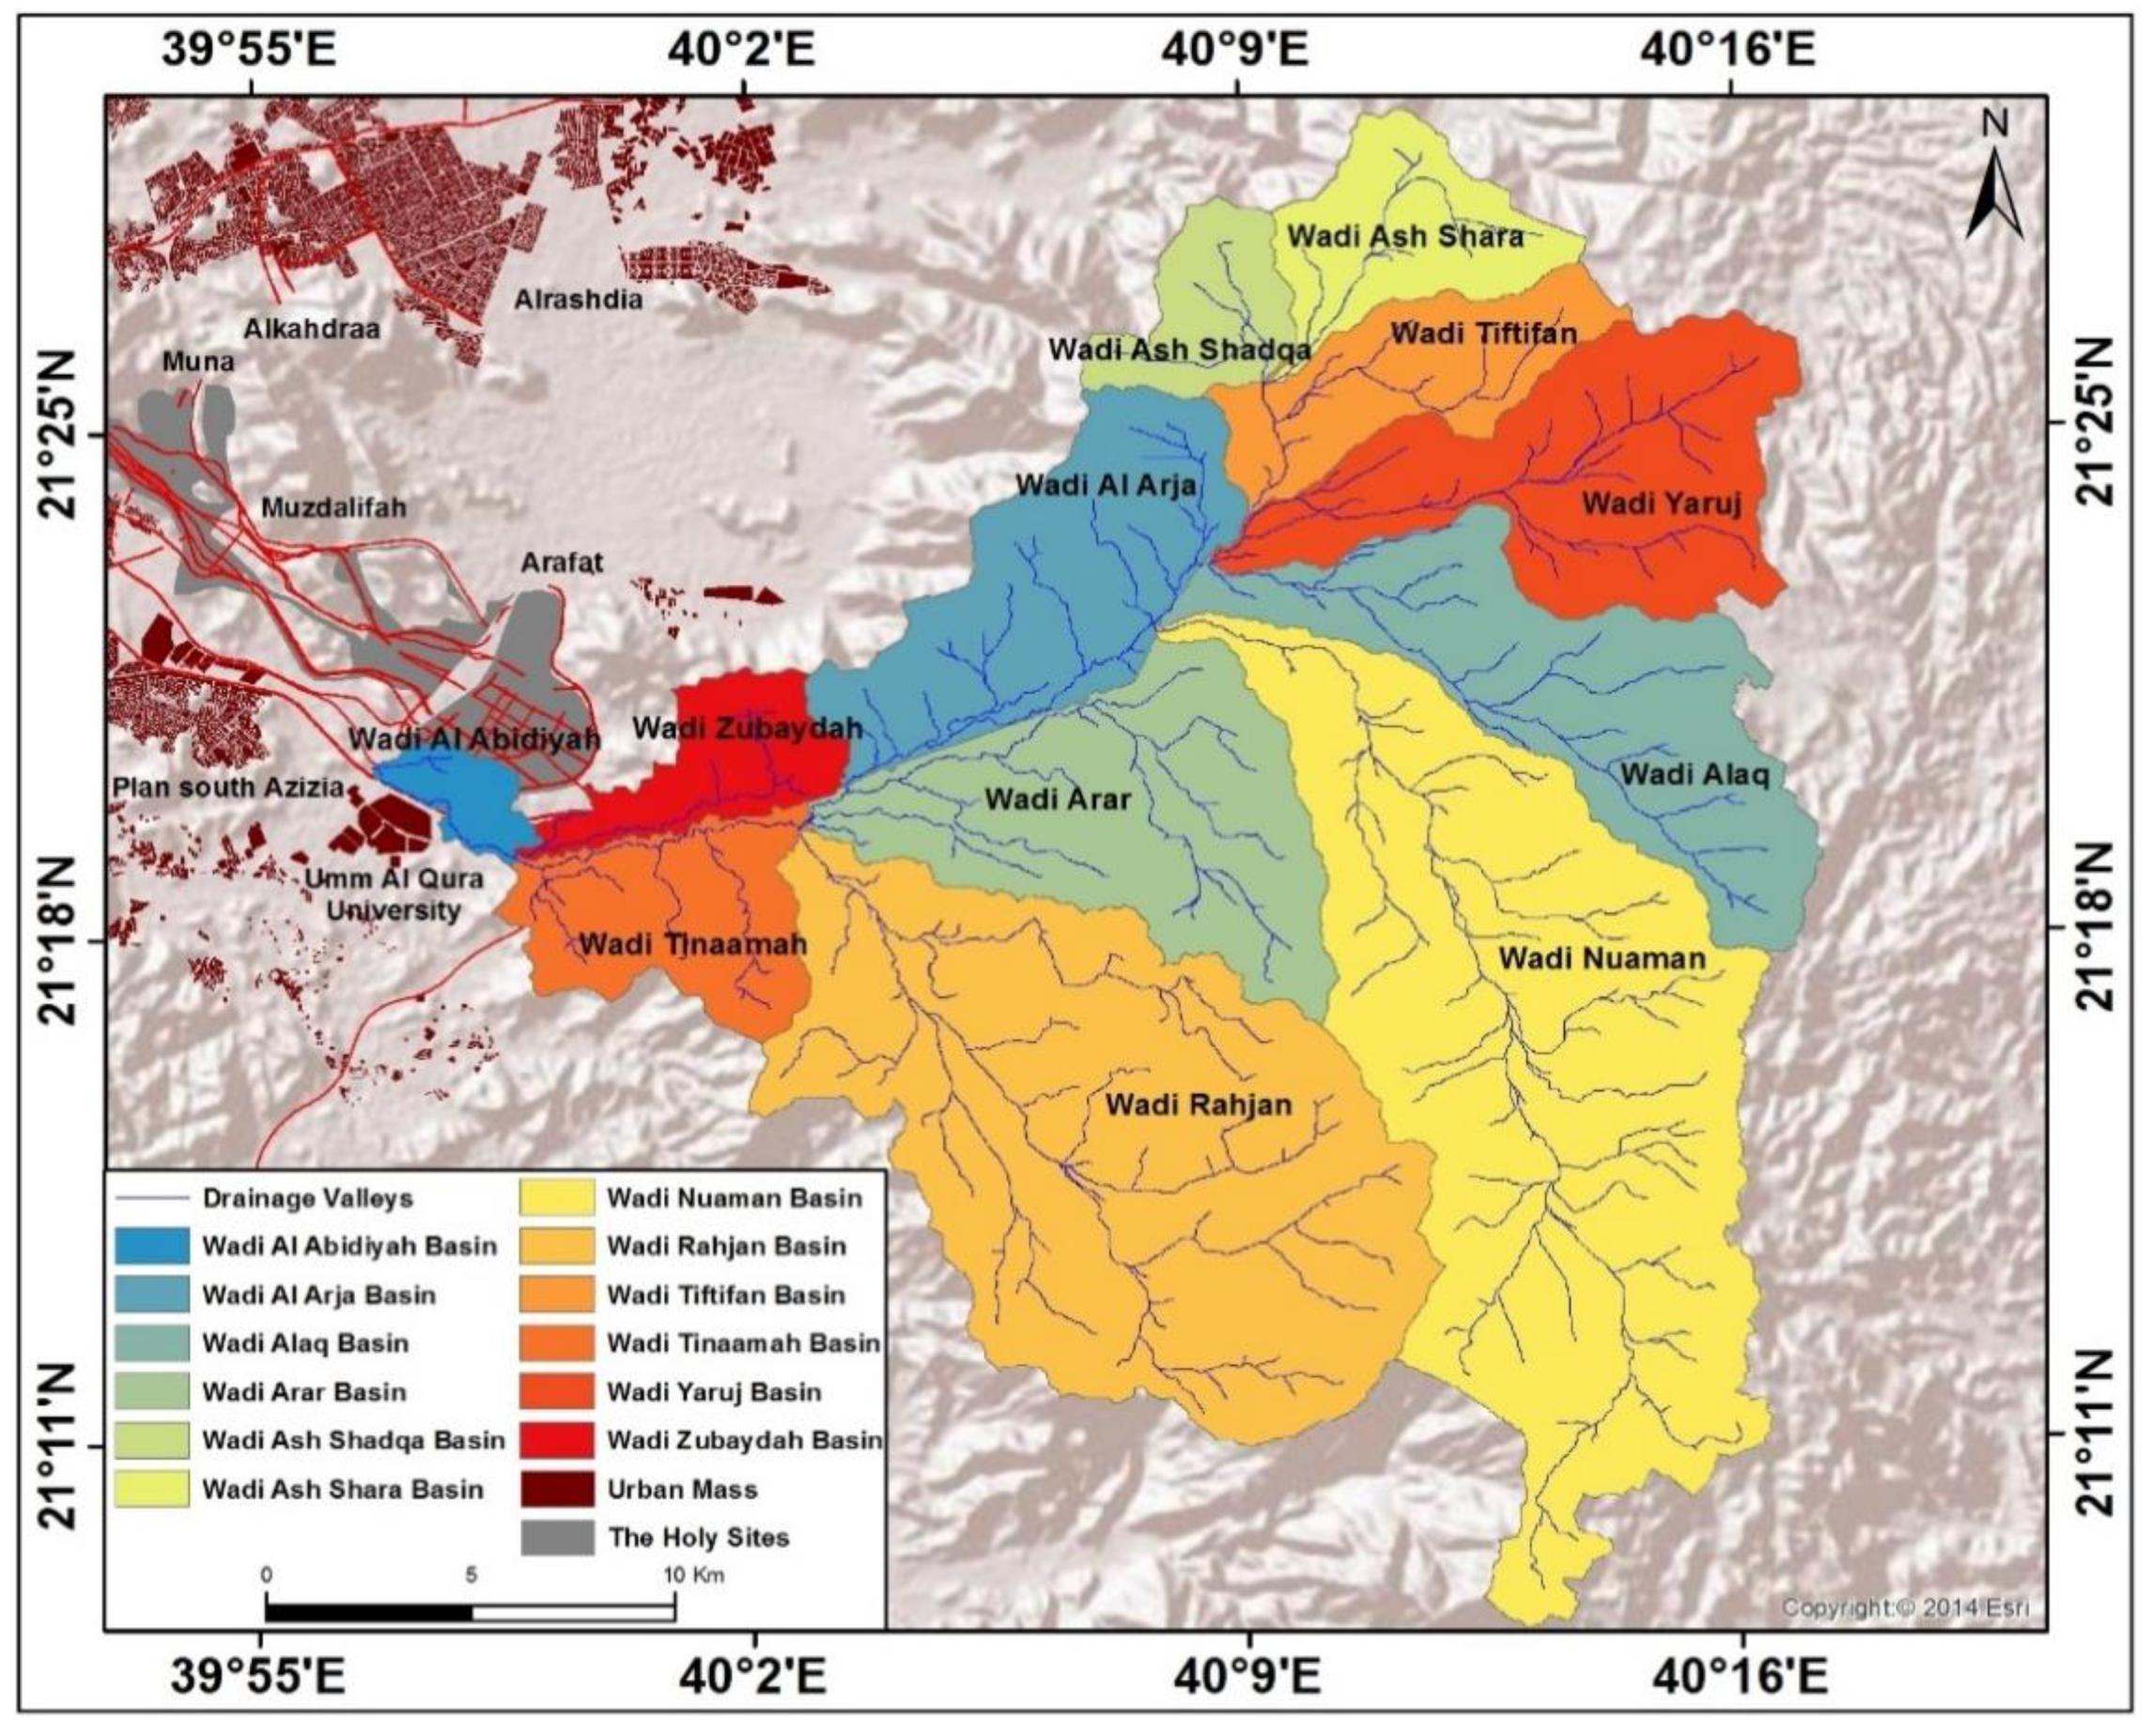
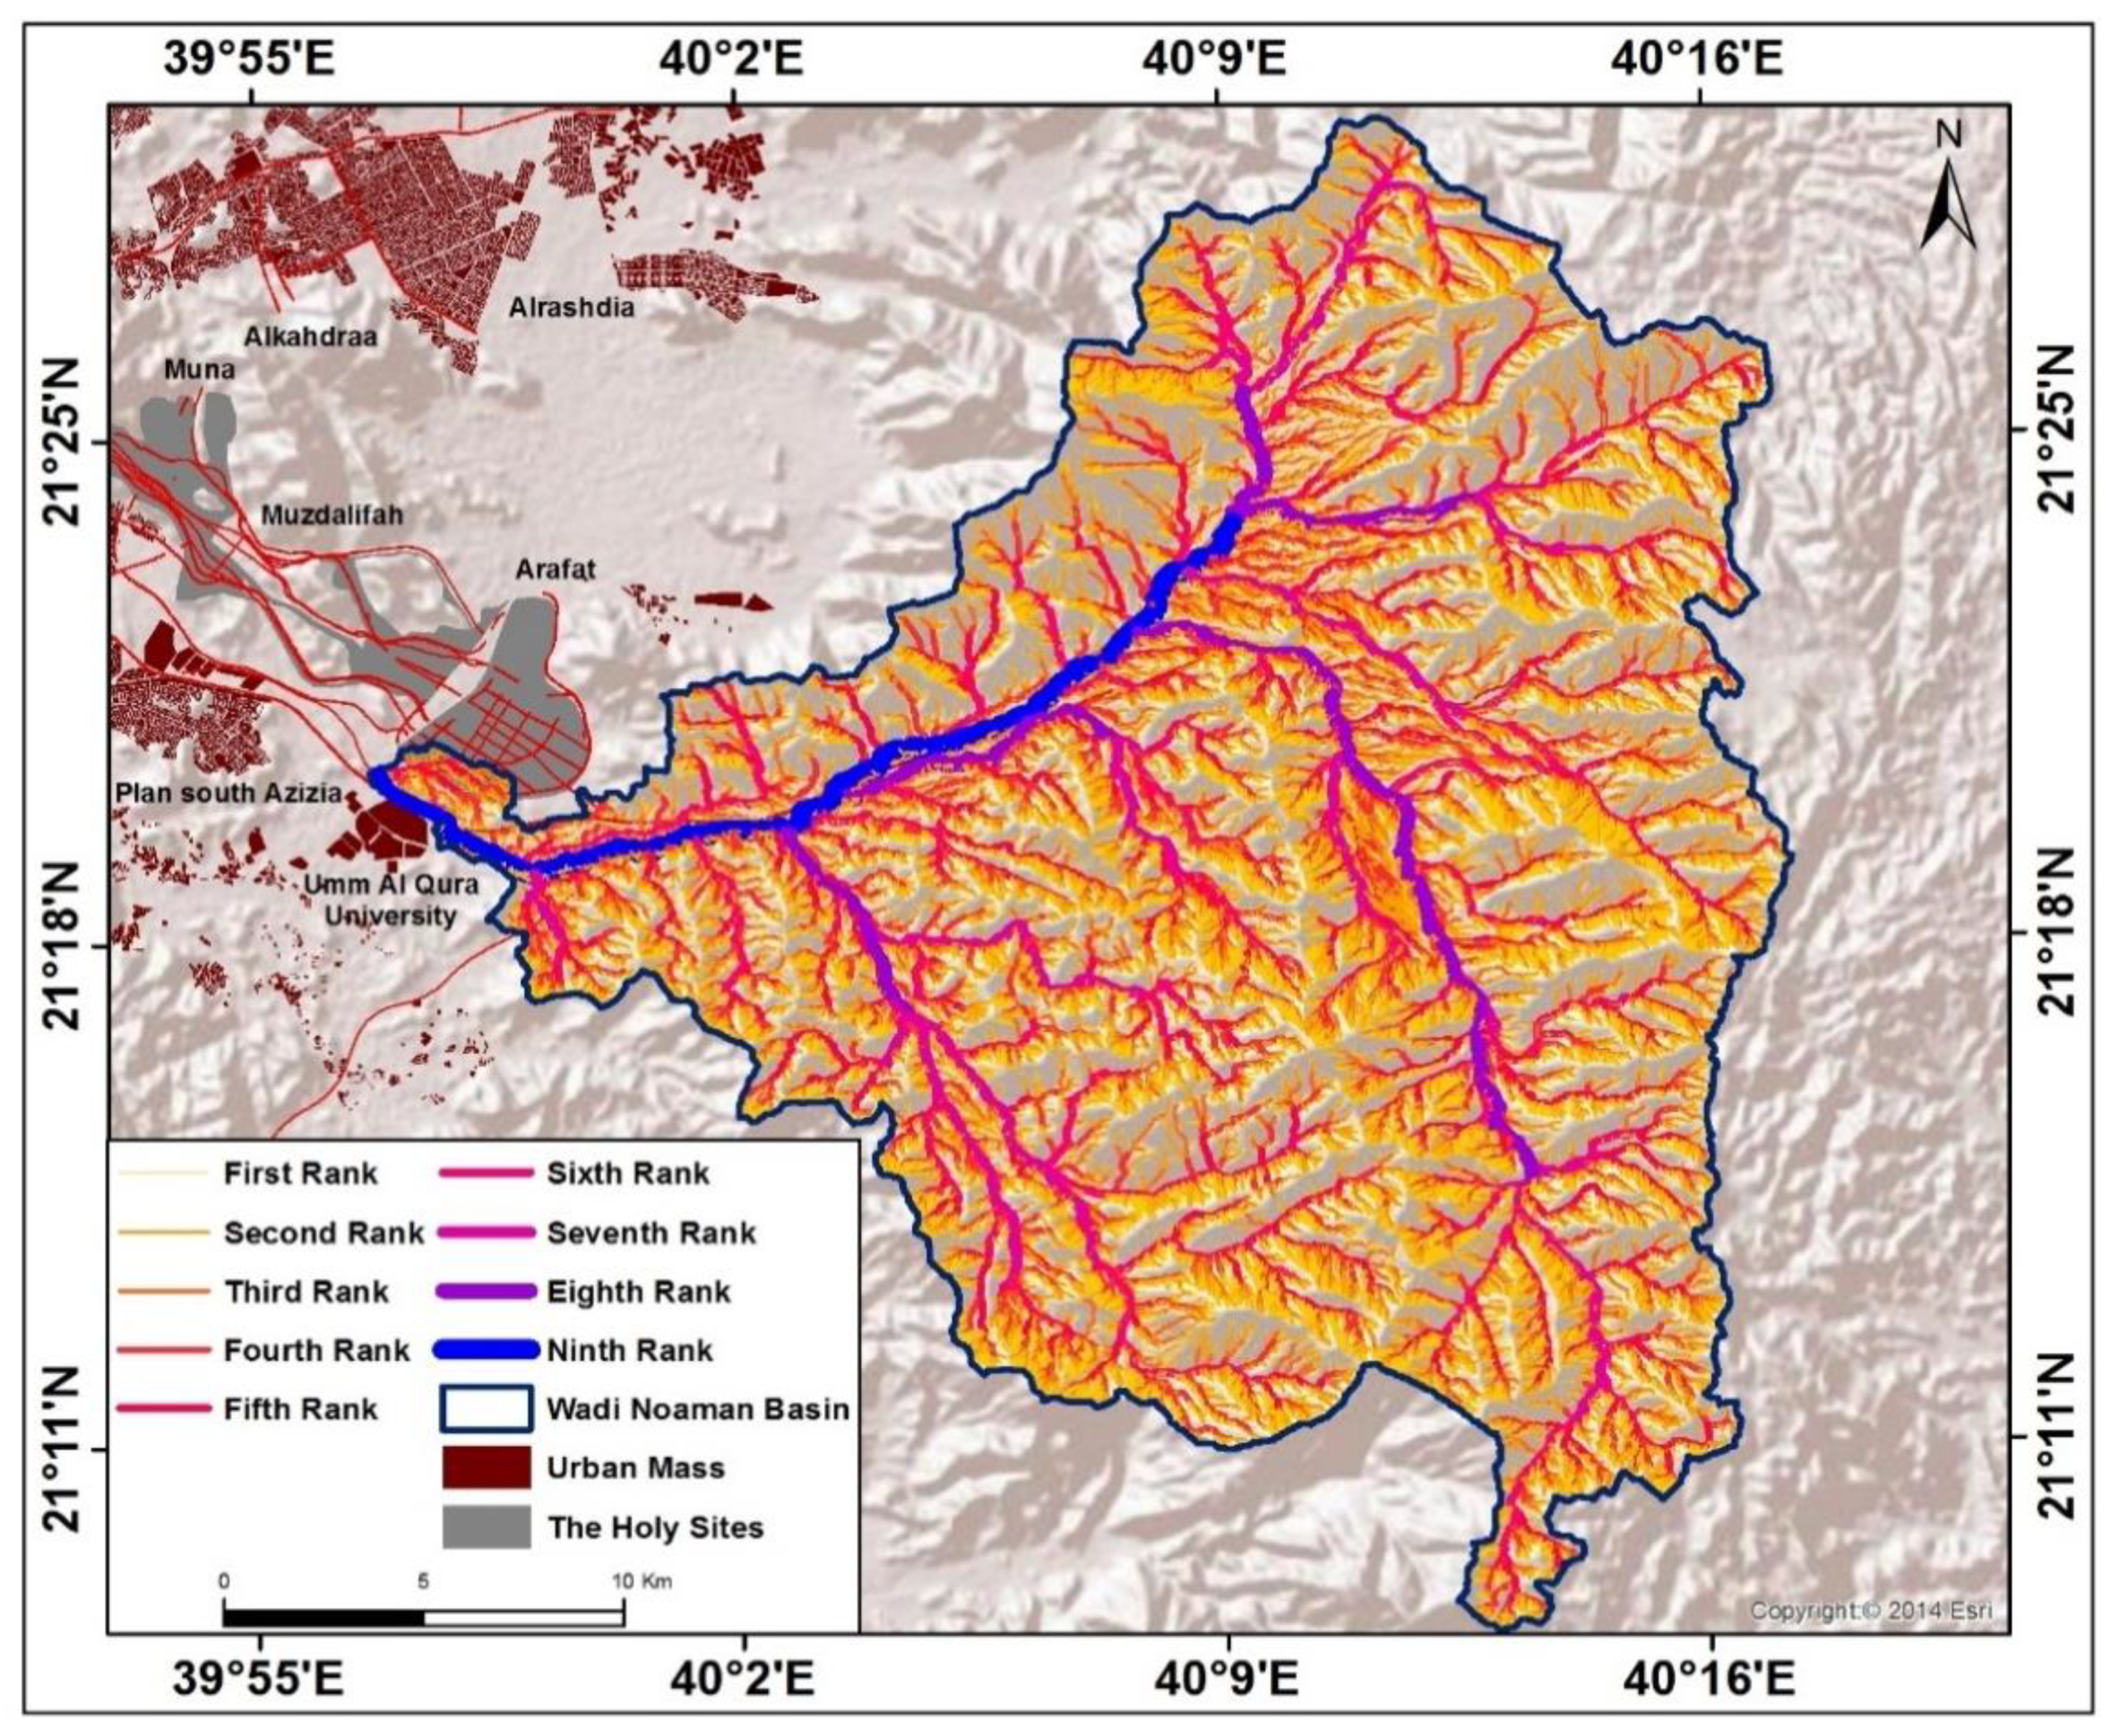
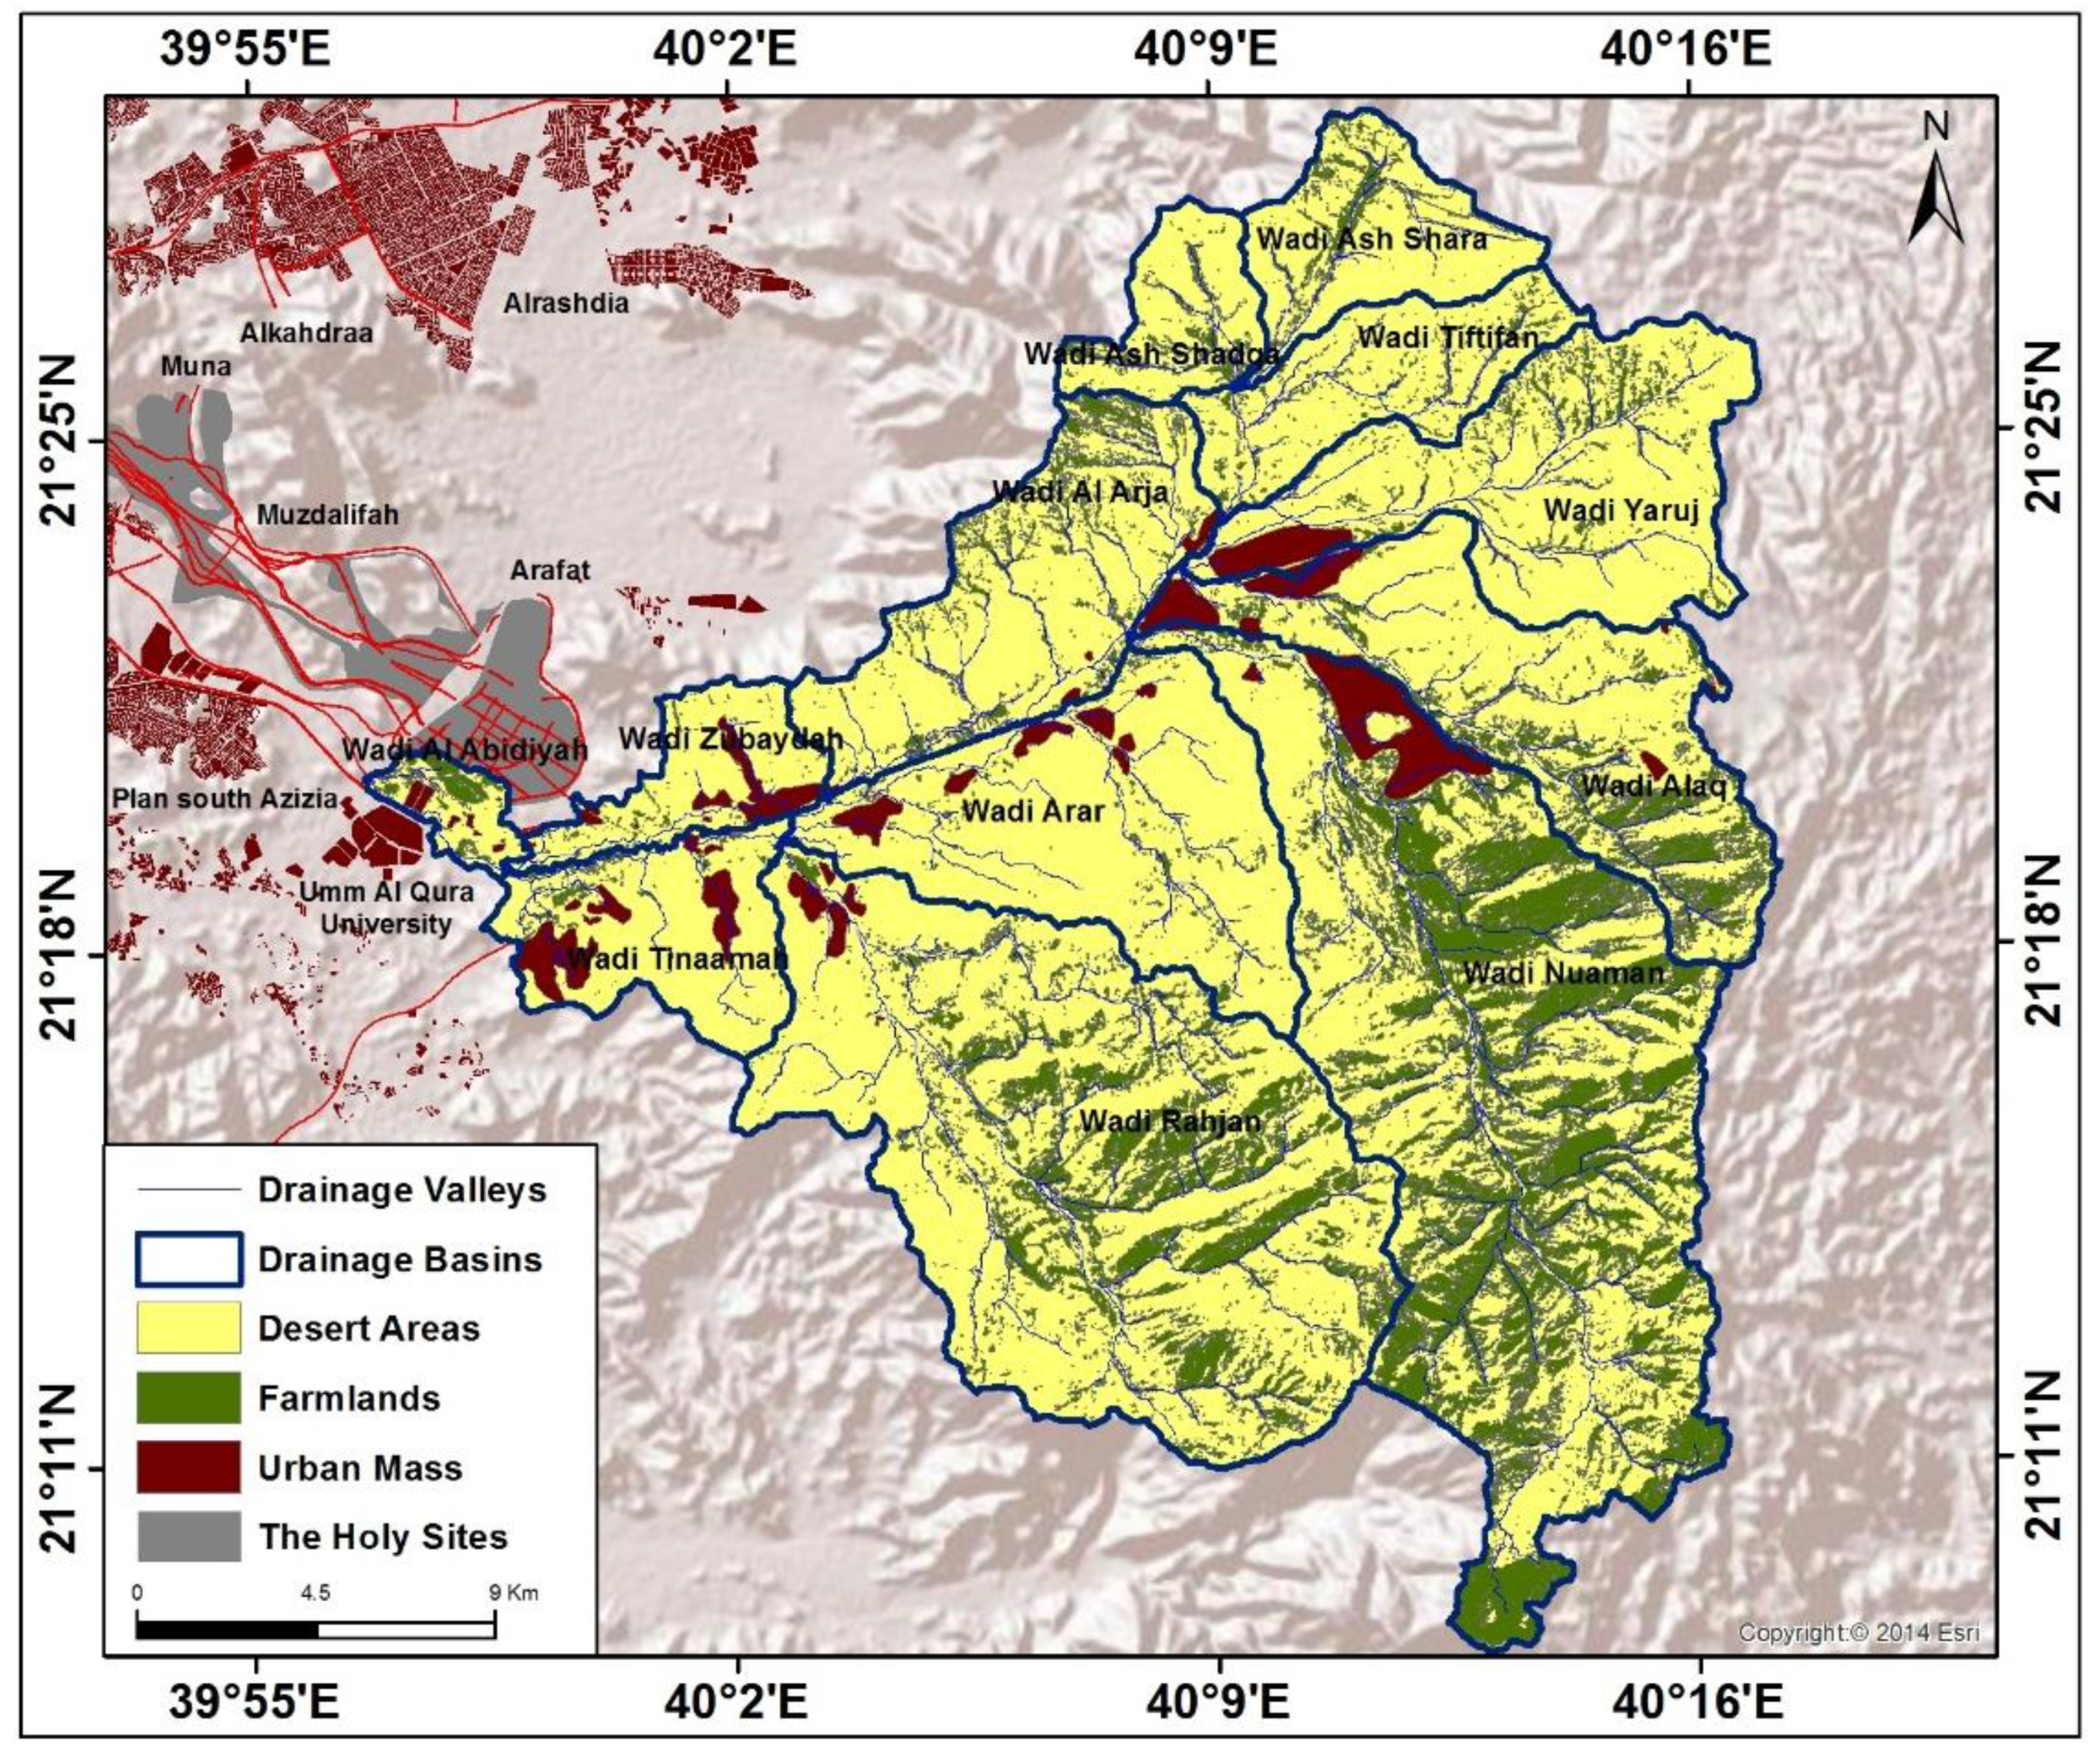
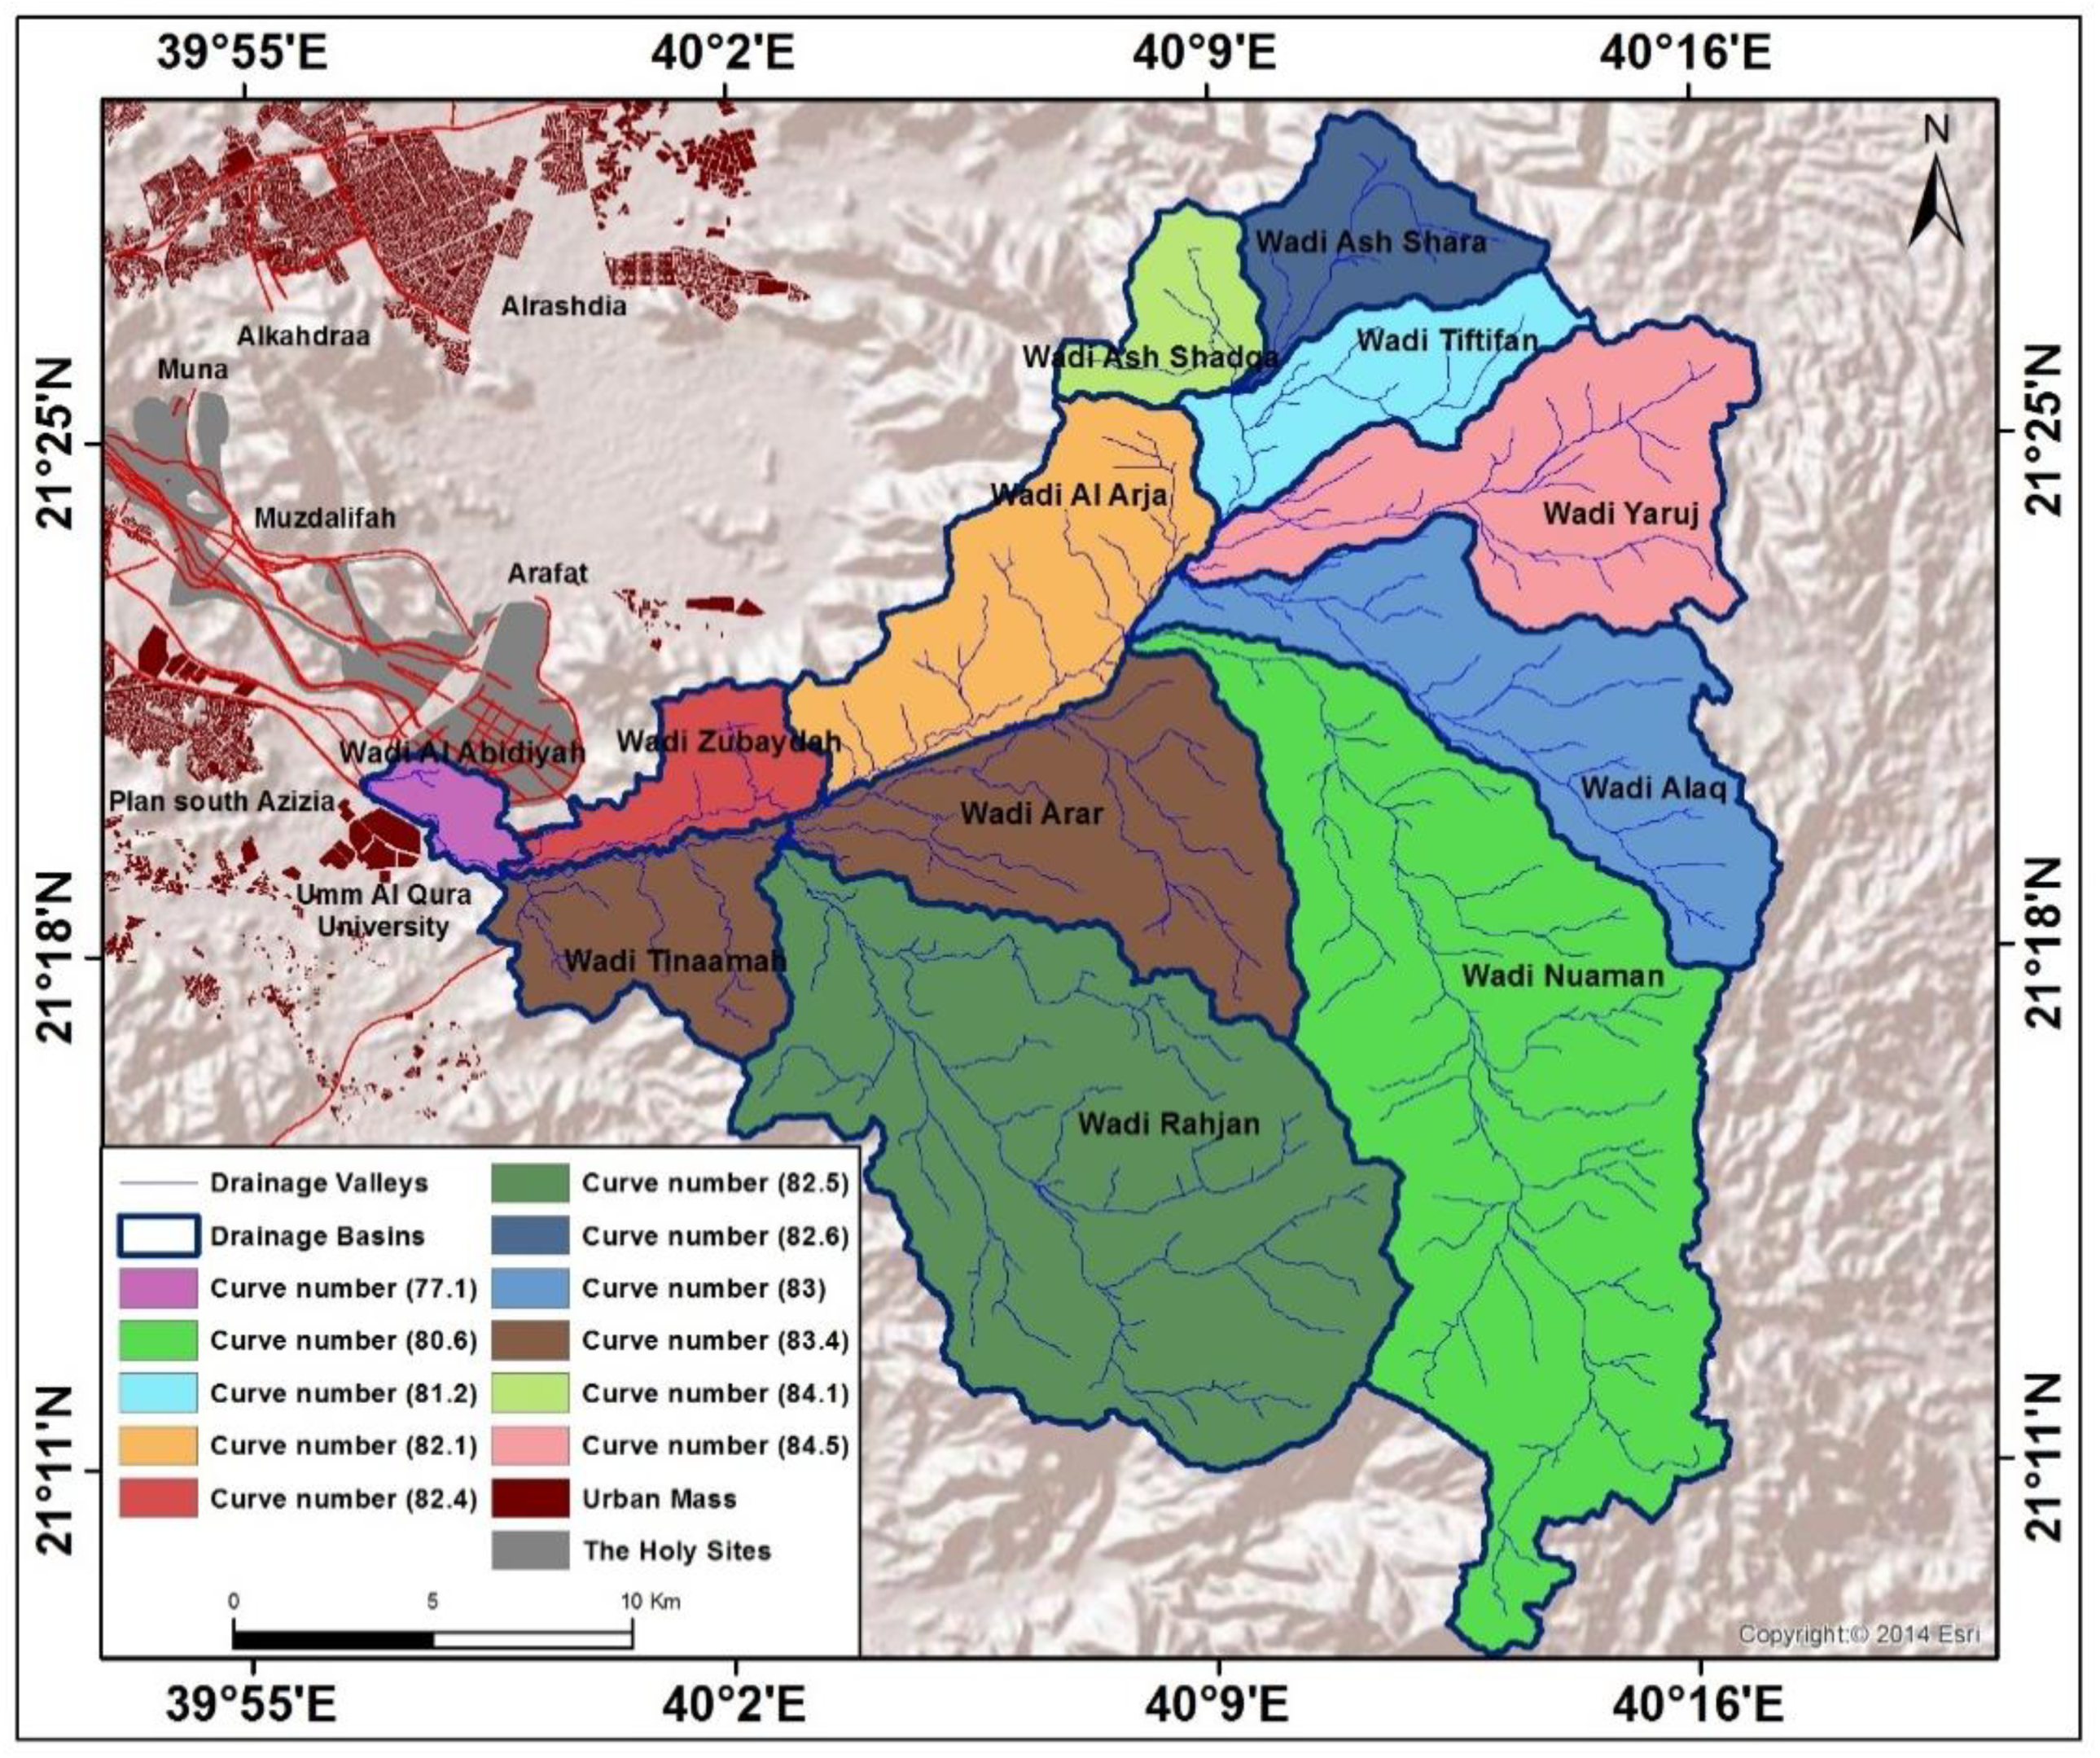
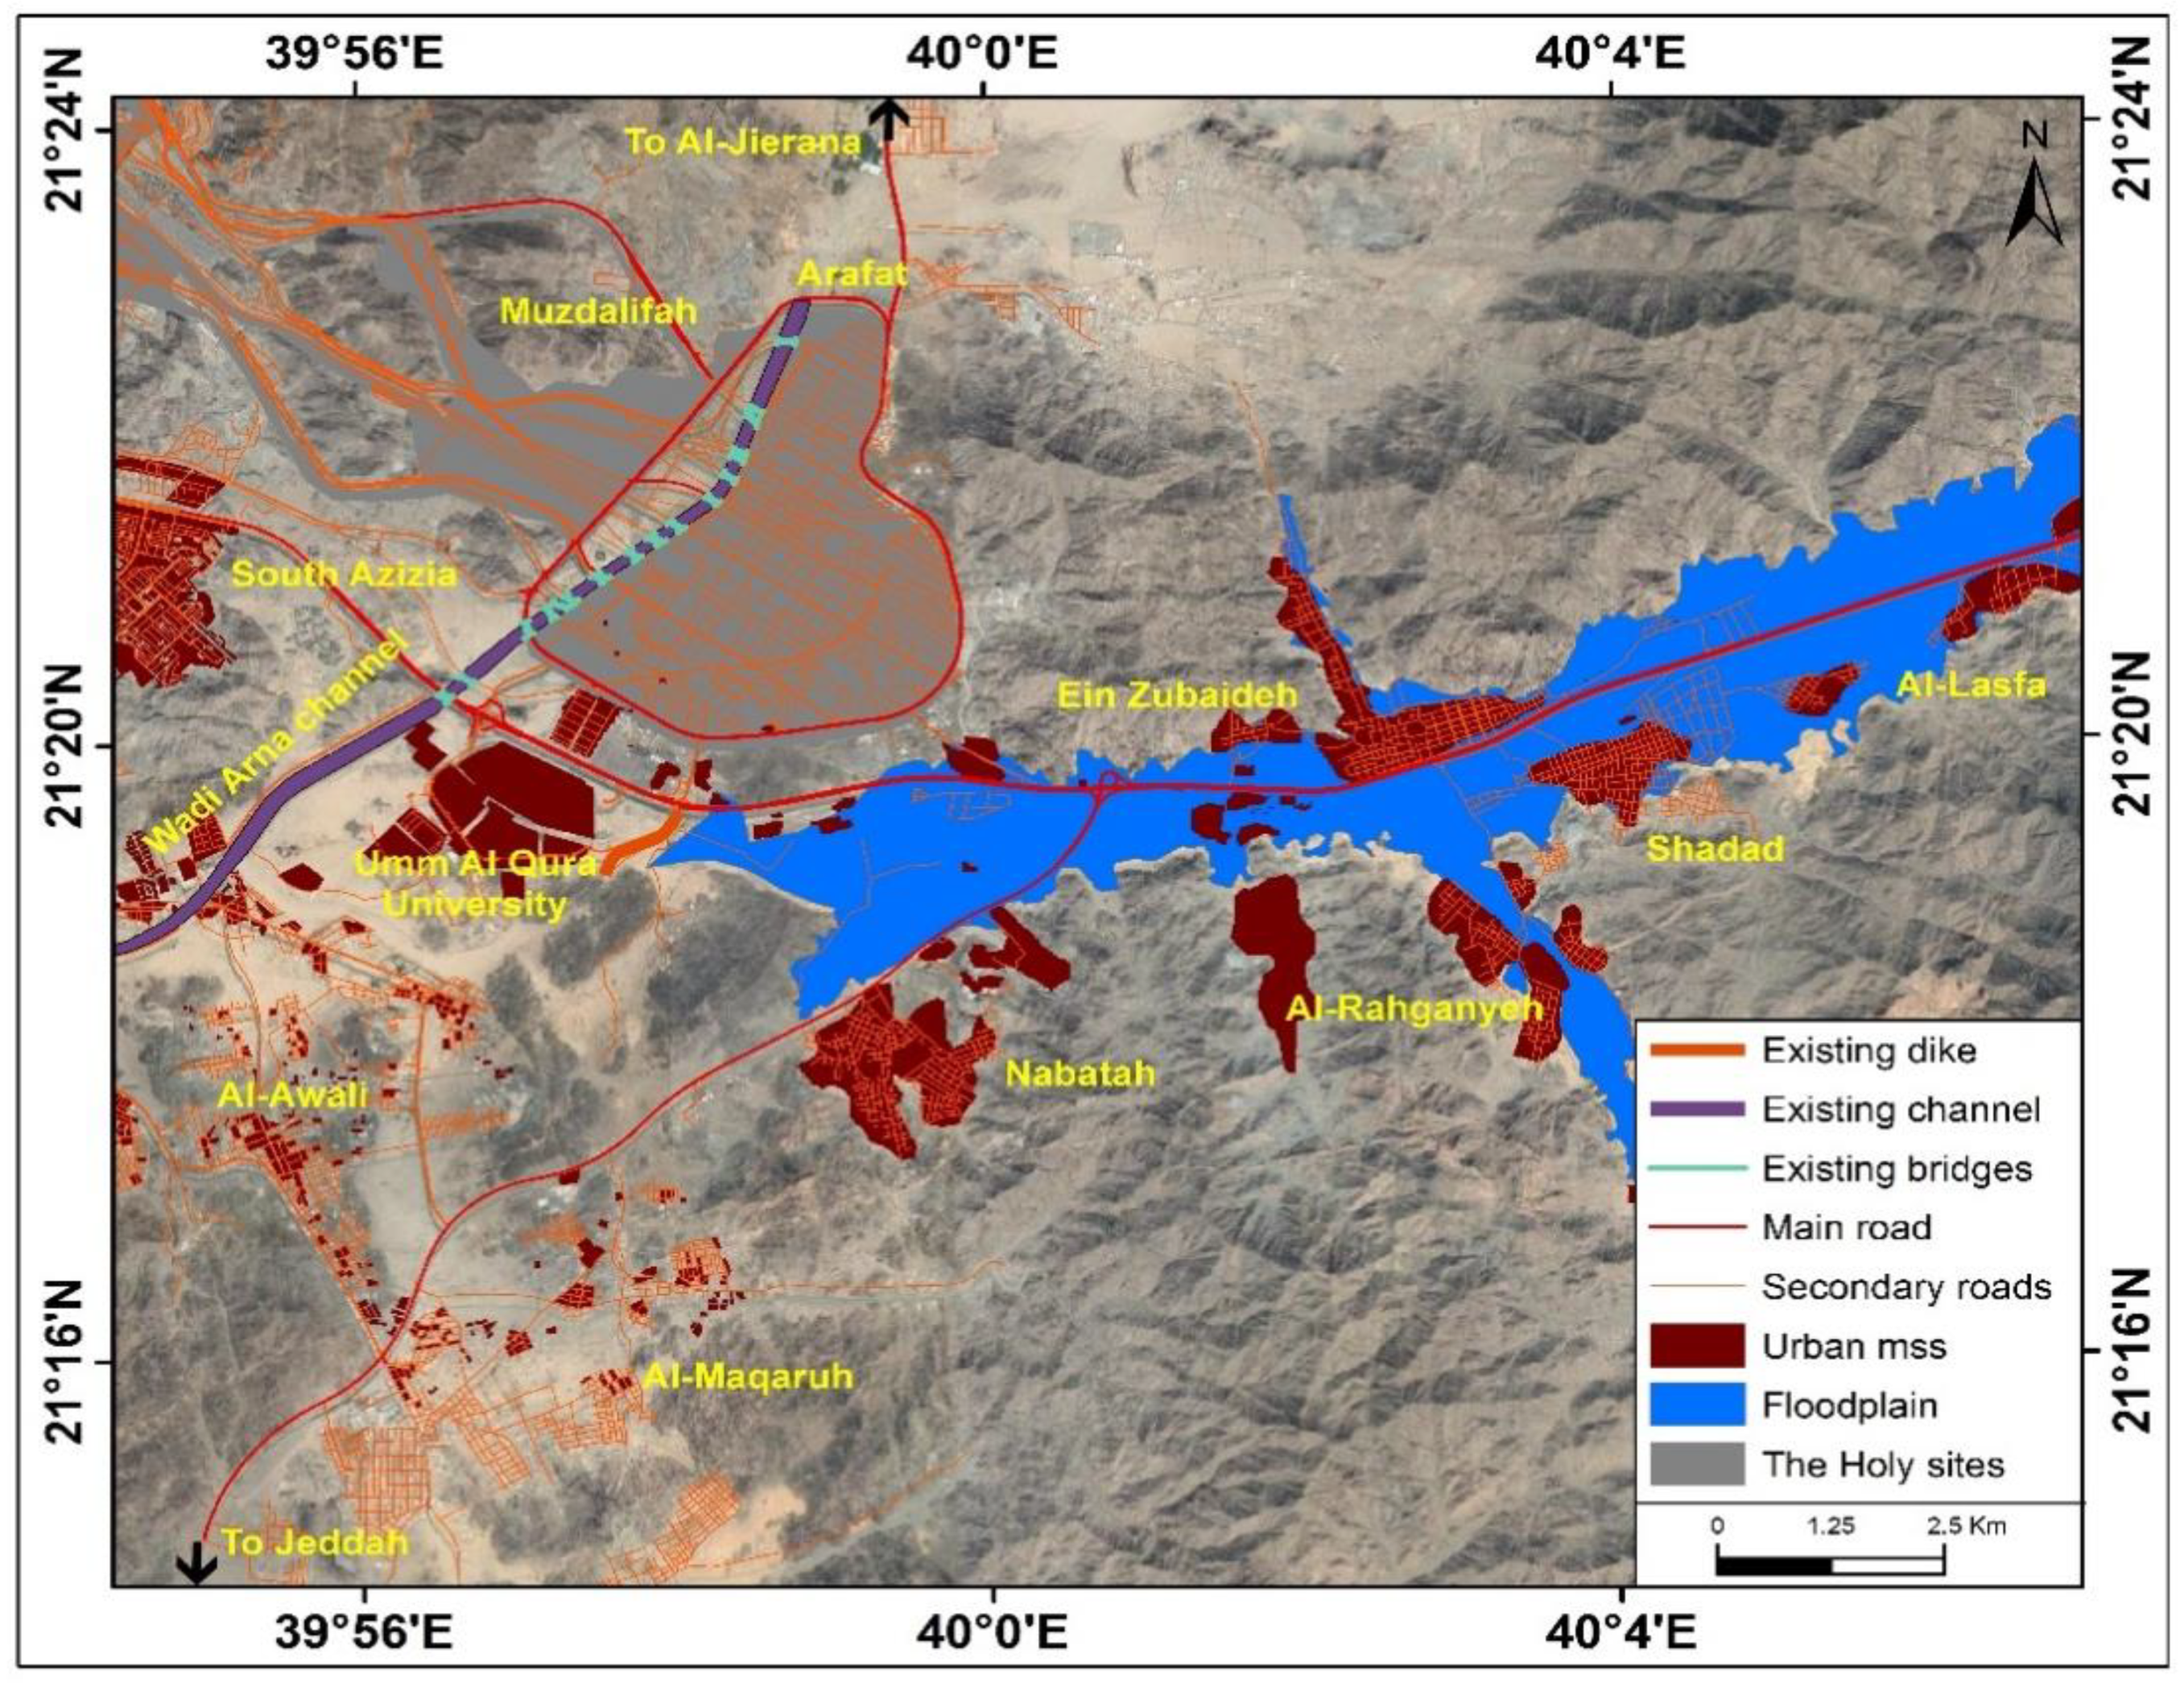
The Wadi Nu’man basin is located in the western region of Saudi Arabia, between the latitudes of 21°28′28.76″ and 21°10′32.31″ North and the longitudes of 40°09′09.62″ and 40°09′46.17″ East. The basin is about 7 km away from Mecca in the southeast direction, at the end of Al-’Abdia neighborhood, towards Ker. It is bounded in the north by Wadi Al-Bagidi and from the east by the heights of Al-Hada, while the mountain peaks, which represent the north-eastern upper edges of Wadi Malkan, are considered the southern and south-eastern boundaries (Figure 2 and Figure 3).
Wadi Nu’man has about eleven tributaries: The Al-’Abdia, Tan’ama, Zubaideh, Rehgan, ‘ar’ar, al-’Arraja, Alshathkaa, ‘alq, Taftafan, Ya’rug, and Alshar valleys. These tributaries feed from the Mothlam, Aktan, Sha’ar, Takbal, Kabkab, and Nu’man mountains (Figure 2). Wadi Nu’man has several sources from the peaks of Mothlam, Aktan, and Taftafan mountains, at a height of 1832 m above sea level, to the estuary in the area of the Al-Masha’er Al-Muqadasa, at a level of 272 m above sea level.
The area to the east of Mecca, which is represented by the Wadi Nu’man basin, is one of the most important and most developed parts of the city. Mash’ar Arafa, in which about 3.5 million people gather annually, lies in that part of the city. Moreover, the most important arterial roads between Mecca and Mash’ar Arafa, and between Mecca and Al-Taif, lie there, in addition to the headquarters of the Umm Al-Qura university, the populous neighborhood of Al-Awaleh, and the Husseinieh area, which is of great agricultural and residential importance.
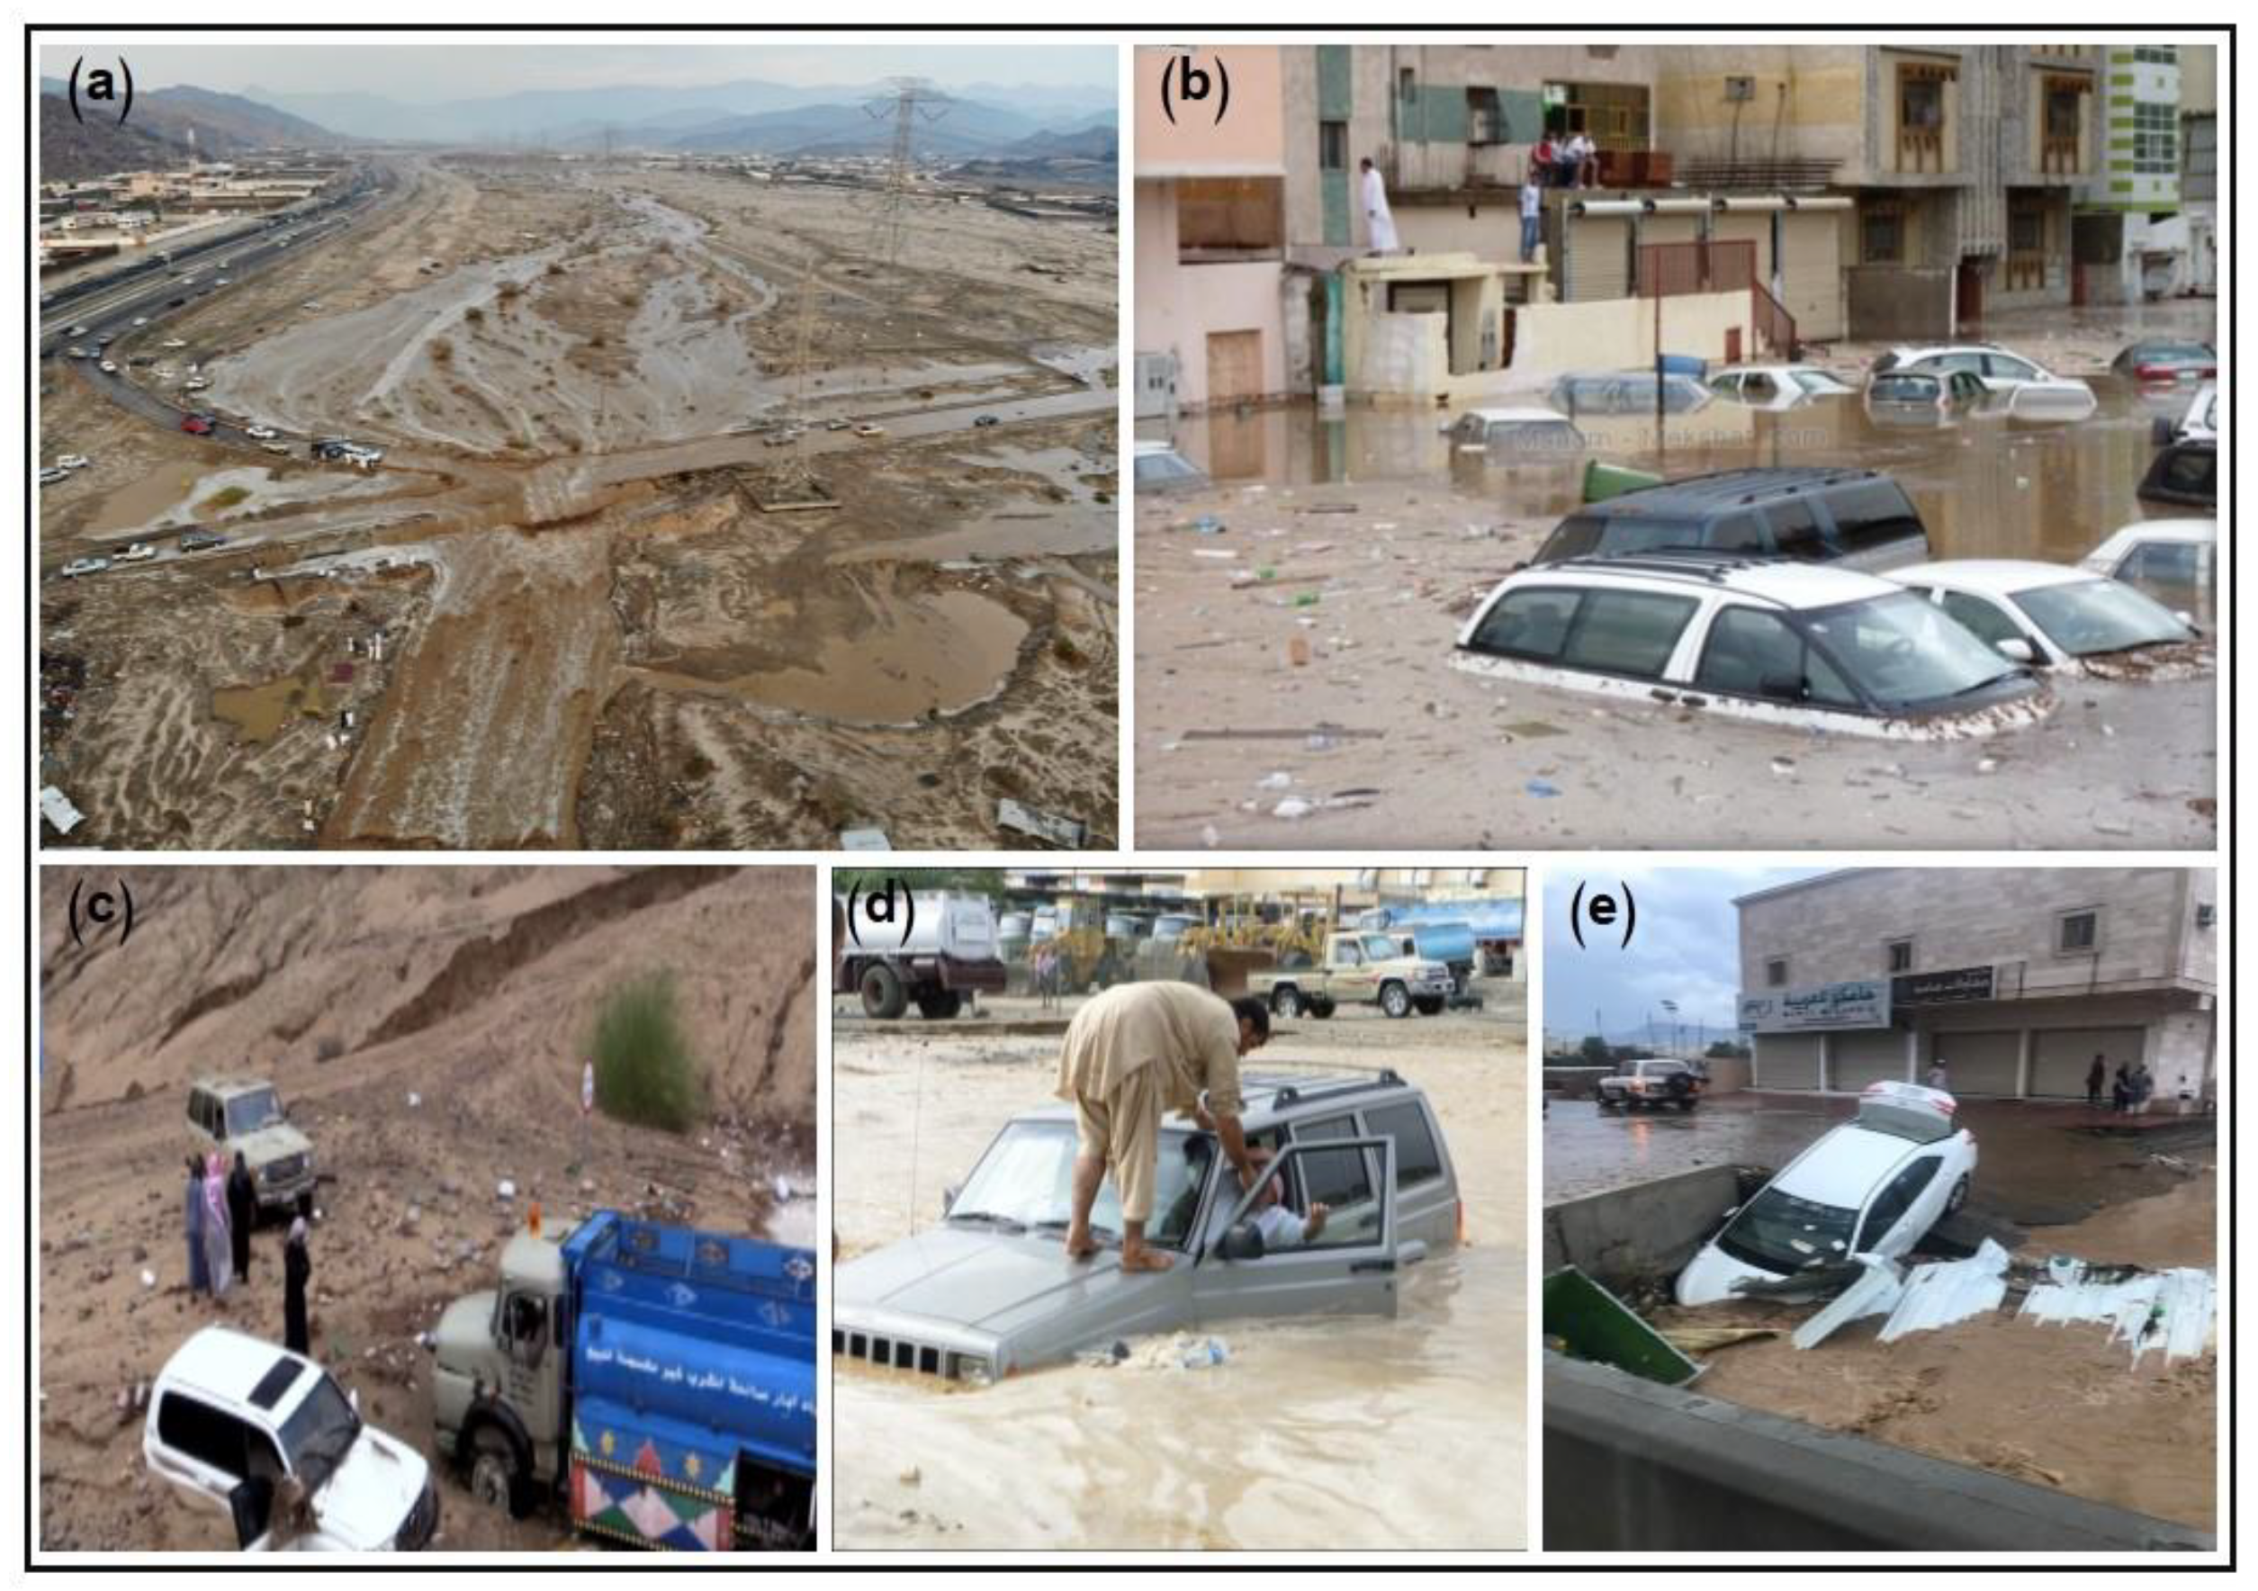
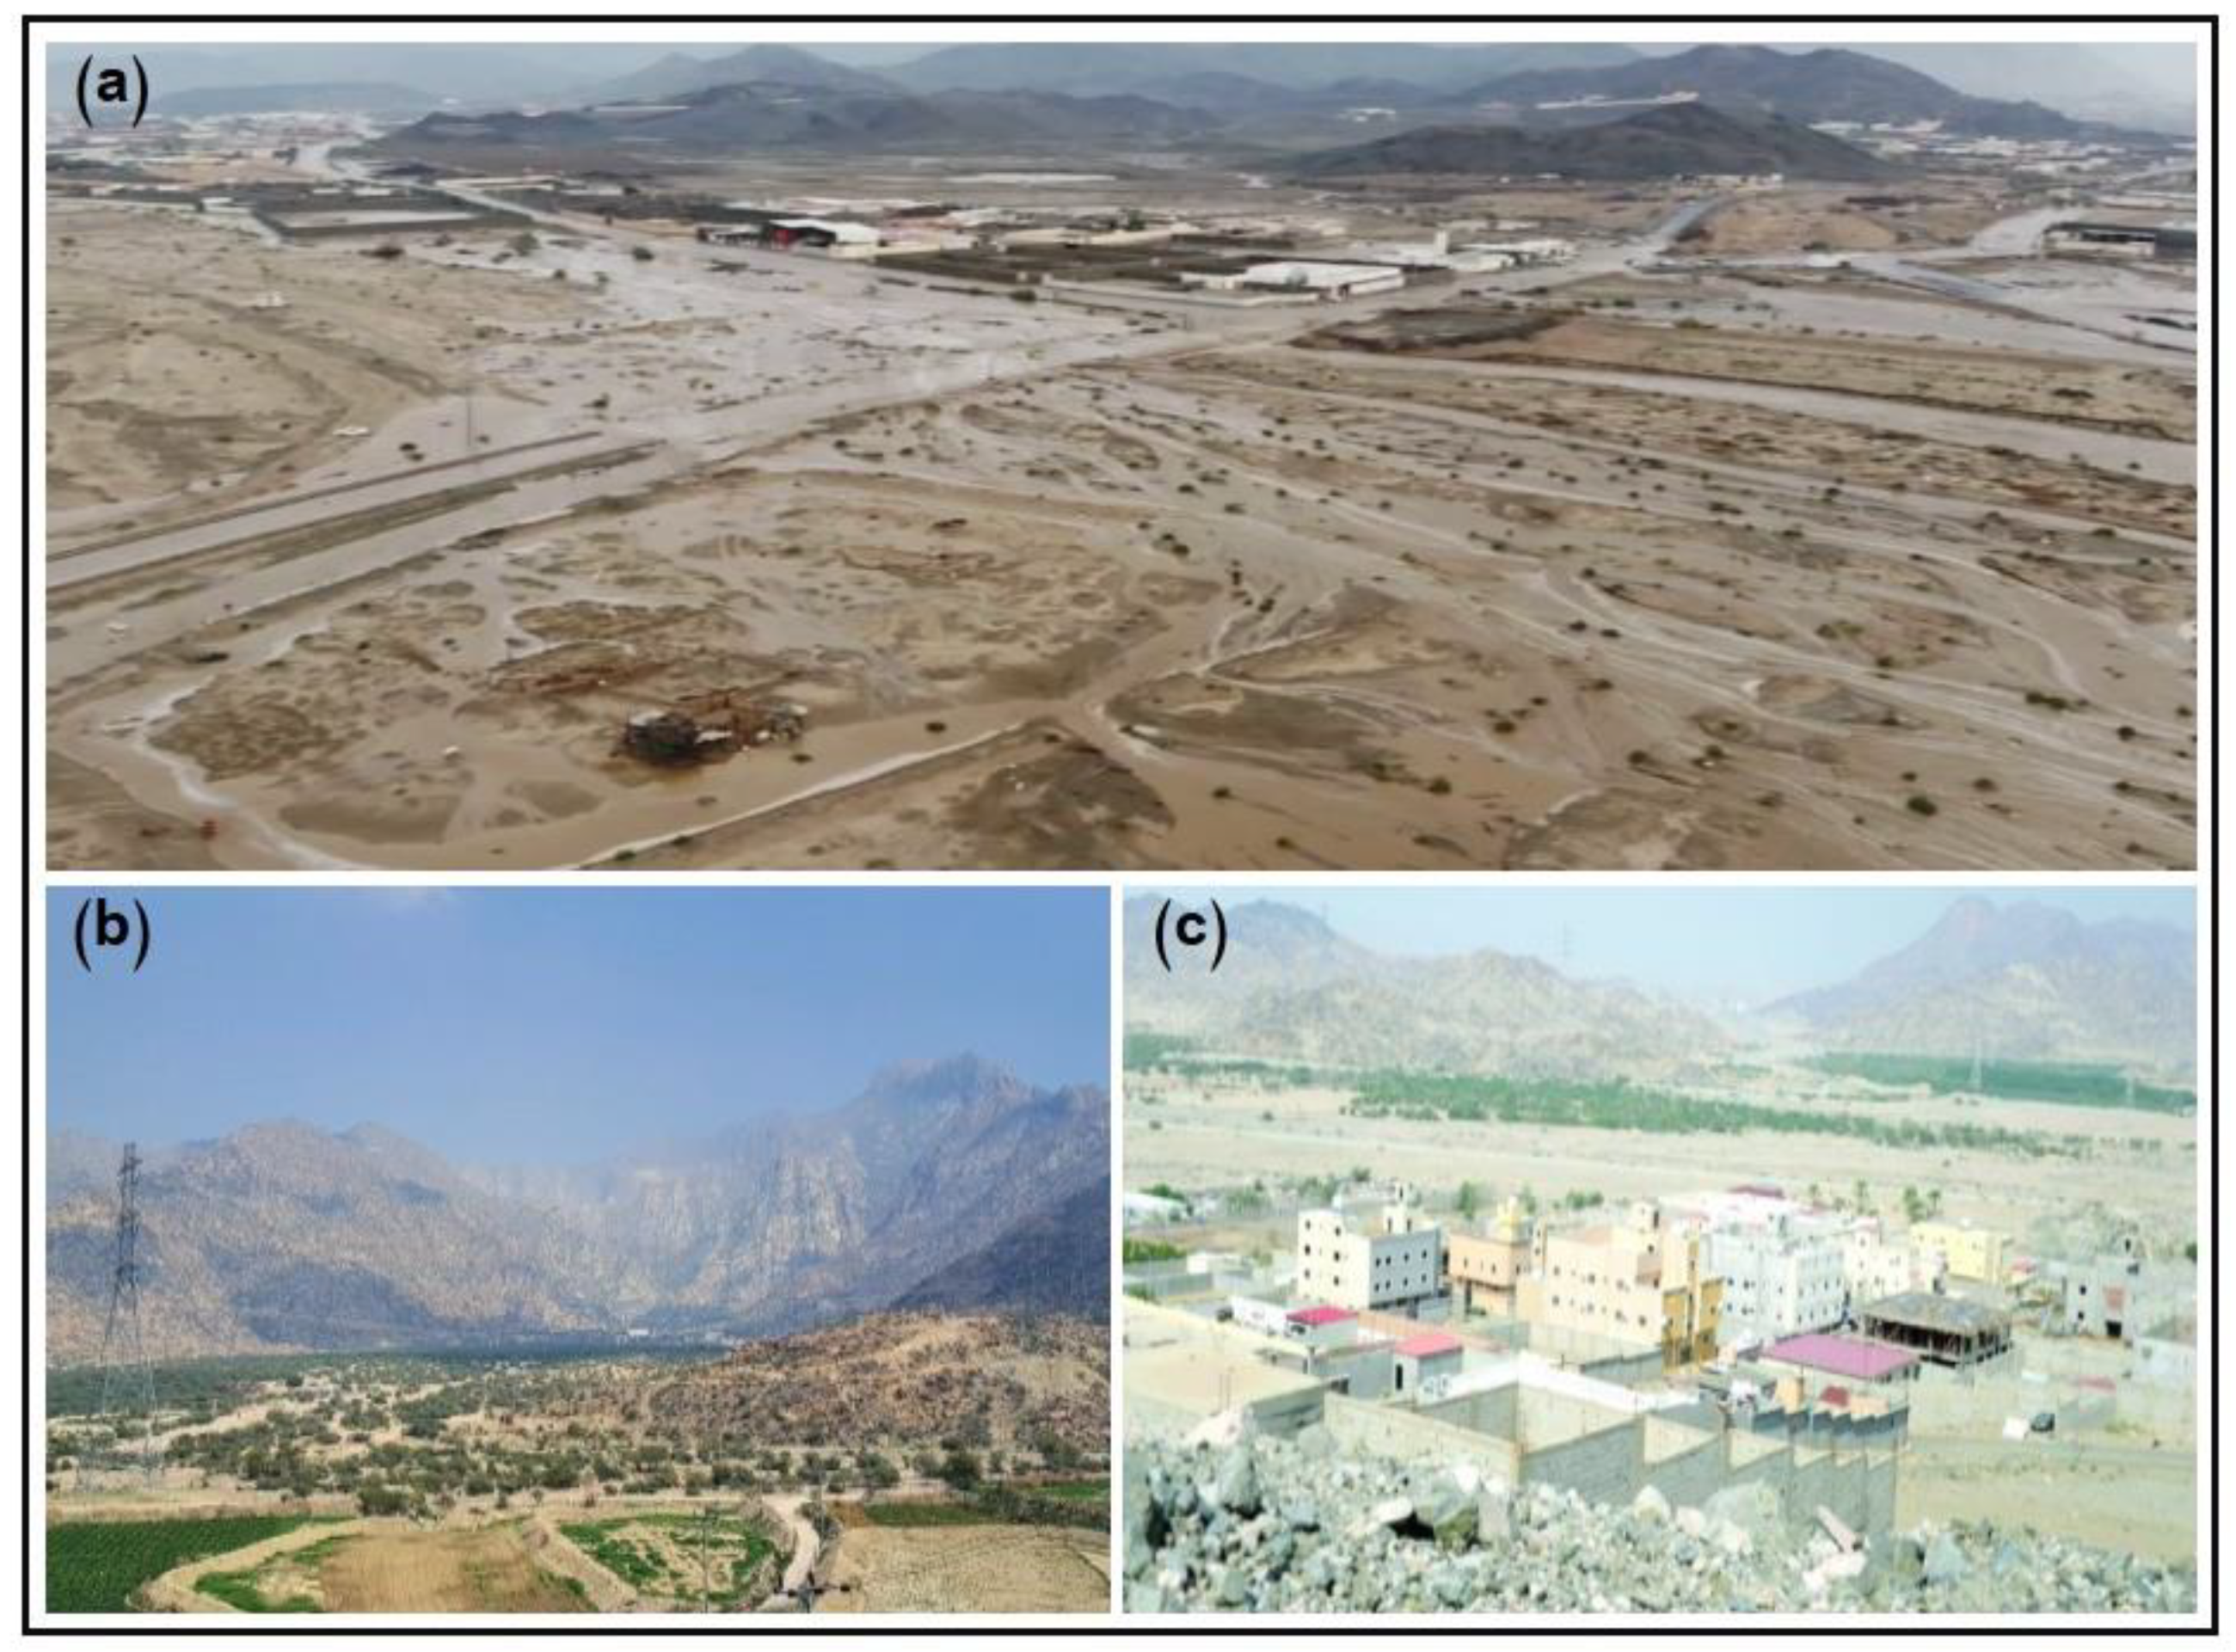
Since the pre-Islamic era, this area has been an agricultural and aquatic hinterland for Mecca. Several changes have occurred in recent decades due to the continuous expansion of Al-Haram Al-Sharif, which was followed by the movement of the residents from the central area of Mecca to the outskirts of the city. Most of the areas of the Wadi Nu’man basin have become housing schemes and residential areas. Moreover, the agricultural land was cleared and converted into several slum schemes and planned schemes. Several urban areas and the infrastructure in the area under study were exposed to recurrent floods of Wadi Nu’man. The most recent of these floods occurred on 3 November 2018, causing the destruction of many roads and the drowning of several urban settlements (Figure 4).

3. Methodology and Data Processing

Figure 5 shows a flow chart of the methodology, which consists of three basic components that can be illustrated as follows:

3.1. Monitoring the Land Use Changes in the Wadi Nu’man Basin during the Period From 1988–2019

To identify and monitor the land use changes of the Wadi Nu’man basin during the period from 1998–2019, the ERDAS IMAGINE 2016 program was used, and the process of monitoring the changes had four basic phases. The first stage consisted in the uploading of satellite images. Every ten years, images were taken by the United States Geological Survey Site (USGS) to monitor the changes that occurred in the Wadi Nu’man basin. The first image was taken in 1988; the second was taken in 1998; the third was taken in 2013 from a sensor TM, mounted on the American satellite, Landsat 4–5; and the fourth image was taken in 2019 from the mobile OL sensor I, mounted on the Landsat 8 satellite Table 1.
The second stage dealt with a spectral enhancement. The last was performed to increase its spectral accuracy and reduce the spectral interference through the Raster menu, including the spectral icon and the principal component option. The third stage dealt with the supervised classification. The process of the supervised classification was conducted using the maximum likelihood method from the Raster menu, involving the classification and the supervised classification options. Using the matrix, an accurate classification of the main Raster menu was made, involving the classification, including the supervised classification, and accuracy assessment options.

3.2. Hydrological Modeling

The HEC-HMS [14] has been applied to calculate the hydrograph curve in multiple ways, for both simple and complex drainage basins, by natural or artificial methods. It is one of the programs globally used in the field of hydrology and was developed by the American Army Organization. Using a 24-h storm design, the SCS TYPE II distribution was used, and the SCS method was used to calculate the delay and concentration times for different frequency times of 100, 50, 20, and 10 years. The output of the hydrological model used in our study was deduced to infer the hydrograph of the water’s drainage basins.
The network of the valleys of the Wadi Nu’man basin has been identified and extracted using several different sources, the most important of which is the digital high-precision model of 5 m. The sources are from the website of King Abdulaziz City of Science and Technology, Institute of Space Research: Topographic maps at a scale of 1:50,000, with five plates, from the Saudi Geological Survey Authority; a modern satellite image from the Landsat 8/OLI, derived from the US Geological Survey Site (USGS); and a modern geological map at a scale of 1:250,000, derived from the Saudi Arabian Geological Survey (Figure 6).
It was necessary to use mathematical equations that represent the rain loss or link runoff and total rainfall and to calculate the curve number and the greatest drainage (m3/s) (as illustrated in Table 2). The Kirpich equation [34] was used in the calculation of the time of concentration (Equation (1)), which is the time needed for the rain water falling on the surface of the basin to gather, until it reaches the point where the flow is calculated. The delay time was calculated using the SCS method equation (Equation (2)), which is the time between the occurrence of a unit of rain and the occurrence of a unit of water runoff. The depth of rain or direct flooding in the basin was calculated to infer the total amount of floods at the actual rain value (Equations (3)–(5)). The amount of water in the area, before the occurrence of a flood, such as the water resulting from infiltration and rainwater found on plants, was also estimated using Equation (4). Equation (2) can be simplified, as illustrated in Equation (5). The maximum effort of the soil moisture was calculated using Equation (6), where the CN represents the curve number in the soil conservation services (SCS) method. This coefficient depends on the nature of the soil and land uses [35]. The maximum drainage (m3/s) of each basin was calculated for different return periods using Equation (7), and the time of the greatest drainage was calculated using Equation (8). All of the aforementioned equations are illustrated in Table 2.

3.3. Hydraulic Modelling

The two-dimensional hydraulic modelling was carried out using the HEC-RAS, version 5.0.4, of the Center for Hydrological Engineers, and the program can calculate the movement of sediments and chemical pollutants in the current, evaluate channels and passes, and assess the distal stalactites. The program is used in mapping the spread of floods and to calculate the risk of floods in threatened places. The applications of the program are used to calculate the rates of degradation and aggradation, resulting from the flood water currents, and the two-dimensional modelling of the program (HEC-RAS) was employed to calculate the speed, depth, and spread of the Wadi Nu’man’s flood. The construction of the two-dimensional hydraulic model was achieved using the HEC-RAS, with four stages: (a) Correction or addition of engineering data for transverse sections and hydraulic structures; (b) peak flow of the data input; (c) general definition of the model plan (engineering data files and flow are set based on the results of previous hydrological modelling and the high 5-m digital height model; and (d) the implementation and verification of hydraulic calculations.

4. Results

4.1. Analysis of Rainfall in Different Return Periods and Determination of the IDF Curves of the Wadi Nu’man Basin

The precise determination of the amount of rain falling in the water basin is one of the most important factors that aid in the accurate calculation of the floods caused by these rains. It is also regarded as the proper basis of water statistics and the probability of the recurrence of floods. By referring to the records of the Stations of the Ministry of Water and Electricity and the general Presidency of Meteorology and Environmental Protection, it was found that Wadi Nu’man is affected by four meteorological stations: Al-Ferine (J 113), Al-Shifa (TA 109), Mecca (J 114), and Muntasaf-Huda (J 205). The records also revealed that these stations cover a period of 39 years, 54 years, 25 years, and 47 years, respectively. The depth of the rain was determined in various return periods (5, 10, 20, 25, 50, and 100 years) using the Hyfran [36], and various statistical distributions, such as normal, log-normal, log-Pearson type III, Pearson type III, Gumbel, and exponential, and the Komogorov model, used to verify the results, were applied. It was concluded that the method (log-normal) is the most suitable for use in the four stations (Figure 7 and Figure 8) (Table 3).

4.2. The Morphological Characteristics of the Wadi Nu’man Basin

The morphological characteristics (Figure 9 and Figure 10) of the drainage basin were extracted using the watershed modeling system (WMS) through the drainage module by selecting “Compute Basins Data”, where the morphological properties of the basins were calculated automatically. These properties can be shown in the “Display option”, as the main basin, namely, the Wadi Nu’man basin, affecting Al-Masha’er Al-Muqadasa. The basin covers an area of about 688.6 km2 and extends up to 38 km in length. The basin’s slope is about 0.37214 m/m. The Wadi Nu’man drainage basin was divided into 12 sub-basins. The area of these sub-basins ranges from 8.6 km2 to 174.3 km2, while the lengths of the sub-drainage basins of Wadi Nu’man range from 6.4–27.4 km, and the gradients of the sub-basins range from 0.038021 to 0.463106 m/m (Table 4 and Table 5; Figure 9 and Figure 10).

4.3. Identification of the Hydrological Group of the Soils and Land Uses of the Wadi Nu’man Basin

One of the main coefficients in calculating the curve number (CN) is the identification of the hydrological group of soils and land uses, where the value of the curve number depends mainly on these two variables. Using the SCS method, four soil hydrological groups were identified [35]: A, b, c, and d. The Wadi Nu’man drainage basins are represented by the soil hydrological groups: A, b, c, and d. The soil hydrological group (A) represents an area of 50 km2 and contains soils with a high permeability. The soil hydrological group (B), on the other hand, represents an area of 95.1 km2 and contains alluvial soils, while the soil hydrological group (C) represents an area of 293 km2 and consists of clay soils. The soil hydrological group (D) represents an area of 249 km2 and consists of clay soils with a low permeability (Figure 11 and Figure 12).
Land uses were also obtained by the classification of satellite images from the Landsat LANDSAT8/OLI using the ERDAS IMAGINE program. The land use layer was defined by the hydrological modelling program (WMS) through the insertion of a land-use layer, after defining the layers by selecting “New coverage” in the drop-down list of the GIS data and choosing “Add shape file data”. There are three categories of land use in the Wadi Nu’man basin: The first category constitutes desert areas, with an area of about 533 km2; the second category constitutes agricultural areas, which represent 130 km2 of the Wadi Nu’man drainage basins; and the third category represents urban areas, with an area of 27 km2 (Figure 13).

4.4. Determining the Curve Number of the Wadi Numan Basin

The curve number (CN) method, which is one of the most common methods, was used to assess the amount of water loss through underground infiltration. This method requires three elements: The pre-condition of soil moisture, land cover, and soil hydrological groups. The value of the curve number ranges from zero to 100 and reflects the water response to the components of the land cover in the drainage basins, and it thus reflects the solidity of the surface. The closer the values to 100, the less solid the surfaces [37]. Thus, we find a difference in the value of the curve number of the sub-drainage basins of Wadi Nu’man, as the basin of Wadi Ya’rug came first in terms of the curve number, which reached 84.5, while Wadi Al-shathqaa came second in terms of the curve number, which was 84.1. The reason why the curve number values of these basins are high is that they are located in rocky areas. The basin of Wadi Al-‘abdia, on the other hand, came last in terms of the curve number, which reached 77.1, since it is located in an alluvial area (Figure 14 shows the curve numbers of the basins of Wadi Nu’man).

4.5. The Hydrological Characteristics of the Wadi Nu’man Basin (Flow (m3/s); Flood Amount (m3); Estimated Time of Arrival (Min))

The results of the analysis, shown in Table 6 and Figure 15 and Figure 16, showed that the maximum drainage of the Wadi Nu’man basin reached about 2689.82 m3/s; the amount of floods reached 66 million m3; and the estimated time of arrival was 930 min during a return period of 100 years.
Regarding the sub-basins, the Wadi Rehgan basin came first in terms of the maximum flow during a 100-year return period of approximately 1144.85 m3/s, followed by the Wadi Nu’man basin (approximately 776.79 m3/s). On the other hand, the Al-‘abdia drainage basin came last in terms of the maximum flow, which reached approximately 24.67 m3/s, followed by the Wadi Zubaideh basin, whose maximum flow reached about 117 m3/s.
The Wadi Rehgan basin came first in terms of the amount of flooding during a return period of 100 years, which reached about 16,588,303.7 m3. It was followed by the Wadi Nu’man basin, whose flooding amount reached 13,444,729.6 m3. Wadi Al-‘abdia came last in terms of the amount of flooding, which reached 414,884.3 m3, followed by the Wadi Zubaideh basin (about 1,414,577.7 m3).

5. Discussion

5.1. Monitoring the Changes in the Land Use of the Wadi Nu’man Basin during the Period from 1998–2019

The land-use change plays an important role in the hydrological behavior of drainage basins and affects the local hydrological cycle. Several studies have been conducted to assess the impact of land-use changes on the runoff [38,39,40,41,42]. Many authors have acknowledged the fact that increased urban activities in the flood areas will increase the apex drainage, reduce time to the apex, and increase the runoff [43,44,45,46,47]. A better understanding and assessment of land-use changes that have a direct impact on the processes of hydrological water catchments is crucial for the planning and sustainable development of water catchments [48,49,50,51]. The geomatics of remote sensing (RS) and geographic information systems (GIS) have recently been employed as powerful and effective tools in identifying changes in the land use [52,
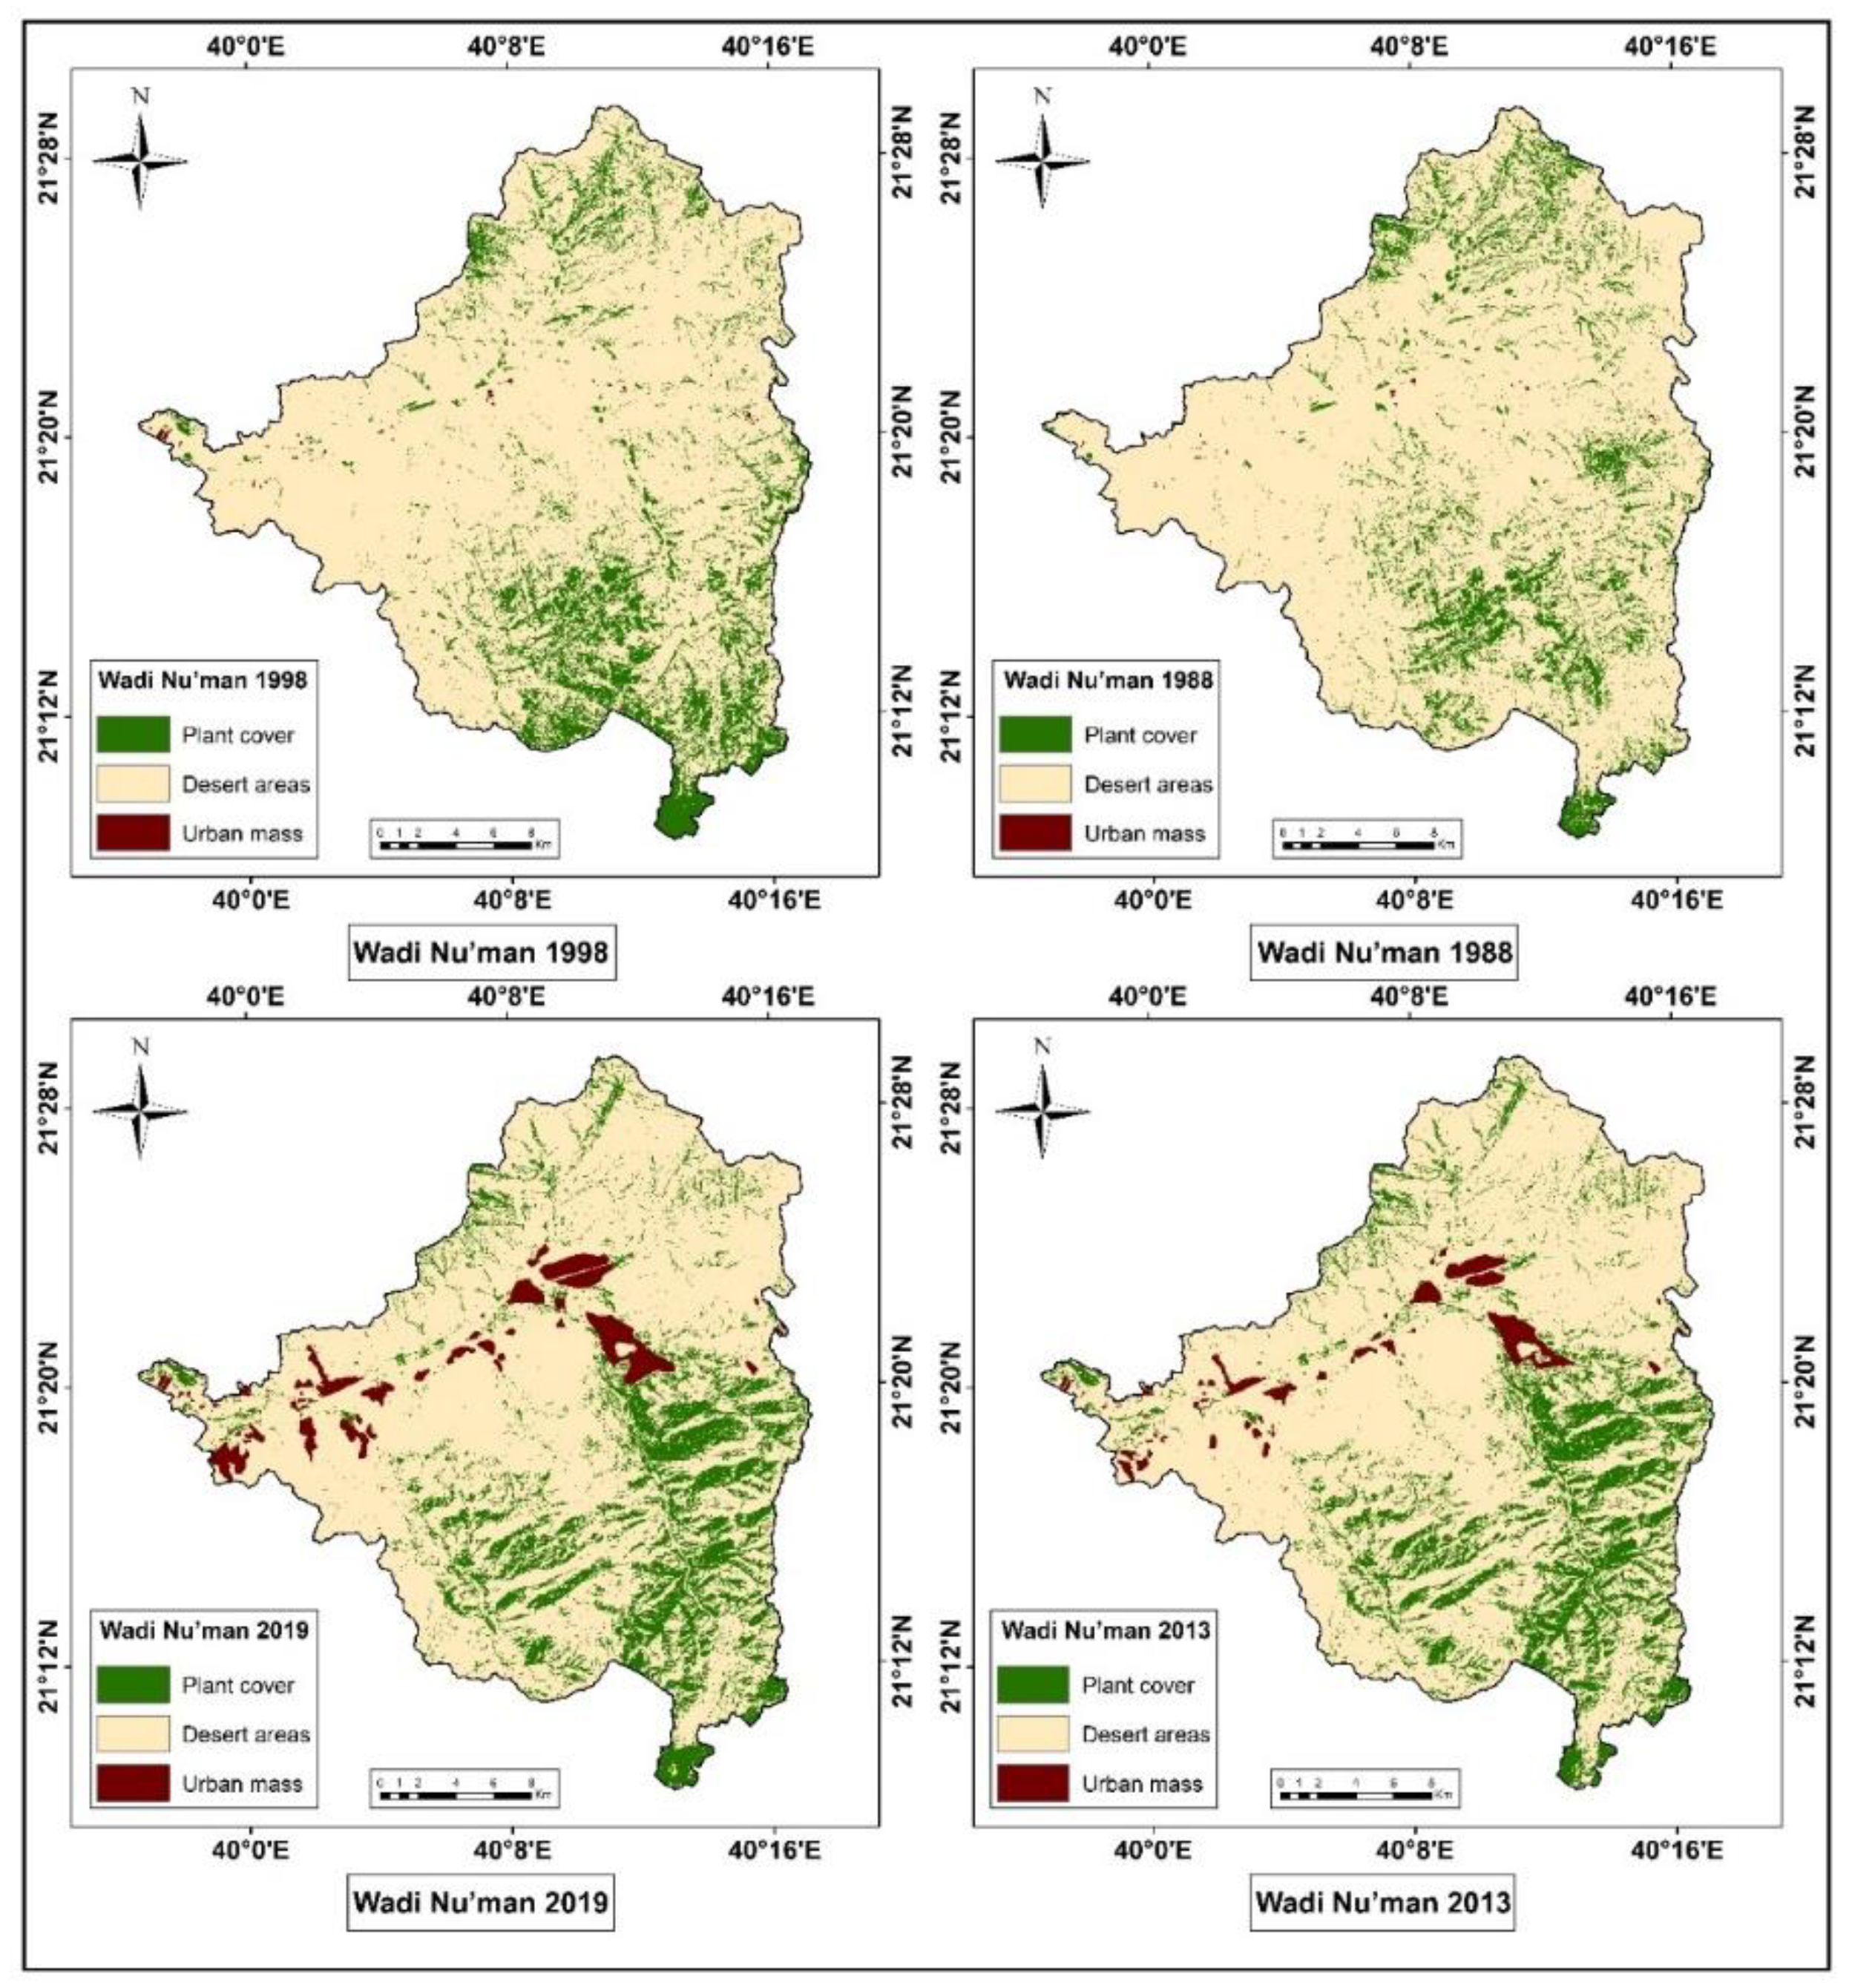
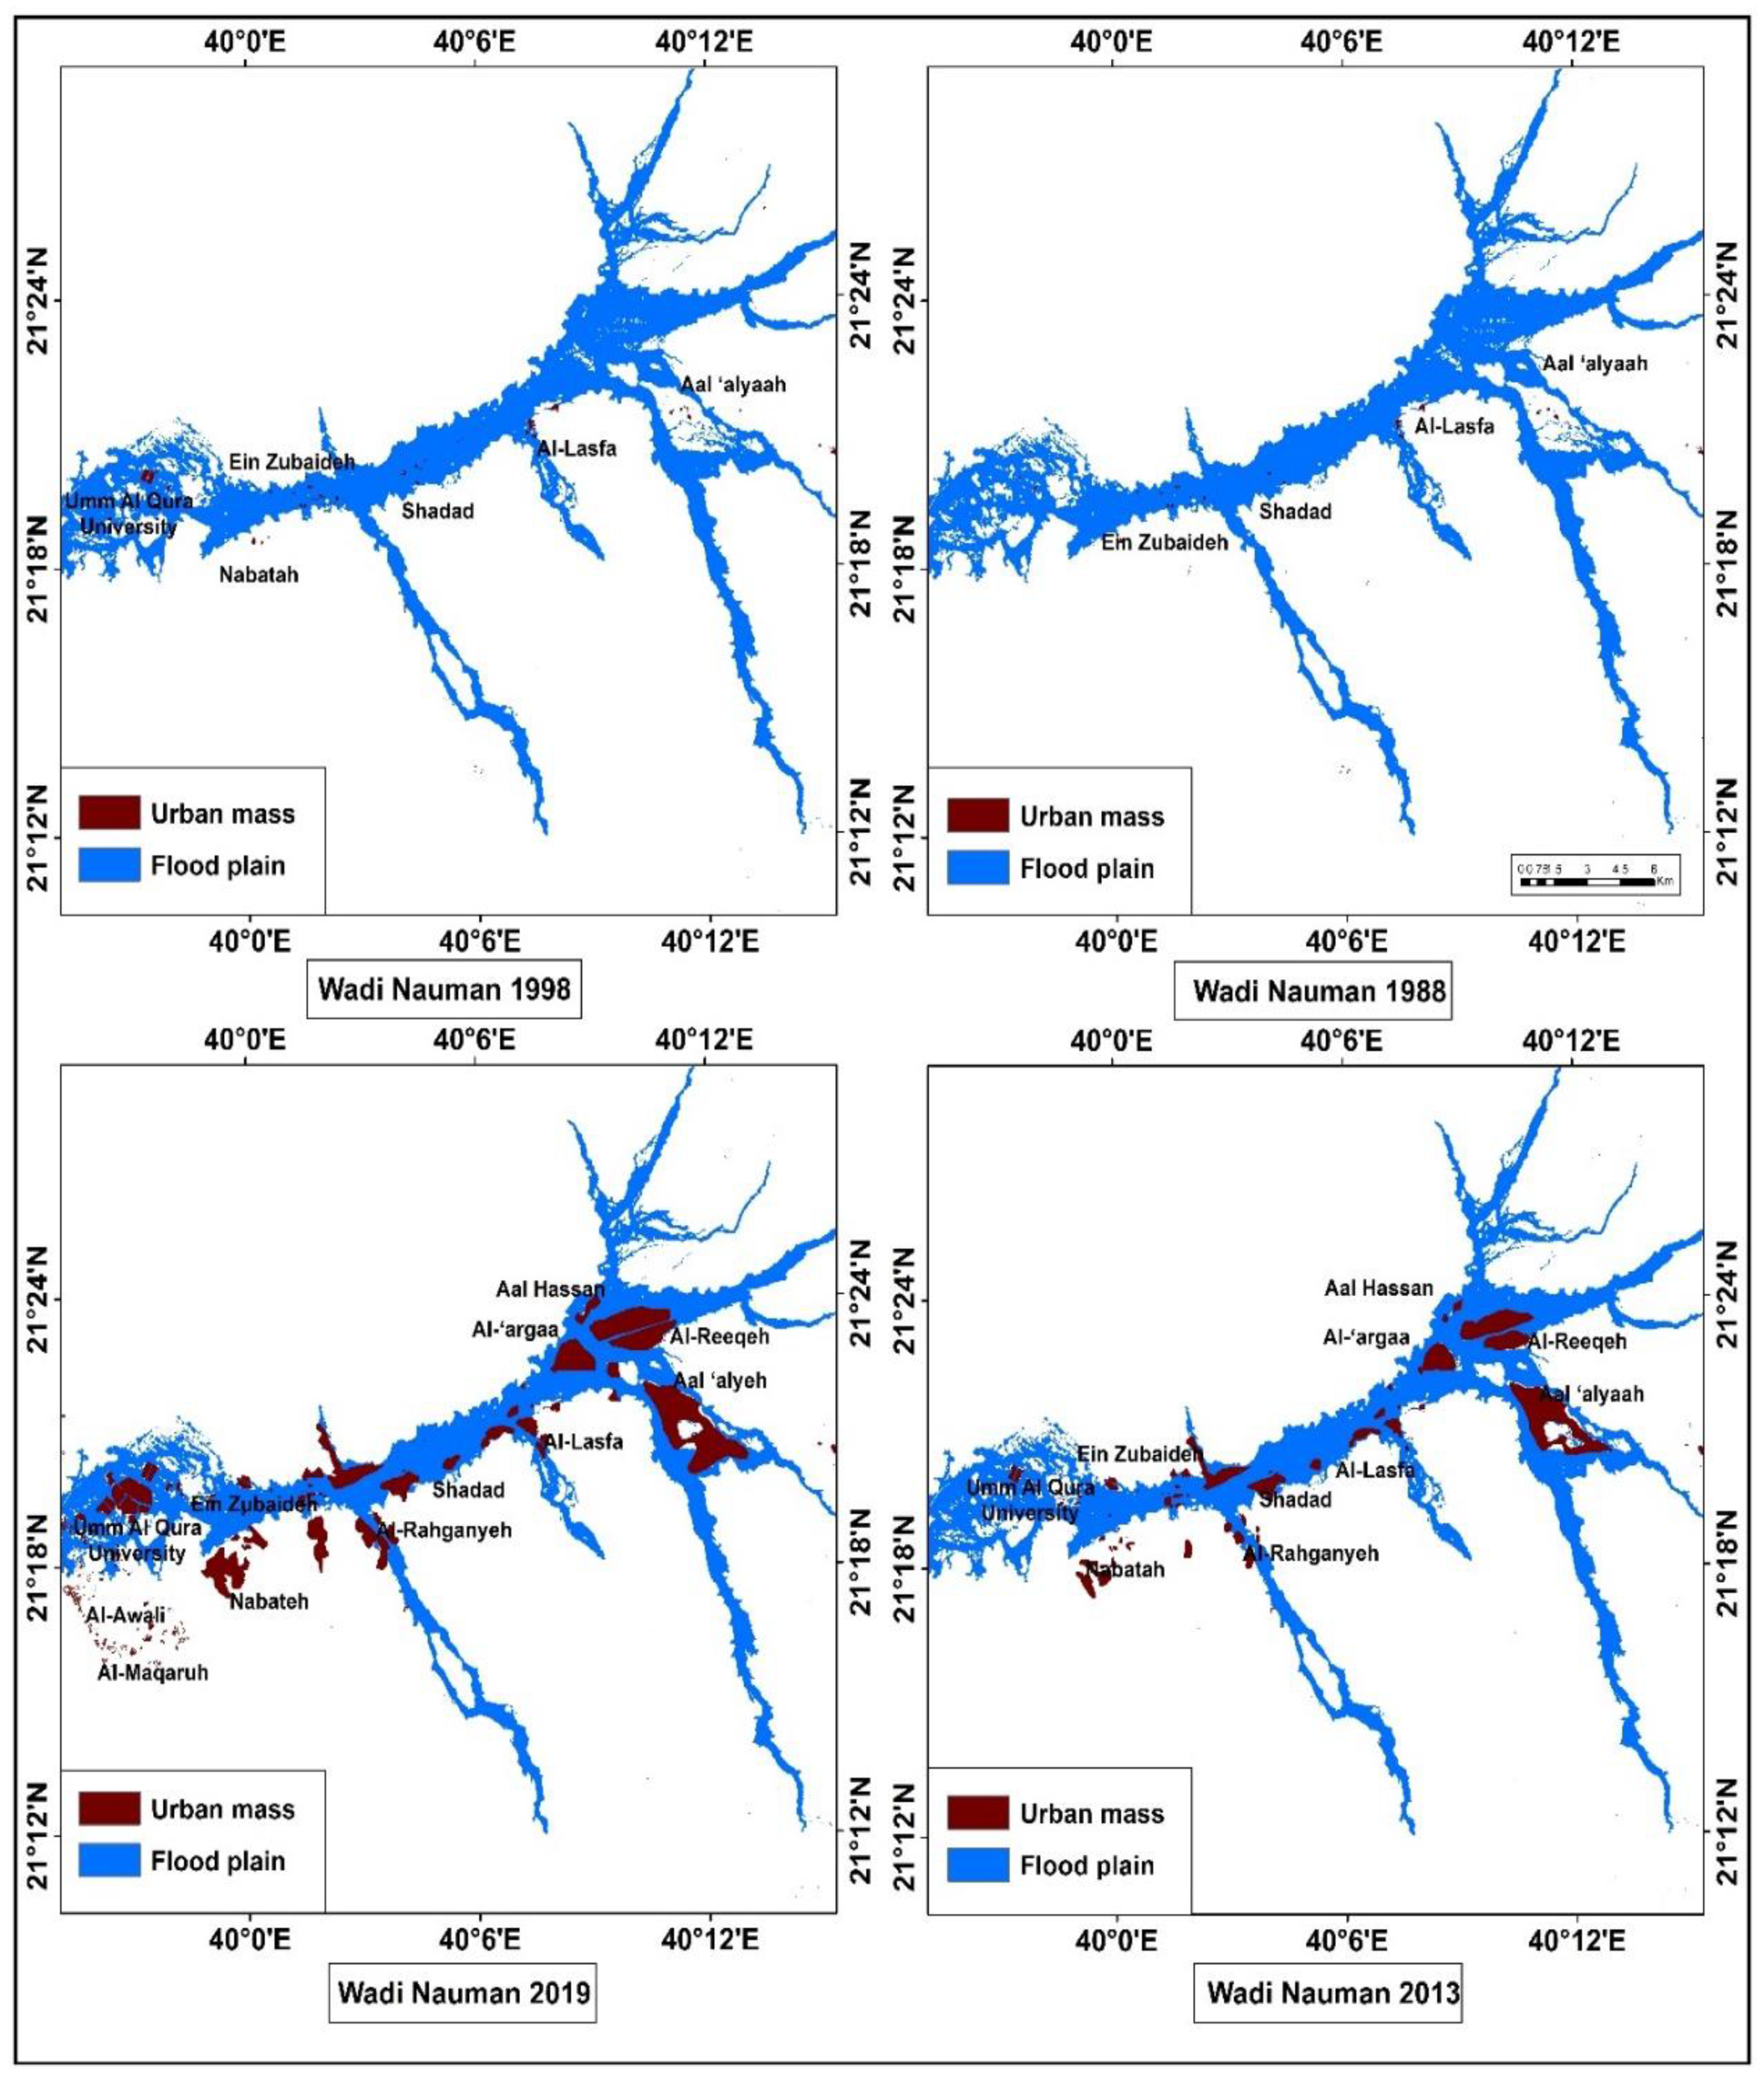
53]. In this study, four consecutive satellite images were loaded with a fixed separator every 10 years by the US Geological Survey (USGS) in order to monitor the changes in the Wadi Nu’man basin. The images were taken by the TM sensor on the American satellite, 4LANDSAT-5. The first image was taken in 1988; the second in 1998; and the third in 2013. The fourth satellite image was taken in 2019 by the OLI Sensor on the Landsat 8 satellite. The guided classification process was carried out using the method of the maximum likelihood. The classification accuracy of the satellite images was determined, and the time change of each classified phenomenon was detected using various calculations and quantitative indicators. These changes were measured by several scales, and Table 7 and Figure 17 show the results of monitoring the changes of the Wadi Nu’man basin during the period from 1988–2019.

5.1.1. Vegetation

Applying the vegetation index (NDVI) to the satellite image of the area of the Wadi Nu’man basin in 1988, it was apparent that the vegetation, whose value exceeded 0.05, covered about 87.63 km2, representing 12.74% of the total area of the Wadi Nu’man basin. Dense vegetation was concentrated in the south and northeast of the Wadi Nu’man basin, where there is a density of trees and plants on the high slopes, in addition to the existence of agricultural areas, located in the plains of Wadi Nu’man and its tributaries. In 1998, the area of vegetation, whose value exceeded 0.05, was about 107.46 km2, constituting about 15.62% of the total area of the Wadi Nu’man basin. In 2013, the area of vegetation, whose value exceeded 0.075, was about 129.02 km2, representing about 18.75% of the area of the Wadi Nu’man basin. In 2019, the area of vegetation, which exceeded 0.075, reached about 130.05 km2, representing about 18.9% of the total area of the Wadi Nu’man basin. This shows that the annual growth rate during the period from 1988–2019, was about 1.24%, and the average annual increase during the same period was 1.3 km2.

5.1.2. Urban Areas

Over the last century, the urban area of the Wadi Nu’man basin consisted of small, scattered urban areas. Since the beginning of this century, urban expansions have begun in the plains of the main valley and its tributaries, and urban communities, as well as future urban schemes, have begun to emerge in the form of residential areas and commercial schemes, some of which are slum areas and others are planned areas.
In 1988, the area of urban units reached about 0.53 km2, which spread in the plain areas of the main Wadi Nu’man, constituting about 0.08% of the total area of the Wadi Nu’man basin. This percentage multiplied in 1998, where the area of scattered urban units reached about 1 km2, representing about 0.15% of the total area of the Wadi Nu’man basin, with an increase of 88.7%, compared with the area of urban units in 1988. Then, there was an excessive increase in the area of the urban areas in 2013. The area of the urban areas and the new plans reached about 17.28 km2 in 2013. These areas occupied different parts in the plain areas of the main Wadi Nu’man and its tributaries, accounting for 2.51% of the total area of the Wadi Nu’man basin, with an increase of 1600%, compared with the area of urban units in 1998. This excessive increase is due to the establishment of complete urban communities and schemes. These expansions and urban schemes increased until 2019, when the area of urban areas and schemes reached about 26.9 km2, constituting about 3.91% of the total area of the Wadi Nu’man basin, as evidenced by the fact that the annual growth rate during the period from 1988–2019, was about 13.06%. This shows that the average annual increase during the same period reached 1 km2.

5.1.3. Desert Areas

The area of the Wadi Nu’man basin was originally a desert area, covered by scattered, impoverished trees and plants. In 1988, the barren desert areas and desert areas with scattered sparse vegetation reached about 599.9 km2, representing most of the area of the Wadi Nu’man basin and constituting about 87.19% of the total area of the basin. This area shrank during the period from 1988 to 2019 due to the reclamation of agricultural areas in the plains of Wadi Nu’man and its tributaries, in addition to the construction of many communities and urban schemes. These areas reached about 579.6 km2 in 1998, accounting for 84.24% of the total area of the Wadi Nu’man basin, with a decrease of 3.38%, compared with the situation in 1988. It continued to decrease, until it reached 541.76 km2 in 2013, accounting for 78.74% of the total area of the Wadi Nu’man basin, with a decrease of 6.53%, compared with the situation in 1998. In 2019, the area of these desert areas reached about 531.11 km2, representing 77.19% of the total area of the Wadi Nu’man basin. This shows that the annual growth rate reached −0.38% during the period from 1988–2019, and the average annual increase reached −2.15 km2 during the same period.

5.2. Characteristics of the Wadi Nu’man Flooding (Velocity m/s; Depth M; Risk m3/s) and Verification of the Flood Risk Model

Floods in urban areas have been and will continue to be a major problem in many cities in developed as well as developing countries. In order to reduce the impact of these floods, it is necessary to formulate an appropriate flood management policy, which is driven by the knowledge of the frequency and magnitude of the impacts of these floods. Flood risk maps can be used, as an effective tool for water resources and urban planning, by design engineers to assess the vulnerability of the infrastructure and population of this region to the floods [54].
Flood risk mapping and risk analysis of any of the drainage basins involves several factors or criteria [55,56]. The geographic information system (GIS) and remote sensing (RS) have contributed significantly to the analysis of natural hazards [57,58]. Over the past few decades, researchers have been involved in developing different methods and models for natural hazard mapping using RS and GIS technologies [59,60], such as the frequency [61,62], analytical hierarchy [63], fuzzy logic [64], logistic regression [65], artificial neural networks [66,67,68], evidence weights [69], multi-standard resolution [70,71], and hydraulic modeling, which is an essential tool for flood risk management and mitigation [33,72,73,74,75,76,77].
The first step in managing urban areas that are prone to flood risk is to prepare a risk map of the floods. Referring to the literature on the modelling of flood risks in urban areas, it was found that the risk matrix method, which is based on the development of a two-dimensional model of the depth, velocity, and spread of water using the hydraulic model (HEC-RAS), is one of the most prevalent methods in the scientific and engineering communities in flood risk assessment, as it provides a two-dimensional environment, and that is what risk modelling in urban areas requires [29]. The risk matrix presents the spatial extent of potential floods in different scenarios. It can be used either in quantitative or qualitative methods. Risk assessment is the identification of a potential risk that may occur at a specified time in the future, along with the determination of its severity and impact. The most important characteristic of this method is its suitability for urban areas. Maps of the water depth, velocity, and levels and flood severity were created. In order to use the model, details of the cross sections of the valley streams and the flow rate at the spring of the streams should be available (m3/s) [34]. Using the conservation of energy formula, the velocity and depth of the water can be calculated [78]. Many previous studies demonstrated that these models have yielded accurate and effective results in flood studies [79,80]. 
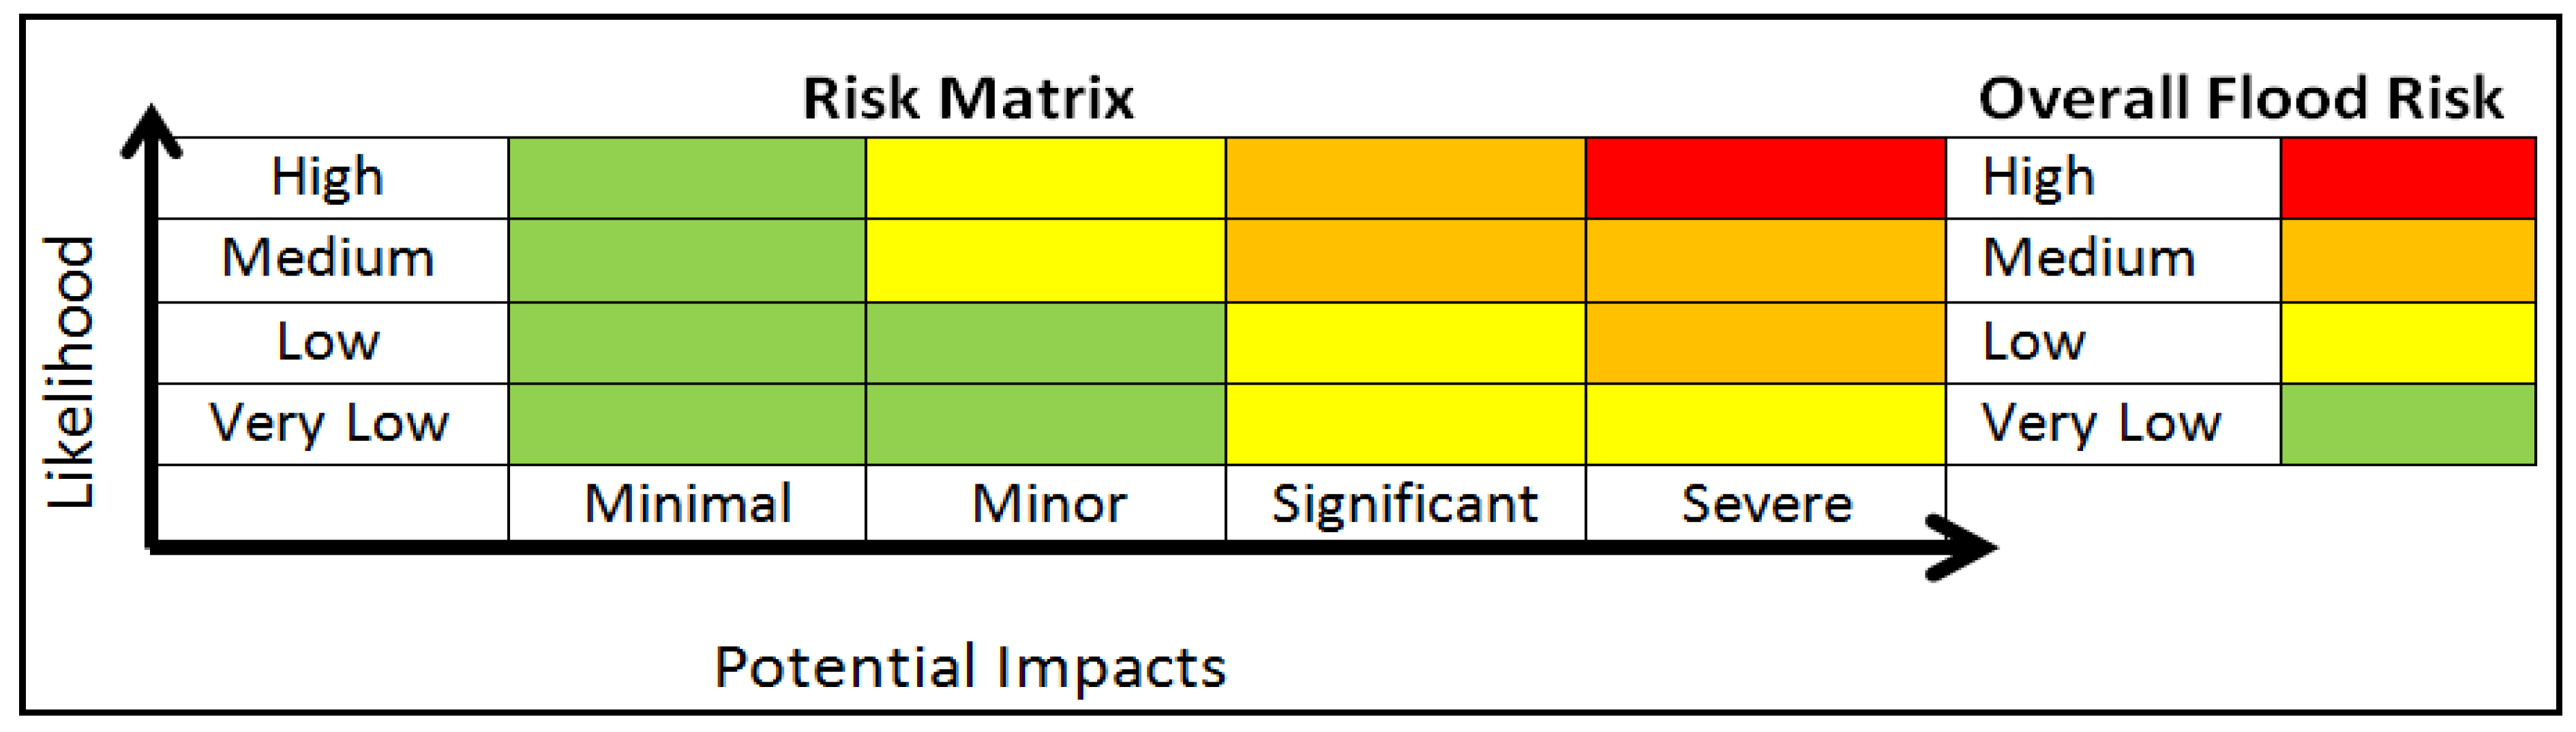
Figure 18 illustrates the classification of risks to humans using a risk assessment (HR). Table 8 shows the risk map classification based on the risk assessment (HR), and Table 9 shows the illustrated risk levels of floods based on the HEC-RAS program, which depends on the velocity and depth of the water. The risk equation is measured in the following equation:
HR = d (v + 0.5) + DF
where:
  • HR: Risk rate.
  • d: Flood water depth (m)
  • v: Flood velocity (M/w).
  • DF: A coefficient that takes sediments into account, and its value is assumed to be:
  • 5.0 for depths lesser than 25.0 m; and
  • 0.1 for depths greater than or equal to 25.0 m.
The analysis, shown in Table 10 and Figure 19, Figure 20, Figure 21 and 
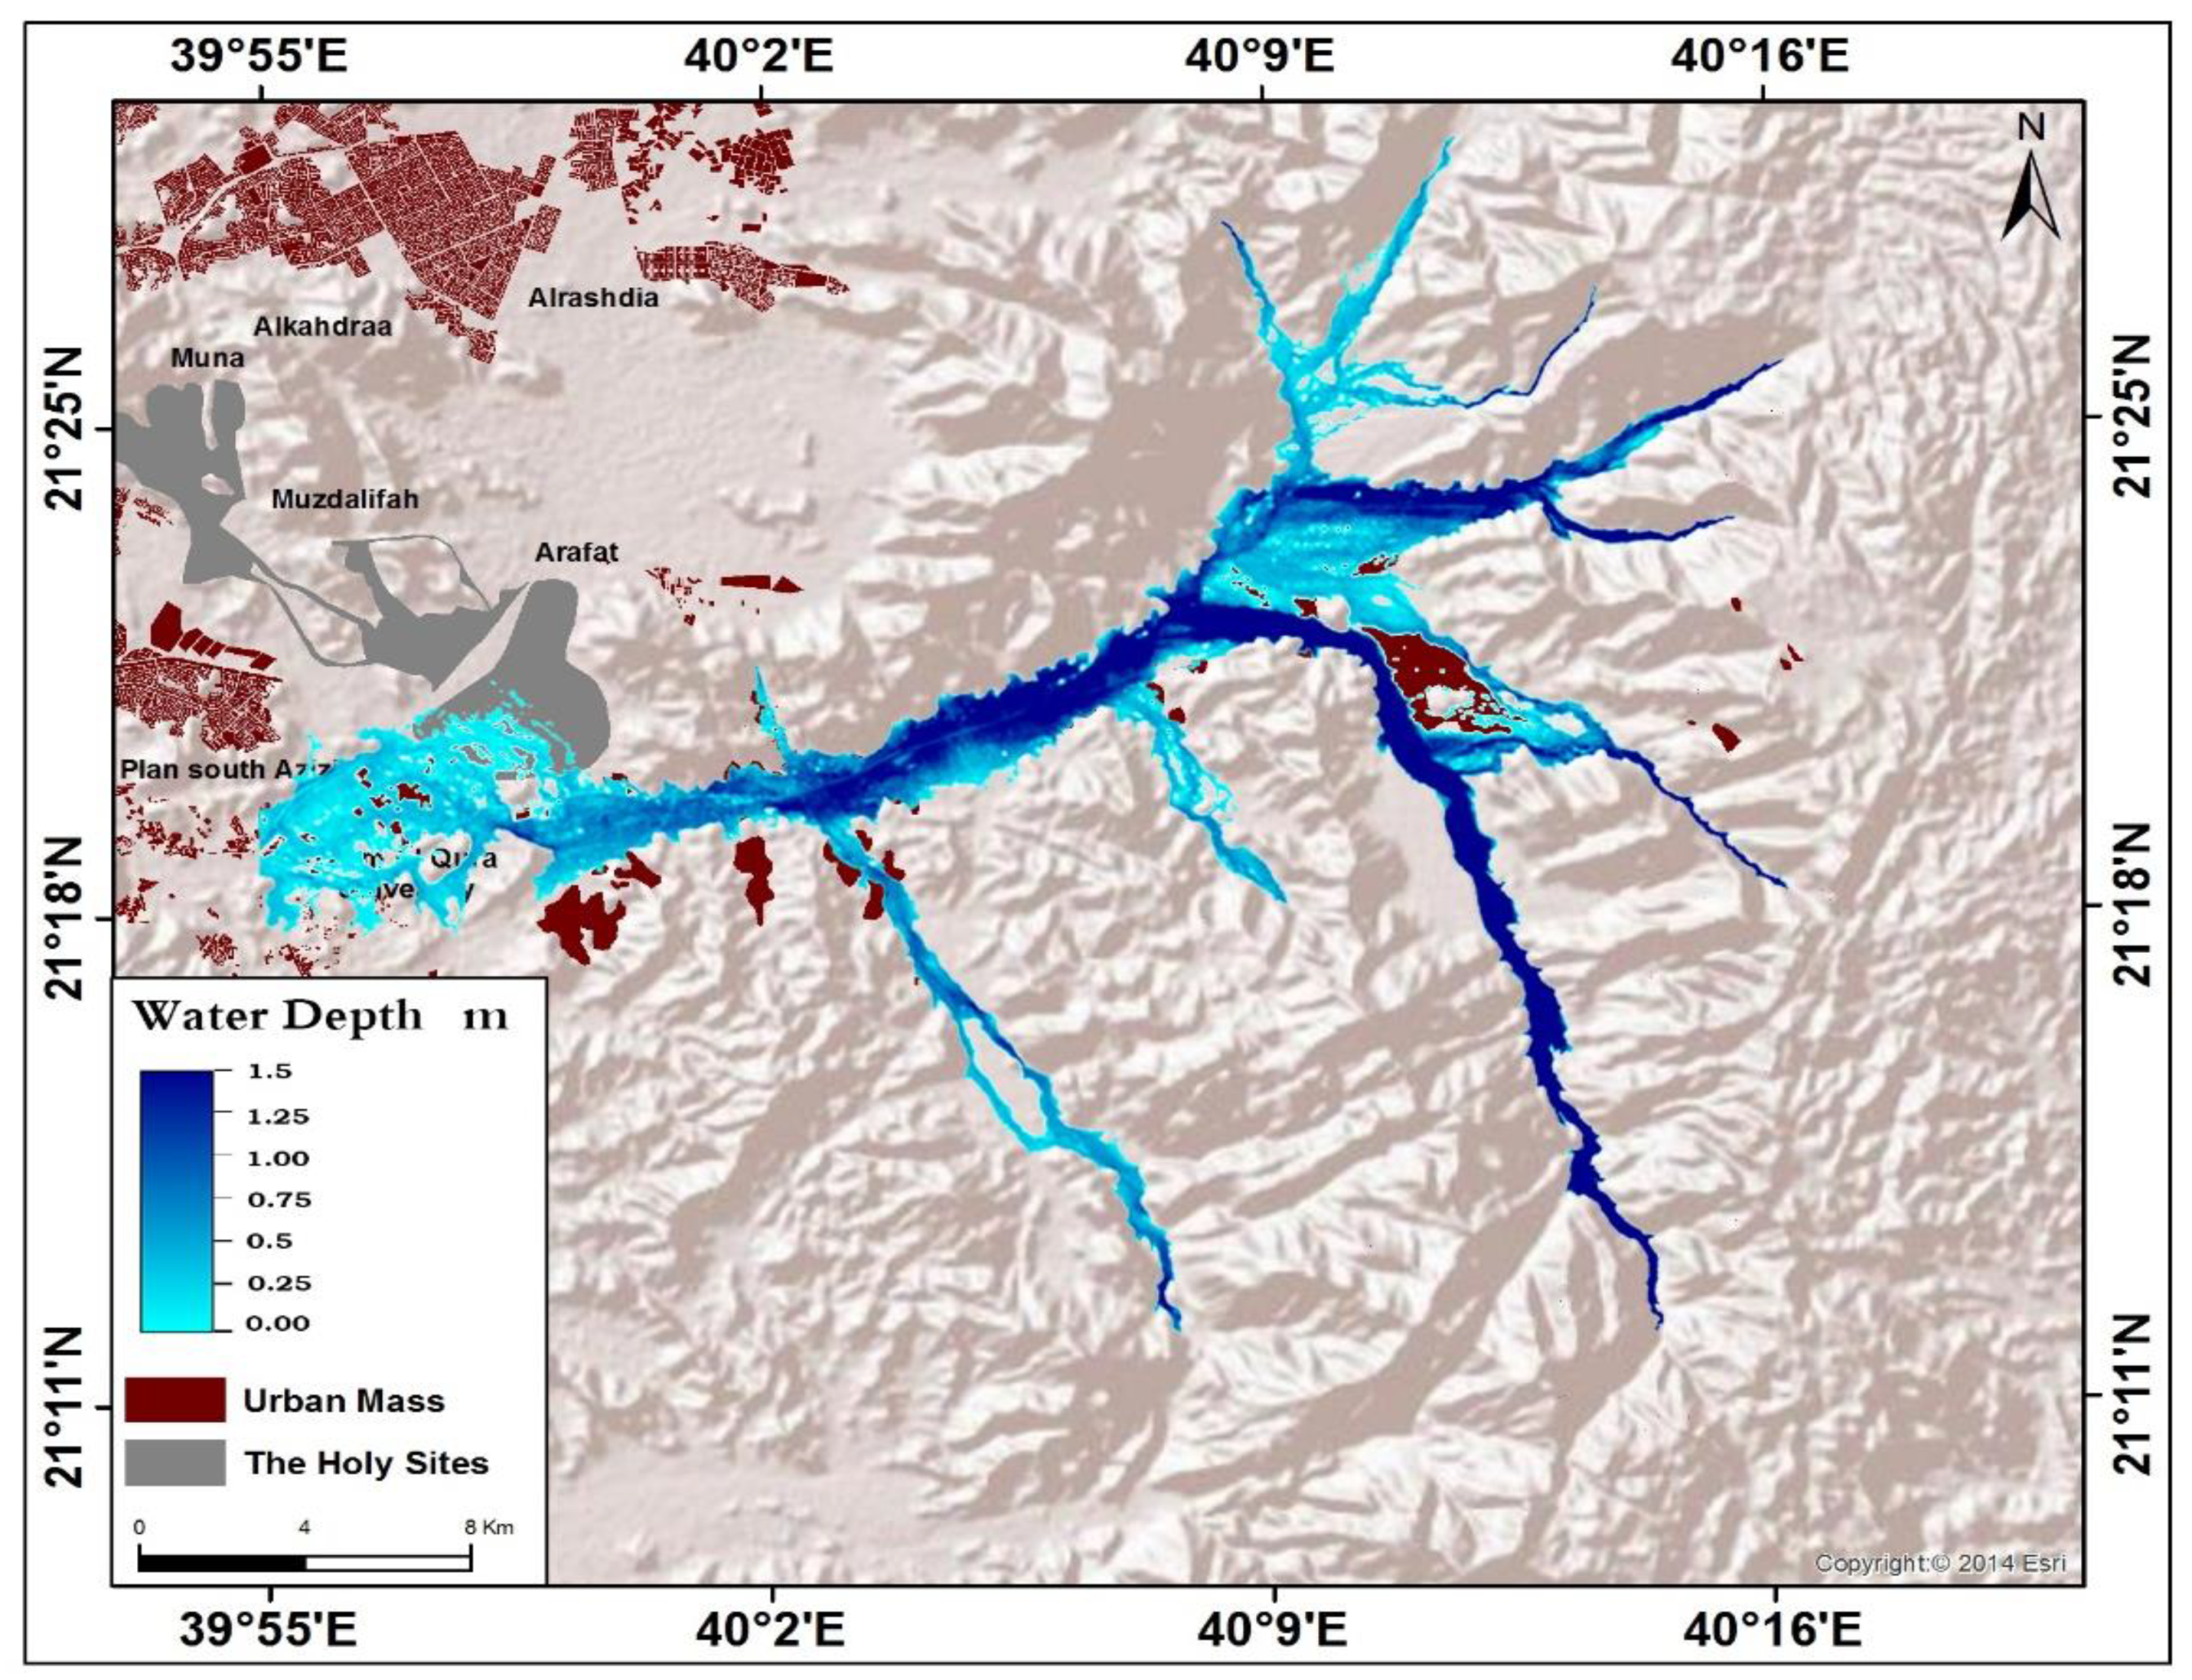
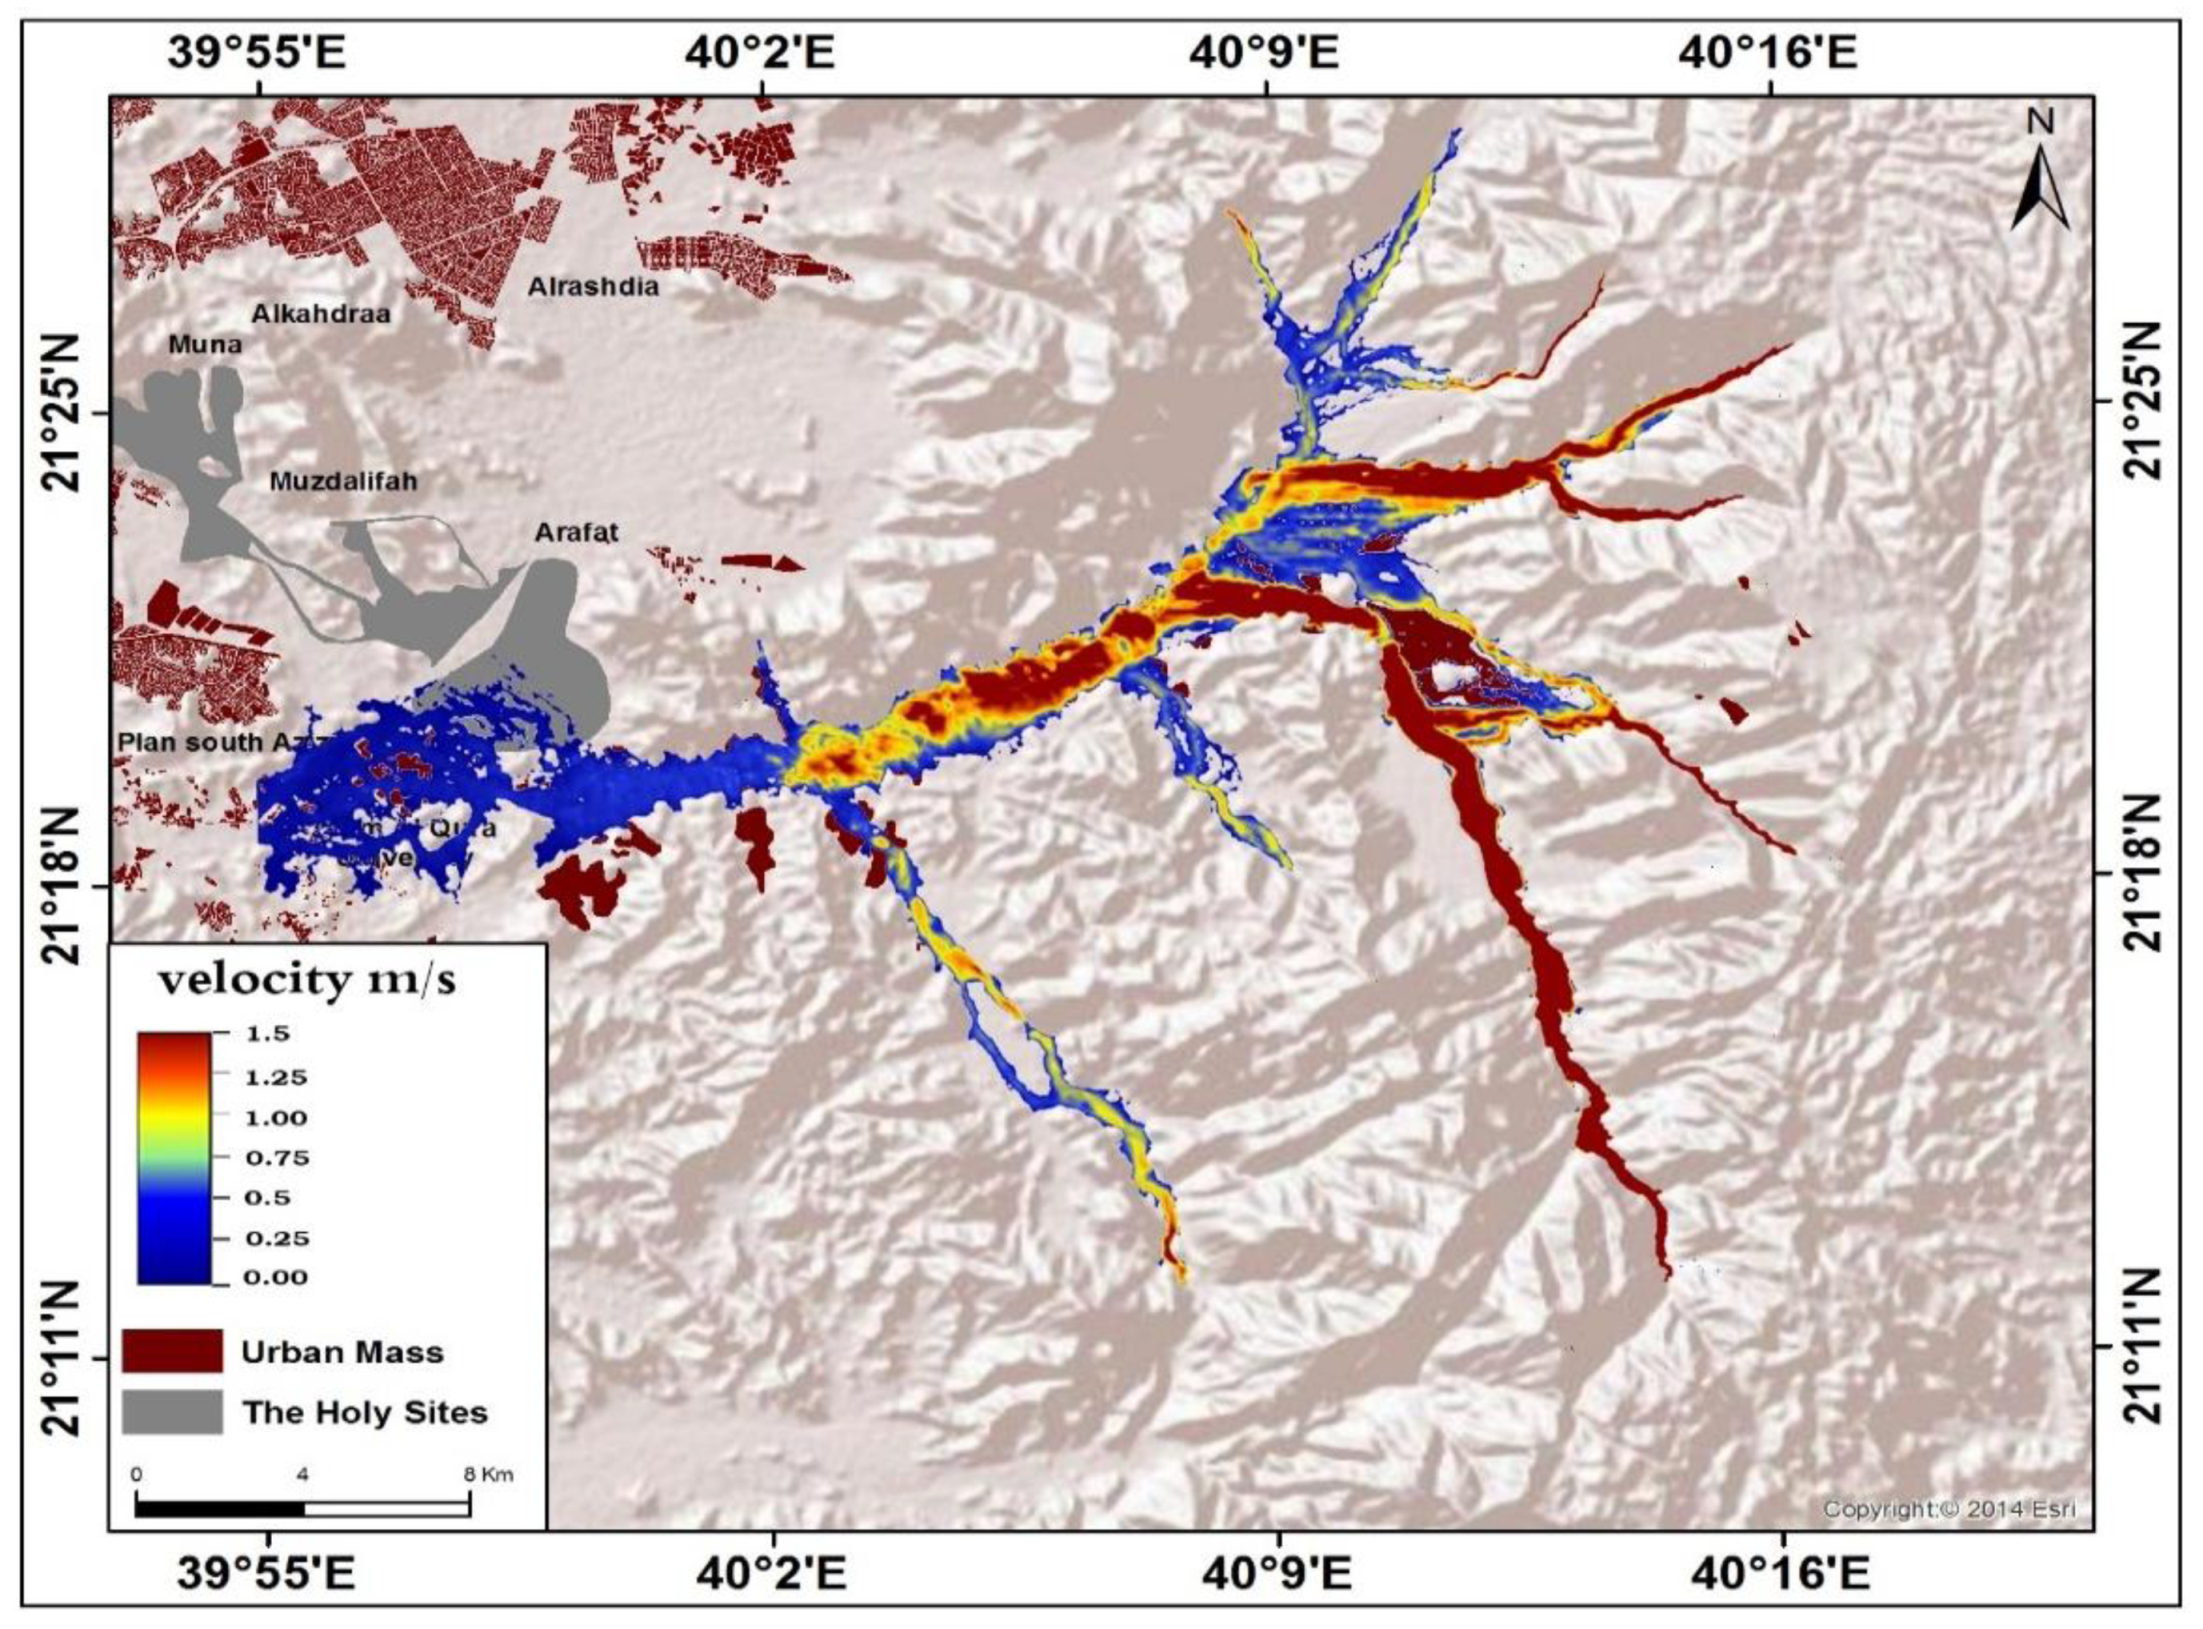
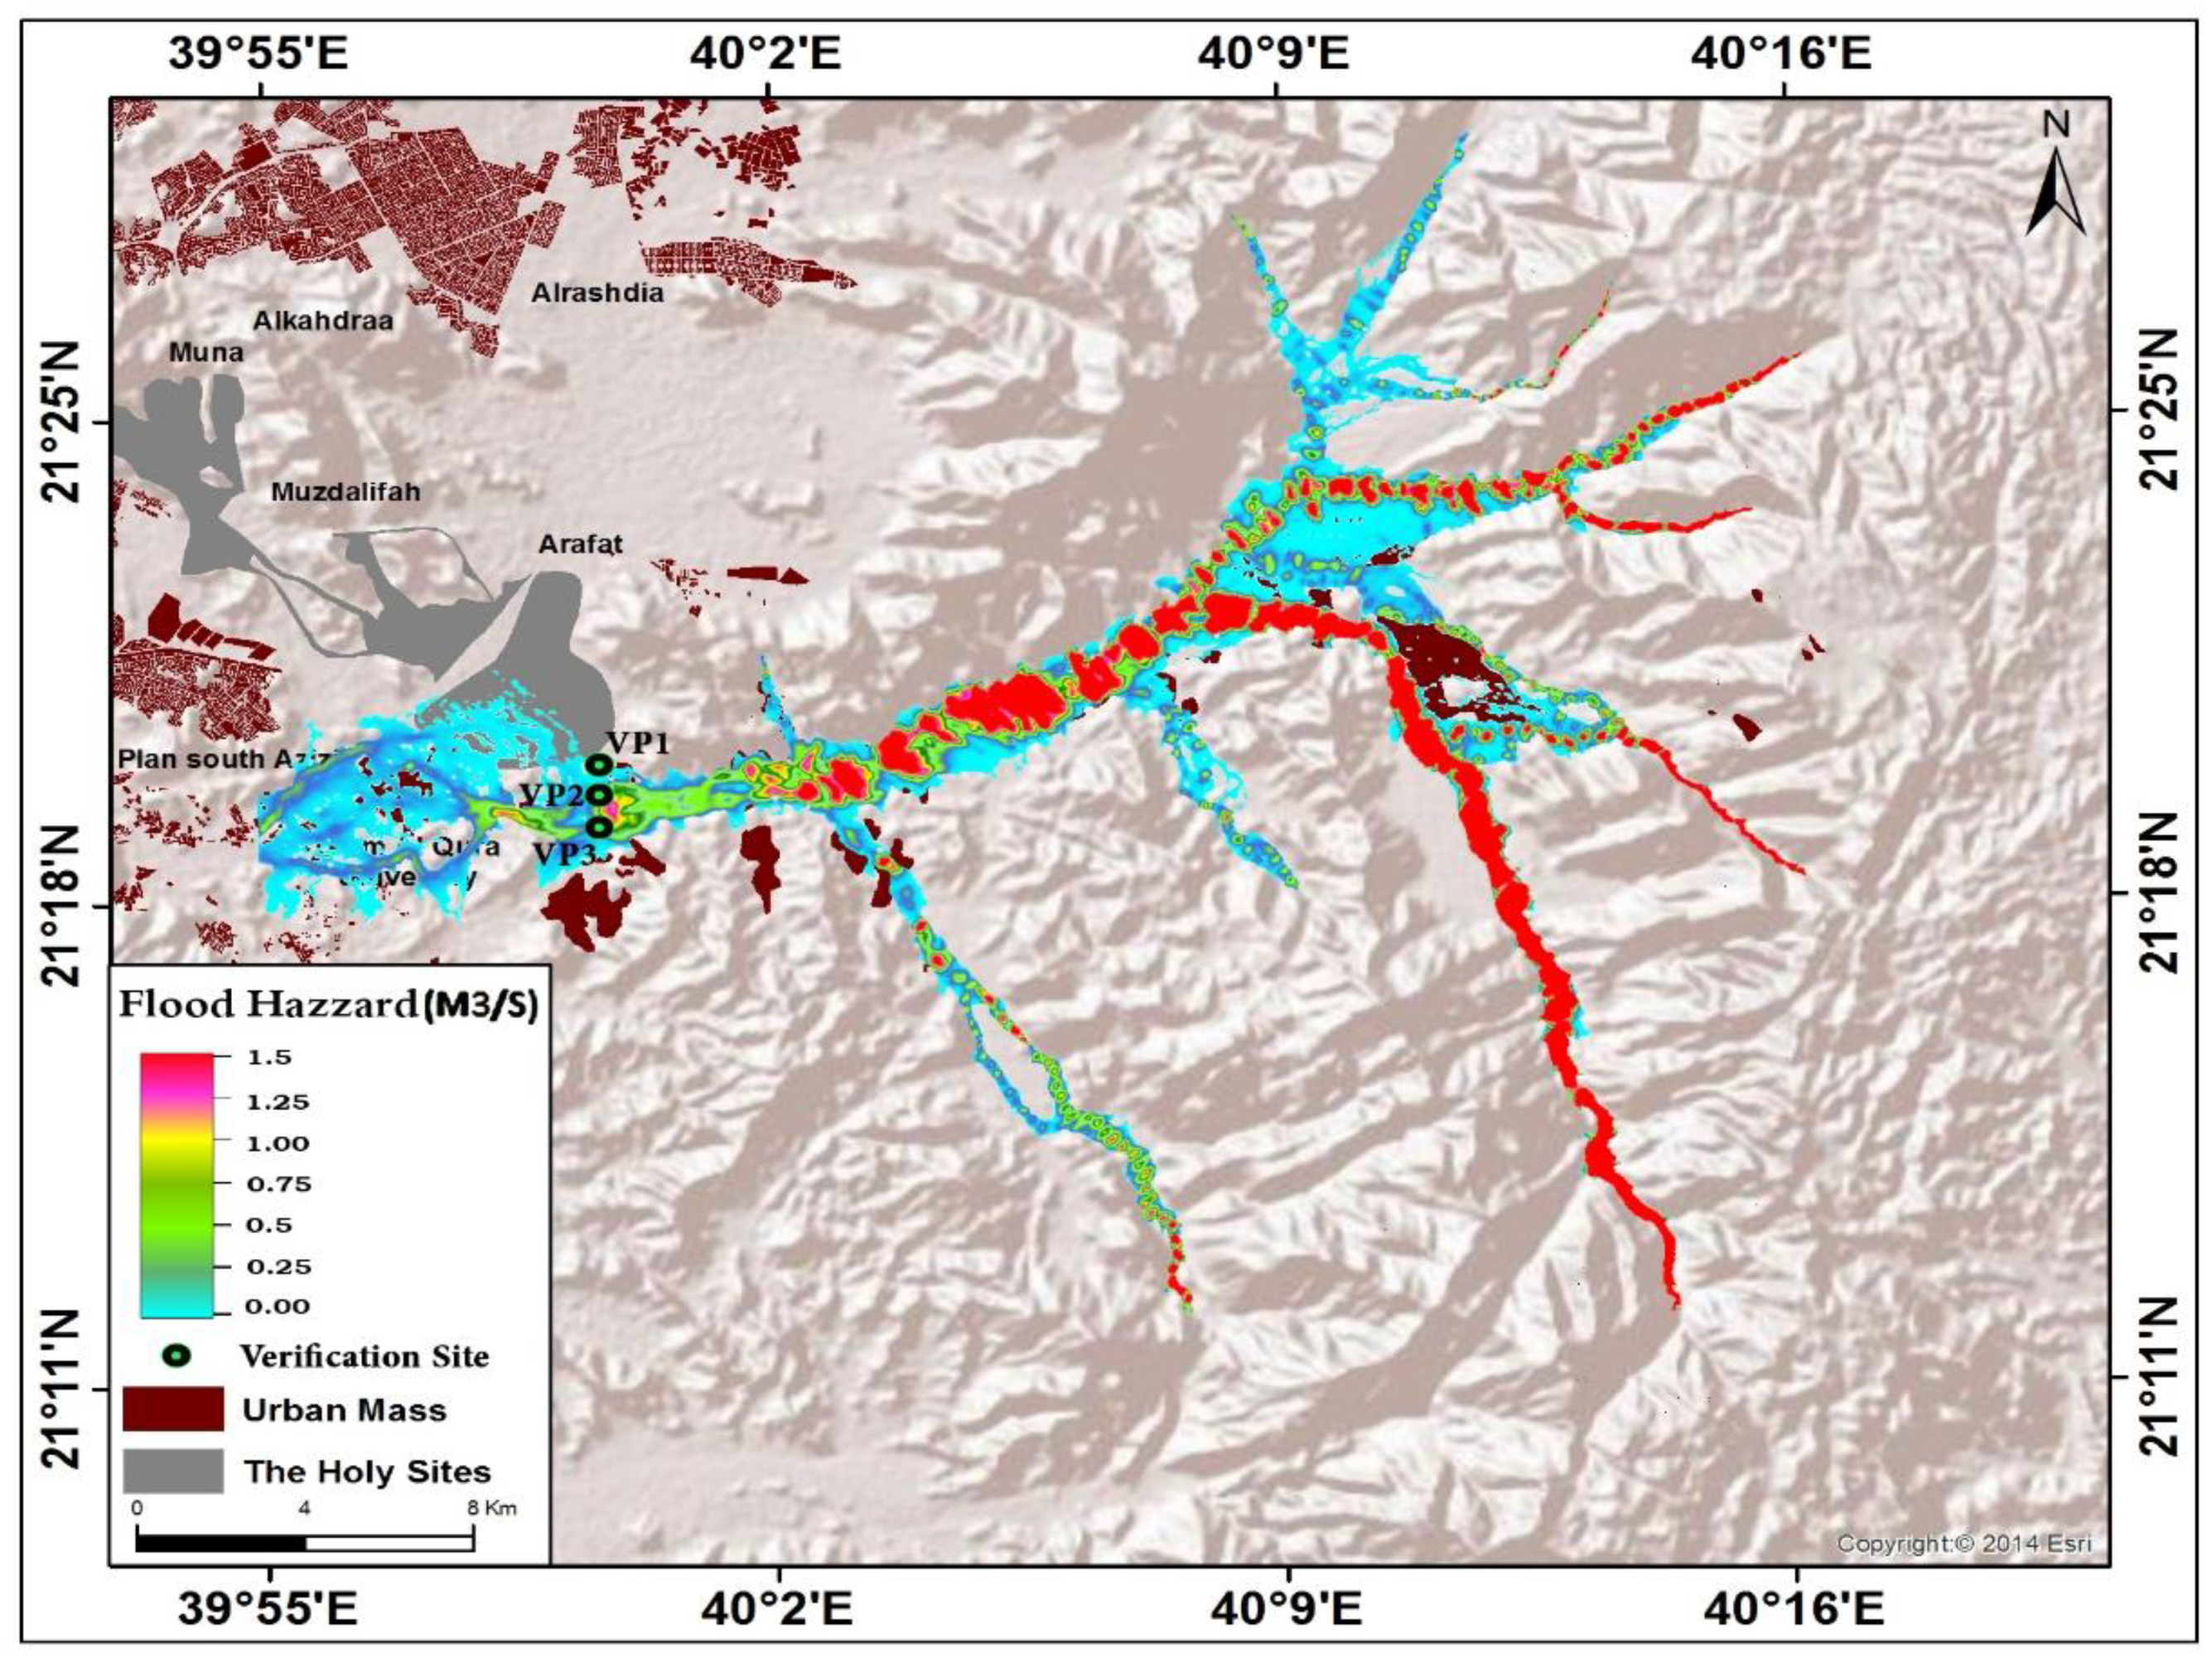
Figure 22, as well as field studies of the calibration and verification of flood scenarios that occurred in the city on 3 November 2018, showed that the high-depth category (3.5 upwards) represented about 45%, constituting about 15.67 km2. These areas are concentrated in the eastern and southern parts of Wadi Nu’man, particularly in the urban communities of Al-Lasqa, Al-‘alia, and Al-‘argaa. The high-velocity category (3.5 upwards), on the other hand, represents about 50% and constitutes about 74.61 km2. These areas are concentrated in the eastern and south-eastern parts of Wadi Nu’man, particularly in the urban communities of Al- Lasqa, Al-‘alia, and Al-‘argaa.
Historical flooding events were used in the verification sites (VP1–VP3) for the outputs from the flood risk analysis, constructed in the 2-D modeling using the hydraulic modelling program (HEC). The verification results were incorporated into a risk map, and Figure 21 shows the latest floods in the region on 3 November 2018, registered by the satellites, and also used the study to verify the validity of the models. Considering all of the estimates of experts and comparing them with the results of the model, the study could not use results similar to those for neighboring basins, where the study area and most of the dry valleys suffer from a lack of measurements of torrents and floods. Perhaps only one case of real measurements was detected for the rainstorm floods on 13 February 2010, which reached 55 mm in the basin of Wadi Garnha, adjacent to the basin of Wadi Nu’man, which resulted in high torrents that reached a peak discharge of 431 m3/s [81].
The checkpoints of the points, VP1–VP3, assembled in front of the university of Umm Al-Qura, indicated that the water level rose by 3.5–4 m, the water speed was 1–1.5 m/s, and estimates of the peak discharge ranged between 640–680 m3/s. These points were obtained from the database of the hydrological consultancy study for the construction of a dam and the university of Umm Al-Qura, under the supervision of the Faculty of Engineering at the university of Umm Al-Qura. Most of the results obtained from this verification indicate the reliability of the hydrological and hydraulic model that was built in this study, based on the hydraulic and hydrological modelling.
The results of the simulation were also found to be closer to the real situation. The high-risk hazards (5.3 upwards) represented about 45%, constituting about 15.67 km2 of the areas exposed to the flooding of Wadi Nu’man. These areas are concentrated in the eastern and south-eastern parts of Wadi Nu’man, particularly in the urban communities of Al-Lasqa, Al-‘alia, and Al-‘argaa.
The mid-risk hazards (1.5–3.5 m3/s), on the other hand, constituted about 35% and represented about 52.22 km2 of the areas exposed to the flooding of Wadi Nu’man. These areas are concentrated in the north-eastern parts of Wadi Nu’man, particularly in the urban communities of Al-Shathqaa and Rin. The low-risk hazards (0–1.5 m3/s) constituted about 20% and represented about 29.84 km2 of the areas prone to the flooding of Wadi Nu’man. These areas are concentrated heavily in the western parts of Wadi Nu’man, particularly in Al-Masha’er Al-Muqadasa, Umm Al-Qura university, and the Al-‘awali district. This requires decisive intervention by those involved in urban environment management and planning in the city of Mecca. A mechanism must be found to prevent the risk of the flooding of Wadi Nu’man threatening Al-Masha’er Al-Muqadasa.

5.3. Urban Areas Prone to Flooding in the Wadi Nu’man Basin during the Period from 1988–2019

Four phases were analyzed in order to arrive at the urban changes and the sub-basins affected by the flood hazards. Data analysis showed an increase in the areas prone to flood risk during the period from 1988–2019, which is approximately 25 times higher than the areas prone to flood risk in 1988 (from 0.53 km2 to approximately 26.4 km2). The increase of urban areas prone to flood reached approximately 26.4 km2, and this increase was spread over a period of thirty-one years, with a growth rate of 13.06% and an average annual increase of 1 km2. The period from 1998–2013, had the highest increase in the areas prone to the flood risk, as the annual growth rate of this period reached 20.92% (Table 11). Figure 23 illustrates the relationship between the flood risk of Wadi Nu’man and the urban development during the period from 1988–2019.
Urban areas exposed to flooding reached about 0.53 km2 in 1988. These areas were affected by the ‘alq, Nu’man, and ‘ar’ar valleys. The most important urban communities that were affected by flooding in that period were: Al-Lasfa, Aal ‘alyaah, Shadad, and Ein Zubaideh. The urban areas exposed to flooding in 1998 reached about 1 km2, and these areas were affected by the ‘alq, Nu’man, ‘ar’ar, and Rehgan valleys. The most important urban communities that were affected by the flooding of these valleys in that period were: Al-Lasfa, Aal ‘alyaah, Shadad, Ein Zubaideh, and Nabatah. As for the year 2013, urban areas prone to floods reached 17.28 km2, and these areas were affected by the ‘alq, Nu’man, ‘ar’ar, and Rehgan valleys. The most important urban communities that were affected by the flooding of these valleys in that period were: Ein Zubaideh, Al-Rahganyeh, Shadad, Al-Lasfa, Al-‘argaa, Aal Hassan, Nabatah, and Al-Reeqeh. In 2019, the areas exposed to flooding reached about 26.9 km2, and these areas were affected by the ‘alq, Nu’man, Ya’rug, Rehgan, and ‘ar’ar valleys. The most important urban communities that were affected by the flooding of these valleys in that period were: Ein Zubaideh, Nabatah, Al-Rahganyeh, Al-Reeqeh, Shadad, Al-Lasfa, Al-‘argaa, Aal Hassan, and Aal ‘alyeh.

5.4. Environmental Impacts of Flooding in the Wadi Nu’man Area

The delineation and classification of flood prone areas of the Wadi Nu’man area reveal that an area of about 37 km2 is affected by the floods. The geographical distribution of flood intensity zones are in the western and southern parts of the study area, with pivotal land uses, so these areas are subjected to destructive floods and environmental hazards, such as flood risks, and most of the infrastructure is located in the lower section of Wadi Nu’man.
The socio-economic problems of the study area exposed to the flood risk are crop damage, demolished buildings, and destroyed structures in the Al-Mash’ar area, affecting more than a million lives, according to the Hag times.
A lot of debris flow is caused by a combination of factors, which are particular to the area, and result in damage to the human life and property in the form of deposition, entrainment, or direct impact [82].
The chemical properties of groundwater were affected by the floodwaters of Wadi Nu’man, and some studies show that the average concentration of TDS, Mg, Na, Cl, No3, and EC decreased significantly after the floods. The major water types indicate that the infiltration of the surface water has a great influence on the groundwater chemistry.

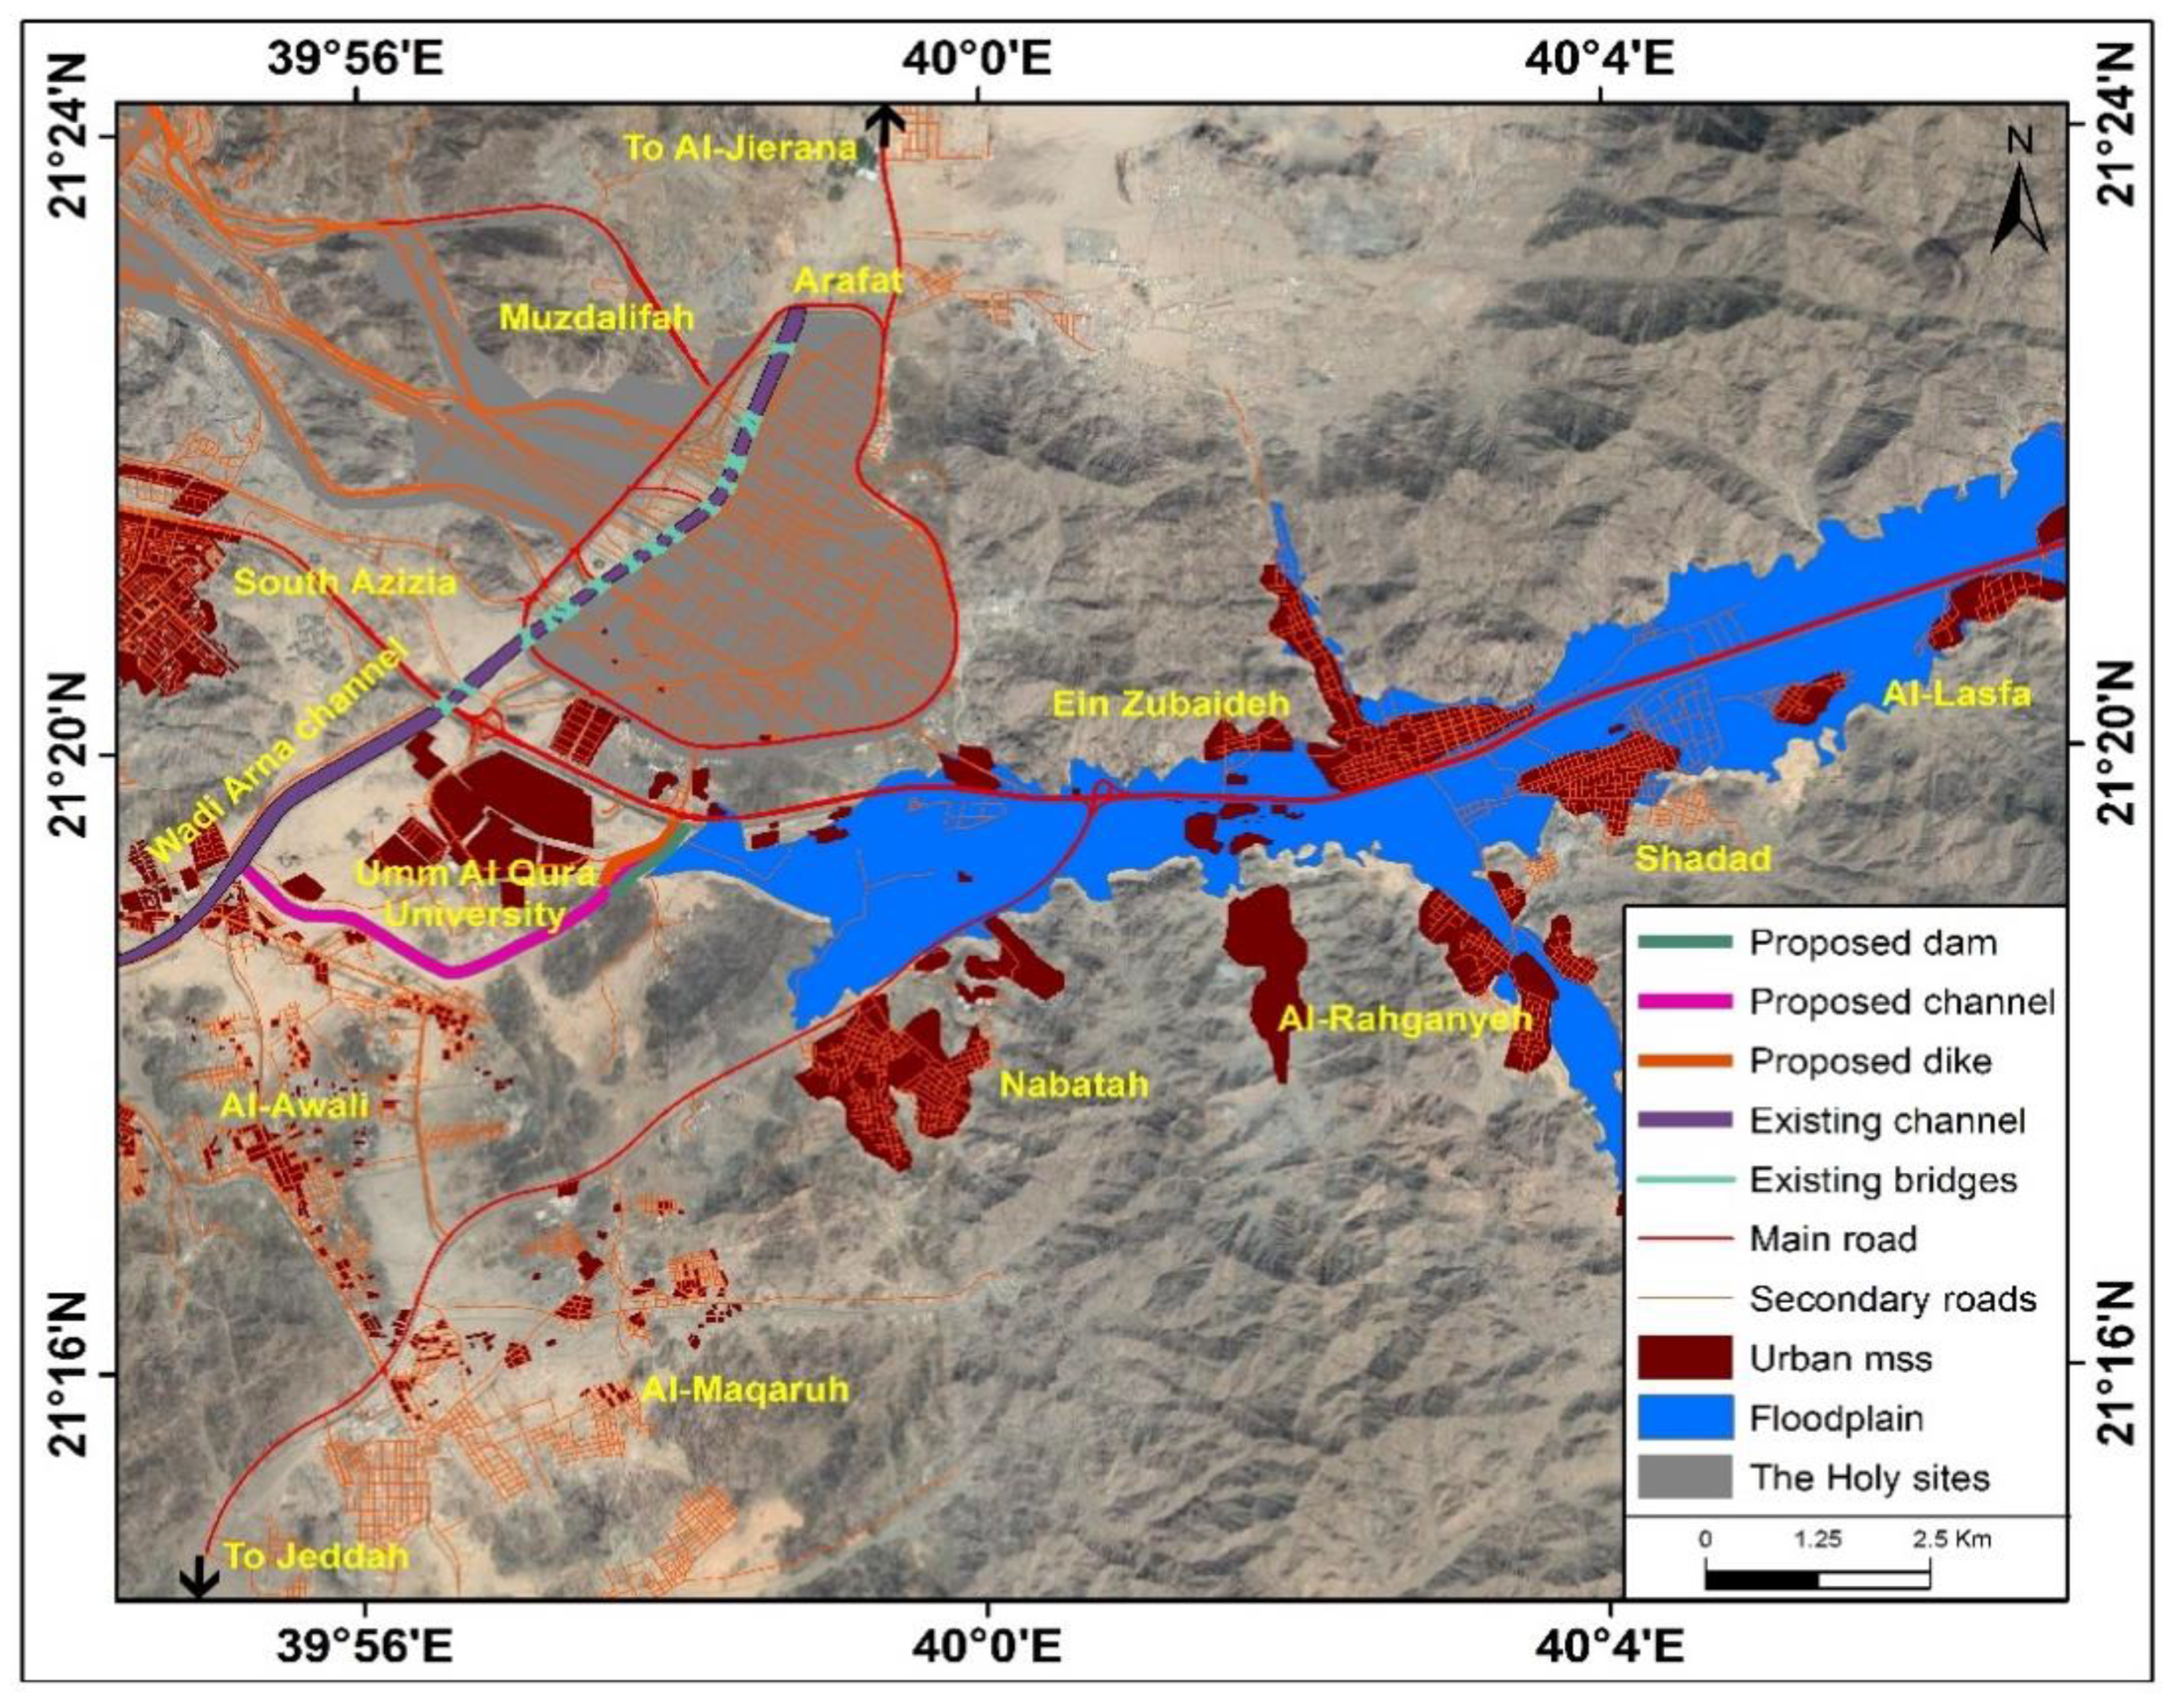
5.5. Suggested Measures and Protection Procedures against the Floods of Wadi Nu’man

Al-Masha’er Al-Muqadasa, Umm Al-Qura university, and many modern housing schemes are exposed to the floods of Wadi Nu’man, which are accompanied by large amounts of water and sediment, occurring over a short period of time. The existence of insufficient protection against this water may lead to enormous economic losses, the loss of many lives and a significant loss of property. On the other hand, the unstudied urban development of the top of the valley negatively affects the movement of the floodwater and sediment and increases the amount of loss; additionally, it leads to the formation of a slum area, filled with stones and dust around the divergence dam or the berm of Umm Al-Qura university, which led to the narrowing of the flood streams, increasing the velocity of the flow and raising the water level in front of the dam (Figure 24).
This is a serious issue that requires that the responsible authorities in the Infringements Committee of Mecca governorate and the municipality of the Holy Capital remove the encroachments in order to reduce the seriousness of potential disasters caused by great floods. This requires the establishment of hydraulic facilities in order to control, obstruct, and divert floods to prevent these hazards and protect people’s lives and property.
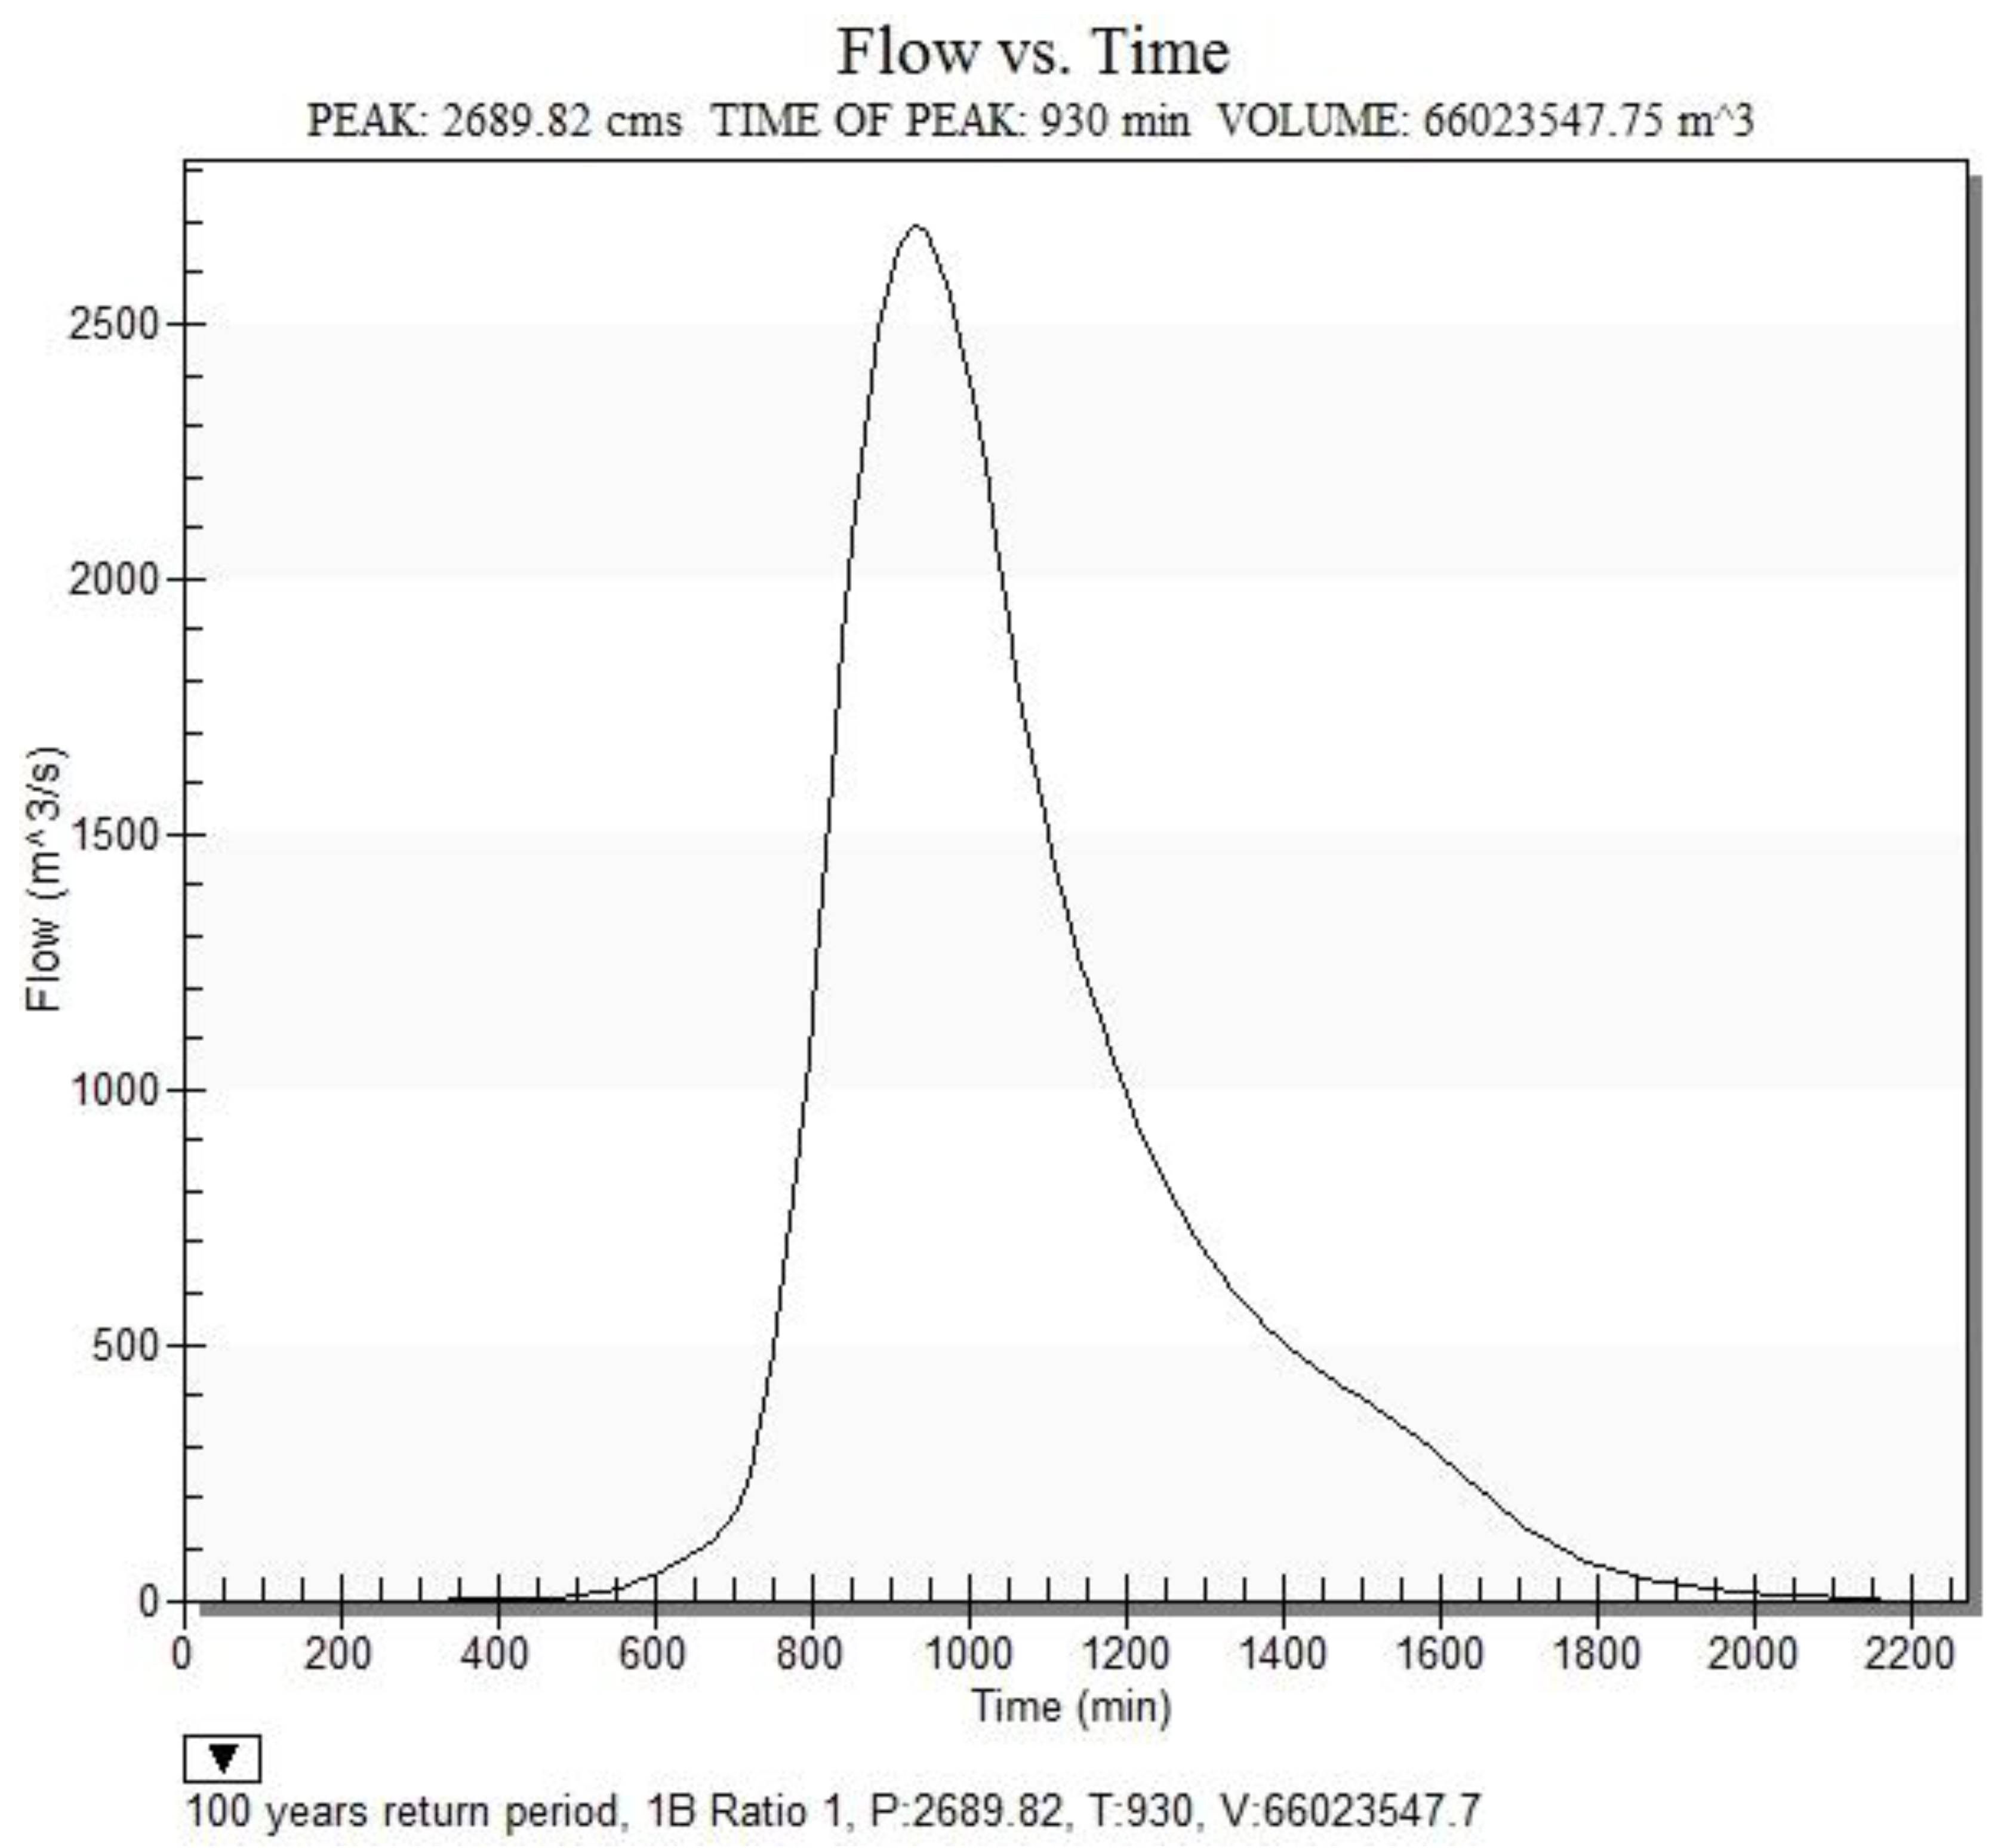
The designed drainage of a 100-year flood, based on the hydrological study of Wadi Nu’man, reached about 82.2689 m3/s. Consequently, the study suggests establishing a six-m high dam and developing an area, located in front of the diversion dam, while maintaining a channel with a width of 200 m and immediately expanding the channel in the part behind the dam (the controlling part) to a width of 200 m.
The forces affecting the dam, multiplied by the width of the stream of Wadi Nu’man’s water supply, equaled 200 m. The results of the analysis revealed that the height of the flood water will not exceed the height of the dam (5.7 m). The results also showed that the static forces reached 16 T/m and that the dynamic forces that resulted from the water’s velocity in a stream with a width of 200 m reached about 9.1 t/m. In any case, this local protection must be secured by a group of dams and lakes on the main branches of Wadi Nu’man, working on the fragmenting and dispersing of the flood water, before its catchment, to reduce the amount and the drainage of the water that reaches the site of the university and Al-Masha’er Al-Muqadasa (the southern part of Arafat). There should be a coordination with the concerned authorities, so that there will be no serious impact on the university and Al-Masha’er Al-Muqadasa, and in order for the solution to be complementary and economical.
The purpose of this alternative is to distribute the drainage of Wadi Nu’man to a rectangular channel, south of the dam, in the controlling part, with a width of 200 m. The hydraulic study of this solution showed that the depth of water in front of the dam will be less than 3 m, which means that the dam will not be flooded with water, and the water will not cross into the university, Al-Masha’er Al-Muqadasa of Arafat, or the surrounding residential communities. The southern channel can be expanded in order to reduce the height of water rises and reduce the risks of water for the population and the lands behind the dam. It is necessary to increase the width of the diversion channel of Wadi Nu’man at the end of the dam to at least 200 m. This requires rock cutting to a distance of 1225 m, and the rock cutting would reach about 2.2 million cubic meters. It is also necessary to refine the slope of the channel of the area to increase the drainage velocity. Figure 25 illustrates the protection measures proposed to prevent the risks associated with the floods of Wadi Nu’man. The proposals and solutions presented in the manuscript were subjected to public discussion and were discussed with decision-makers at the Holy City of Makkah, and they are based on the implementation and planning of the floods. The quantitative impact of these plans on the decision-makers’ ability to reduce the flood risk in quantitative terms was also measured.

6. Recommendations

The recommendations made based on this study prioritize the implementation of a plan for the prevention of flood hazards and the protection of infrastructure through the maintenance of existing floodwater drainage facilities, represented by the Wadi ‘ernah drainage channel, which lies to the west of Umm Al-Qura university and Al-Masha’er Al-Muqadasa of Arafat. This channel is of great importance due to its integration with the channel proposed in this study. The result of this study highlights the necessity of establishing hydraulic facilities for the control, obstruction, and divergence of the floods of Wadi Nu’man, and the specific recommendations are as follows:
  • The construction of a dam with a height of six m and the development of the area, located in front of the divergence dam, in addition to maintaining a channel with a width of 200 m and widening the channel in the part lying immediately after the end of the dam (the controlling part) to 200 m.
  • Increasing the width of the diversion channel of Wadi Nu’man, which is located at the end of the diversion dam, to a width of at least 200 m. This requires rock cutting to 1225 m, and the rock cutting would reach about 2.2 million cubic meters. It is also necessary to refine the slope of the channel of the area to increase the drainage velocity.
  • Increasing the height of the alluvial barrier, established to protect the southern side of the university, as well as the residential neighborhoods to the south of the university.
  • The protection of the western side of the university residence by placing an alluvial barrier, with a height of at least two m, along Wadi ‘erneh.
  • If urban development is allowed in the area located in Wadi Nu’man, to the east of the university residence, there must be a canal for the drainage of the valley’s floods, with a width of at least 200 m and a depth of 4.5 m.
  • The prevention of building in the streams of valleys and areas of flood catchment by assigning a reserve for each stream, which should not be infringed upon by the removal of the current encroachments. Moreover, there must be a mandatory study of the risks of floods, as well as their apex and catchments, provided with each project and submitted to the competent authorities for building permission.
  • The adoption of a plan to harvest water at the top of the sub-valleys of Wadi Nu’man, which would help greatly in providing people and farms with water. It would also help in afforestation, which slows down the floods and enables them to feed the underground reservoirs. At the same time, it would decrease part of the wasting floods towards the danger zone in the lowest part of the Wadi Nu’man basin. It should be included in projects that prevent flood risks, focusing on, e.g., drainage channels, barriers, canals, dams, water catchments, water harvesting, etc., in the upper or middle sectors of the valleys, but not in the periphery of the flood-targeted areas.

7. Conclusions

Al Masha’er Al Muqadasa, Umm Al-Qura university and many modern housing schemes are frequently exposed to the floods of Wadi Nu’man, whose drainage apex approximately reached 2689.82 m3/s during a return period of 100 years. During the time period from 1988–2019, the urban areas exposed to flooding increased by approximately 25 times since the year 1988 (from 0.53 km2 to 26.9 km2). This increase is distributed over thirty-one years, with a growth rate of 13.06% and an average annual increase of 1 km2. The high-risk category (3.5 upwards) dominates up to 45%, constituting about 67.15 km2 of the areas prone to the Wadi Nu’man flooding. The medium-risk areas (1.5–3.5 m3/s) constitute 35%, representing about 52.22 km2 of the areas prone to flooding. The low-risk category (0–1.5 m3/s) constitutes about 20% and represents about 29.84 km2 of the areas prone to flooding. The study showed that what contributed to the increase of the risk of floods in the area under study are the following: The adoption of urban plans, without considering the paths and tributaries of the valleys; constant landfilling, caused by the inhabitants and service developers, without a clear mechanism that prevents the dangers of floods on Al-Masha’er Al-Muqadasa; and the formation of a slum area filled with stones and dust around the diversion barrier of Umm Al-Qura university, which led to the narrowing of the flood streams, as well as an increase in the velocity of the flow, thus raising the level of the water. This requires a decisive intervention by those involved in the management and planning of the urban environment in the city of Mecca. A mechanism that prevents the dangers associated with the floods of Wadi Nu’man for Al-Masha’er Al-Muqadasa.
Therefore, the protection alternatives proposed in this study to prevent flood risks are realistic and in line with the kingdom’s 2030 plan and vision. They are as follows: The implementation of a range of new hydraulic facilities, integrated with the existing hydraulic ones via the construction of a six-m high dam, and the development of the area located before the divergence dam, while maintaining a channel with a width of 200 m and expanding the channel in the place immediately after the end of the dam (the controlling part) to a width of 200 m. These alternatives aim at distributing the drainage of Wadi Nu’man to a rectangular channel, south of the dam, which originates in the controlling part, with a width of 200 m. The hydraulic study of this solution showed that the depth of water in front of the dam would be less than 3 m, which means that the dam would not get flooded and that the flood would not reach the university, Al-Masha’er Al-Muqadasa of Arafat, or the surrounding residential communities. The southern channel could be expanded to reduce the water’s height, as well as the resultant risks that would threaten the population and the land behind the dam. Moreover, it is necessary to increase the width of the diversion channel of Wadi Nu’man to a width of at least 200 m.

Author Contributions

A.A.K. and A.F.D.G. designed the study, collected and analyzed the data, developed the research idea and planned the research activities, carried out the research, including collecting the input data and prepared manuscript, and carried out a statistical analysis of the obtained results., and interpreted the datas ,upervised the research activities and reviewed the final draft of the manuscript, A.A.K.wrote the manuscript, provided valuable comments in writing this paper, and professionally edited the manuscript. All authors have read and approved the final manuscript.

Funding

This research received no external funding.

Acknowledgments

The authors highly appreciate the constructive comments and suggestions provided by the anonymous reviewers in improving the quality of this manuscript.

Conflicts of Interest

The authors declare no conflicts of interest.

References

  1. Dewan, M.; Yamaguchi, Y. Land use and land cover change in Greater Dhaka, Bangladesh: Using remote sensing to promote sustainable urbanization. Appl. Geogr. 2009, 29, 390–401. [Google Scholar] [CrossRef]
  2. Ali, M.; Khan, J.; Aslam, I.; Khan, Z. Simulation of the impacts of land use change on surface runoff of Lai Nullah basin in Islamabad, Pakistan. Landsc. Urban Plan. 2011, 102, 271–279. [Google Scholar] [CrossRef]
  3. Miller, N.; Kepner, G.; Mehaffey, H.; Hernandez, M.; Miller, C.; Goodrich, C.; Kim, D.; Heggem, D.; Miller, P. Integrating landscape assessment and hydrologic modeling for land cover change analysis. J. Am. Water Resour. Assoc. 2002, 38, 915–929. [Google Scholar] [CrossRef]
  4. Sayal, J.; Densmore, A.L.; Carboneau, P. Analyzing the effect of land-use/cover changes at sub-catchment levels on downstream flood peaks: A semi-distributed modeling approach with sparse data. Catena 2014, 118, 28–40. [Google Scholar] [CrossRef]
  5. Rawat, S.; Biswas, V.; Kumar, M. Changes in land use/cover using geospatial techniques: A case study of Ramnagar town area, district Nainital, Uttarkhand, India. Egypt. J. Remote Sens. Space Sci. 2013, 16, 111–117. [Google Scholar] [CrossRef]
  6. Chaurasia, R.; Loshali, C.; Dhaliwal, S.; Sharma, K.; Kudrat, M.; Tiwari, K. Land use change analysis for agricultural management—A case study of Tehsil Talwandi Sabo, Punjab. J. Indian Soc. Remote Sens. 1996, 24, 115–123. [Google Scholar] [CrossRef]
  7. Chen, Y.; Xu, Y.; Yin, Y. Impacts of land use change scenarios on storm-runoff generation in Xitiaoxi basin, China. Quat. Int. 2009, 208, 121–128. [Google Scholar] [CrossRef]
  8. Amini, A.; Ali, T.; Ghazali, A.; Aziz, A.; Akib, S. Impacts of land-use change on stream flows in the Damansara Watershed, Malaysia. Arab. J. Sci. Eng. 2011, 36, 713–720. [Google Scholar] [CrossRef]
  9. Fox, M.; Witz, E.; Blanc, V.; Soulié, C.; Penalver, M.; Dervieux, A. A case study of land-cover change (1950–2003) and runoff in a Mediterranean catchment. Appl. Geogr. 2012, 32, 810–821. [Google Scholar] [CrossRef]
  10. Marco, C.; Antonio, M.; Javier, S.; Fernando, S. Flood Risk Evaluation in Urban Spaces: The Study Case of Tormes River (Salamanca, Spain). Int. J. Environ. Res. Public Health 2019, 16, 5. [Google Scholar] [CrossRef]
  11. Panagiotis, A.; Fotios, M.; Kyriakos, K.; Apostolos, V.; Nikos, K. Overflow Discharges and Flooding Areas from Flood Hydrographs Routing in Arda River, Greece. Hydrology 2018, 5, 31. [Google Scholar] [CrossRef]
  12. Zope, E.; Eldho, I.; Jothiprakash, V. Impacts of land use–land cover change and urbanization on flooding: A case study of Oshiwara River Basin in Mumbai, India. Catena 2016, 145, 142–154. [Google Scholar] [CrossRef]
  13. Wang, Y.; Chen, A.S.; Fu, G.; Djordjeviç, S.; Zhang, C.; Savi’c, D.A. An integrated framework for high resolution urban flood modelling considering multiple information sources and urban features. Environ. Model. Softw. 2018, 107, 85–95. [Google Scholar] [CrossRef]
  14. Bitew, G.; Mulugeta, A.; Miegel, K. Application of HEC-HMS Model for Flow Simulation in the Lake Tana Basin: The Case of Gilgel Abay Catchment, Upper Blue Nile Basin, Ethiopia. Hydrology 2019, 6, 21. [Google Scholar] [CrossRef]
  15. Sailesh, S.; Dilip, K.; Babita, P. Flood susceptibility analysis through remote sensing, GIS and frequency ratio model. Appl. Water Sci. 2018, 8, 66. [Google Scholar] [CrossRef] [Green Version]
  16. Sushila, R.; Bhagawat, R.; Sean, S. Flood Hazard Mapping of a Rapidly Urbanizing City in the Foothills (Birendranagar, Surkhet) of Nepal. Land 2018, 7, 60. [Google Scholar] [CrossRef]
  17. Song, Y.; Ming, H.; Che, H.; Ling, F. The Damage Assessment of Flood Risk Transfer Effect on Surrounding Areas Arising from the Land Development in Tainan, Taiwan. Water 2018, 10, 473. [Google Scholar] [CrossRef]
  18. Saud, M. Assessment of flood hazard of Jeddah area 2009, Saudi Arabia. J. Water Resour. Prot. 2010, 9, 839–847. [Google Scholar] [CrossRef]
  19. Youssef, A.; Pradhan, B.; Gaberr, A.; Buchroithner, M. Geomorphological Hazard Analysis along the Egyptian Red Sea Coast between Safaga and Quseir. Nat. Hazards Earth Syst. Sci. 2009, 9, 751–766. [Google Scholar] [CrossRef]
  20. Farhan, Y.; Anaba, O. Flash Flood Risk Estimation of Wadi Yutum (Southern Jordan) Watershed Using GIS Based Morphometric Analysis and Remote Sensing Techniques. Open J. Mod. Hydrol. 2016, 6, 79–100. [Google Scholar] [CrossRef] [Green Version]
  21. Bajabaa, S.; Masoud, M.; Al-Amri, N. Flash flood hazard mapping based on quantitative hydrology, geomorphology and GIS techniques (case study of Wadi Al Lith, Saudi Arabia). Arab. J. Geosci. 2014, 7, 1866–7511. [Google Scholar] [CrossRef]
  22. Ljubomir, G.; Dragan, P.; Zoran, B.; Siniša, D. Application of GIS-Interval Rough AHP Methodology for Flood Hazard Mapping in Urban Areas. Water 2017, 9, 360. [Google Scholar] [CrossRef]
  23. Kazakis, N.; Kougias, I.; Patsialis, T. Assessment of flood hazard areas at a regional scale using an index-based approach and analytical hierarchy process: Application in Rhodope–Evros region Greece. Sci. Total Environ. 2015, 538, 555–563. [Google Scholar] [CrossRef] [PubMed]
  24. Wang, Y.; Hong, H.; Chen, W.; Li, S.; Pamučar, D.; Gigović, L.; Drobnjak, S.; Tien Bui, D.; Duan, H. A Hybrid GIS Multi-Criteria Decision-Making Method for Flood Susceptibility Mapping at Shangyou, China. Remote Sens. 2019, 11, 62. [Google Scholar] [CrossRef]
  25. Siddayao, P.; Valdez, E.; Fernandez, L. Analytic hierarchy process (AHP) in spatial modeling for floodplain risk assessment. Int. J. Mach. Learn. Comput. 2014, 4, 450–457. [Google Scholar] [CrossRef]
  26. Ouma, Y.O.; Tateishi, R. Urban Flood Vulnerability and Risk Mapping Using Integrated Multi-Parametric AHP and GIS: Methodological Overview and Case Study Assessment. Water 2014, 6, 1515–1545. [Google Scholar] [CrossRef]
  27. Bates, D.; De, R. A simple raster-based model for flood inundation simulation. J. Hydrol. 2000, 236, 54–77. [Google Scholar] [CrossRef]
  28. Al-Zahrani, M.; Al-Areeq, A.; Hatim, O. Estimating urban flooding potential near the outlet of an arid catchment in Saudi Arabia. Geomat. Nat. Hazards Risk 2017, 8, 672–688. [Google Scholar] [CrossRef]
  29. Meghan, A.; Christophe, V.; hazel, F.; Sally, P. Flood Hazard Research Center, Flood Risk Management Consortium Methods for Creating a Flood Risk Assessment Tool; Middlesex University: London, United Kingdom, 2011. [Google Scholar]
  30. Martin, K.; Joshua, E.; Hongtao, W.; Fengting, L. Characterizing flood hazard risk in data-scarce areas, using a remote sensing and GIS-based flood hazard index. Nat. Hazards 2017, 89, 1369–1387. [Google Scholar] [CrossRef]
  31. Ismail, E. Flash Flood Hazard Mapping Using Satellite Images and GIS Tools: A case study of Najran City, Kingdom of Saudi Arabia (KSA). Egypt. J. Remote Sens. Space Sci. 2015, 18, 261–278. [Google Scholar] [CrossRef] [Green Version]
  32. Mohamed, A.; Amro, E.; Ahmed, K.; Moustafa, K.; Nassir, A.; Anis, C.; Kashif, N. Flash flood risk assessment in urban arid environment: Case study of Taibah and Islamic universities’ campuses, Medina, Kingdom of Saudi Arabia. Geomat. Nat. Hazards Risk 2019, 10, 780–796. [Google Scholar] [CrossRef]
  33. Abdel Karim, A.; Gaber, D.; Youssef, M.; Pradhan, B. Flood Hazard Assessment of the Urban Area of Tabuk City, Kingdom of Saudi Arabia by Integrating Spatial-Based Hydrologic and Hydrodynamic Modeling. Sensors 2019, 19, 1024. [Google Scholar] [CrossRef] [PubMed]
  34. Feldman, D. Hydrologic Modeling System HEC-HMS: Technical Reference Manual; US Army Corps of Engineers, Hydrologic Engineering Center: Davis, CA, USA, 2000; pp. 1–138.
  35. Soil Conservation Services (SCS). National Engineering Handbook. Section 4: Hydrology; US Department of Agriculture, Soil Conservation Service, Engineering Division: Washington, DC, USA, 1985.
  36. Hyfran, M. Developed by INRS-Eau with Collaboration of Hydro-Québec Hydraulic Service (Department Hydrology). in the Framework of Hydro-Québec/CRSNG Statistical Hydrology Chair Located at INRS-Eau. 1998. Available online: http://www.wrpllc.com/books/hyfran.html (accessed on 15 November 2018).
  37. Ponce, V.M.; Hawkins, R.H. Runoff Curve Number: Has It Reached Maturity? J. Hyrol. Eng. 1996, 1, 11–19. [Google Scholar] [CrossRef]
  38. Istomina, M.N.; Kocharyan, A.G.; Lebedeva, I.P. Floods: Genesis, socioeconomic and environmental impacts. Water Resour. 2005, 32, 349–358. [Google Scholar] [CrossRef]
  39. Brath, A.; Montanari, A.; Moretti, G. Assessing the effect on flood frequency of land use change via hydrological simulation (with uncertainty). J. Hydrol. 2006, 324, 141–153. [Google Scholar] [CrossRef]
  40. Mao, D.; Cherkauer, A. Impacts of land-use change on hydrologic responses in the Great Lakes region. J. Hydrol. 2009, 374, 71–82. [Google Scholar] [CrossRef]
  41. Sheng, J.; Wilson, J.P. Watershed urbanization and changing flood behavior across the Los Angeles metropolitan region. Nat. Hazards 2009, 48, 41–57. [Google Scholar] [CrossRef]
  42. Solin, L.; Feranec, J.; Novacek, J. Land cover changes in small catchments in Slovakia during 1990-2006 and their effects on frequency of flood events. Nat. Hazards 2011, 56, 195–214. [Google Scholar] [CrossRef]
  43. Nirupama, N.; Simonovic, S. Increase of flood risk because of urbanization: A Canadian example. Nat. Hazards 2007, 40, 25. [Google Scholar] [CrossRef]
  44. Saghafian, B.; Farazjoo, H.; Bozorgy, B.; Yazdandoost, F. Flood intensification because of changes in land use. Water Resour. Manag. 2008, 22, 1051–1067. [Google Scholar] [CrossRef]
  45. Suarez, P.; Anderson, W.; Mahal, V.; Lakshmanan, T.R. Impacts of flooding and climate change on urban transportation: A system wide performance assessment of the Boston Metro Area. Transp. Res. Part D Transp. Environ. 2005, 10, 231–244. [Google Scholar] [CrossRef]
  46. Ramachandra, V.; Mujumdar, P. Urban floods: Case study of Bangalore. Disaster Dev. 2009, 3, 1–98. [Google Scholar]
  47. Huong, L.; Pathirana, A. Urbanization and climate change impacts on future urban flooding in Can Tho city, Vietnam. Hydrol. Earth Syst. Sci. 2013, 17, 379–394. [Google Scholar] [CrossRef] [Green Version]
  48. Neuvel, M.; van den Brink, A. Flood risk management inDutch local spatial planning practices. J. Environ. Plan. Manag. 2009, 52, 865–880. [Google Scholar] [CrossRef]
  49. Audisio, C.; Turconi, L. Urban floods: A case study in the Savigliano area (North-Western Italy). Nat. Hazards Earth Syst. Sci. 2011, 11, 2951–2964. [Google Scholar] [CrossRef]
  50. Špitalar, M.; Gourley, J.J.; Lutoff, C.; Kirstetter, P.E.; Brilly, M.; Carr, N. Analysis of flash flood parameters and human impacts in the US from 2006 to 2012. J. Hydrol. 2014, 519, 863–870. [Google Scholar] [CrossRef]
  51. Ran, J.; Nedovic-Budic, Z. Integrating spatial planning and flood risk management: A new conceptual framework for the spatially integrated policy infrastructure. Comput. Envrion. Urban Syst. 2016, 57, 68–79. [Google Scholar] [CrossRef] [Green Version]
  52. Zhu, Z.; Woodcock, E. Continuous change detection and classification of land cover using all available Landsat data. Remote Sens. Environ. 2014, 144, 152–171. [Google Scholar] [CrossRef] [Green Version]
  53. Seto, C.; Woodcock, E.; Song, C.; Huang, X.; Lu, J.; Kaufmann, K. Monitoring land-use change in the Pearl River Delta using Landsat TM. Int. J. Remote Sens. 2002, 23, 1985–2004. [Google Scholar] [CrossRef]
  54. Fernandez, S.; Lutz, A. Urban flood hazard zoning in Tucumán Province, Argentina, using GIS and multicriteria decision analysis. Eng. Geol. 2010, 111, 90–98. [Google Scholar] [CrossRef]
  55. Xu, C.; Chen, Y.; Chen, Y.; Zhao, R.; Ding, H. Responses of surface runoff to climate change and human activities in the arid region of Central Asia: A case study in the Tarim River Basin, China. Environ. Manag. 2013, 51, 926–938. [Google Scholar] [CrossRef] [PubMed]
  56. Poussin, J.K.; Botzen, W.; Aerts, H. Factors of influence on flood damage mitigation behavior by households. Environ. Sci. Policy 2014, 40, 69–77. [Google Scholar] [CrossRef]
  57. Patel, D.P.; Srivastava, K. Flood hazards mitigation analysis using remote sensing and GIS: Correspondence with town planning scheme. Water Resour. Manag. 2013, 27, 2353–2368. [Google Scholar] [CrossRef]
  58. Moel, D.; Vliet, V.; Aerts, H. Evaluating the effect of flood damage-reducing measures: A case study of the unembanked area of Rotterdam, the Netherlands. Reg. Environ. Chang. 2014, 14, 895–908. [Google Scholar] [CrossRef]
  59. Althuwaynee, F.; Pradhan, B.; Park, J.; Lee, H. A novel ensemble bivariate statistical evidential belief function with knowledge-based analytical hierarchy process and multivariate statistical logistic regression for landslide susceptibility mapping. Catena 2014, 114, 21–36. [Google Scholar] [CrossRef]
  60. Van, J.; Rengers, N.; Soeters, R. Use of geomorphological information in indirect landslide susceptibility assessment. Nat. Hazards 2003, 30, 399–419. [Google Scholar] [CrossRef]
  61. Lee, J.; Kang, E.; Jeon, S. Application of frequency ratio model and validation for predictive flooded area susceptibility mapping using GIS. In Proceedings of the Geoscience and Remote Sensing Symposium (IGARSS), Munich, Germany, 22–27 July 2012; pp. 895–898. [Google Scholar] [CrossRef]
  62. Tehrany, S.; Pradhan, B.; Mansor, S.; Ahmad, N. Flood susceptibility assessment using GIS-based support vector machine model with different kernel types. Catena 2015, 125, 91–101. [Google Scholar] [CrossRef]
  63. Stefanidis, S.; Stathis, D. Assessment of flood hazard based on natural and anthropogenic factors using analytic hierarchy process (AHP). Nat. Hazards 2013, 68, 569–585. [Google Scholar] [CrossRef]
  64. Pradhan, B. Use of GIS-based fuzzy logic relations and its cross application to produce landslide susceptibility maps in three test areas in Malaysia. Environ. Earth Sci. 2011, 63, 329–349. [Google Scholar] [CrossRef]
  65. Pradhan, B. Flood susceptible mapping and risk area delineation using logistic regression, GIS and remote sensing. J. Spat. Hydrol. 2010, 9, 1–18. [Google Scholar]
  66. Samanta, S.; Pal, K.; Lohar, D.; Pal, B. Interpolation of climate variables and temperature modeling. Theor. Appl. Clim. 2012, 107, 35–45. [Google Scholar] [CrossRef]
  67. Kia, B.; Pirasteh, S.; Pradhan, B.; Rodzi, A.; Sulaiman, A.; Moradi, A. An artificial neural network model for flood simulation using GIS: Johor River Basin, Malaysia. Environ. Earth Sci. 2012, 67, 251–264. [Google Scholar] [CrossRef]
  68. Lohani, K.; Goel, K.; Bhatia, S. Improving real time flood forecasting using fuzzy inference system. J. Hydrol. 2014, 509, 25–41. [Google Scholar] [CrossRef]
  69. Tehrany, S.; Pradhan, B.; Jebur, N. Flood susceptibility mapping using a novel ensemble weights-of-evidence and support vector machine models in GIS. J. Hydrol. 2014, 512, 332–343. [Google Scholar] [CrossRef]
  70. Koloa, C.; Samanta, S. Development Impact Assessment Along Merkham River through Remote Sensing and GIS Technology. Int. J. Asian Acad. Res. Assoc. 2013, 5, 26–41. [Google Scholar]
  71. Malczewski, J. GIS-based multicriteria decision analysis: A survey of the literature. Int. J. Geogr. Inf. Sci. 2006, 20, 703–726. [Google Scholar] [CrossRef]
  72. Jia, Y.; Wang, S. CCHE2D: Two-Dimensional Hydrodynamic and Sediment Transport Model for Unsteady Open Channel Flows over Loose Bed; National Center of Computational Hydroscience and Engineering: Nutrioso, AZ, USA, 2001. [Google Scholar]
  73. O’Brien, S. FLO-2D: Two-Dimensional Flood Routing Mode. FLO-2D Software. 2017. Available online: www.flo-2d.com/wp-content/uploads/2018/09/FLO-2D-Plugin-Users-Manual.pdf (accessed on 12 November 2018).
  74. Deltares. SOBEK: Hydrodynamics, Rainfall and Real-Time Control User Manual; Deltares: Delft, The Netherlands, 2019; pp. 1–932. Available online: http:// www.deltares.nl (accessed on 16 November 2018).
  75. Danish Hydraulic Institute. MIKE-Flood User Manual; Danish Hydraulic Institute: Horsholm, Denmark, 2017. [Google Scholar]
  76. Bradbrook, K. JFLOW: A multiscale two-dimensional dynamic flood model. J. Water Environ. Technol. 2007, 2, 79–86. [Google Scholar] [CrossRef]
  77. Bates, P.; Trigg, M.; Neal, J.; Dabrowa, A. LISFLOOD-FP User Manual; University of Bristol: Bristol, UK, 2013. [Google Scholar]
  78. Fan, C.; Ko, H.; Wang, S. An innovative modeling approach using Qual2K and HEC-RAS integration to assess the impact of tidal effect on River Water quality simulation. J. Environ. Manag. 2009, 90, 1824–1832. [Google Scholar] [CrossRef]
  79. Anderson, M.; Chen, Z.; Kavvas, M.; Feldman, A. Coupling HEC-HMS with atmospheric models for prediction of watershed runoff. J. Hydrol. Eng. 2002, 7, 312–318. [Google Scholar] [CrossRef]
  80. Siddiqui, Q.; Hashmi, H.N.; Ghumman, R. Flood inundation modeling for a watershed in the pothowar region of Pakistan. Arab. J. Sci. Eng. 2011, 36, 1203–1220. [Google Scholar] [CrossRef]
  81. Al-Baroudi, M.; Mirza, M.; Dawood, G. The use of GIS in estimating the volumes of floods and the extent of their development at the lower reaches of Wadi Nu’man south of Makkah city by the application of the Snyder model and the model of digital heights. Presented at the International Geographic Conference “Geography and Contemporary Global Changes”, Medina, Saudi Arabia, 20–23 May 2013; Research booklet C part C. Faculty of Arts and Humanities, University of Thebes: Medina, Saudi Arabia, 2013; pp. 757–832. (In Arabic). [Google Scholar]
  82. Kim, M.; Kwak, J.; Kim, B. Assessment of dynamic impact force of debris flow in mountain torrent based on characteristics of debris flow. Environ. Earth Sci. 2018, 77, 538. [Google Scholar] [CrossRef]
Figure 1. Methods of creating a flood risk index map.
Water 11 01887 g001
Figure 2. Wadi Nu’man basin in Mecca in 2019.
Water 11 01887 g002
Figure 3. Wadi Nu’man basin in Al-Masha’er Al-Muqadasa in 2019.
Water 11 01887 g003
Figure 4. Flooding in Wadi Nu’man in the east of Mecca on 3 November 2018. (a) Wadi Nu’man floods. (b) The exposure of the urban areas near Wadi Nu’man to drowning. (ce) The effects of floods in the southeastern neighborhoods of Mecca.
Water 11 01887 g004
Figure 5. Methodology of the risk assessment study of the floods of Wadi Nu’man affecting Al-Masha’er Al-Muqadasa in 2019.
Water 11 01887 g005
Figure 6. Some of the data sources that were used in the study of 2019.
Water 11 01887 g006
Figure 7. The locations of the rain stations, measuring the surroundings of the Wadi Nu’man basin using the Tyson polygons method in 2019.
Water 11 01887 g007
Figure 8. The annual rainfall iso lines of the Wadi Nu’man basin in 2019.
Water 11 01887 g008
Figure 9. Sub-drainage basins of Wadi Nu’man affecting Al-Masha’er Al-Muqadasa in 2019.
Water 11 01887 g009
Figure 10. Map of the order of the valleys of the Wadi Nu’man basin in 2019.
Water 11 01887 g010
Figure 11. Geological map of the sub-drainage basins of Wadi Nu’man in 2019.
Water 11 01887 g011
Figure 12. Soil hydrological group of the sub-drainage basins of Wadi Nu’man in 2019.
Water 11 01887 g012
Figure 13. Land uses of the sub-drainage basins of Wadi Nu’man in 2019.
Water 11 01887 g013
Figure 14. The curve number of the sub-drainage basins of Wadi Nu’man in 2019.
Water 11 01887 g014
Figure 15. Hydrograph of the flood flows to the main Wadi Nu’man basin during a return period of 50 years.
Water 11 01887 g015
Figure 16. Hydrograph of the flood flows to the main Wadi Nu’man basin during a return period of 100 years.
Water 11 01887 g016
Figure 17. Monitoring land use changes of the Wadi Nu’man basin during the period from 1988–2019.
Water 11 01887 g017
Figure 18. Human hazard classification using a hazard assessment (HR).
Water 11 01887 g018
Figure 19. Map of the depth of the flood of Wadi Nu’man in 2019.
Water 11 01887 g019
Figure 20. Map of the velocity of the floodwater of Wadi Nu’man in 2019.
Water 11 01887 g020
Figure 21. Verification of the flood risk model. Areas prone to inundation and the classification of the degrees of risk in Wadi Nu’man in 2019 are shown.
Water 11 01887 g021
Figure 22. Part of the field study in the area under study on 3 November 2018. (a) The impact of the Wadi Nu’man flooding; and (b,c) the urban and agricultural areas of Wadi Nu’man.
Water 11 01887 g022
Figure 23. The relationship between urbanization and the increased risk of flooding of the Wadi Nu’man basin during the period from 1988–2019.
Water 11 01887 g023
Figure 24. The floodplain of the Wadi Nu’man’s flooding and the status quo of the hydraulic facilities in the study area in 2019.
Water 11 01887 g024
Figure 25. Protection measures, proposed to prevent the dangers of the floods of Wadi Nu’man on Al-Masha’er Al-Muqadasa in 2019.
Water 11 01887 g025
Table 1. The characteristics of the satellite images used in monitoring the urban changes of the Wadi Nu’man basin during the period from 1988–2019.
Date of Satellite Images CapturePathRowSatelliteSpatial AccuracySensor TypeBands
11/198816945Landsat 4–530TM7
11/199816945Landsat 4–530TM7
12/201316945Landsat 4–530OLI11
8/201916945Landsat 830OLI11
Table 2. Equations used in the current study.
EquationFormulaDescription
1 t c   =   0.0195 ( L 0.77 S 0.385 ) tc = time of concentration (min); L = maximum flow distance (m); S = maximum flow distance slope (%); TLAG = lag time (hour); Sr = maximum effort of soil moisture (maximum retention), calculated from the curve number (cm); Y = basin slope (%); P = rainfall for different return periods (cm); Ia = amount of water, before the occurrence of a flood, such as filtration and suspended rain on plants; qp = peak discharge (m3/s); A = basin area (km2); Tp = time until the peak (hour); Q = direct runoff (mm); and Δt = duration of designed stormwater
2 T L A G = L 0 . 8 [ S r + 1 ] 0.7 1900 Y
3 Q   =   ( P Ia ) 2 / ( P Ia + Sr )
4 Ia   =   0.2 S r
5 Q   =   ( P 0.2 S r ) 2 / ( P + 0.8 S )
6 Q   =   ( P 0.2 S r ) 2 / ( P + 0.8 Sr )
7 qp   =   0.208 AQ Tp  
8Tp = Δt/2 + TLAG
Table 3. The depth of rainfall in different return periods in the Al-Ferine (J 113), Al-Shifa (TA 109), Mecca (J 114), and Muntasaf-Huda meteorological stations (J 205).
Frequented Periods23510202550100
Al-Ferine (J 113)37.851.569.294.9123133195201
Al-Shifa (TA 109)39.850.262.879.897.2103121141
Mecca (J 114)27.439.555.880.9110120155196
Muntasaf-Huda (J 205)31.847.470.3106150165220284
Table 4. The most important morphological characteristics of the sub-drainage basins of Wadi Nu’man affecting Al-Masha’er Al-Muqadasa in 2019.
Basin NameArea (Km2)Length (m)Basin Slope (m/m)Average Level (m)Lag Time (Hr.) Concentration Time (Hr.)
Wadi Nu’man5.733.44932.90.372138236.9688.05
Sub-drainage basins of Wadi Nu’man
Wadi Ash Shadqa16.114858.080.3790918290.520.87
Wadi Ash Shara25.198718.730.4183579390.881.47
Wadi Al Abidiyah6.84584.290.0380213032.013.35
Wadi Al Arja55.1813,378.660.3137036961.472.45
Wadi Tiftifan27.8510,643.580.3289098681.181.97
Wadi Tinaamah29.498047.170.2243014121.242.07
Wadi Rahjan154.5620,091.40.3624248531.682.80
Wadi Zubaydah17.718723.150.2103244271.312.18
Wadi Arar59.613,762.40.2725995851.662.77
Wadi Alaq61.2117,575.870.40695611071.312.18
Wadi Nu’man174.3227,351.070.46310612622.163.60
Wadi Yaruj60.0315,440.580.40702510971.111.85
Table 5. The most important geometric and morphometric characteristics of the Wadi Nu’man basin affecting Al-Masha’er Al-Muqadasa in 2019.
Basin NameElongation RatiosCircularity RatiosShape FactorMerger FactorBasin SlopeSinuosityIncubation Factor
Wadi Nu’man60.871.60.52.30.390.190.5
Sub-drainage basins of Wadi Nu’man
Wadi Ash Shadqa22.110.41.760.470.330.7
Wadi Ash Shara54.431.30.81.950.320.270.3
Wadi Al Abidiyah64.671.20.81.990.320.260.3
Wadi Al Arja82.621.30.82.210.310.210.3
Wadi Tiftifan81.51.212.290.280.190.2
Wadi Tinaamah102.021.50.52.020.380.250.5
Wadi Rahjan226.161.20.71.860.350.290.4
Wadi Zubaydah78.481.31.12.320.270.190.2
Wadi Arar106.521.40.81.900.320.280.3
Wadi Alaq124.411.11.32.340.250.190.2
Wadi Nu’man99.811.31.12.320.270.190.2
Wadi Yaruj146.331.112.180.280.210.3
Table 6. Characteristics of the floods of the Wadi Nu’man drainage basin during different return periods.
Basin NameDescriptionReturn Periods (Years)
5102550100
Wadi Nu’manPeak discharge (m3/s)711.211128.461722.402191.082689.82
Flood volume (m3)18,226,34428,264,881.242,611,743.453,932,047.766,023,547.7
Time of peak (min)945945945930930
Sub-drainage basins of Wadi Nu’man
Wadi Ash ShadqaPeak discharge (m3/s)76.24121.44186.87237.55292.68
Flood volume (m3)529,664.1832,229.11,283,952.61,640,832.32,035,059.3
Wadi Ash SharaPeak discharge (m3/s)71.27114.17175.38223.15274.23
Flood volume (m3)687,553.21,069,935.31,621,029.62,056,193.12,526,299.1
Wadi Al-AbidiyahPeak discharge (m3/s)4.688.8114.9019.9424.76
Flood volume (m3)90,472.9158,68825,362.2337,792414,884.3
Wadi Al-ArjaPeak discharge (m3/s)119.36197.84314.06405.36505.52
Flood volume (m3)1,626,310.32,628,919.44,132,571.45,330,019.66,658,862.9
Wadi TiftifanPeak discharge (m3/s)57.8293.31144.22184.81228.18
Flood volume (m3)690,534.41,083,256.61,649,115.42,097,625.52,580,491.7
Wadi TinaamahPeak discharge (m3/s)49.3981.59125.41159.63191.57
Flood volume (m3)606,807.9969,220.41,466,7841,859,304.22,228,910.7
Wadi RahjanPeak discharge (m3/s)288.66466.96725.01927.011144.85
Flood volume (m3)4,335,680.76,844,352.410,513,884.213,420,902.216,588,303.7
Wadi ZubaydahPeak discharge (m3/s)28.2549.6974.8696.24117
Flood volume (m3)366,836.8593,862.3913,114.81,166,548.114,145,77.7
Wadi ArarPeak discharge (m3/s)124.74201.07312.27399.95495.91
Flood volume (m3)1,840,349.72,911,673.24,493,978.65,746,159.47,125,291.9
Wadi AlaqPeak discharge (m3/s)123.44189.78279.99349.72421.65
Flood volume (m3)1,563,109.62,338,974.93,402,043.74,231,067.45,093,199
Wadi Nu’manPeak discharge (m3/s)207.8233046501.50635.96776.79
Flood volume (m3)3,851,234.65,909,518.88,782,67211,053,047.613,444,729.6
Wadi Ya’rujPeak discharge (m3/s)149.30225.36328406.84488.04
Flood volume (m3)1,671,030.92,467,979.6353,847.14,396,487.45,272,152.8
Table 7. Changes in the land uses of the Wadi Nu’man basin during the period from 1988–2019.
Phenomenon19881998201320191988–2019
Vegetation (Km2)87.63107.46129.02130.05
Average of annual increase (Km2)-210.171.37
Annual growth rate %-2.06%1.23%0.13%1.28%
Urban mass (Km2)0.53117.2826.9
Average annual increase (Km2)-011.601
Annual growth rate %-6.55%20.93%7.66%13.51%
Desert areas (Km2)599.9579.6541.76531.11
Average annual increase (Km2)-−2−3−1.78−2.22
Annual growth rate %-−0.34%−0.45%−0.33%−0.39%
Table 8. Flood intensity levels.
Levels of Sever FloodMaximum Water Depth (m) Maximum Water Outcomes (h) with the Highest Velocity V (m2/s)
HighH > 1.5 morvh > 1.5 m2/s
Moderate0.54 m < h < 1.5 mor0.5 <vh < 1.5 m2/s
Low0.1 m < h < 0.5 mand0.1 m2/s < vh < 0.5 m2/s
Table 9. Hazard classification using a hazard assessment (HR).
Risk RateRisk Categories Impacting HumansColor Symbol
Less than 0.75Very low risk
0.75:1.25Risk for some ages, including children and the elderly
1.25:2.00Risk for the majority of people, including the whole population
More than 2:00Risk for all, including emergency cases
Table 10. Characteristics of the Wadi Nu’man flooding (depths (m); speed (m/s); risk (m3/s)).
Severity0–1.5 (Low)1.5–3.5 (Moderate)More Than 3.5 (High)Total
Characteristics of the Nu’man valley (depth “m”)22.3859.6867.15149.21
%154045100
Characteristics of the Nu’man valley (velocity “m/s”)22.3852.2274.61149.21
%153550100
Characteristics of the Nu’man valley (Hazard “m3/s”)29.8452.2267.15149.21
%203545100
Table 11. Urban areas exposed to flooding in the Wadi Nu’man basin in the period from 1988–2019.
Growth Period Area (km2) Total IncreaseFrom Year 1988 %Average Annual Increase (km2)Annual Growth Rate %Change Rate 1988–2019 %
km2%
19880.53
199810.51.75%88.68%0.056.55%88.68%
201317.2816.360.52%3071.70%120.93%1628.0%
201926.99.634.76%1815.09%27.66%55.67%
1988–2019 26.498.03%4975.47%113.51%98.03%

