Article

Physical Experiment and Modeling of the Transport and Deposition of Polydisperse Particles in Stormwater: Effects of a Depth-Dependent Initial Filter Coefficient

1
College of Hydrology and Water Resource, Hohai University, Nanjing 210098, China
2
State Key Laboratory of Hydrology-Water Resources and Hydraulic Engineering, Hohai University, Nanjing 210098, China
3
Department of Hydrology and Water Resources, Nanjing Hydraulic Research Institute, Nanjing 210029, China
*
Authors to whom correspondence should be addressed.
Water 2019, 11(9), 1885; https://doi.org/10.3390/w11091885
Submission received: 18 July 2019 / Revised: 4 September 2019 / Accepted: 7 September 2019 / Published: 11 September 2019
(This article belongs to the Section Urban Water Management)

Abstract

:
The artificial recharge of stormwater is an effective approach for replenishing aquifer and reduce urban waterlogging, but prone to clogging by suspended particles (SP) that are highly heterogeneously sized. In this paper, the transport and deposition of SP in a sand column were investigated under a constant flow condition, for five stormwater concentrations. A depth-dependent initial filter coefficient is incorporated into the conventional filtration model. This modified model considers the heterogeneity of the particle population by lumping the capture of heterogeneous SP into a capture probability. The good agreement between the results of the modified model and the experimental results of measured outlet concentration and average specific deposit validated the modified model. The experiment data and the simulation results both indicate that the highly hyper-exponential retention profiles are caused by non-uniform deposition of heterogeneous SP; and, the conventional model was found to homogenize the spatial distribution of SP retention and overestimate retention of the porous medium. Local and overall permeability reductions were assessed by an empirical relationship and the Kozeny-Carman model, respectively. It is shown that consideration of polydisperse suspended particles is of primary importance. This study highlights the effects of polydisperse particles on SP deposition in a saturated porous medium.

1. Introduction

Artificial recharge techniques have been recognized as effective in the management of increasing volume of urban runoff and pollution in the context of water scarcity and rising urban population [1]. Stormwater is expected to offer a promising source to help secure water supply in densely populated cities [2,3,4]. Thus, not only can the stormwater resource be stored in aquifers for future water use, but, more importantly, the cities can get rid of urban waterlogging and reduce the risk of pollution [5,6]. Unfortunately, clogging is among the most important factors to restrict stormwater reuse [7,8,9]. When the injected stormwater flows through a porous medium (filter medium), a proportion of suspended particles (SP) are either retained on the medium surface, or they transport and deposit inside the porous medium. The progressive accumulation of SP might clog the porosity and cause a permeability reduction of the medium [10,11,12]. Correspondingly, the filtration efficiency and service lifespan of infiltration systems are reduced [13]. Numerous cases of infiltration system failure caused by clogging are reported, even if the stormwater is processed with pre-treatment procedures [14,15].
The filtration and clogging processes have been firstly studied in drinking water industry, and then extended to soil science and many other disciplines for decades, but the outcomes are often limited to specific discipline [16,17,18,19]. It is not clear whether all the outcomes of these studies can be applied to stormwater recharge field, because stormwater has very different properties when compared with water used for drinking water treatment (stormwater with much higher SP concentration), or wastewater (stormwater with much lower organics) [12]. In addition, the SP in stormwater are highly heterogeneously sized and they have a diverse range of particle sizes [1,20]. However, few attempts have been made to quantitatively investigate the filtration and clogging processes in the context of stormwater recharge, especially given the significance of the specific properties of stormwater [21,22,23,24].
In the process of stormwater recharge, forces and mechanisms that govern the fate of SP are complex and diverse, depending on the density and size of SP [20,25]. These mechanisms greatly change over time and space, as the different forces operate jointly. For large SP (>10 μm), gravity, inertial, and hydrodynamic effects are the primary mechanisms for the deposition of SP, but Brownian diffusion is the dominant factor for colloids (<1 μm). For mean-size particles (1–10 μm), all the forces and mechanisms can contribute to SP deposition [26]. Moreover, under a constant flow-rate condition, SP accumulation can induce increasing flow velocity in the pore space, which governs the hydrodynamic forces. A higher flow velocity leads to higher hydrodynamic shear acting on retained SP, which in turn might cause re-entrainment (release of already deposited SP), therefore reducing the chances of SP deposition. Based on these mechanisms, some filtration models have been developed, and these models are commonly classified as phenomenological, stochastic, or trajectory ones [4]. Phenomenological models are typically established on the basis of mass balance equations with a spatially constant first-order deposition rate coefficient, and the deposition rate coefficient is employed to characterize particle deposition under the condition of an initial clean filter medium [27]. However, a filtration model with constant deposition rate coefficient usually yields great deviations from the experimentally observed hyper-exponential retention profiles, particularly under repulsion/unfavorable (like charged particle and medium surfaces) conditions. The hyper-exponential retention profiles indicate that the slope of a retention profile is steeper near the porous medium inlet and it becomes shallower with transport distance. The deviations have been ascribed to the heterogeneity population of SP, as well as straining, but they are both very distinct mechanisms for achieving this phenomenon [28,29].
Straining is also a prevalent process in stormwater filtration applications, but it is not considered in traditional filtration models [30]. Straining occurs when the pore throats is too narrow for SP to be transported, and straining is independent of hydrodynamic conditions [31]. Straining is only determined by the ratio between the diameter (dp) of the particles and that (dg) of porous medium grain. The critical ratio reportedly ranges from 0.005 to 0.1, depending on the experiment conditions. Elementary mechanism of suspension through deep bed has been proven, but it is hard to evaluate their significance in any system, so the experiment is needed [27].
Unfortunately, previous studies on the transport and deposition of SP have predominantly concentrated on experiments that were conducted with colloids that represent a group of very fine particles (colloids), ranging in size from 1 nm to 1 μm [32,33]. Colloids have been studied most often because of their ubiquity in groundwater [20]. This narrow size range and small particles allow the following assumption: a monodispersed, non-flocculating suspension at constant flow rate passing through an isotropic, homogeneous porous medium [21]. It is also assumed that the bed is initially clean. However, natural stormwater is characterized with highly polydisperse SP that displays wider particle size distribution [34]. Few attempts have been made to explore the influence of polydispersity on transport and deposition of SP [35,36]. The variation of particle size distribution of particle populations governs the deposition rate of polydisperse particles [37,38,39]. Thus, it is essential to study the influence of polydispersity on the transport and deposition of SP, to ultimately enhance the performance of the filtration system.
The objective of this work is to investigate the transport and fate of polydisperse SP in a saturated porous medium, and the effects of SP’s polydispersity will be elucidated by a proposed filtration model with a depth-dependent initial filter coefficient. For this purpose, semi-synthetic stormwater containing polydisperse SP was studied, and sand column experiments were conducted for a variety of SP concentrations. SP transport and deposition were assessed through SP mass balance computation, BTCs (breakthrough curves) in particle effluent concentrations, the final spatial distribution of SP deposition profiles, permeability reduction profiles, and variations in the particle size distribution (PSD) of the retained SP. In addition to the above measurements, numerical simulations were also run to help us gain deep insights to the spatial and temporal distribution of the filter coefficient (deposition rate). An empirical relationship was developed to estimate the local permeability reduction, and the Kozeny-Carman model assessed the evolution of the overall permeability reduction. Based on these observations, relevant mechanisms that control the transport and deposition of the polydisperse particles are discussed.

2. Materials and Methods

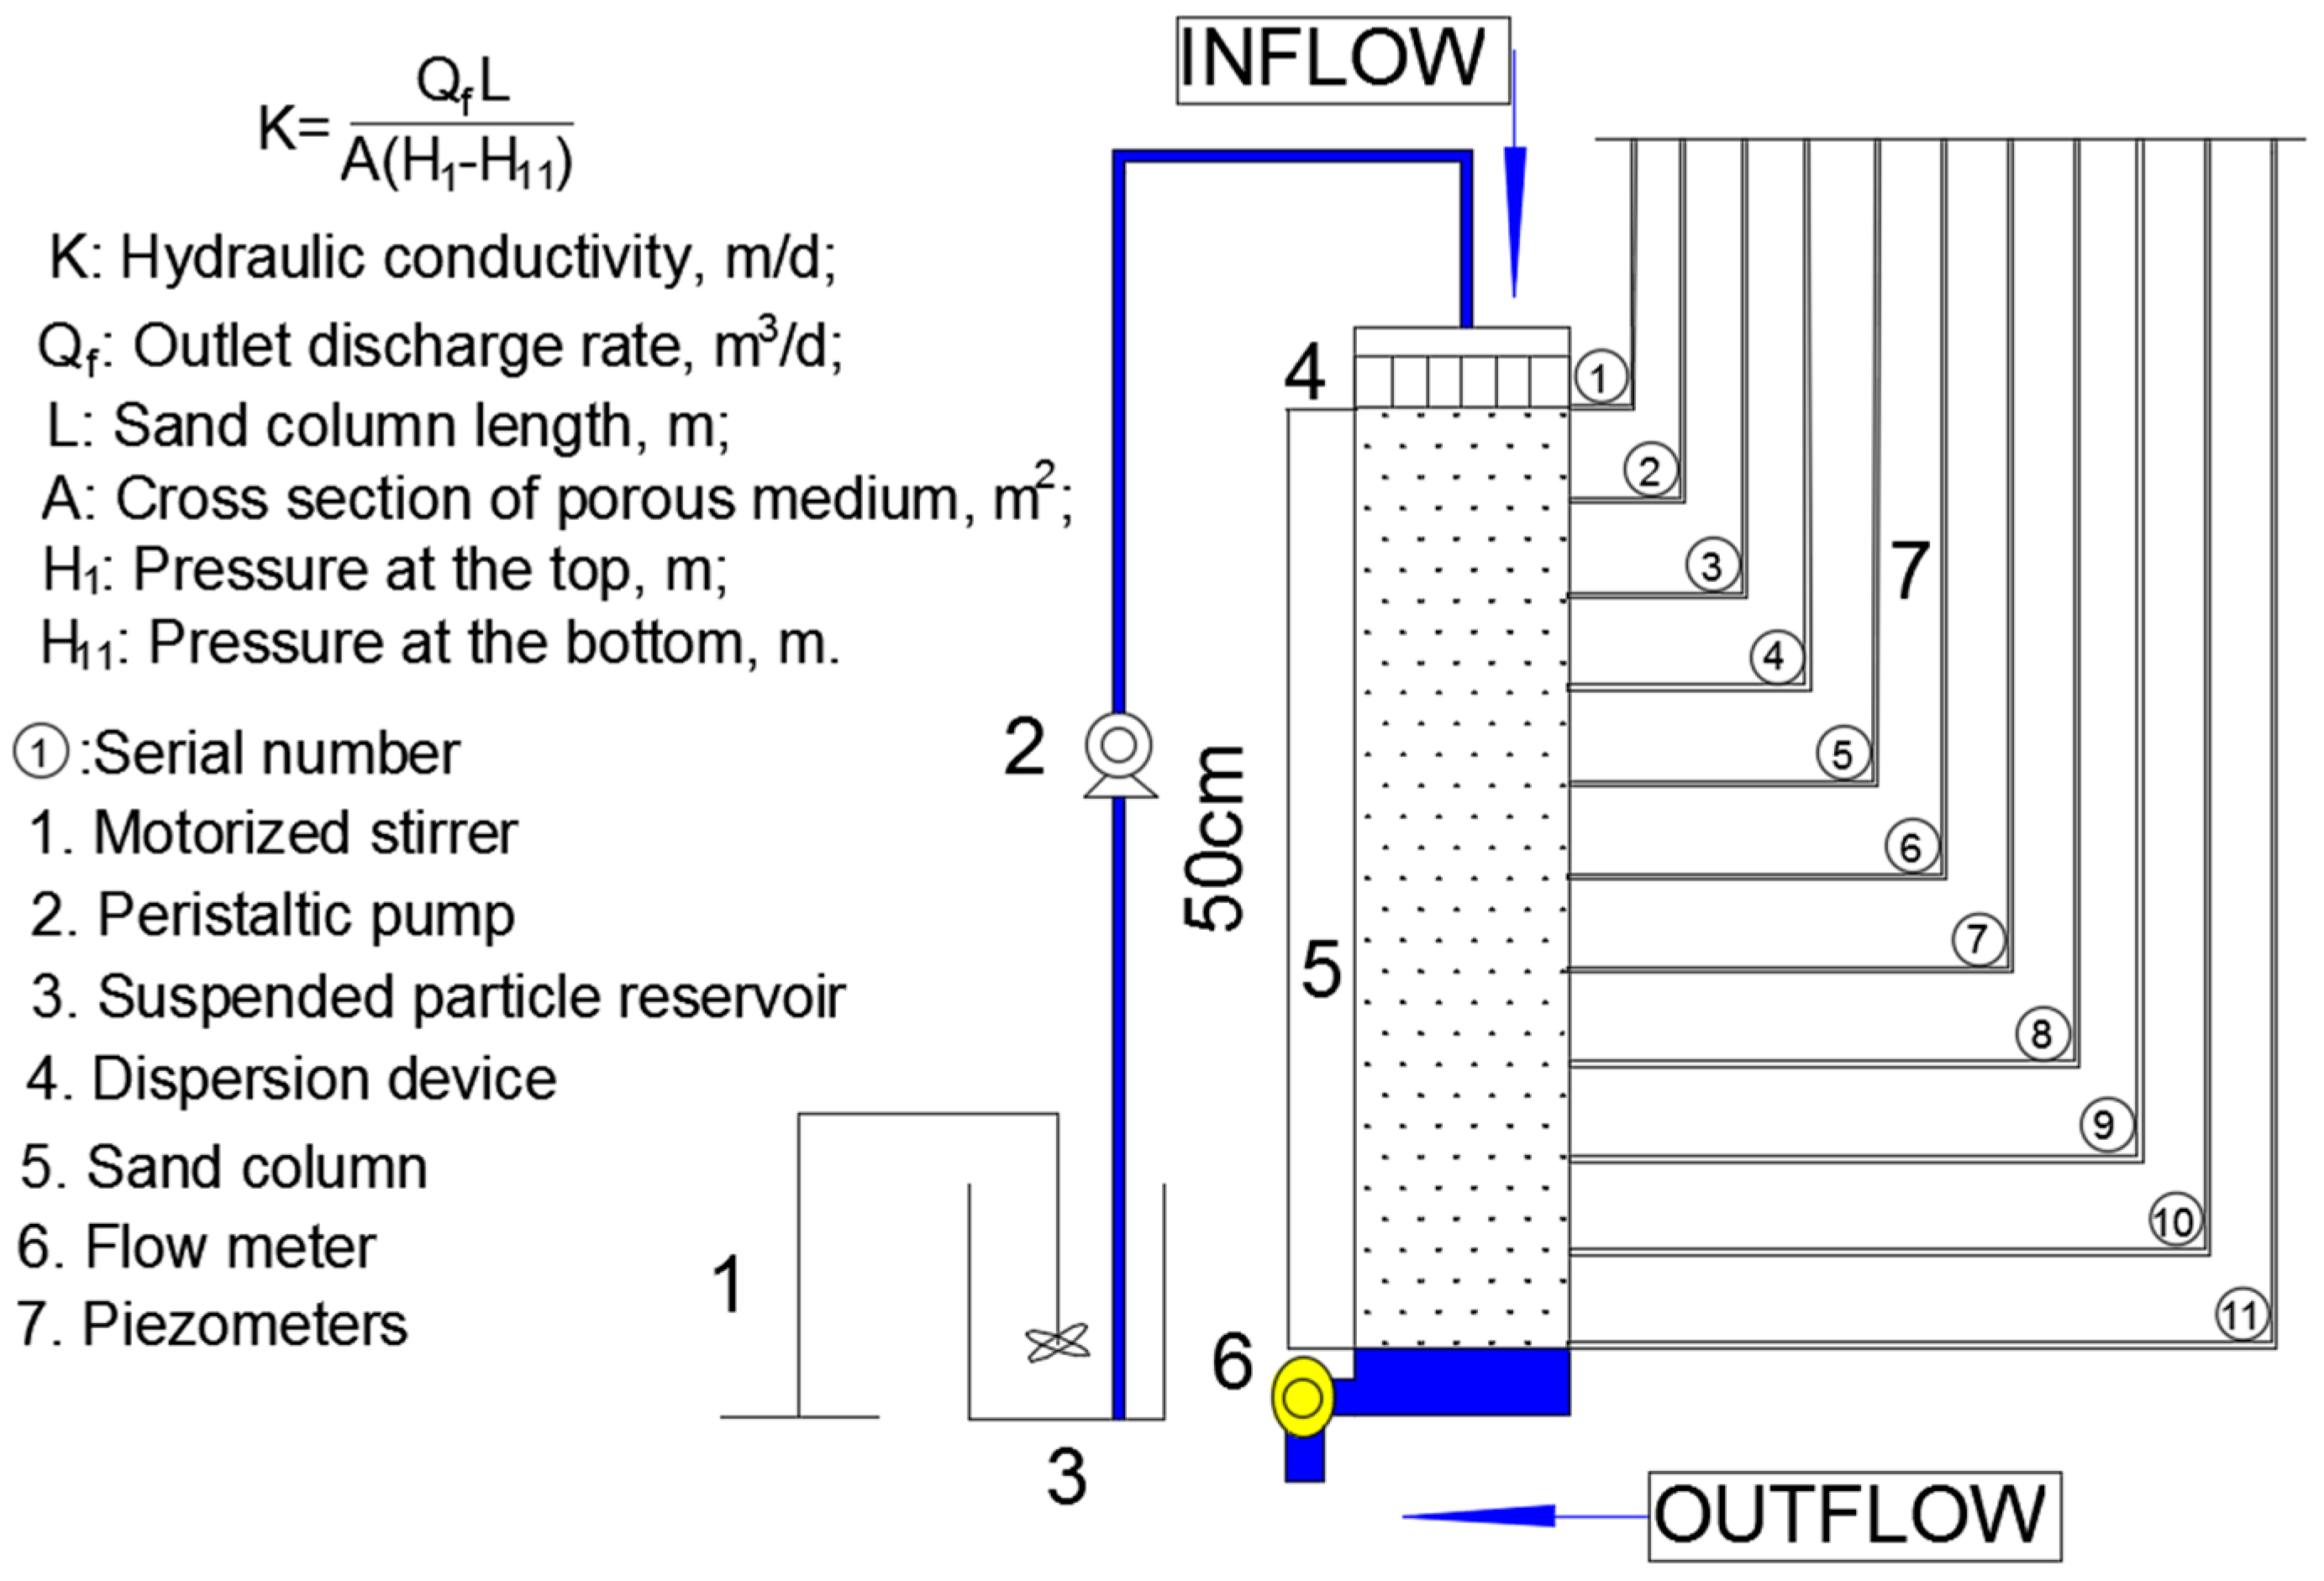
2.1. Design of the Sand Column

A Plexiglas sand column was constructed, with an inner diameter of 5 cm and a length of 60 cm, in order to investigate the impacts of SP’s polydispersity on the transport and deposition of SP. The main segment, filled with porous medium, was 50-cm long and equipped with eleven piezometers for measuring pressure variations along the column during the injection (Figure 1). Screen with opening of 0.1 mm was installed at the bottom to prevent movement of the medium grain out of the column, and a dampener was placed at the top that protected the porous medium from the energy of the injected stormwater. The sand column held its shape without any visible change. Sand was carefully filled into the column and then evenly compacted to build a homogeneous isotropic sand medium. During the whole operation, the water level in the column was kept above the sand surface, and sand was also slowly poured to avoid any air bubble (under saturated condition). The top of the sand column was connected with a peristaltic pump to simulate stormwater recharge.

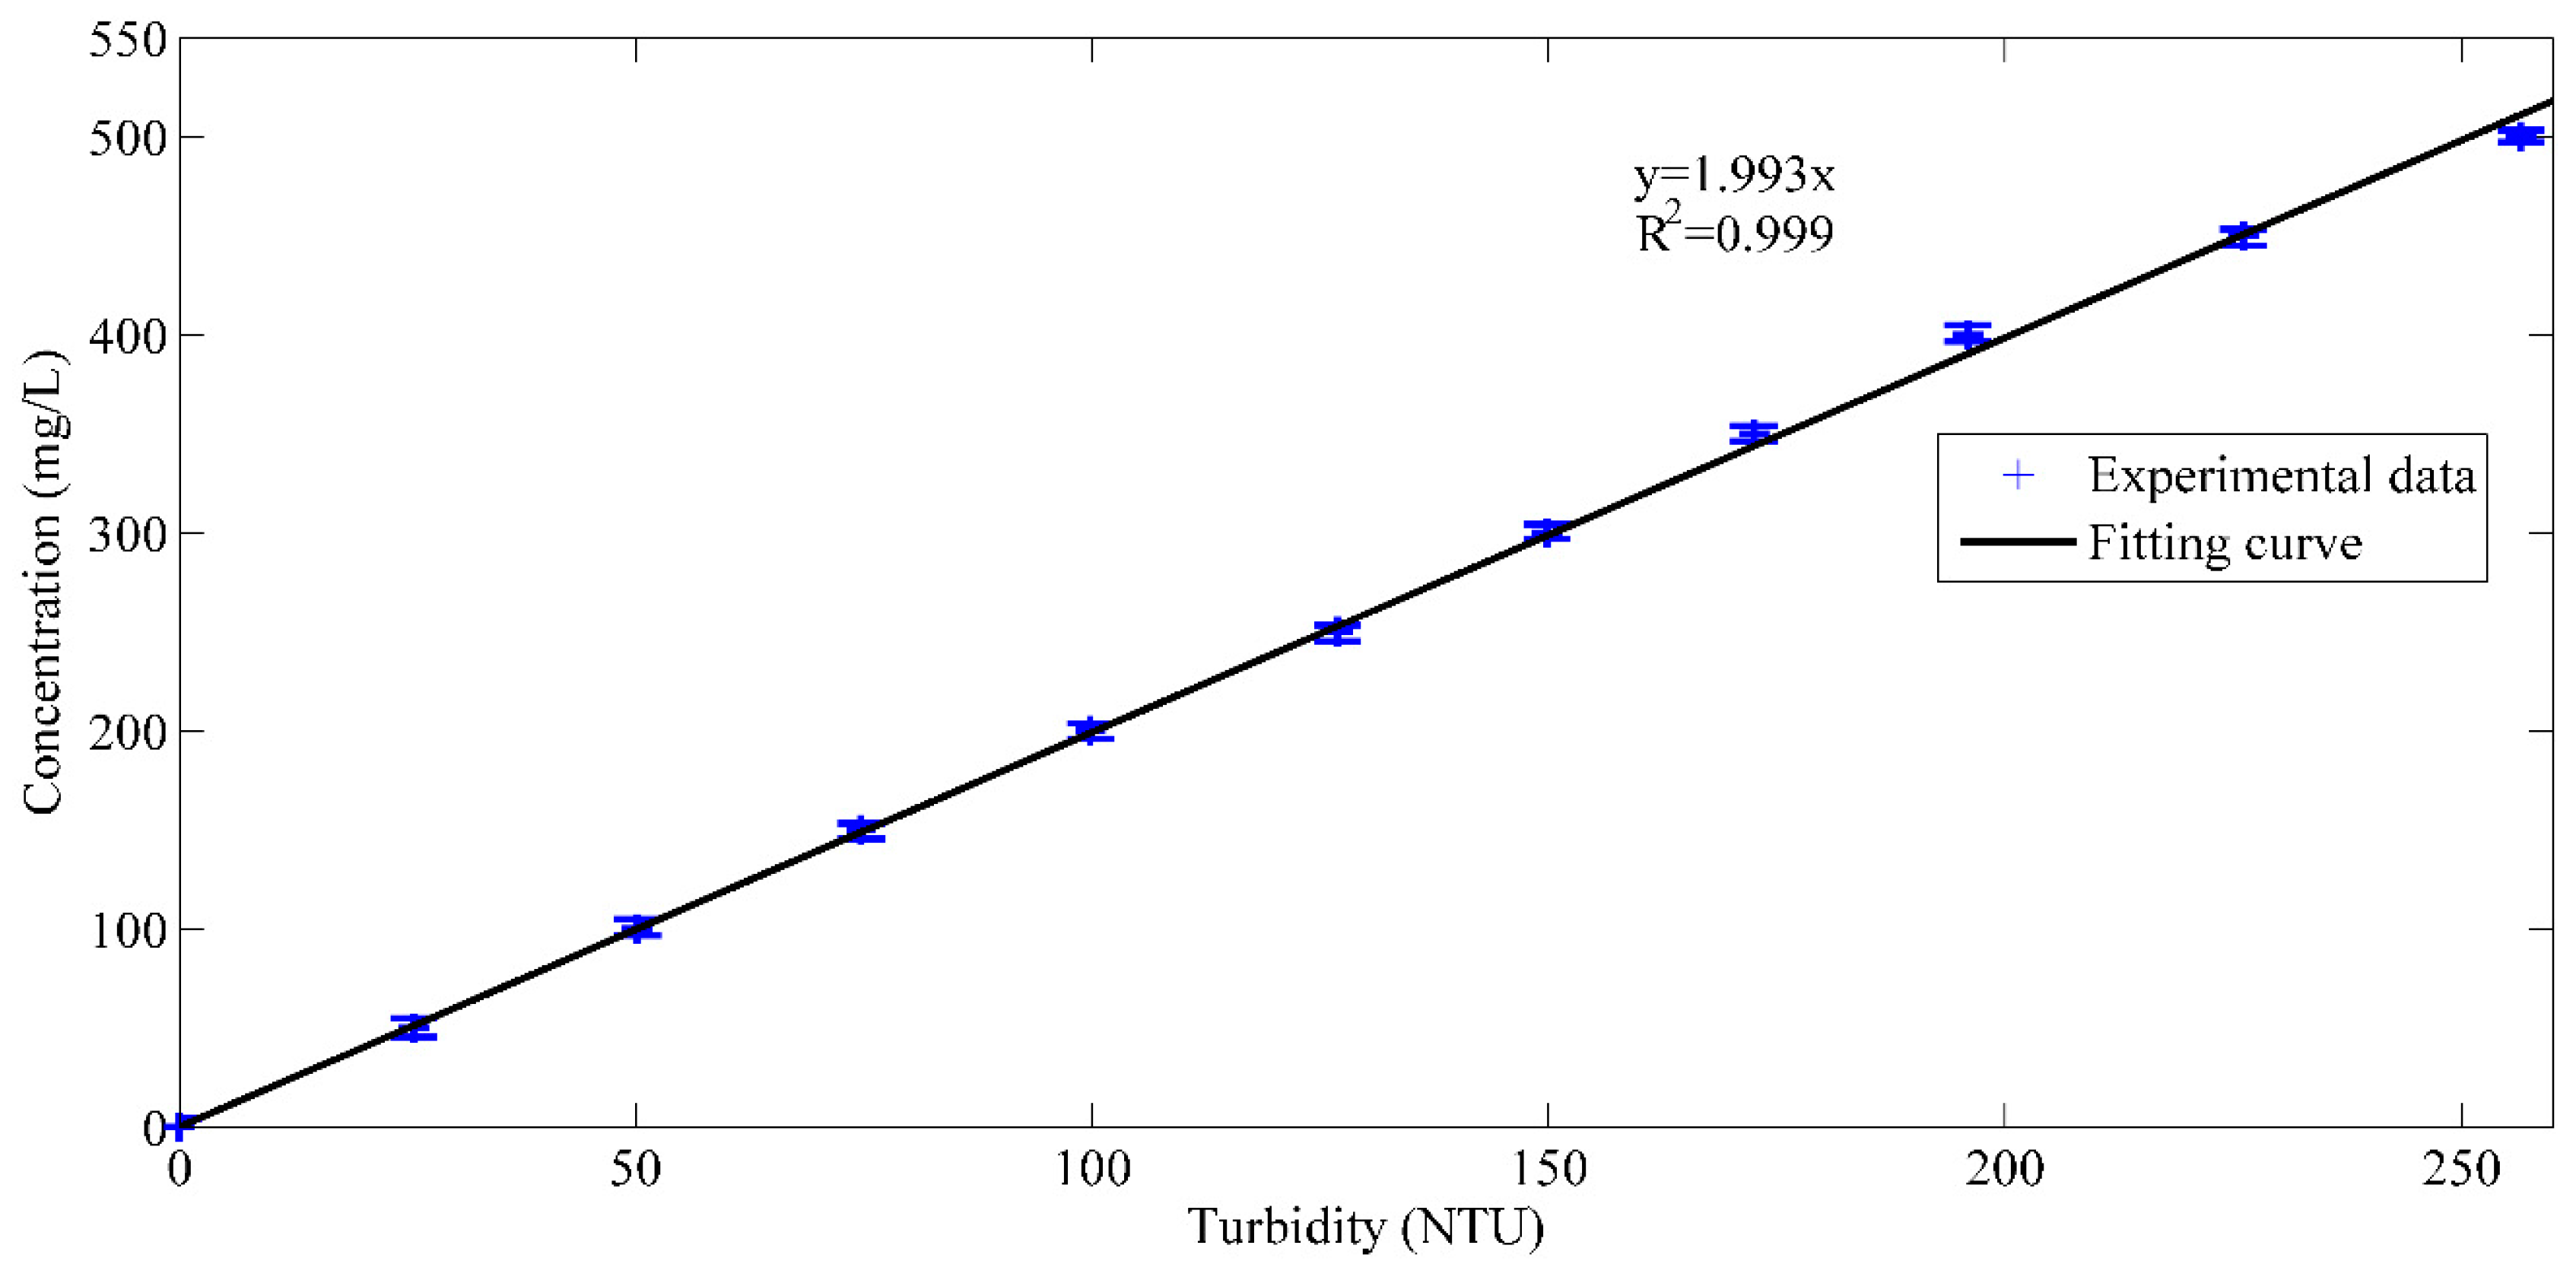
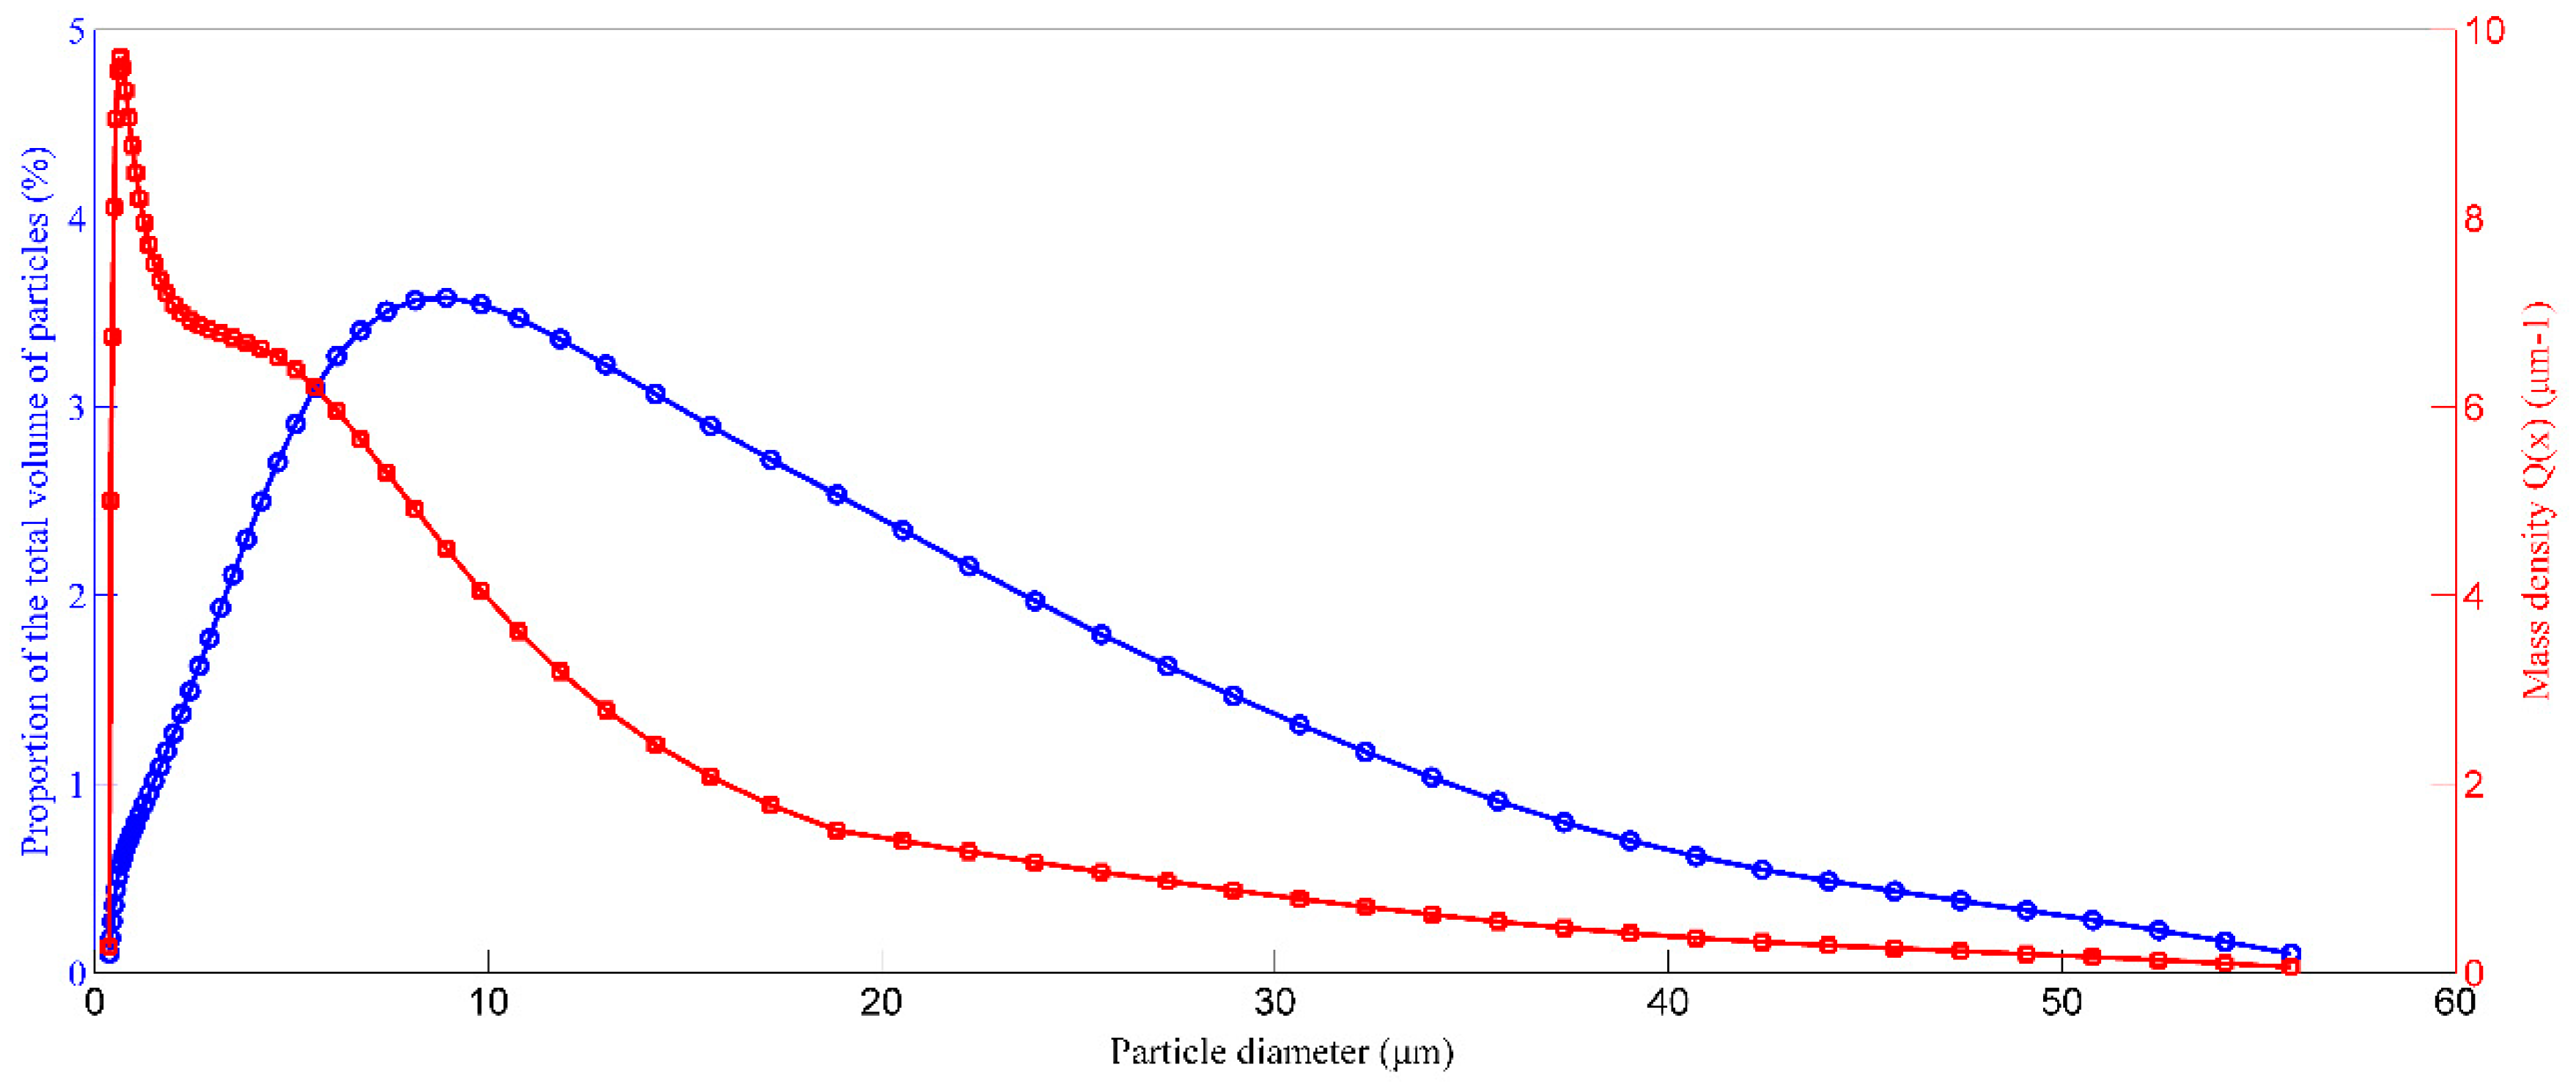
2.2. Characteristics of Suspended Particles (SP) and Porous Medium

The injected SP were collected from areas around the inlet of the Yangtze River by scraping the sediment layer to well represent the composition in stormwater. After being grinded and dried repeatedly, the selected SP was passed through a 100 μm sieve, and then the material was made into suspensions at desired concentration. The suspensions were also cleaned by deionized water (pH of 6.9 ± 0.2). PSD analysis showed the diameter of the injected SP ranged from 0.375 to 55.82 μm, with a median size of 8.15 μm.
Clean silica sand was used as the porous medium. Silica sand was specifically selected for its particle shapes, porosity, and specific surface area, and it is the most typically used material and structurally stable in filtration [3,41]. Mechanical sieving of the sandy material was undertaken to obtain a sand size range between 0.8- and 1.1-mm. Sieving is a preventative measure to avoid a mixed filter medium with a large range of particle sizes. A large size range could introduce a new variable that affects filtration performance [1]. Particle size distribution (PSD) analysis was performed by the low-angle laser light-scattering method. The silica sand has a particle size d10 of 0.875 mm, d50 of 0.993 mm, and d60 of 1.181 mm. The uniformity coefficient (d60/d10) of the sand is 1.35. The PSD analysis indicated that the sandy material is homogeneous. The PSD analysis also implied that the choice of screen with opening of 0.1 mm can prevent the medium grain (0.8 to 1.1 mm) out of the column, but allow for the migration of SP (0.375 to 55.82 μm). The specific surface area was measured to be 3.76 mm−1. Weighing a known volume of the silica sand, the bulk density of the silica sand was obtained to be 1.61 g/cm3. The specific density was obtained by adding distilled water to the known volume of the silica sand until a fixed value was reached. The average value of specific density was 2.56 g/cm3 for five tests. The porosity of clean filter bed was measured as 0.378 (±0.003). The ratio of inner diameter of the column to filter grain diameter (d50 = 0.993 mm) was larger than 50, which is recommended for filtration studies [41].

2.3. Experimental Procedures

Before the semi-artificial stormwater experiments, the sand column was fed with clean water at a constant water level until the outflow rate became steady for at least one day. The constant head was chosen to provide an initial flow rate that was equal to that in the constant flow rate experiment. The firstly introduced clean water served as dual purposes: to achieve hydraulic compaction to allow for permeability tests to be carried out; and, to wash off the dust in the sand column to minimize background value effects on turbidity measurements. The evolutions of different pressures along the column were measured to characterize the initially clean porous medium. Darcy’s law calculated the hydraulic conductivity (K) (Figure 1), and the permeability test was repeated. The pressure gradient was measured 0.439 and the outflow rate was 0.0323 m/s. The corresponding average hydraulic conductivity of the sand was K = 63.5 m/day (±1.3).
Five SP concentrations were used: 100, 150, 200, 250, and 300 mg/L, and a total volume of 253 pore volumes of SP was injected in each experiment. The desired SP concentration in stormwater application was targeted between 100 to 300 mg/L, as recommended by a review of international data [42]. The effluent rate in each experiment was measured by passing the effluent through a flow meter. Subsequently, the effluent was passed through a well-calibrated turbidimeter (WGZ-B, Inc., Qiwei, Hangzhou, China) to measure the turbidity level. The measurements are converted and displayed in Nephelometric Turbidity Units (NTU). The turbidimeter has a measurement range from 0.1 to 250 NTU. The SP concentrations were determined with the correlation between SP concentrations and turbidities (Figure 2). For the experiments under the condition of constant flow rate, the head loss across the filter medium increases due to SP deposition. Therefore, hydraulic conductivity decreases with the increase in head loss.
The turbidity level of clean water was measured as nearly zero. The stormwater recharge experiment was conducted until the turbidity value of effluent was also close to zero, thus the effects of background value were excluded. A peristaltic pump was used to pump the influent suspension from the suspension reservoir into the sand column at a constant rate of 0.633 mL/s. The corresponding Reynolds numbers was 0.114, which confirmed the velocity is small enough for Darcy’s law to be valid. A motorized stirrer operated in the SP reservoir to prevent the suspension from settling.
During the Stormwater recharge experiments, outlet turbidities were directly measured, together with pressure variations along the column. All of the piezometer heads were observed to be at or above the position head, thus no formation of any unsaturated zone.
The porous medium filling the column was excavated and cut into ten equal sections, and each section was 5 cm, in order to obtain the spatial distribution of the retained SP within the porous medium at the end of each injection experiment. The amount of retained particles was measured in the following procedures: the dirty silica sand (silica sand with deposited SP) was carefully dried and weighed, and then thoroughly washed; the clean material (silica sand) was dried and weighed; the difference in weight between the dirty and clean materials was the total mass of deposited SP. To analyze the PSD of the retained particles, samples were collected for PSD analysis while using the low-angle laser light-scattering method. Due to the relatively high velocities tested (mean water velocity was 0.0323 cm/s), the larger SP size (a mode of 8.15 μm), and the neutral water pH, chemical effects may be negligible. Therefore, this study focuses on the effects of physical mechanisms on SP transport and deposition.

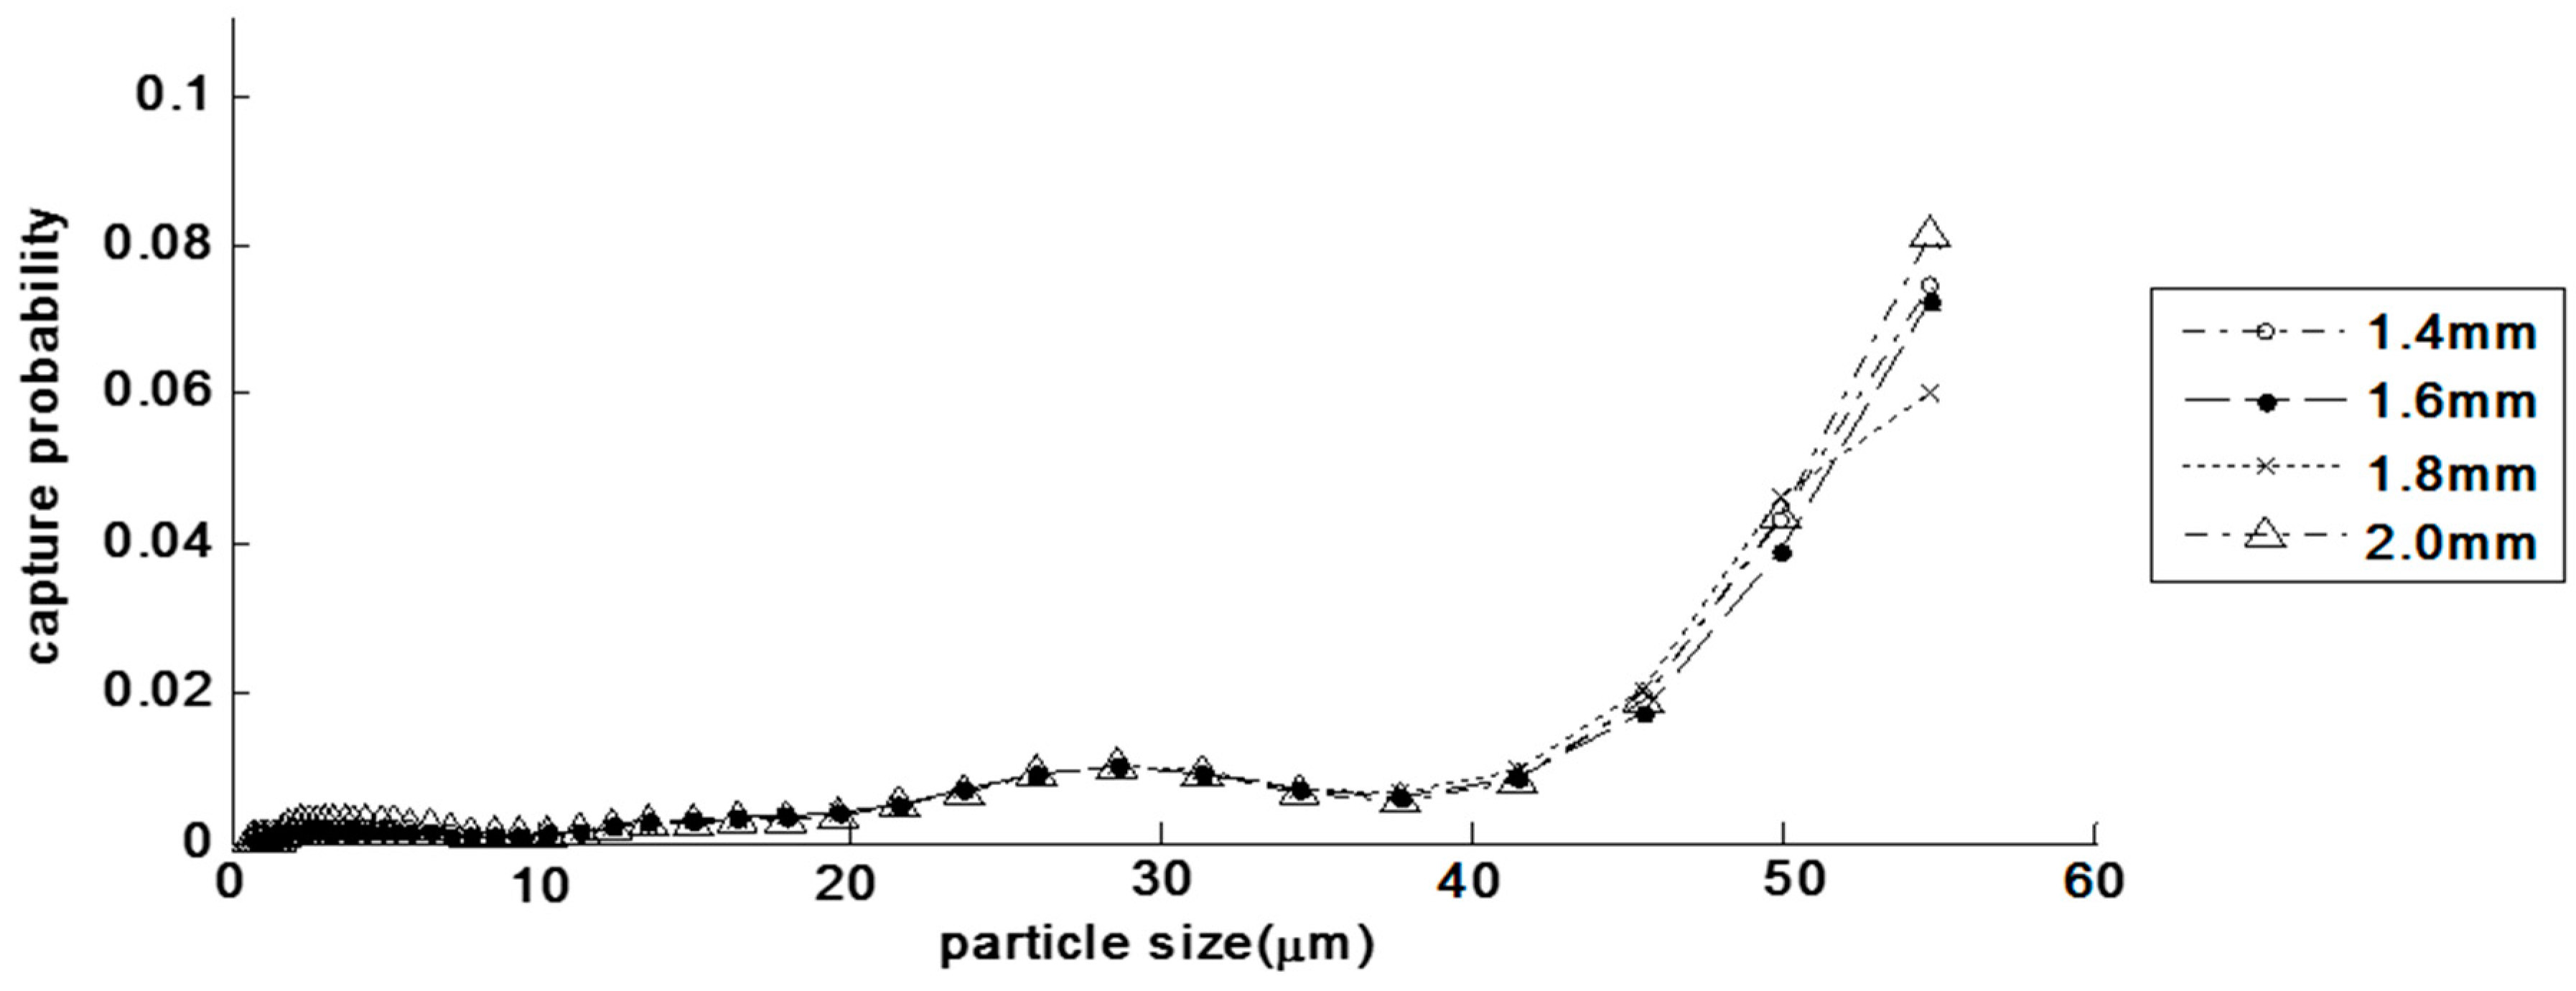
3. Modelling Aspects

The dynamics of particle transport and deposition, in a one-dimensional sand column, can be depicted with a mass conservation equation, as follows [26,43]
u C z + σ τ = 0
where C (L3*L−3) is the volume fraction of particles in the suspension, z (L) is the axial distance measured from the top of the filter bed, σ (L3*L−3) is specific deposit with the definition of the ratio of the volume of deposited particles to the volume of the porous medium, u (L*T−1) is the Darcy velocity, and it can be obtained by the Darcy test, τ (T) is the corrected time, defined as τ = t/u, with t (T) being the real time and φ the porosity of a filter medium. When the filtration has lasted hours, the difference between τ and t is negligible [26].
The kinetic equation for particle deposition was given by Iwasaki [44] as follow
C z = λ ( z , t ) C
λ ( z , t ) = λ 0 F ( σ )
where λ (L−1) is the filter coefficient, and its value at the beginning of the filtration λ0 (L−1), is the initial filter coefficient. λ0, which quantifies deposition kinetics under the condition of initial clean bed, is only constant when the filter bed is considered to be clean. The initial filter coefficient is typically evaluated by measuring the particle concentration after flow through a filter of length L and back calculating λ0 [45]. A deterioration in particle removal efficiency due to particle accumulation is usually observed. The efficiency decrease is in general expressed by establishing a correlation between the filter coefficient and the amount of deposited particles [46]. λ can be related to λ0 and a dimensionless retention function F(σ). F(σ) can be expressed by Mints et al. [47], as follows
F ( σ ) = ( 1 σ σ m )
where σm is maximal retention (σmφ0). Mints’ expression is the simplest form, but accurate [26]. It only depends on the initial filter coefficient and deposition, regardless of any other empirical parameters. Therefore, the expression (4) is suitable for our experiments.
In this experiment, the initial porosity is φ0 = 0.378. Previous experiments found the deposition process stops when the volume of SP accumulation reaches some critical value σm [48,49]. It is caused by the decrease of retention sites for further deposition [50]. Accordingly, the filter medium is unlikely to be completely clogged. According to the weight test, η is 0.57, which represents the ratio of volume of deposited SP to the porosity.
σ m = η ϕ 0
λ0 can be interpreted as having a statistical basis, which represents the probability of a particle being captured by the porous medium during a time interval of 1/u [21]. The initial filter coefficient cannot be directly deduced from the physicochemical properties of the SP and the porous medium; rather, it is obtained by fitting the predicted effluent concentration history to the experimentally observed data [45,51]. When the polydisperse suspension moves from the top of the filter bed to the bottom, a proportion of particles will be captured by the medium, and the PSD will constantly change along the length (Figure 3) and the filter coefficient also varies with time and space. In general, large particles are easily captured by the porous medium as compared to the small particles [35,52], and the relative concentration of small particles increases (Figure 3). Large particles are predominantly retained at the upper parts of the column, with small particles being more likely to transport through the porous medium. Thus, the initial filter coefficient λ0 is a depth-dependent coefficient λ0(z), and it declines with increasing transport distance, if the heterogeneity among the SP population is not ignored [53,54].
The SP with diverse sizes have different probabilities to be captured by the porous medium. A formula was introduced to describe the relationship between λ0(z) and the size distribution, and capture probabilities of the SP in order to estimate λ0(z) [40].
λ 0 ( z ) = 0 Q ( x ) ln ( 1 p ( x ) ) d x
where Q(x) is the mass density, which is the proportion of the SP divided by adjacent particle spacing. p(x) is the capture probability and p(d) denotes the capture probability of particles with a diameter of d travelling a unit length through the filter bed. Equation (6) describes the expression of the initial filter coefficient, which is determined by Q(x) and p(x). Capture probability p(x) is determined by both filter medium and SP, and it can only be gained through a lot of experiments. Standard capture probability function P(d) and the characteristic length of the filter bed Lc were introduced to separate the influence of the porous medium on the initial filter coefficient from that of the size distribution of SP [40].
1 p ( d ) = ( 1 P ( d ) ) L c
λ 0 ( z ) = L c 0 Q ( x ) ln ( 1 P ( x ) ) d x
After introducing these two definitions, Equation (6) can be rewritten into Equation (8), in which P(x) is independent of the filter medium size, but determined by the size distribution of SP; whereas, the Lc only reflects the removal efficiency of filter medium. Equation (8) determines the initial filter coefficient by estimating the parameters of the Lc and the Q(x). Readers can consult Min [40] for more information about the mathematical derivation. A simple mathematical derivation can also be accessed in the Appendix A.
Q(x) is the mass density function of SP, and it can be determined by the laser light-scattering method. Q(x) varies along the length of filter medium due to the retention of the SP. Figure 4 shows the mass density of influent in this study.
Lc reflects the removal ability of the filter medium. Lc is determined by the physicochemical characteristics of the porous medium. Initial filter coefficient is proportional to specific surface [24] and a good correlation was discovered between the specific surface area of the filter medium and Lc (Figure 5). The relationship between Lc and specific surface area is only applicable to the silica sand filter material.
P(d) is a standard capture probability function, which reflects the capture probabilities of SP by the filter layer. This function is the empirical statistical result and it is obtained by the experimental results of p(d) and Lc. For a given particle diameter, the P(d) for four types of filter media is almost the same (Figure 6) and we have their average value as the P(d). A larger SP (>50 μm) can hardly be observed in effluent due to straining [50]. However, when the diameter of the SP is smaller (<30 μm), the relationship between the capture probability and the size of the SP is more complex because of combined forces (e.g., interception, hydrodynamic, diffusion) acted on the SP [21].
The solution of t above complete model can be achieved numerically, and Δt was set 2 min and Δl was 0.5 cm in this study. Filter coefficient is assumed to be unchanged during Δt along the Δl length. The boundary condition for SP transport and deposition within an initial clean porous medium is C (z = 0, t) = C0, and the initial conditions are C (z, t = 0) = 0, σ (z, t = 0) = 0.
The calculations of other process variables are shown in Equations (9) and (10).
Δ σ = ( C in C out ) Q f Δ t
Q out ( d ) = ( 1 p ( d ) ) α Δ l Q in ( d ) C in C out
and Qf is the effluent rate (L3*T−1) and α = F ( σ ) = ( 1 σ σ m ) . More details can also be accessed in Appendix B.

4. Results

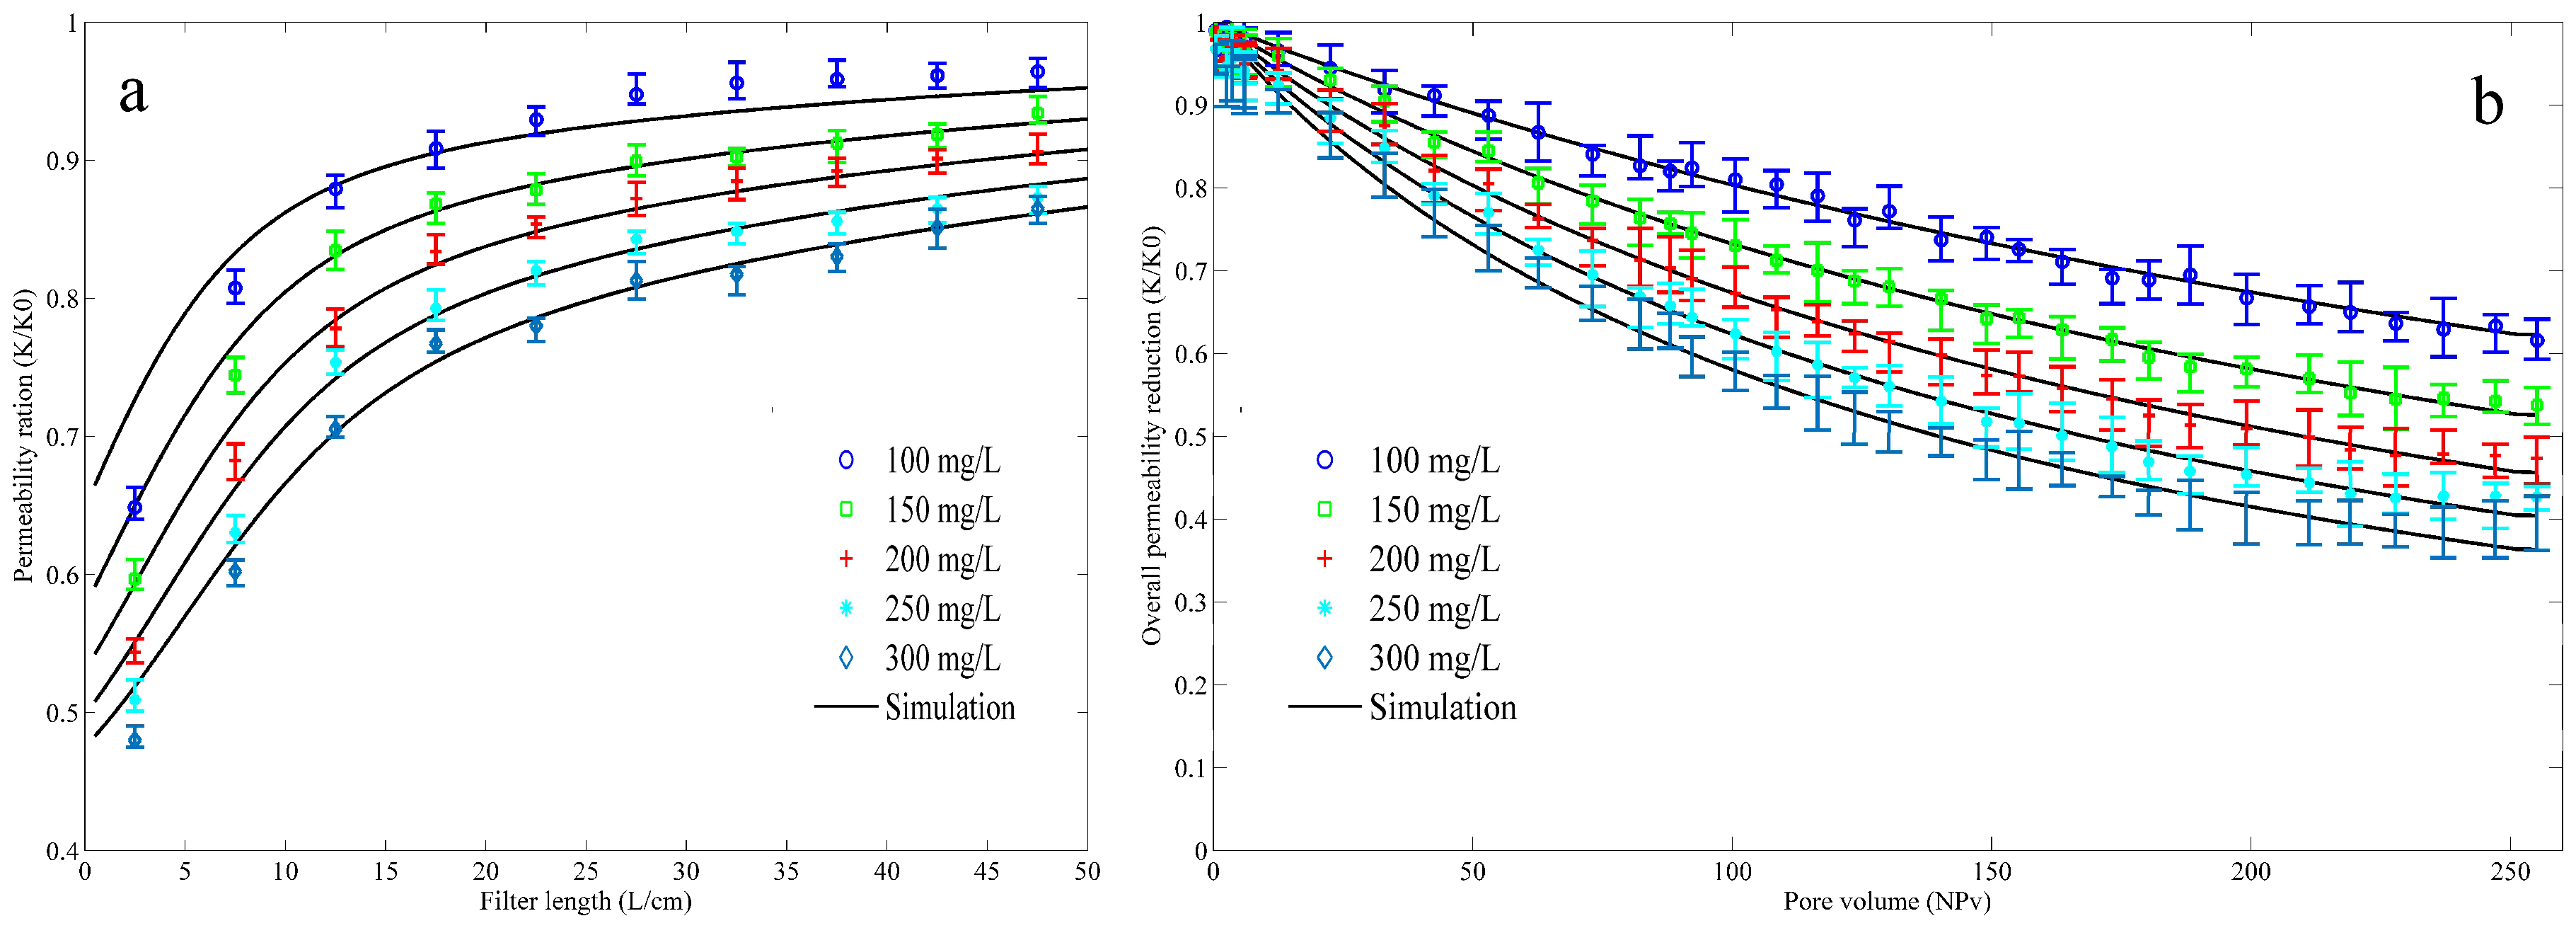
4.1. SP Transport and Retention in the Porous Medium

Breakthrough curves (BTCs) are usually employed to characterize the response of the porous medium to the SP deposition. The BTCs are represented by the relative concentration (ratio of the effluent concentration C divided by the fixed influent concentration C0) as a function of the number of pore volumes (NVp). Figure 7 presents the comparison between the experimental and predicted BTCs at different tested suspension concentrations. The predicted curves were displayed with a solid line by the modified model of time-depth-dependent filter coefficient. Similar behavior was observed for the entire range of SP concentrations examined. With the increasing injected pore volume of SP, the effluent concentrations increased during the whole operation of the experiment. Additionally, the particle accumulation within the porous medium reduced the number of vacancies for further deposition, leading to a decrease in the removal of SP. Furthermore, under the constant flow-rate condition, retention would reduce the porosity and cause an increase of pore velocities, therefore an increase in hydrodynamic forces. The hydrodynamic forces play the dual role of enhancing the SP transport rates and causing the re-entrainment of previously deposited particles [55]. Thus, the SP concentrations in the effluent increased. After the 255 Vp of SP injection, the relative concentration (C/C0) reached 82.3%, 72.4%, and 18.6% for SP concentrations of 300 mg/L, 200 mg/L, and 100 mg/L, respectively. It was also observed that the BTCs were affected by the inlet concentration. Under a fixed injected volume of SP, a higher inlet SP concentration led to a higher effluent concentration. As the rate of filling retention sites is dependent on the concentration of SP [56], high SP concentration fills retention sites more rapidly than low SP concentration [57].
Just like many other studies, the presence of a steady-state concentration plateau was not observed either, which suggested that straining might play a significant role during the experiments [35,58,59]. Figure 7 indicates that the modified model (solid lines) of the depth-dependent initial filter coefficient λ0(z) is able to simulate the effluent concentration, since a good description of the experimental BTCs with those calculated by the model is obtained for the entire range of SP concentrations examined. The conventional model (dotted lines) with a spatially constant filter coefficient λ0 generally simulated results that were lower than the experiment data, and the discrepancies with the experimental values increased as the inlet concentration decreased.

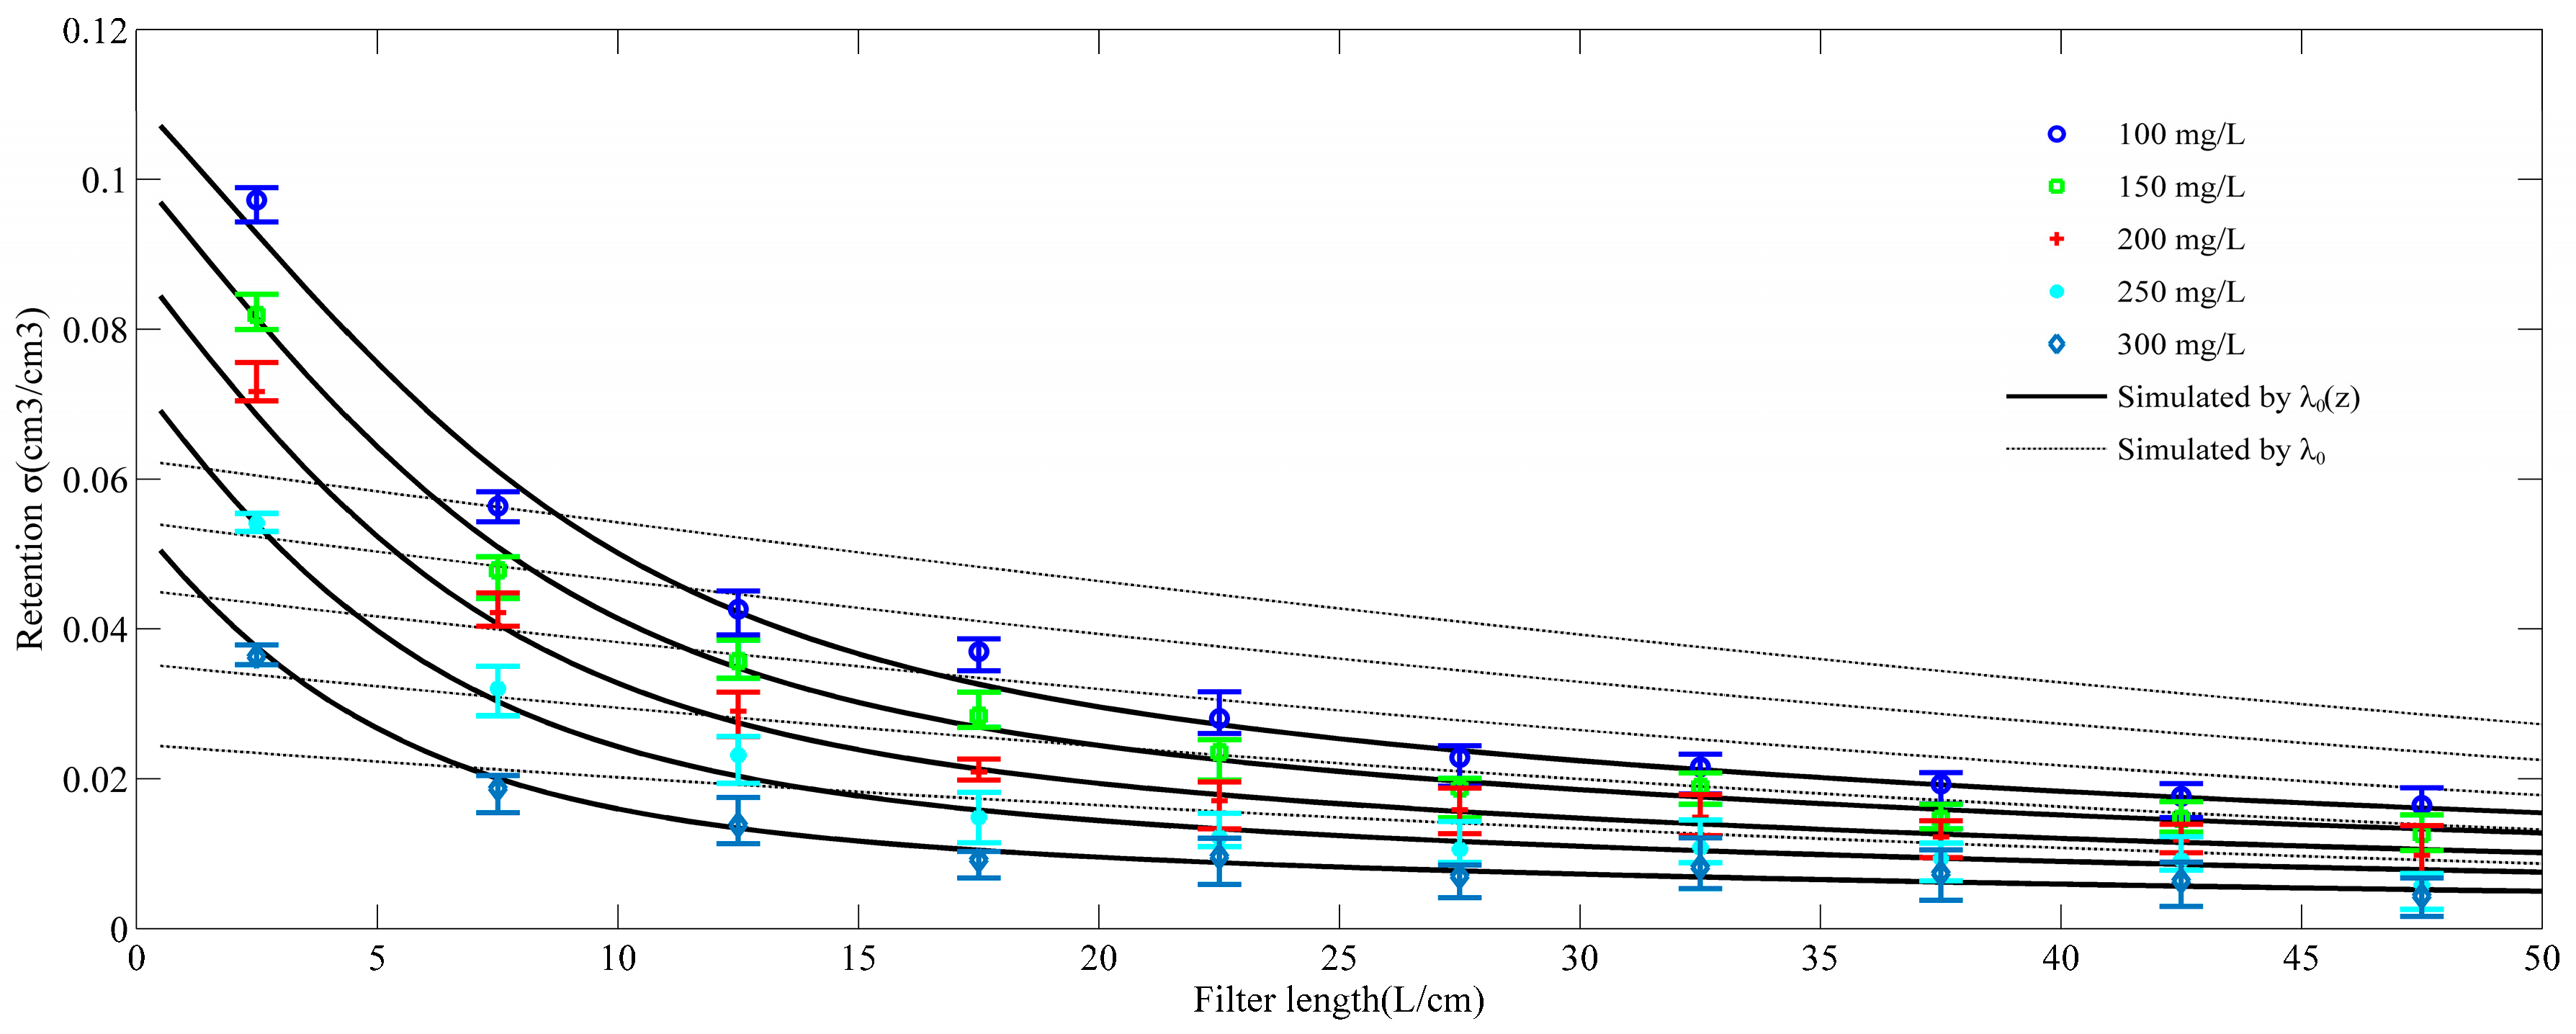
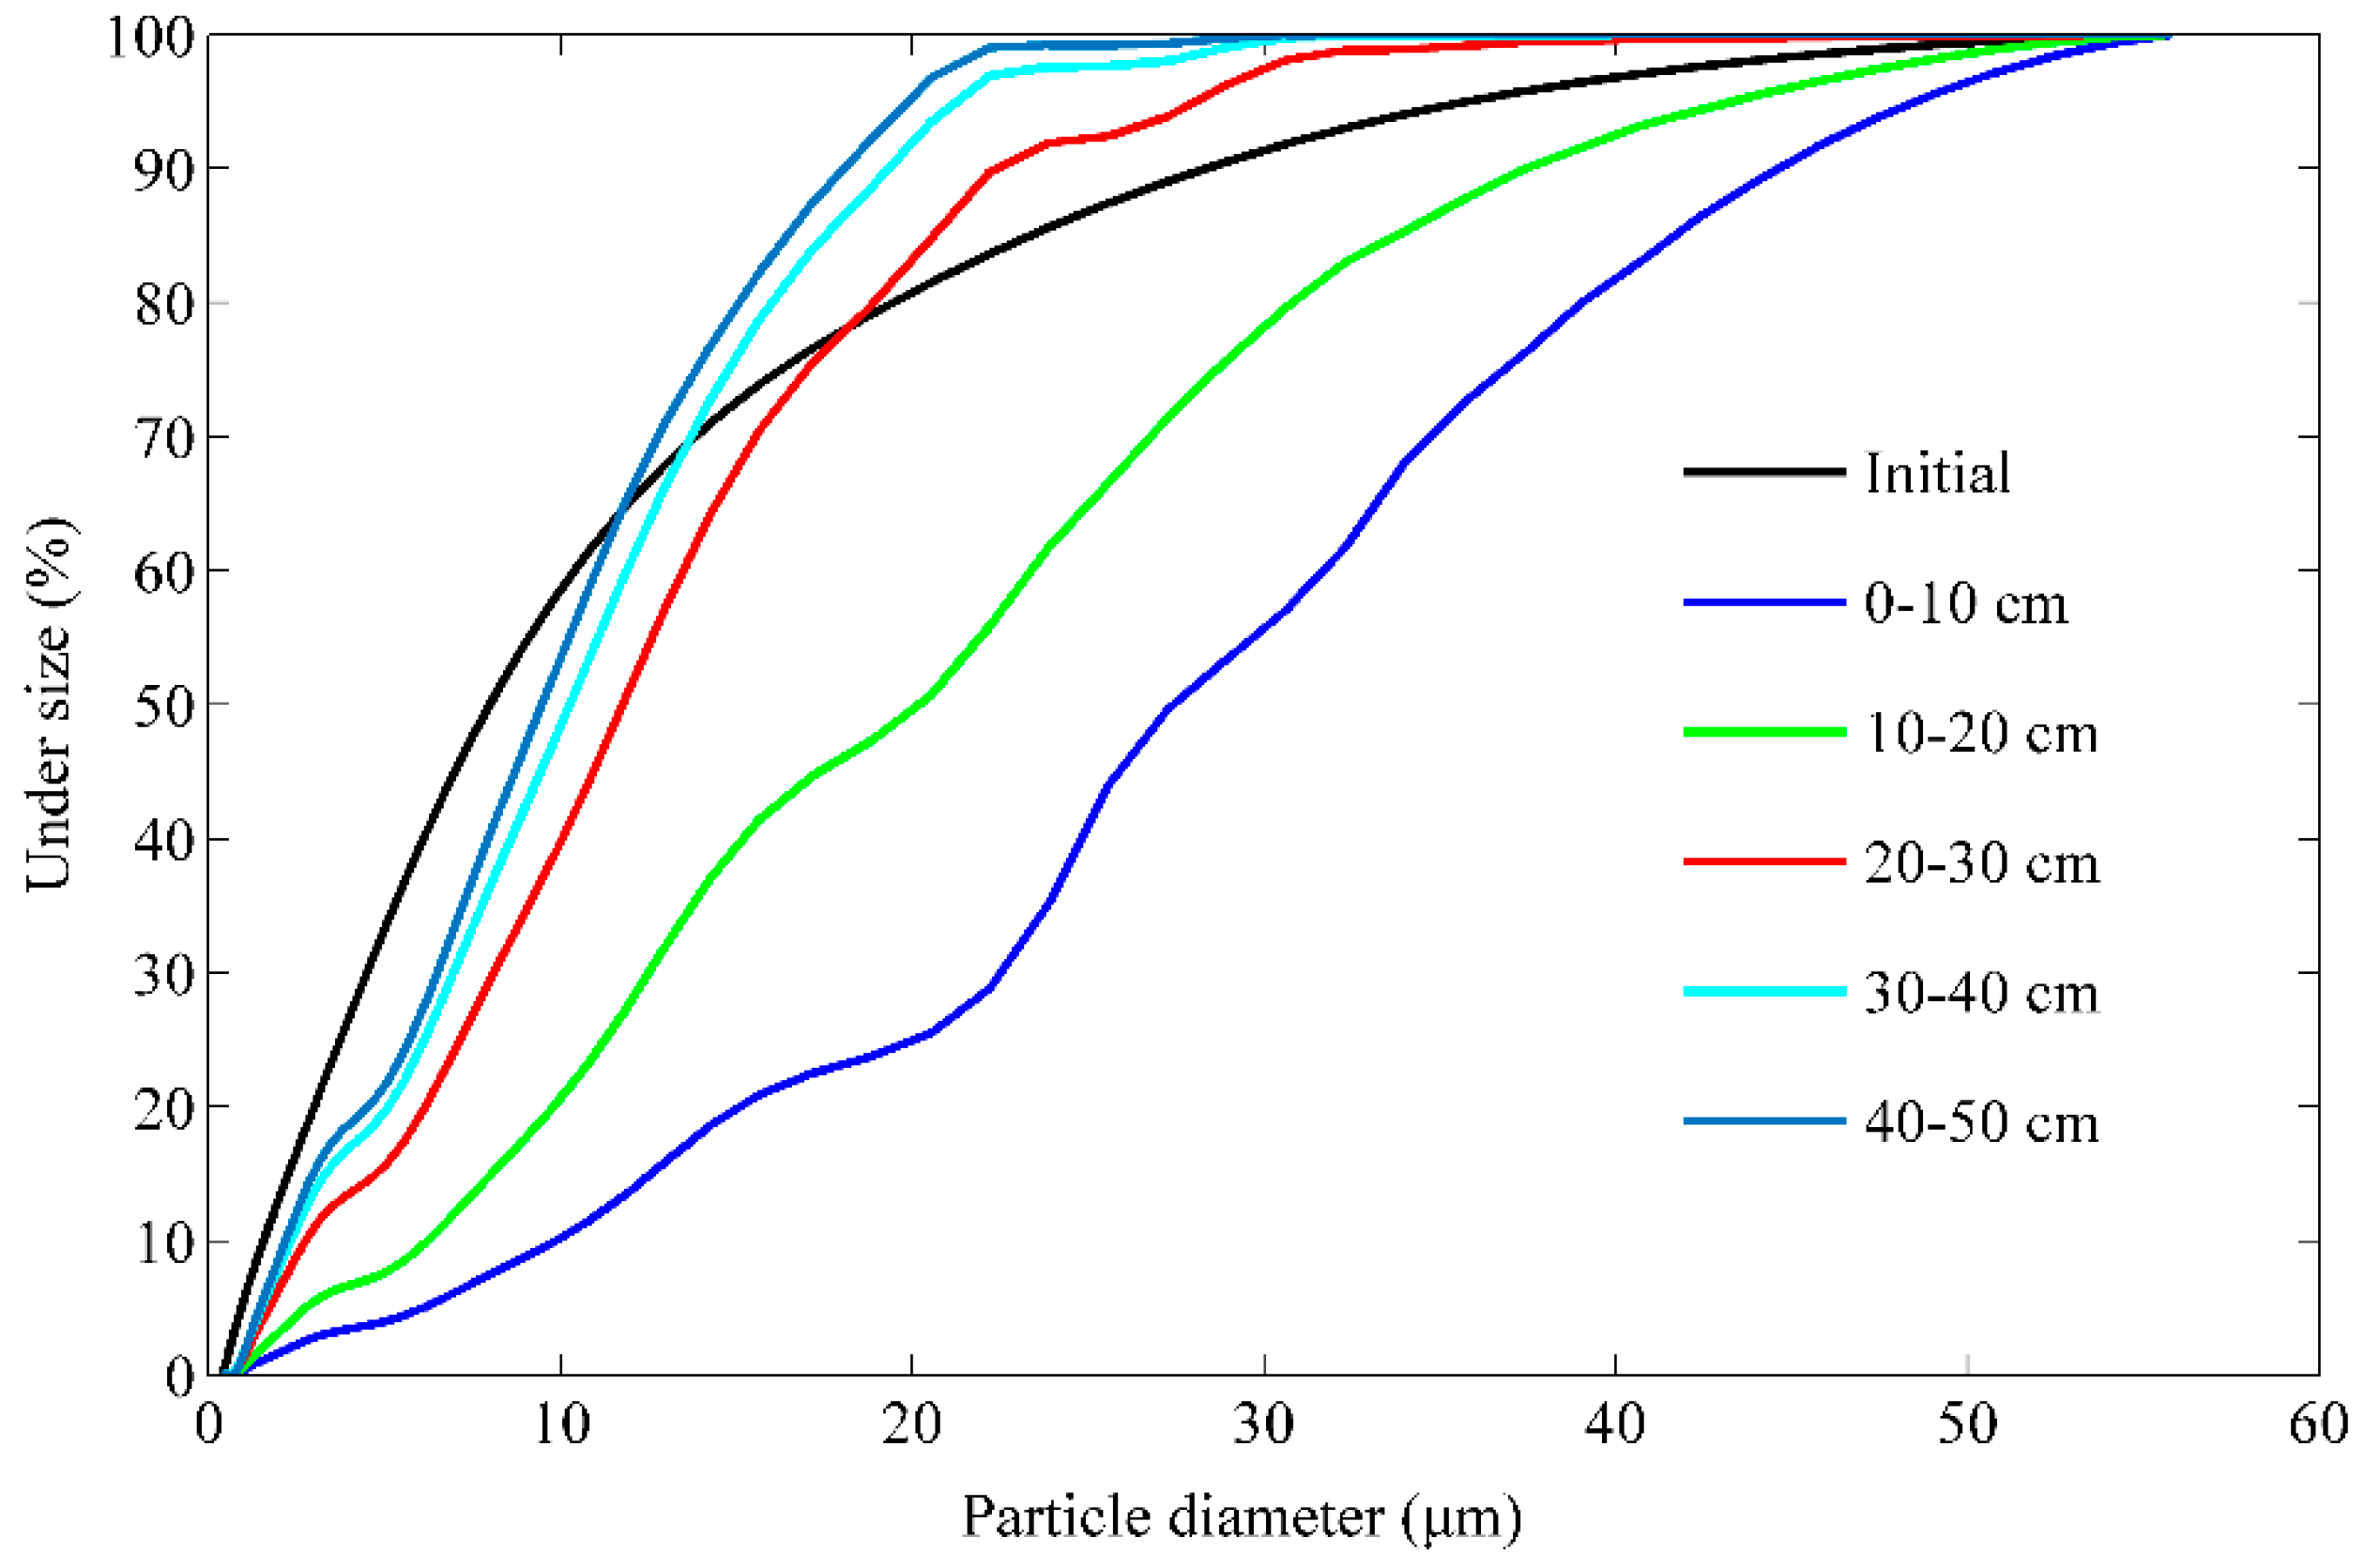
4.2. Spatial Distribution of Deposition

Previous research indicated that BTC alone is not sufficient for accurate characterization of the deposition and transport behavior of SP. Rather, the shape of the retention profile is found to be a critical indicator of the mechanisms controlling fate and deposition in a saturated porous medium [28]. The retention profiles of the SP along the sand column were obtained by excavating and cutting the porous medium into ten sections at the end of each injection experiment (Section 2.3). An average specific deposit (σ) was calculated for each section of porous medium, given as the volume of deposited particles per unit of the section volume. Table 1 shows the SP mass balance.
Figure 8 exhibits the experimental data and model predictions for the deposition profiles of the SP along the porous medium, for different SP concentrations. The solid-line curves displayed results of the simulation of the modified model with the depth-dependent initial filter coefficient, while the dotted-line curves presented the numerical results with the constant initial filter coefficient. The shapes of all the retention profiles were similar. The experimental results indicate that the retention was highly non-uniformly distributed within the porous medium, especially at the top two sections (z ≤ 10 cm) of the porous medium, but decreased with depth. The top parts of the porous medium accounted for up to nearly 50% of the retention, while deeper parts contributed less to the SP deposition (Table 1). At a given depth, the average specific deposit increased with increasing inlet SP concentration (Figure 8). A characteristic deposition profile was observed with two distinct regions: a steeper slope at the top of the column, followed by a flatter, shallower slope at the bottom. This distinctive feature of the experimentally observed retention profile (hyper-exponential retention) was obvious for the whole range of SP concentrations examined. It is well shown that the apparent and steep decrease in the retention profiles near the entrance was accurately reproduced by the modified model with a depth-dependent initial filter coefficient. However, the conventional model with a constant initial filter coefficient failed to clearly describe the hyper-exponential retention profile, since a great discrepancy was observed between the model predictions of the spatial distribution of retained SP along the filter medium and the experimentally observed results, especially at the upper sections of the porous medium (Figure 8).
Figure 7 and Figure 8 present comparisons between the results of the modified model and the results of the conventional model, as well as the experimental results of measured outlet recovered concentration and average specific deposit, for five tested influent concentrations. The results verify the modified model’s capability to characterize the hyper-exponential retention profile, for typically used stormwater concentration range (100 mg/L–300 mg/L). Thus, a filtration model that was incorporated with a distance-dependent initial filtration coefficient would be more suitable for the interpretation of the experimentally observed spatial distribution of deposited SP. Moreover, the proposed model can be used to analyze the spatial and temporal distribution of deposition rate during the stormwater recharge of highly polydisperse SP.

5. Discussion

5.1. The Deviation of a Hyper-Exponential Retention Profile

Traditional filtration models mostly focus on virus and colloids, which are not only small but also monodispersed. However, the particles in the stormwater have a wider size range and the impacts of particles’ heterogeneity on the filtration coefficient are much stronger. The differences between small monodispersed colloids and larger polydisperse particles in stormwater results in distinct deposition behavior.
Figure 9 depicts the evolution of the accumulated retention during injection. It can also be seen that the conventional model clearly exhibited a relatively flat decay of the spatial distribution of deposited SP for all experiments, regardless of the SP concentration (Figure 9a); while the modified model showed much more uneven distributions of retained SP (Figure 9b). Particles of different size have different probabilities to be captured by the porous medium (Figure 6). Particles with high capture probabilities (usually large particles) are more likely to be retained near the porous medium inlet, and the particles with low capture probabilities (usually small particles) are more likely to be transported through the porous medium, which produces a decrease deposition rate coefficient with increasing transport distance. The flat decay implies that the conventional model tends to homogenize the spatial distribution of SP retention [60]. The employment of a constant initial filter coefficient overestimated the total SP retention, even if the retained SP at the column entrance was severely underestimated. The overestimated retention could be verified by the SP mass balance. The lower-than-experiment curves (Figure 7) implies that more mass of SP were retained in porous medium. Previous studies also found that the classical CFT (colloid filtration theory), equipped with a constant deposition rate, usually considerably overestimate the amount of deposited particles in saturated porous media [30,61]. The retention profiles also experimentally confirm that highly heterogeneous SP produce retention profiles that are highly hyper-exponential [34].
The fact that the classical filtration model does not adequately account for the effects of straining and SP’s polydispersity causes the great discrepancy between results of conventional model and experimental data. At the end stage of filtration, the porous medium was gradually clogged, as a clogging layer formed on the medium surface (Figure 10). The preferential retention of SP near the source suggests that straining is the primary mechanism of deposition in the stormwater filtration experiments [62].

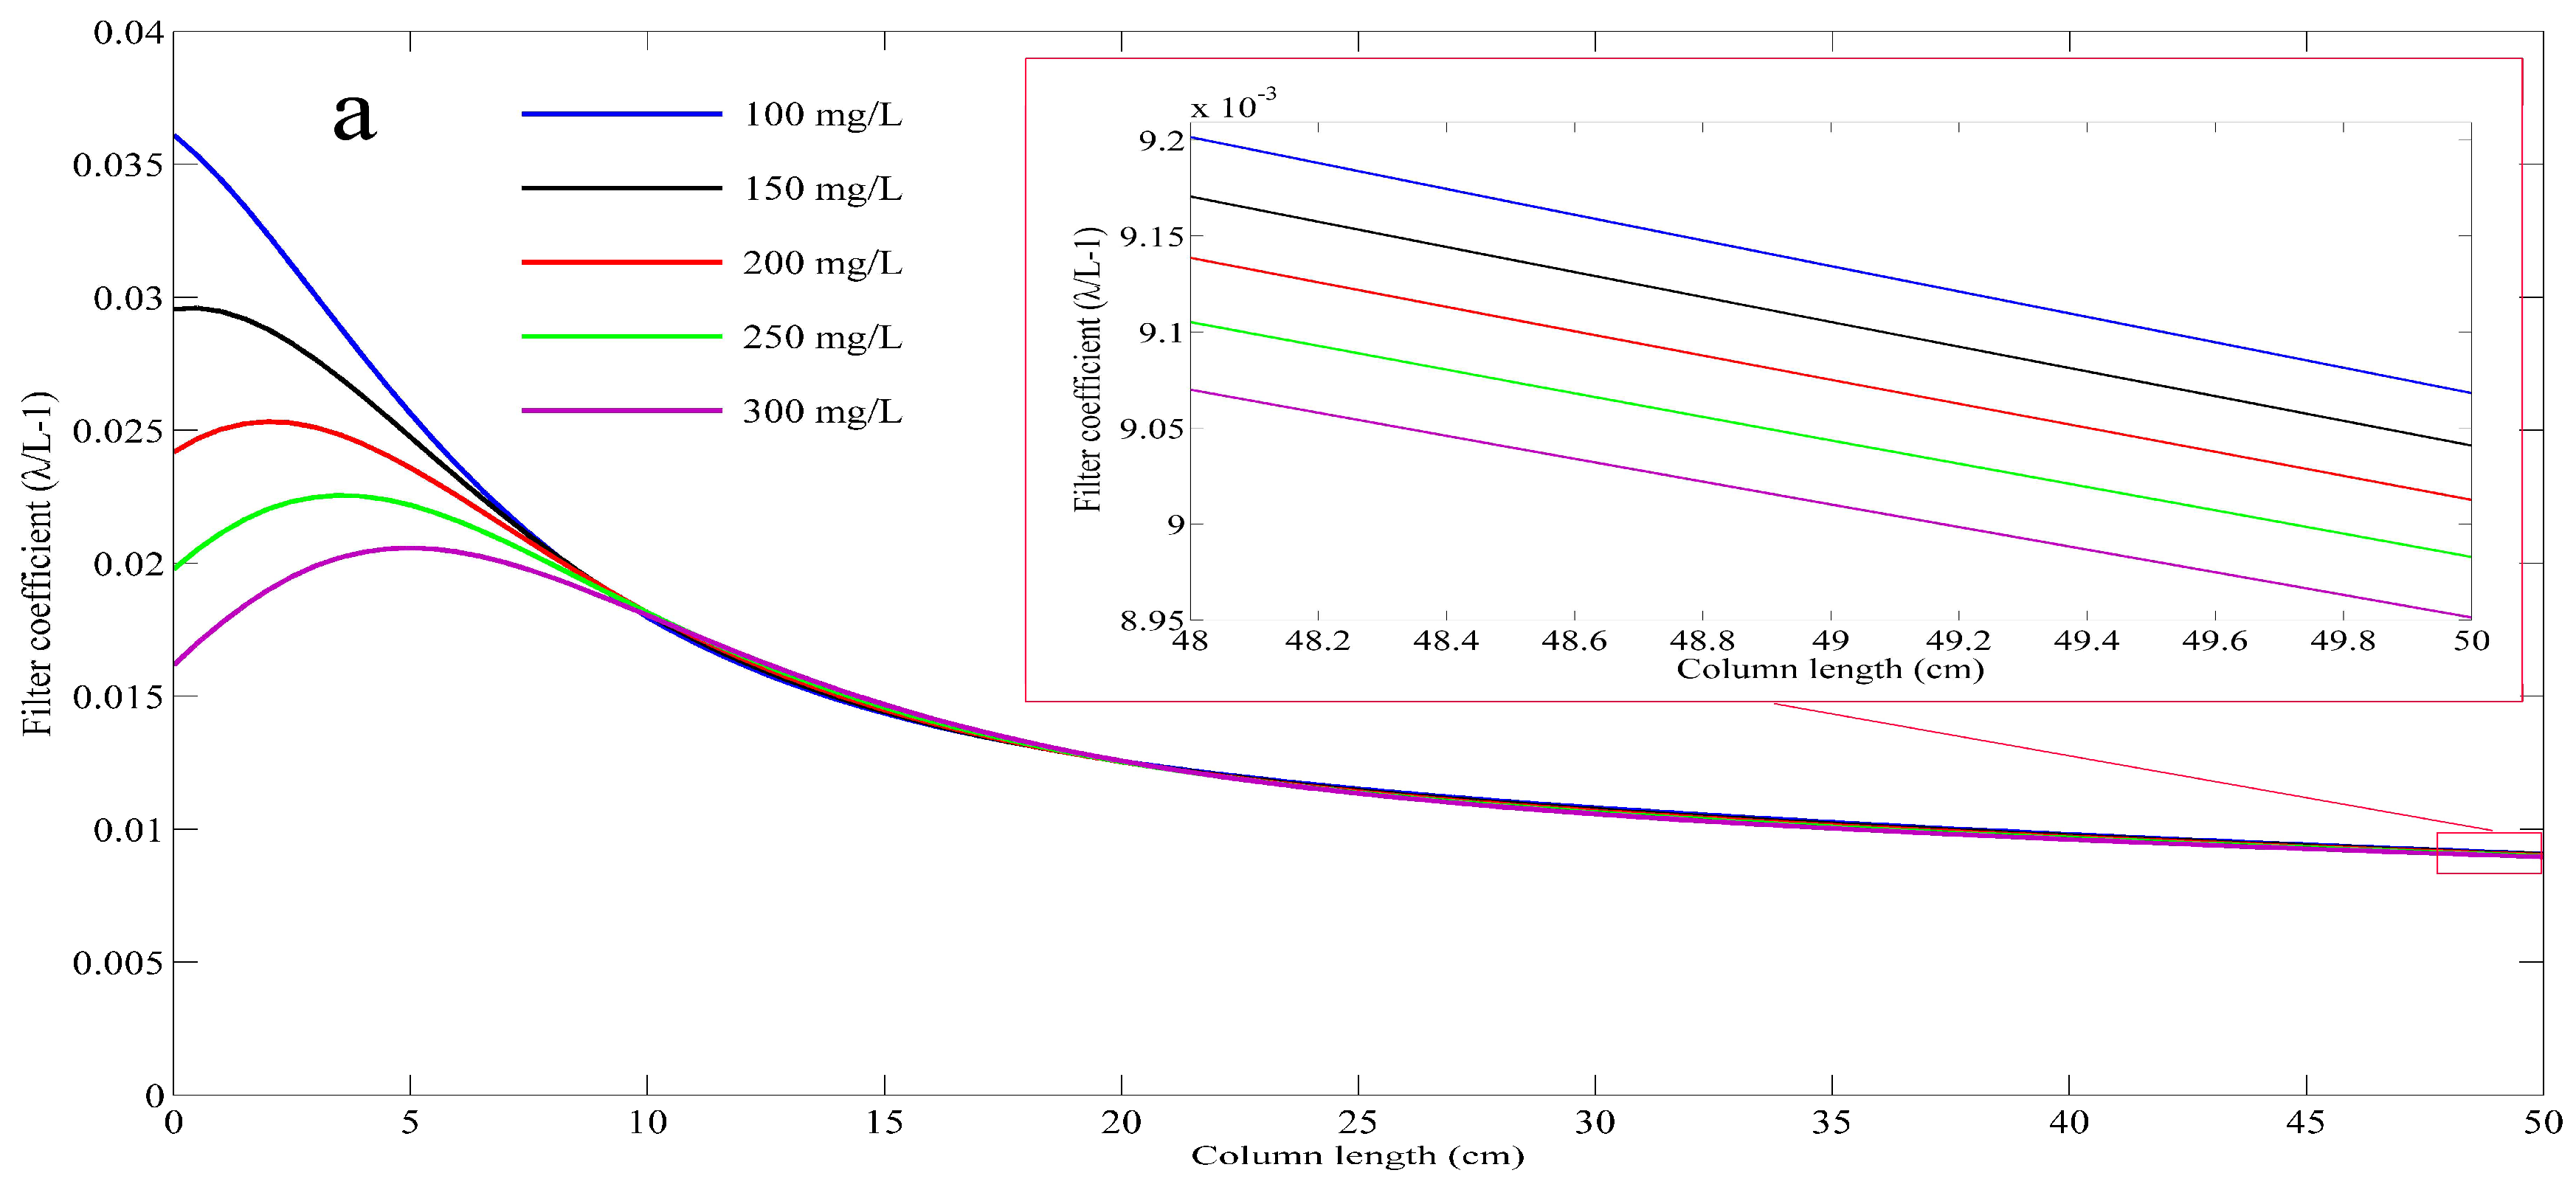
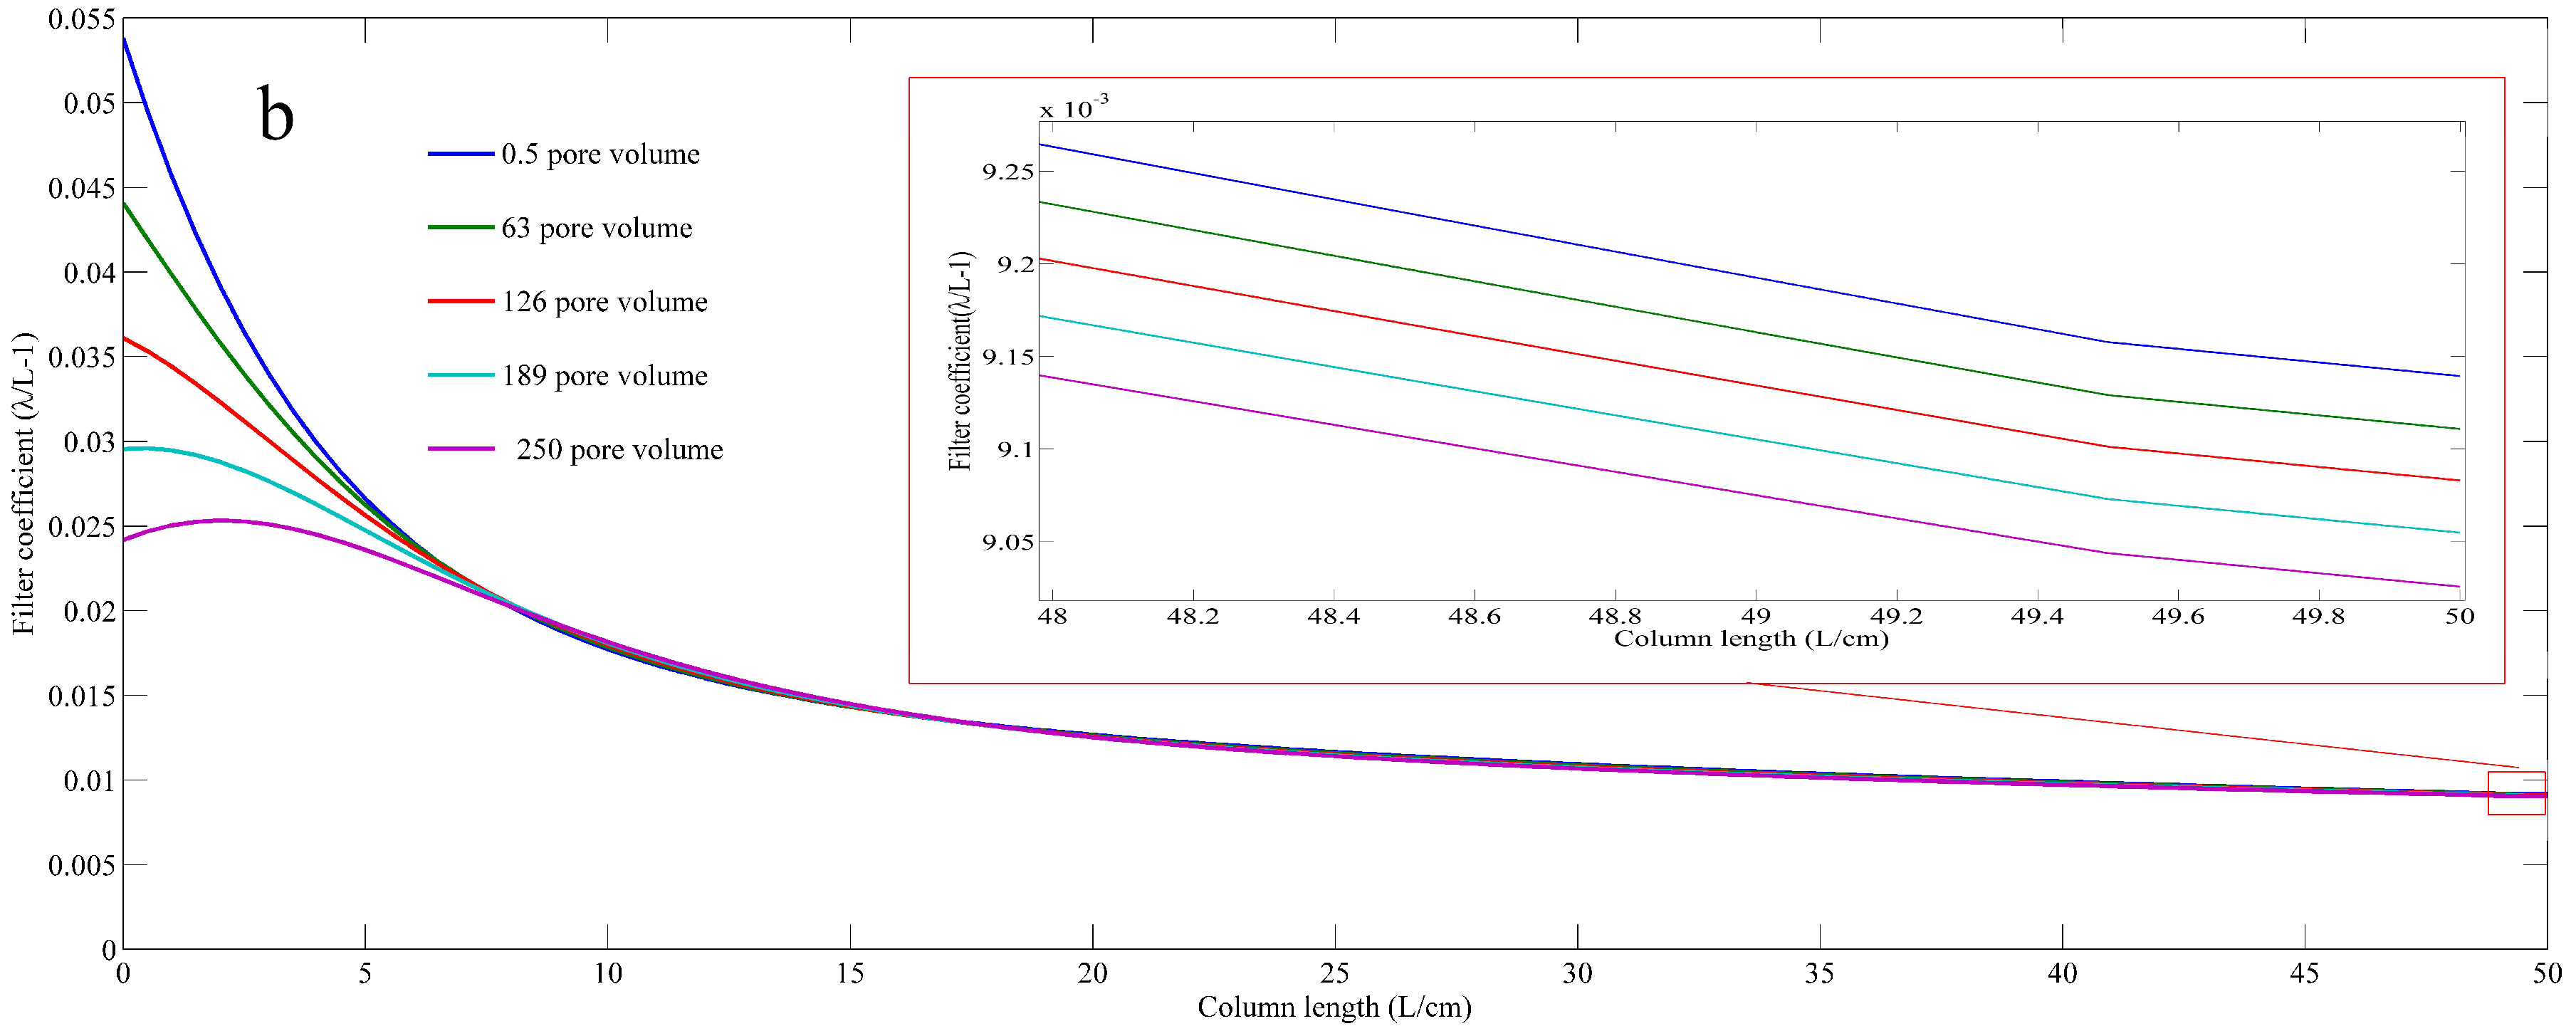
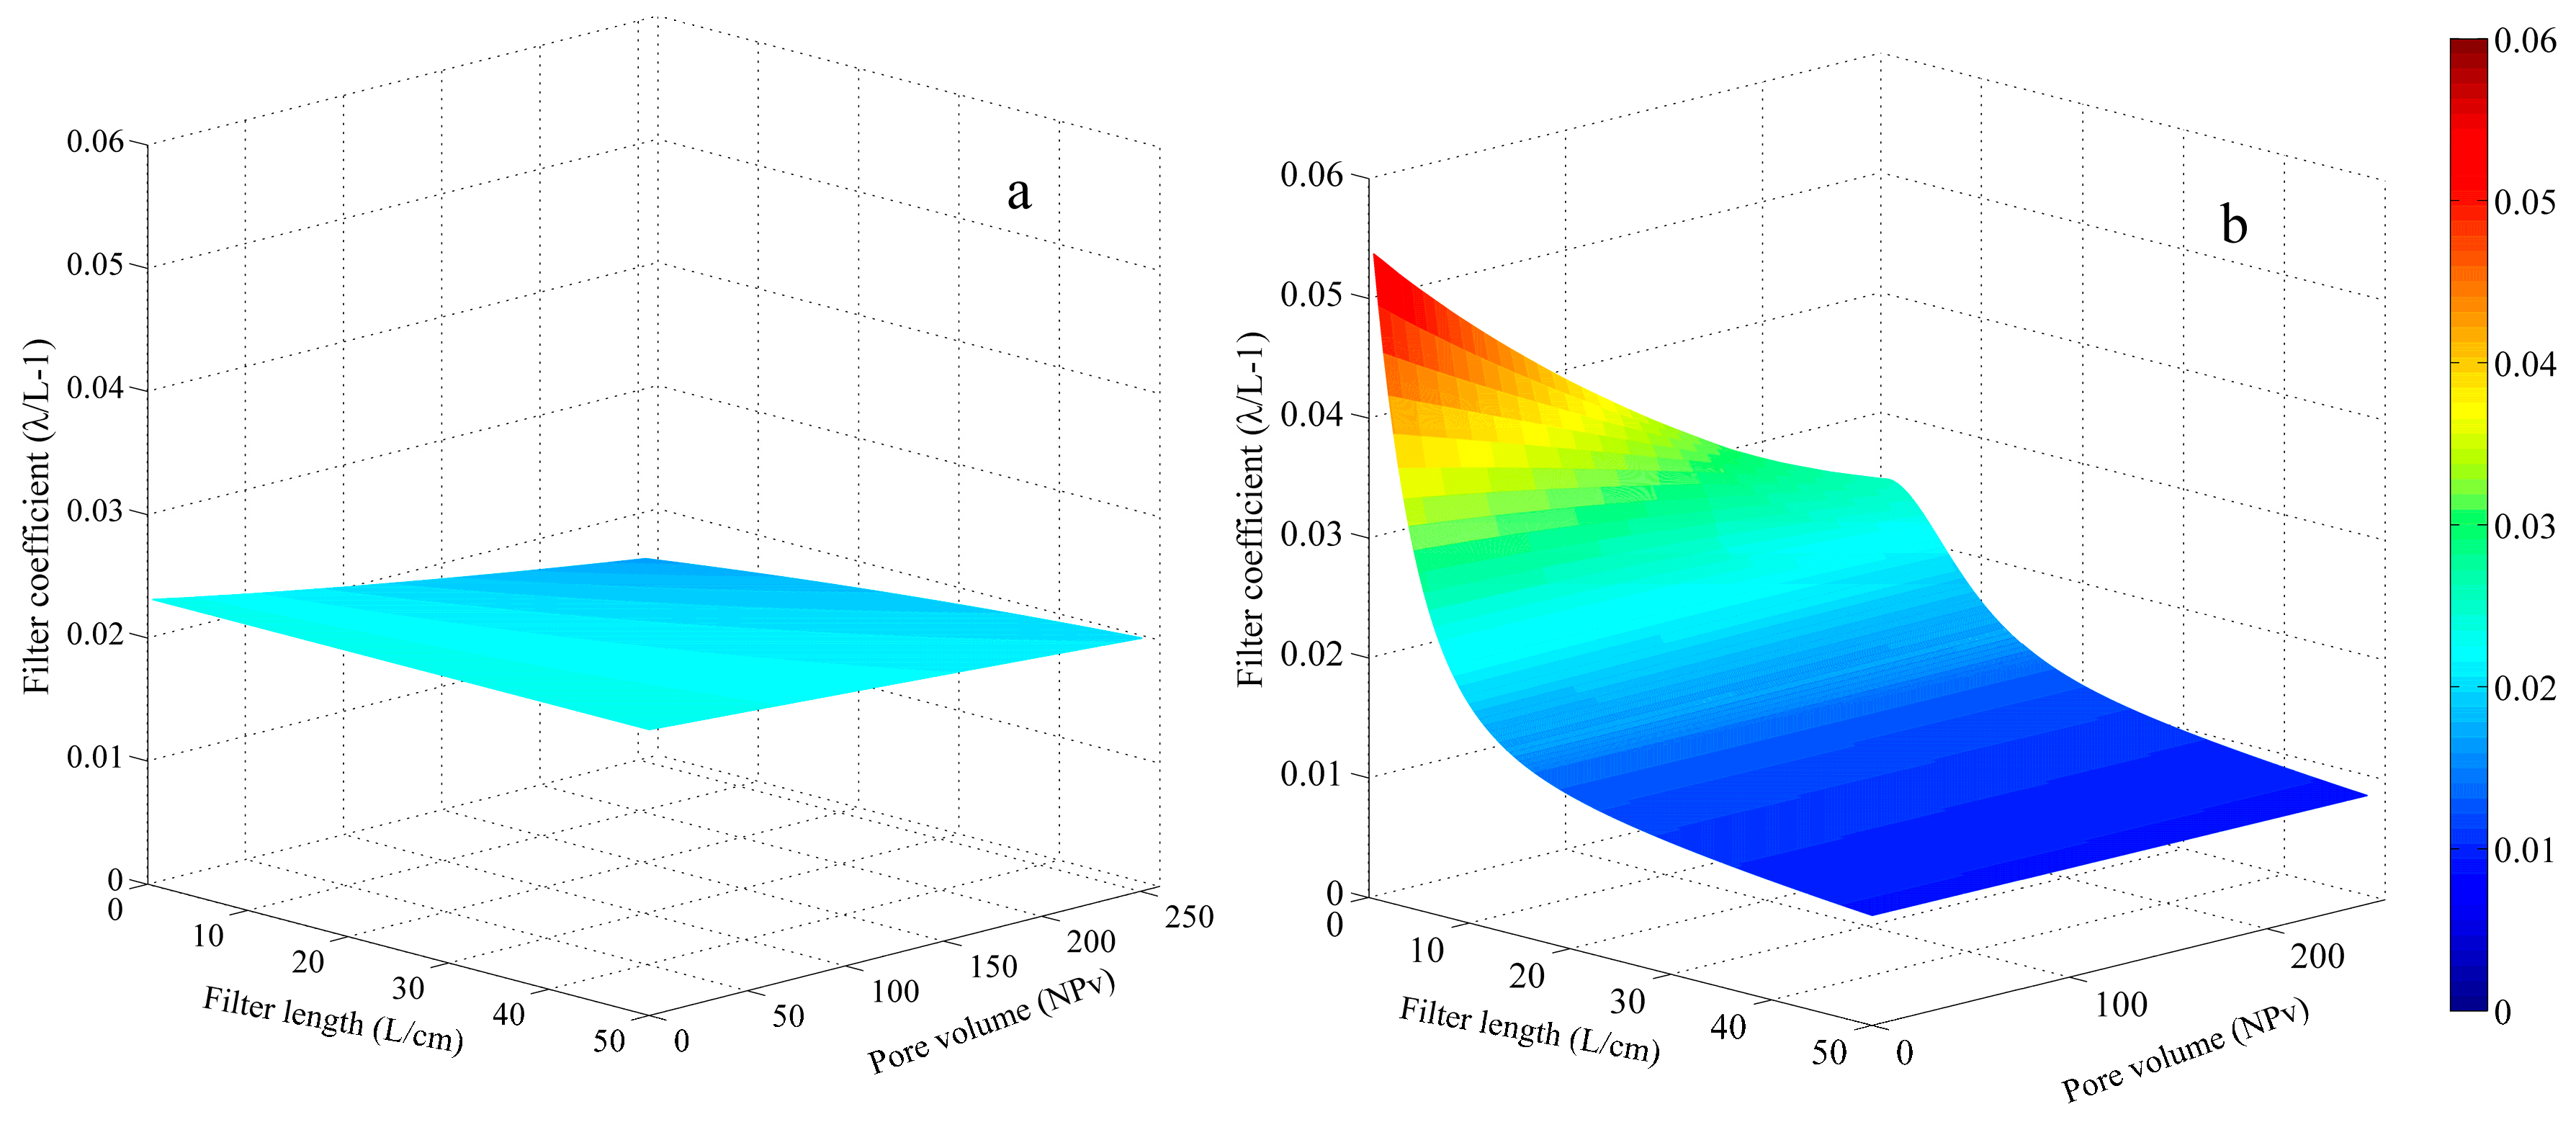
5.2. Spatial and Temporal Evolution of Filter Coefficient

The hyper-exponential retention profiles suggest decreased distributions of deposition rates, specifically, a high deposition rate near the column entrance, followed by a region with low deposition rates [29]. The deposition rate for a stable polydisperse suspension is highly dependent on the particle size distribution [34]. As a result, some models with two kinetic retention coefficients have been developed, with a fast deposition rate representing up-gradient “sticky” particles and a slow deposition rate representing “less-sticky” particles [27,30,35].
Figure 11 shows the model predictions for the spatial distribution of filter coefficients (deposition rates) at the end of the experiments for different SP concentrations. Figure 11b depicts the evolution of the filter coefficient for a typical SP concentration (C = 200 mg/L) during the injection. The shapes of all filter coefficient curves for the examined concentrations were similar. A higher inlet concentration generally led to a lower filter coefficient due to a higher average specific deposit (Figure 8). It was observed that the value of filter coefficient decreased obviously with the increased volume of injected stormwater, especially at the upper end of the porous medium. The decrease rate significantly declined with transport depth, and the bottom of the porous medium suffered little drop of filter coefficient (the inset graph in Figure 11b). The spatial and temporal evolution of filter coefficient was in consistent with that of the retention. It can be found that the maximum value of the filter coefficient moved downward from the entrance with the increased number of pore volume. When the injection experiment began, the highest value near the injected point resulted from the high concentration of large SP and the sufficient deposition sites. With the increased volume of stormwater injection, plenty of retained SP being captured around the injection source resulted in a significant decrease in the number of deposition sites, thus reducing the filter coefficient.
Figure 12 shows the comparison of spatial and temporal distribution of filter coefficient by the modified model and conventional model, for a typical SP concentration of 200 mg/L. The conventional model assigned a spatially constant initial filter coefficient (Figure 12a). The filter coefficient decreased with time (pore volume), but the decrease was uneven along the depth. The closer to column inlet, the bigger decline was observed, because most large SP were retained at the first centimeters of the sand column. In the modified model simulation, the curves exhibited a similar variation trend along the time axis, but they were totally different along the length axis. The initial filter coefficient decreased along the length, even when the filter bed was clean (Figure 12b). The lower part of the column captured less SP, so the lower part of the filter was far less influenced by the filtration. This was not caused by the filter medium, but by the SP, as SP become more difficult to be captured by the lower part of filter. These results also indicate highly uneven deposition of SP and the deposition mainly occurred around the entrance of the medium, where the clogging layer was commonly observed.
The idea of the depth-dependent initial filter coefficient is consistent with the following conceptual model: under a constant flow-rate condition, large particles with higher capture probabilities are more likely to be captured by the porous medium, so a larger proportion of large SP are retained at the upper section of the sand column relative to smaller particles with lower capture probabilities. Although this non-proportional capture caused an increase in the small particle concentration of the mobile particle population, and the deeper parts of porous medium have great capacity to accommodate particles, the colloid population becomes less sticky with increasing transport distance. Finally, the particles with lower capture probabilities could transport longer filter, or more likely to pass through the sand column and be detected in the effluent. As a result, the initial filter coefficient declines along the porous medium. In turn, the progressive accumulation of particles due to straining in the upper sections could further enhance the retention of subsequent SP, which results in a more uneven distribution of retention than what the conventional model expected.

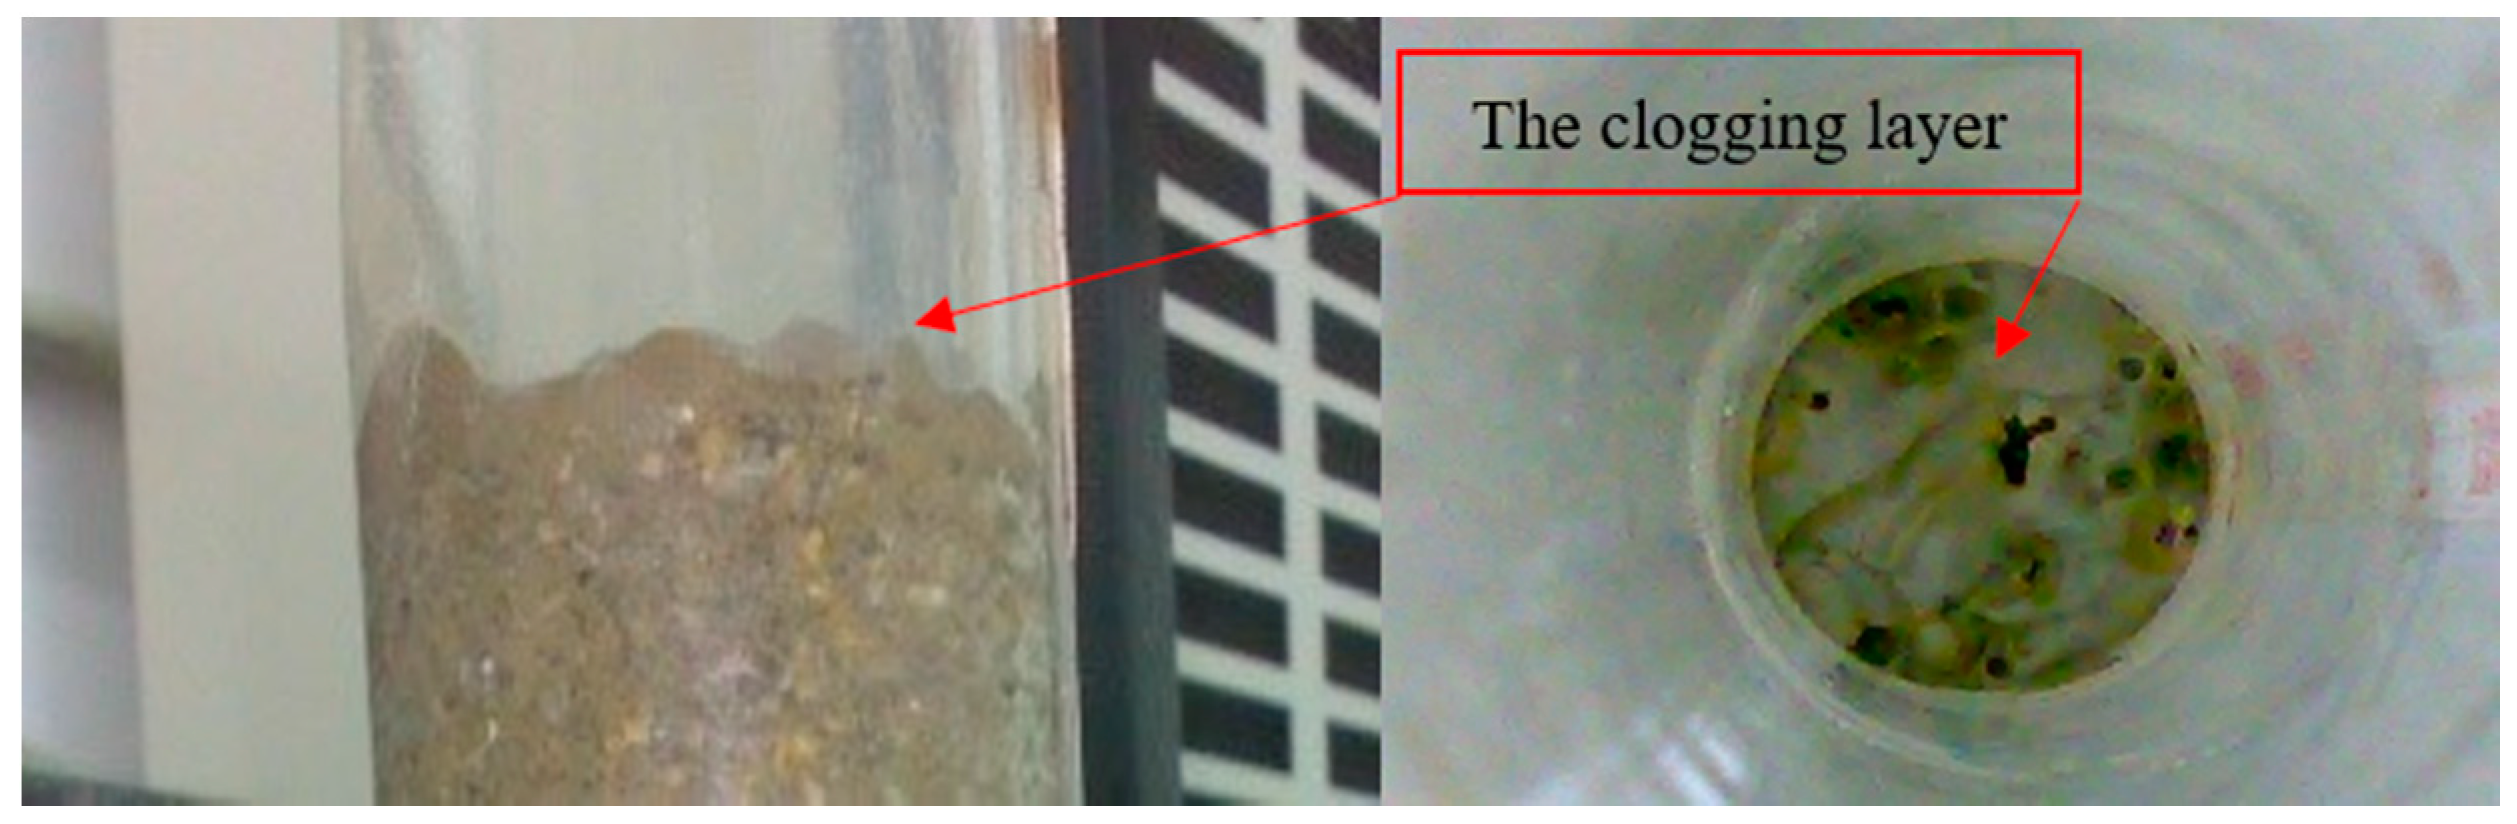
5.3. Uneven Permeability of the Porous Medium

The uneven SP deposition inevitably cause uneven permeability reduction to the porous medium, as the permeability is directly related to the porosity [31]. Darcy’s law with measurements of head losses at different times assessed the permeability decline of the porous medium due to SP accumulation. The permeability, initially uniform, became highly non-uniform after the injection experiments (Figure 13a). This non-uniform distribution increased with increasing concentrations. The permeability profiles for all concentrations exhibited a same trend. At a given depth, the decline in permeability was smaller when the SP concentration was lower. It appears that the permeability suffered the most decline near the entrance, and then increased with depth to approach the initial permeability. An estimated 52% of permeability reduction occurred at the top section (z ≤ 5 cm), but only 13% of permeability reduction at the bottom section for the same SP concentration (C0 = 300 mg/L).
This non-uniform permeability reduction was consistent with the spatial distribution of deposition (Figure 8). Therefore, the permeability reduction can be a function of the spatial distribution of retained SP within the filter medium. For a long filtration experiment, and when the clogging is severe, the normalized permeability K/K0 inversely increases with the average retentions [27,47]. Thus, the local permeability decline at the end of each injection experiment can be described by the following empirical relationship:
K K 0 = 1 1 + β σ
with β = 10.51 being the formation damage coefficient in this study, which lumps together the combined impacts of deposited SP on the permeability reduction.
Figure 13b also shows the evolutions of overall permeabilities for different concentrations. The initial K0 decreased substantially over time, but the rate of decline decreased generally over time, appearing to reach a constant value at the end of the experiments. The evolutions of overall permeability reductions can be simulated by the Kozeny-Carman model [43]:
K K 0 = ϕ ( z , t ) ϕ 0 ( 1 ϕ 0 ) 2 ( 1 ϕ ( z , t ) ) 2
ϕ ( z , t ) = ϕ 0 σ ( z , t ) ( 1 ϕ d )
ϕ d = 1 ρ d ρ p
where ρd (M*L−3) is the average deposit density (1.61 g/cm3), ρp (M*L−3) is the SP specific density (2.56 g/cm3), and σ(z,t) was obtained by the modified model.
The comparisons show a good agreement between the simulation results and experimentally observed data throughout the course of the experiments, indicating that the model provides a satisfactory prediction of the overall permeability reduction that was caused by the distribution of SP deposition within a filter medium. The good agreement also clearly confirms that the permeability reduction is mainly influenced by the amount of SP accumulation. The influent stormwater SP concentration has indirect impacts on the permeability reduction, since they influence the volume and the spatial distribution of retained SP.
The PSDs of the influent suspension and the retained SP were measured to further clarify the mechanisms governing the transport and fate of SP. Figure 14 describes the PSDs of retained SP from the sections at the end of the filtration. PSD varied along the filter depth. The observed values for median particle size d50 diminished from top section (z ≤ 10 cm) to bottom section (40 ≤ z ≤ 50 cm), as the SP were unevenly retained in the porous medium. Furthermore, the top section (z ≤ 10 cm) captured almost the same SP spectrum as that of the initial SP spectrum, while the particle size range (0.375 to 22.59 μm) in the bottom section is much smaller than that of the initial SP spectrum (0.375 to 55.82 μm). The PSD analysis conforms that larger SP are mainly captured near the column entrance, which causes the bottom section to possess narrower particle size range. The ratio (dp/dg) of the SP size (from 0.375 to 55.82 μm), to the mean filter grain diameter (993 μm), ranged from 0.00038 to 0.056. For SP with a particle diameter larger than 4.97 μm, this ratio is greater than a threshold value of 0.005, as reported in the previous paper [58]. This confirms that straining is the primary mechanism for the capture of SP in the filtration experiments, with 71.4% of SP in the suspension greater than 4.97 μm. These results suggest that consideration of polydisperse suspensions is of primary importance near the injection surface.

6. Conclusions

Most conventional models to depict particle transport and deposition have been developed for monodispersed suspensions, whereas natural stormwater typically exhibits a much wider size range of suspended particles. In this study, the transport and fate of polydisperse SP in a saturated sand column was explored under constant flow-rate conditions, for the typically used stormwater concentration range (100 mg/L–300 mg/L). A depth-dependent deposition model is developed to elucidate the effects of the heterogeneity of the particle population by lumping the capture of heterogeneous SP as a result of different deposition mechanisms, into a capture probability. Large particles with generally high capture probabilities are more likely to be retained near the porous medium inlet, and small particles with low capture probabilities are more likely to be transport through the porous medium. This “selective” deposition of SP should be characterized by a distance-dependent deposition rate coefficient instead of a constant rate. The experiment results demonstrate the modified model’s capability to produce highly hyper-exponential retention profiles, for the typically used stormwater concentration range (100 mg/L–300 mg/L). However, the conventional model (with a constant deposition rate) tends to homogenize the spatial distribution of SP retention, and overestimate the retention of the porous medium. In addition, the spatial distribution of deposition and SP mass balance suggest that large amount of the deposited SP are retained at the first centimeters of the column entrance. The formation of the clogging layer and PSD results confirm the uneven capture of heterogeneous SP. The SP deposition directly reduces the permeability of the porous medium. As a result, an empirical relationship between SP deposition and local permeability reduction is developed, and Kozeny-Carman model can estimate the evolution of overall permeability reduction. Local permeability reduction and overall permeability reduction both demonstrate the non-uniform distribution of the deposition, and that the inlet suspension concentration has indirect effects on permeability decline. Finally, straining is the primary mechanism for the SP deposition in the stormwater filtration applications, and the consideration of polydisperse suspended particles is of primary importance near the infiltration surface. Further, the particle deposition is also controlled by hydrodynamic effects. It is not clear whether the particle capture probabilities are still valid under higher or lower flow rates. Further experiments and simulations are needed to explore these possibilities.

Author Contributions

Conceptualization, Z.Z. and X.M.; Data curation, X.M.; Funding acquisition, L.S. and X.M.; Investigation, Z.Z.; Methodology, Z.Z.; Project administration, L.S.; Software, X.M.; Supervision, L.S. and X.M.; Writing—original draft, Z.Z.; Writing—review & editing, L.S. and E.C.M.

Funding

The research work is funded by the National Natural Science Foundation of China project (D010102-41501045); the Fundamental Research Funds for the Central Universities (2018B607X14) and Postgraduate Research & Practice Innovation Program of Jiangsu Province (KYCX18_0579). The research work is also funded by the National Natural Science Foundation of China project entitled “Study on Water Cycle Evolution of Groundwater Reservoir in the Arid Area under Artificial Regulation” (No. 41572210).

Acknowledgments

The authors acknowledge valuable comments from the reviewers, which led to significant improvement of the paper.

Conflicts of Interest

The authors declare no conflict of interest.

Nomenclature

CSuspended particles concentration
CinInfluent particle concentration
CoutEffluent particle concentration
dParticle diameter
LDepth of filter bed
LcCharacteristic length of filter bed
ϕthe porosity of filter medium
p(d)Capture probability function
P(d)Standard capture probability function
Q(d)Mass density function
tTime
uFiltration velocity
λ0Initial equivalent filter coefficient
λ0 (z)Initial filter coefficient at location z
σDeposited particle mass per unit of bed volume
σmMaximum possible value of σ

Appendix A

When the suspension passes through the depth (ΔL) of filter bed in the time (Δt), the decreased mass of particles can be expressed as:
Δ m = M 0 Q ( x ) ( 1 ( 1 p ( x ) ) Δ L ) d x
Then
Δ m = Δ t A v C in 0 Q ( x ) ( 1 ( 1 p ( x ) ) Δ L ) d x
Δ m Δ t A v = C in C out
Combined with Equation (1), yield
0 Q ( x ) ( 1 ( 1 p ( x ) ) Δ L ) d x = 1 exp ( λ l Δ L )
Since 0 Q ( x ) d x = 1 , so Equation (A4) can be written as
λ l = lim Δ L 0 ln ( 0 Q ( x ) ( 1 p ( x ) ) Δ L ) d x ) Δ L
Simplifying Equation (A5), we finally obtain
λ l = 0 Q ( x ) ln ( 1 p ( x ) ) d x

Appendix B

A particle with diameter d has probability of p(d) to be captured by the filter medium. During the course of stormwater injection, the probability for the particle transport through Δl length of clean filter medium (σ = 0) without being capture is:
q ( d ) = ( 1 p ( d ) ) Δ l
And, when the filter medium is dirty (σ > 0), as
λ z = λ 0 ( z ) F ( σ ) = 0 Q ( x ) ln ( 1 p ( x ) ) F ( σ ) d x
Assume α = F(σ), we can get
q ( d ) = ( 1 p ( d ) ) α Δ l
for an already dirty filter medium.
Because
Q out ( d ) C out = Q in ( d ) C in q ( d )
Thus,
Q out ( d ) = ( 1 p ( d ) ) α Δ l Q in ( d ) C in C out

References

  1. Kandra, H.S.; Mccarthy, D.; Fletcher, T.D.; Deletic, A. Assessment of clogging phenomena in granular filter media used for stormwater treatment. J. Hydrol. 2014, 512, 518–527. [Google Scholar] [CrossRef] [Green Version]
  2. Dillon, P. Future management of aquifer recharge. Hydrogeol. J. 2005, 13, 313–316. [Google Scholar] [CrossRef]
  3. Kandra, H.S.; Deletic, A.; Mccarthy, D. Assessment of impact of filter design variables on clogging in stormwater filters. Water Resour. Manag. 2014, 28, 1873–1885. [Google Scholar] [CrossRef]
  4. Voisin, J.; Cournoyer, B.; Vienney, A.; Mermillod-Blondin, F. Aquifer recharge with stormwater runoff in urban areas: Influence of vadose zone thickness on nutrient and bacterial transfers from the surface of infiltration basins to groundwater. Sci. Total Environ. 2018, 637–638, 1496–1507. [Google Scholar] [CrossRef] [PubMed]
  5. Jegatheesan, V.; Vigneswaran, S. The effect of concentration on the early stages of deep bed filtration of submicron particles. Water Res. 1997, 31, 2910–2913. [Google Scholar] [CrossRef]
  6. Sansalone, J.; Kuang, X.; Ying, G.; Ranieri, V. Filtration and clogging of permeable pavement loaded by urban drainage. Water Res. 2012, 46, 6763–6774. [Google Scholar] [CrossRef]
  7. Blazejewski, R.; Murat-Blazejewska, S. Soil clogging phenomena in constructed wetlands with subsurface flow. Water Sci. Technol. 1997, 35, 183–188. [Google Scholar] [CrossRef]
  8. Dillon, P.; Pavelic, P.; Massmann, G.; Barry, K.; Correll, R. Enhancement of the membrane filtration index (MFI) method for determining the clogging potential of turbid urban stormwater and reclaimed water used for aquifer storage and recovery. Desalination 2001, 140, 153–165. [Google Scholar] [CrossRef]
  9. Dechesne, M.; Barraud, S.; Bardin, J.P. Indicators for hydraulic and pollution retention assessment of stormwater infiltration basins. J. Environ. Manag. 2004, 71, 371–380. [Google Scholar] [CrossRef]
  10. Yong, C.F.; Mccarthy, D.T.; Deletic, A. Predicting physical clogging of porous and permeable pavements. J. Hydrol. 2013, 481, 48–55. [Google Scholar] [CrossRef]
  11. AI-Isawi, R.; Scholz, M.; Wang, Y.; Sani, A. Clogging of vertical-flow constructed wetlands treating urban wastewater contaminated with a diesel spill. Environ. Sci. Pollut. Res. 2015, 22, 12779–12803. [Google Scholar] [CrossRef] [PubMed]
  12. Yang, M.Y.; Lu, M.Z.; Bian, H.F. Effects of clogging on hydraulic behavior in a vertical-flow constructed wetland system: A modelling approach. Ecol. Eng. 2017, 109, 41–47. [Google Scholar] [CrossRef]
  13. Siriwardene, N.; Deletic, A.; Fletcher, T.D. Clogging of stormwater gravel infiltration systems and filters: Insights from a laboratory study. Water Res. 2007, 41, 1433–1440. [Google Scholar] [CrossRef] [PubMed]
  14. Bouwer, H. Artificial recharge of groundwater: Hydrogeology and engineering. Hydrogeol. J. 2002, 10, 121–142. [Google Scholar] [CrossRef]
  15. Siriwardene, N.R.; Deletic, A.; Fletcher, T.D. Modeling of sediment transport through stormwater gravel filters over their lifespan. Environ. Sci. Technol. 2007, 41, 8099–8103. [Google Scholar] [CrossRef] [PubMed]
  16. Schubert, J. Hydraulic aspects of riverbank filtration-field studies. J. Hydrol. 2002, 266, 145–161. [Google Scholar] [CrossRef]
  17. Mays, C.M.; Hunt, J.R. Hydrodynamic aspects of particle clogging in porous media. Environ. Sci. Technol. 2005, 39, 577–584. [Google Scholar] [CrossRef]
  18. Mays, D.C. Contrasting clogging in granular media filters, soils, and dead-end membranes. J. Environ. Eng. 2010, 136, 475–480. [Google Scholar] [CrossRef]
  19. Knowles, P.; Dotro, G.; Nivala, J.; García, J. Clogging in subsurface-flow treatment wetlands: Occurrence and contributing factors. Ecol. Eng. 2011, 37, 99–112. [Google Scholar] [CrossRef]
  20. Ahfir, N.D.; Hammadi, A.; Alem, A.; Wang, H.Q.; Bras, G.L.; Ouahbi, T. Porous media grain size distribution and hydrodynamic forces effects on transport and deposition of suspended particles. J. Environ. Sci.-China 2017, 53, 161–172. [Google Scholar] [CrossRef]
  21. Zamani, A.; Maini, B. Flow of dispersed particles through porous media-Deep bed filtration. J. Pet. Sci. Eng. 2009, 69, 71–88. [Google Scholar] [CrossRef]
  22. Le Coustumer, S.; Fletcher, T.D.; Deletic, A.; Barraud, S. Hydraulic performance of biofilters for stormwater management: First lessons from both laboratory and field studies. Water Sci. Technol. 2007, 56, 93–100. [Google Scholar] [CrossRef] [PubMed]
  23. Hatt, B.E.; Deletic, A.; Fletcher, T.D. Hydraulic and pollutant removal performance of fine media stormwater filtration systems. Environ. Sci. Technol. 2008, 42, 2535–2541. [Google Scholar] [CrossRef] [PubMed]
  24. Li, H.; Davis, A. Urban particle capture in bioretention media. I: Theory and model development. J. Environ. Eng. 2008, 134, 409–419. [Google Scholar] [CrossRef]
  25. Li, H.; Davis, A. Urban particle capture in bioretention media. II: Theory and model development. J. Environ. Eng. 2008, 134, 419–432. [Google Scholar] [CrossRef]
  26. Herzig, J.; Leclerc, D.; Le, G.P. Flow of suspensions through porous media-application to deep filtration. Ind. Eng. Chem. 1970, 82, 8–35. [Google Scholar] [CrossRef]
  27. Tong, M.; Johnson, W.P. Colloid population heterogeneity drives hyper-exponential deviation from classic filtration theory. Environ. Sci. Technol. 2007, 41, 493–499. [Google Scholar] [CrossRef]
  28. Johnson, W.P.; Anna, R.; Eddy, P.; Markus, H. Why variant colloid transport behaviors emerge among identical individuals in porous media when colloid-surface repulsion exists. Environ. Sci. Technol. 2018, 52, 7230–7239. [Google Scholar] [CrossRef]
  29. Molnar, I.L.; Johnson, W.P.; Gerhard, J.I.; Willson, C.S.; O’Carroll, D.M. Predicting colloid transport through saturated porous media: A critical review. Water Resour. Res. 2015, 51, 6804–6845. [Google Scholar] [CrossRef] [Green Version]
  30. Tufenkji, N.; Elimelech, M. Deviation from the classical colloid filtration theory in the presence of repulsive dlvo interactions. Langmuir 2004, 20, 10818–10828. [Google Scholar] [CrossRef]
  31. Zou, Z.; Shu, L.; Min, X.; Mabedi, E.C. Clogging of Infiltration Basin and Its Impact on Suspended Particles Transport in Unconfined Sand Aquifer: Insights from a Laboratory Study. Water 2019, 11, 1083. [Google Scholar] [CrossRef]
  32. Chrysikopoulos, C.V.; Sim, Y. One-dimensional virus transport in homogeneous porous media with time-dependent distribution coefficient. J. Hydrol. 1996, 185, 199–219. [Google Scholar] [CrossRef]
  33. Sanya, S.; Arturo, K. Transport of colloids in saturated porous media: A pore-scale observation of the size exclusion effect and colloid acceleration. Water Resour. Res. 2003, 39, 1255–1256. [Google Scholar]
  34. Bradford, S.A.; Leij, F.J. Modeling the transport and retention of polydispersed colloidal suspensions in porous media. Chem. Eng. Sci. 2018, 192, 972–980. [Google Scholar] [CrossRef]
  35. Ma, E.; Ouahbi, T.; Wang, H.; Ahfir, N.D.; Alem, A.; Hammadi, A. Modeling of the transport and deposition of polydispersed particles: Effects of hydrodynamics and spatiotemporal evolution of the deposition rate. Environ. Pollut. 2017, 237, 1011–1022. [Google Scholar] [CrossRef] [PubMed]
  36. Ma, E.; Ouahbi, T.; Wang, H.; Ahfir, N.D.; Alem, A.; Hammadi, A. Modeling of retention and re-entrainment of mono- and poly-disperse particles: Effects of hydrodynamics, particle size and interplay of different-sized particles retention. Sci. Total Environ. 2017, 596–597, 222–229. [Google Scholar] [CrossRef]
  37. Kandra, H.S.; Asce, S.M.; Callaghan, J.; Deletic, A.; Mccarthy, D.T. Biological clogging in storm water filters. J. Environ. Eng. 2015, 141, 1–8. [Google Scholar] [CrossRef]
  38. Rink-Pfeiffer, S.; Ragusa, S.; Sztajnbox, P.; Vandevelde, T. Interrelationships between biological, chemical, and physical processes as an analog to clogging in aquifer storage and recovery (ASR) wells. Water Res. 2000, 34, 2110–2118. [Google Scholar] [CrossRef]
  39. Nogaro, G.; Datry, T.; Mermillod-Blondin, F.; Descloux, S.; Montuelle, B. Influence of streambed sediment clogging on microbial processes in the hyporheic zone. Freshw. Biol. 2010, 55, 1288–1302. [Google Scholar] [CrossRef]
  40. Min, X.; Shu, L.; Li, W.; Appiah-Adjei, E.K. Influence of particle distribution on filter coefficient in the initial stage of filtration. Korean J. Chem. Eng. 2013, 30, 456–464. [Google Scholar] [CrossRef]
  41. Bratieres, K.; Schang, C.; Deletic, A.; Mccarthy, D.T. Performance of enviss™ stormwater filters: Results of a laboratory trial. Water Sci. Technol. 2012, 66, 719–727. [Google Scholar] [CrossRef] [PubMed]
  42. Duncan, H.P. Urban Stormwater Quality: A Statistical Overview; Co-operative Research Centre for Catchment Hydrology, Report 99/3; Co-Operative Research Centre for Catchment Hydrology: Melbourne, Australia, 1999. [Google Scholar]
  43. Alem, A.; Elkawafi, A.; Ahfir, N.D.; Wang, H.Q. Filtration of kaolinite particles in a saturated porous medium: Hydrodynamic effects. Hydrogeol. J. 2013, 21, 573–586. [Google Scholar] [CrossRef]
  44. Iwasaki, T. Some notes on sand filtration. J. Am. Water Works Assoc. 1937, 29, 1591–1602. [Google Scholar] [CrossRef]
  45. Mcdowell-Boyer, L.M.; Hunt, J.R.; Sitar, N. Particle transport through porous media. Water Resour. Res. 1986, 22, 1901–1921. [Google Scholar] [CrossRef]
  46. Tien, C.; Payatakes, A.C. Advances in deep bed filtration. AIChE J. 1979, 25, 737–759. [Google Scholar] [CrossRef]
  47. Mints, D.M.; Paskutskaya, L.N.; Chernova, Z.V. On the mechanism of the filtration process on rapid water treatment filters. Zh. Priklad. Khim. 1967, 8, 1695–1700. [Google Scholar]
  48. Kuhnen, F.; Barmettler, K.; Bhattacharjee, S.; Elimelech, M.; Kretzschmar, R. Transport of iron oxide colloids in packed quartz sand media: Monolayer and multilayer deposition. J. Colloid Interface Sci. 2000, 231, 32–41. [Google Scholar] [CrossRef] [PubMed]
  49. Gitis, V.; Rubinstein, I.; Livshits, M.; Ziskind, G. Deep-bed filtration model with multistage deposition kinetics. Chem. Eng. J. 2010, 163, 78–85. [Google Scholar] [CrossRef]
  50. Altoé, F.J.; Bedrikovetsky, P.; Siqueira, A.G.; De Souza, A.L.S.; Shecaira, F.S. Correction of basic equations for deep bed filtration with dispersion. J. Pet. Sci. Eng. 2006, 51, 68–84. [Google Scholar] [CrossRef] [Green Version]
  51. Horner, R.M.W.; Jarvis, R.J.; Mackie, R.I. Deep bed filtration: A new look at the basic equations. Water Res. 1986, 20, 215–220. [Google Scholar] [CrossRef]
  52. Vigneswaran, S.; Prasanthi, H.; Dharmappa, H.B. Implication of particle size to transient stage of deep bed infiltration. J. Chem. Eng. 1996, 13, 565–572. [Google Scholar]
  53. Shapiro, A.A.; Bedrikovetsky, P.G.; Santos, A.; Medvedev, O.O. A stochastic model for filtration of particulate suspensions with incomplete pore plugging. Transp. Porous Med. 2007, 67, 135–164. [Google Scholar] [CrossRef]
  54. Sharma, M.M.; Yortsos, Y.C. A network model for deep bed filtration processes. AIChE J. 2016, 33, 1644–1653. [Google Scholar] [CrossRef]
  55. Ahfir, N.D.; Benamar, A.; Alem, A.; Wang, H.Q. Influence of internal structure and medium length on transport and deposition of suspended particles: A laboratory study. Transp. Porous Med. 2009, 76, 289–307. [Google Scholar] [CrossRef]
  56. Foppen, J.W.A.; Mporokoso, A.; Schijven, J.F. Determining straining of Escherichia coli from breakthrough curves. J. Contam. Hydrol. 2005, 76, 191–210. [Google Scholar] [CrossRef]
  57. Alem, A.; Ahfir, N.D.; Elkawafi, A.; Wang, H.Q. Hydraulic operating conditions and particle concentration effects on physical clogging of a porous medium. Transp. Porous Med. 2015, 106, 303–321. [Google Scholar] [CrossRef]
  58. Xu, S.; Gao, B.; Saiers, J.E. Straining of colloidal particles in saturated porous media. Water Resour. Res. 2006, 42, 1–10. [Google Scholar] [CrossRef]
  59. Sun, Y.; Gao, B.; Bradford, S.A.; Wu, L.; Chen, H.; Shi, X.; Wu, J. Transport, retention, and size perturbation of graphene oxide in saturated porous media: Effects of input concentration and grain size. Water Res. 2015, 68, 24–33. [Google Scholar] [CrossRef] [PubMed]
  60. Bradford, S.A.; Simunek, J.; Bettahar, M.; Van Genuchten, M.T.; Yates, S.R. Modeling colloid attachment, straining, and exclusion in saturated porous media. Environ. Sci. Technol. 2003, 37, 2242–2250. [Google Scholar] [CrossRef]
  61. Messina, F.; Marchisio, D.L.; Sethi, R. An extended and total flux normalized correlation equation for predicting single-collector efficiency. J. Colloid Interface Sci. 2015, 446, 185–193. [Google Scholar] [CrossRef] [Green Version]
  62. Johnson, W.P.; Pazmino, E.; Ma, H. Direct observations of colloid retention in granular media in the presence of energy barriers, and implications for inferred mechanisms from indirect observations. Water Res. 2010, 44, 1158–1169. [Google Scholar] [CrossRef] [PubMed]
Figure 1. Schematic representation of the experimental apparatus (Modified from Min et al, [40]).
Water 11 01885 g001
Figure 2. Correlation between turbidity and concentration. The mean concentration of five measurements was presented, with the 95% confidence interval.
Water 11 01885 g002
Figure 3. Variation of particle size distribution (PSD) at different depths of filter medium.
Water 11 01885 g003
Figure 4. Particle mass density of influent. Particle mass density is the proportion of the SP divided by adjacent particle spacing dx. The sum of Q(x) dx is 1.
Water 11 01885 g004
Figure 5. Specific surface area and Lc of curve fitting.
Water 11 01885 g005
Figure 6. Variation of capture probability P(d) with particle sizes.
Water 11 01885 g006
Figure 7. Observed breakthrough curves (BTCs) of the suspended particles (symbols), plotted with simulated BTCs as function of the number of pore volumes (NVp) for different initial injected concentrations. Vp is the pore volume equal to the product of the sand column volume and the porous medium porosity.
Water 11 01885 g007
Figure 8. Observed and simulated retention profiles along the length of the porous medium for the range of SP concentrations examined. Simulations with distance-dependent filter coefficient (solid line) are contrasted against those with constant deposition rate (dashed line).
Water 11 01885 g008
Figure 9. Evolutions of the accumulated retention for a typical SP concentration (C = 200 mg/L), simulated by the conventional model (a) and the modified model (b), respectively.
Water 11 01885 g009
Figure 10. Formation of the clogging layer on the surface due to straining.
Water 11 01885 g010
Figure 11. Evolutions of the filter coefficients: at the end of each injection for different SP concentrations (a); and at different experimental periods (number of pore volumes injected) for a typical SP concentration (C = 200 mg/L) simulated by the modified model (b).
Water 11 01885 g011aWater 11 01885 g011b
Figure 12. Spatial and temporal distribution of the filter coefficient λ for a typical SP concentration (C = 200 mg/L), simulated by the conventional model (a) and the modified model (b), respectively.
Water 11 01885 g012
Figure 13. Normalized permeability K0/K evolution as a function of the average retention for different SP concentrations (a); Simulations of the overall permeability decline using the Kozeny-Carman model (b).
Water 11 01885 g013
Figure 14. Characterization of the particle-size distribution (PSD) of the retained SP in different sections for the concentration of 200 mg/L.
Water 11 01885 g014
Table 1. Mass balances of injected suspended particles (SP): the mass percentages of SP recovered in the outlet (Meff); deposited mass percentages in each section; overall deposited mass percentages (the sum of the ten sections) (Mp); and the total (Mtot = Mp + Meff), for the five tested concentrations.
C0 (mg/L)Mass Deposited in Each Section (%)Mp (%)Meff (%)Mtot (%)
12345678910
10016.1013.458.997.015.915.184.634.183.813.4972.7532.74105.49
15015.339.516.394.974.183.663.272.962.702.4755.4442.2097.64
20014.588.695.894.573.833.353.002.712.472.2751.3651.32102.68
25013.858.335.714.423.703.232.892.612.392.1949.3256.26105.58
30013.146.804.733.653.052.662.382.151.971.8142.3459.79102.13

