A Study on the Improvement of Flood Forecasting Techniques in Urban Areas by Considering Rainfall Intensity and Duration


1
Department of Civil and Environmental Engineering, Pusan National University, Busan 46241, Korea
2
Department of Civil Engineering, Dongseo University, Busan 47011, Korea
3
Department of Land, Water and Environment Research, Korea Institute of Civil Engineering and Building Technology, Gyeonggi-do 10223, Korea
4
School of Civil Engineering, Chungbuk National University, Cheongju 28644, Korea
*
Author to whom correspondence should be addressed.
Water 2019, 11(9), 1883; https://doi.org/10.3390/w11091883
Submission received: 4 August 2019
/
Revised: 2 September 2019
/
Accepted: 6 September 2019
/
Published: 10 September 2019
(This article belongs to the Special Issue Recent Advances and New Directions in Flood Forecasting, Modeling, and Mapping)
Abstract
:Frequent localized torrential rains, excessive population density in urban areas, and increased impervious areas have led to massive flood damage that has been causing overloading of drainage systems (watersheds, reservoirs, drainage pump sites, etc.). Flood concerns are raised around the world in the events of rain. Flood forecasting, a typical nonstructural measure, was developed to help prevent repetitive flood damage. However, it is difficult to apply flood prediction techniques using training processes because training needs to be applied at every usage. Other techniques that use predicted rainfall data are also not appropriate for small watershed, such as single drainage area. Thus, in this paper, a flood prediction method is proposed by improving four criteria (50% water level, 70% water level, 100% water level, and first flooding of water pipes) in an attempt to reduce flooding in urban areas. The four criteria nodes are generated using a rainfall runoff simulation with synthetic rainfall at various durations. When applying real-time rainfall data, these nodes have the advantage of simple application. The improved flood nomograph made in this way is expected to help predict and prepare for rainstorms that can potentially cause flood damage.
1. Introduction
Recent developments in global industrialization have led to a substantial increase in carbon emissions, which have driven global climate change. The average global temperature has been rising since the 1980s, and this has been accompanied by rising sea levels, changing agricultural ecosystems, and the frequent occurrence of increasingly intense natural disasters such as floods, droughts, typhoons, and localized downpours. As a result, the hydrological aspects of urban basins have changed, and the number of flood areas has increased due to the expansion of buildings and road pavement, which has increased the amount of runoff that drains into rivers and streams [1]. This phenomenon can be attributed to frequent torrential rains during monsoons and after the wet season caused by climate change, high population density, and low-lying development and low gradients in urban areas [2,3].
New approaches to preparing for or preventing floods have been used with various flood forecasting models in non-structural measures. For example, one real-time flood prediction technique was proposed to be applied to three basins in the UK [4]. In addition, a real-time flood prediction method using digital elevation data with a distributed model was developed [5], as was a method involving the comparison of real-time flood forecasting using short-term rainfall forecasting models [6]. Further, Jasper et al. used surface observation data obtained from radars and predicted data from numerical weather prediction models [7]. Another study applied real-time flood forecasting in river systems using a modified stochastic Kalman filter algorithm [8]. Finally, one study developed ensemble Kalman filtering updated by soil moisture in real-time flood forecasting [9]. In these previous studies, it was difficult to apply hydrologic data for small drainage areas in urban watersheds because of long-term gaps in the data. Detailed analysis is ideal but difficult to apply to real-time forecasting because the hydrologic analysis required for flood prediction using the rainfall effluent model takes a substantial amount of time.
A variety of other approaches have also been introduced in previous studies, including ingredients-based methodologies and machine learning, neural networks, and distributed hydrological modeling. In one such study, flood prediction involving ingredients-based forecasting using the basic component concept was applied with a neural network [10]. A neural network-based flood forecasting technique was proposed using five-hour forecast data in another study [11]. Quantitative flood prediction through a neural network using multi-sensory data in a basin has also been proposed [12]. A combined training method for the Huai River in China was developed using a neural network and machine learning techniques [13]. A flood prediction technique using a genetic algorithm and fuzzy inference systems along with a neural network has also been used for the Yangtze River in China [14]. Another study considered the condition of flash flood forecasting in an attempt to improve such forecasting [15]. Approaches involving neural networks are time-consuming and require complex application and training to apply to flood forecasting techniques.
A number of methods have been proposed for flood prediction over the last few years. For example, large-scale operational flood prediction systems were developed using ensemble forecasting systems [16]. In addition, particle swarm optimization and initial state variable correction were used to predict floods in Southern China [17]; a large amount of optimization was required due to the complexity of the process. Further, due to the large forecast intervals and application coverage, it is not considered to be suitable for single drainage coverage.
In one study, flood nomographs using synthetic rainfalls were analyzed with a rainfall runoff simulation to calculate the first flooding nodes [18]. This flood forecasting technique used a regression curve applied in urban drainage coverage. Then, another study developed a multi-dimensional analysis method using flood damage for flood forecasting [19]. In this method, by calculating flood damage and volumes, the damage function was estimated from each subarea that was divided from a target drainage area. This damage function estimates the rainfall intensity upon the initial occurrence of flood damage for each subarea and duration. A flood forecasting technique was developed using an ensemble method and a numerical weather forecast model [20]. Another study applied random forest and Poisson regression to urban coastal flood severity in street flooding in Norfolk, Virginia, USA [21].
In each of these previous methods, long-term interval rainfall was used. This is not suitable for urban areas, particularly not for a single drainage target, which instead requires one-minute scale rainfall data. Because of the various training and optimization techniques involved, these flood forecasting methods are complex [11,12,13,14,17]. In addition, these previous flood forecasting techniques were proposed for rivers and large watersheds. In other words, the processes involved in using such techniques for large-scale basins are complex. Since the time of water concentration in small urban areas is typically under one hour, previous flood forecasting techniques are not appropriate.
Due to heavy rains in the localities, the reliability and utilization of existing alarm systems used by local governments and agencies is reduced, so it is difficult to detect and warn immediately of flooding in cities with current systems. A flood forecasting technique called a flood nomograph was used to predict urban inundation [18]. A flood nomograph is generated from rainfall runoff simulation results using synthetic rainfall data. For verification, the results of applying historical rainfall events to the flood nomograph were analyzed. Then, four criteria were established and applied: Warning (pipe 50% filled), alert (pipe 70% filled), danger (pipe 100% filled), and first flooding (pipe overflow). Then, an improved flood nomograph was built to predict urban flooding. This improved flood nomograph was designed to evaluate the applicability of the system of water immersion in urban areas with SWMM 5.0 (Environmental Protection Agency, Washington, DC, USA) [22].
2. Methodology
2.1. Outline
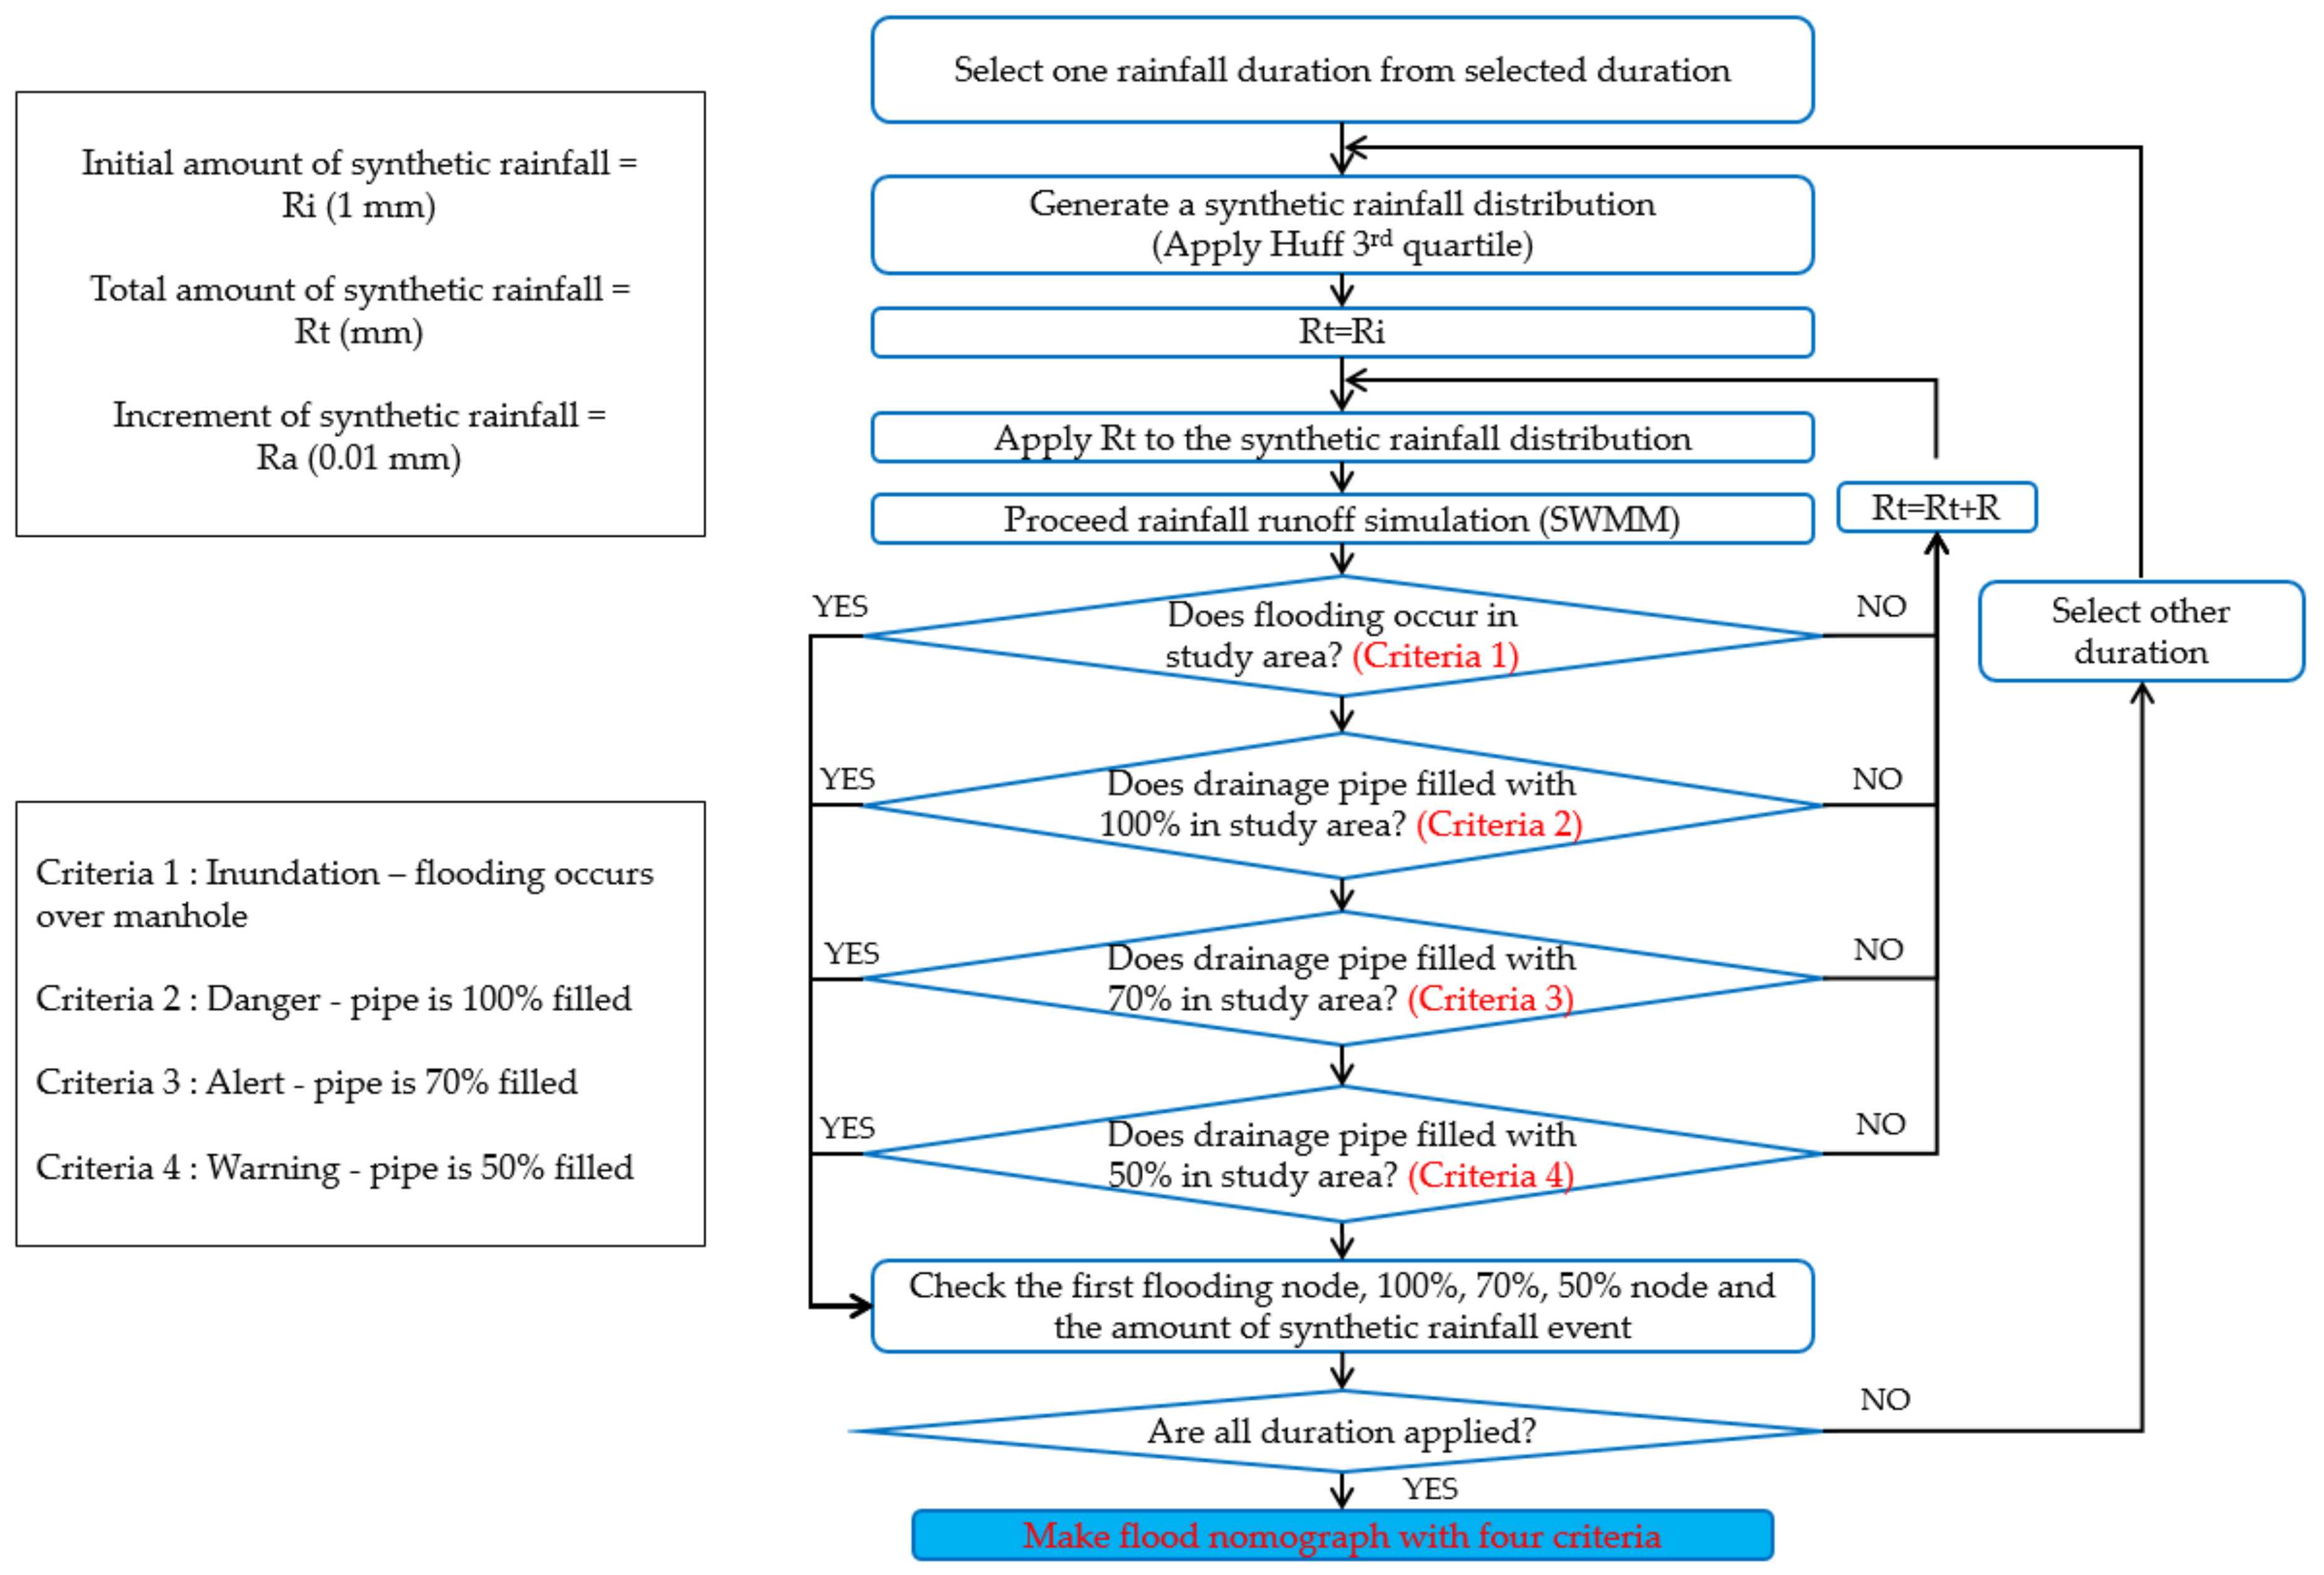
The threshold for flooding is called flood nomograph [18]. A flood nomograph is generated by applying various duration and frequencies using synthetic rainfall events [18]. The synthetic rainfall is used as the input value for rainfall runoff simulation. This is important for creating improved flood nomographs. Artificially generated synthetic rainfall values are used with a selected rainfall distribution. Until flooding occurs, an initial rainfall value of 1 mm is applied with an increment of 0.1 mm. For example, simulate rainfall runoff model starting with 1 mm rainfall. If flooding does not occur, then simulate it with 1.1 mm rainfall. Increase rainfall by 0.1 mm until flooding occurs for various duration. Then, the duration and amount of each rainfall are recorded when four criteria (50%, 70%, 100% filled nodes, and flooding node) nodes are satisfied. Next, the rainfall values of these four criteria nodes are converted to rainfall intensities. The four criteria intensities of rainfall should then be checked to generate the regression equation in a graph. The improved flood nomograph is represented by the marginal lines in the regression equation. Four criteria are established for the improved flood nomograph: 50%, 70%, 100%, and first flooding. The following steps are the process used in this study.
- 1.
- Generate synthetic rainfall.
- 2.
- Set 1 mm of initial rainfall in the rainfall runoff simulation.
- 3.
- Run rainfall runoff simulation with increments of 0.1 mm rainfall.
- 4.
- Run rainfall runoff simulations until 5-1, 5-2, 5-3, and 5-4 are satisfied.
- 5-1.
- Obtain first flooding node: Check the amount for each duration.
- 5-2.
- Obtain 100% filled pipe node: Check the amount for each duration.
- 5-3.
- Obtain 70% filled pipe node: Check the amount for each duration.
- 5-4.
- Obtain 50% filled pipe node: Check the amount for each duration.
- 6.
- Check the rainfall amount for each duration for steps 5-1, 5-2, 5-3, and 5-4.
- 7.
- Repeat steps 1 to 6 for various rainfall durations.
- 8.
- Convert four criteria rainfall amounts to rainfall intensities.
- 9.
- Express four criteria rainfall intensities in a graph.
- 10.
- Generate a regression equation to a regression curve for the four criteria rainfall intensities.
- 11.
- Obtain the four regression curves from the marginal lines of the improved flood nomograph.
- 12.
- Establish the four types (50%, 70%, 100%, and first flooding) of flood nomographs.
- 13.
- Check the improved flood nomograph with historical rainfall in the target area.
- 14.
- Discuss the results of the improved flood nomograph applied with historical rainfall.
- 15.
- Check the improved flood nomograph with the pump station design frequency in the target area.
- 16.
- Discuss the results of the improved flood nomograph applied with pump station design frequency.
2.2. Synthetic Rainfall Data for Improved Flood Nomograph
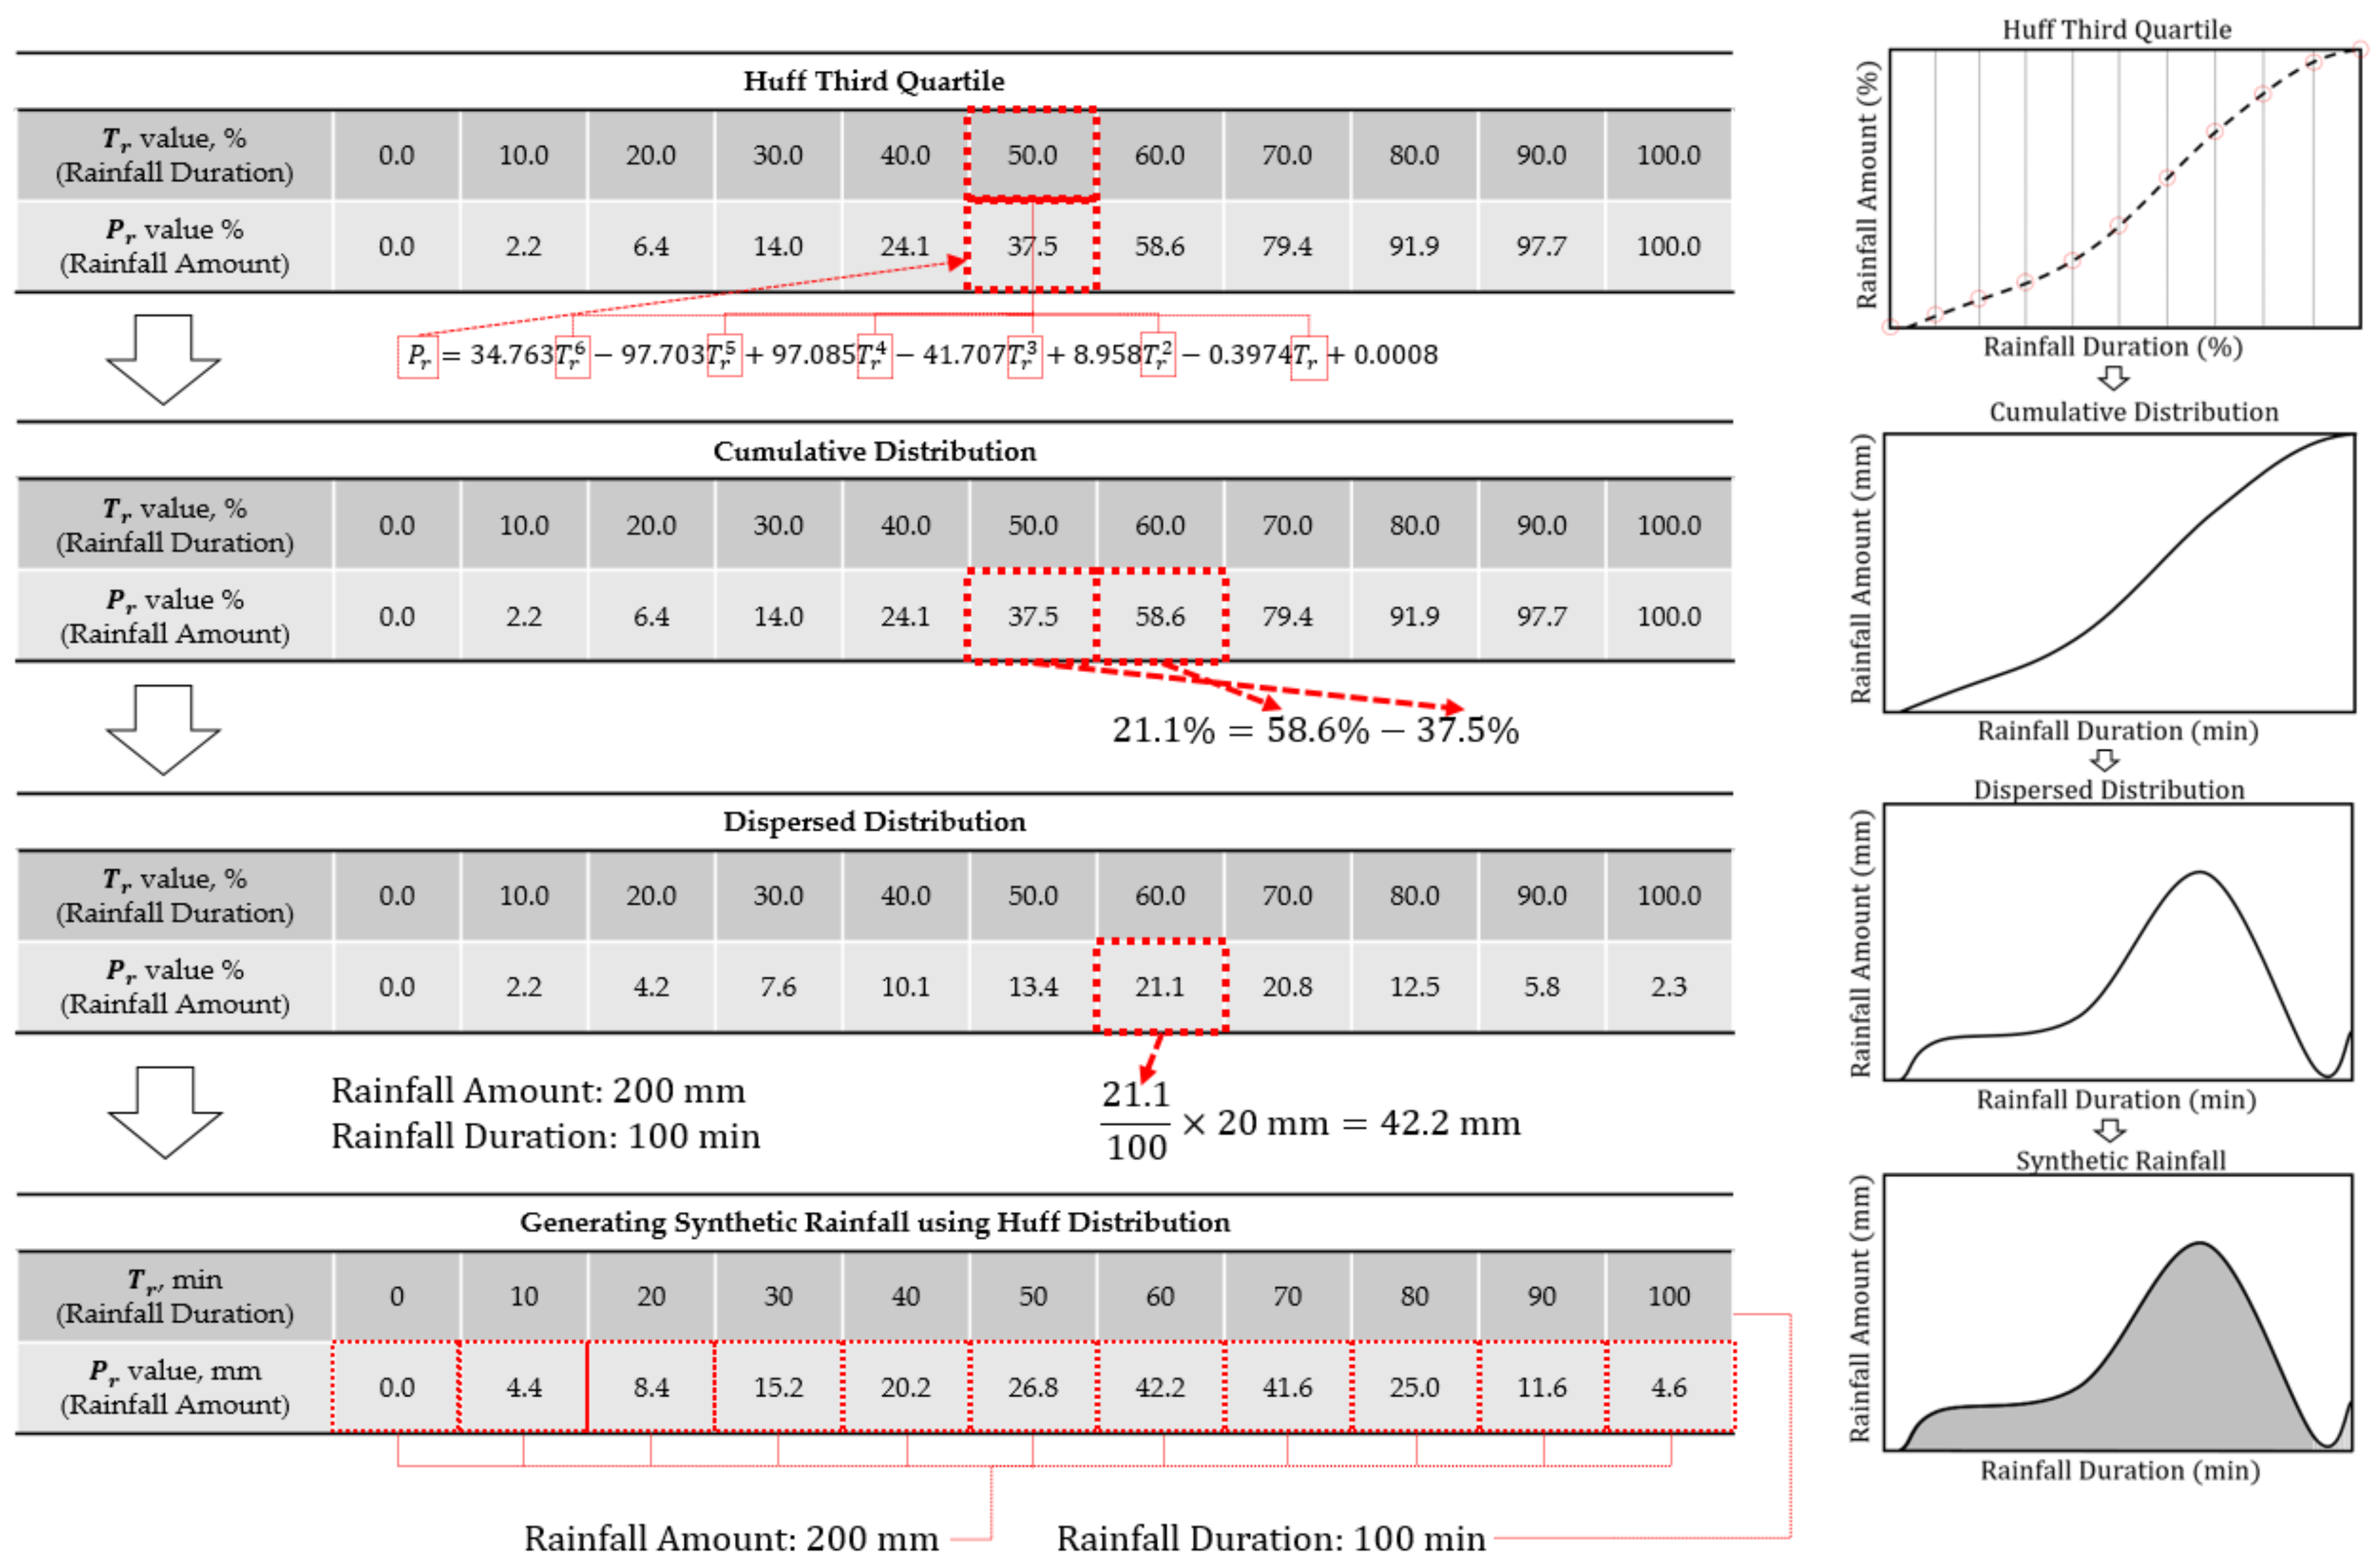
The improved flood nomograph is obtained with synthetic rainfall data using a rainfall runoff simulation. Most urban drainage facilities in Korea are designed with a Huff distribution [23]. Therefore, the Huff distribution is applied in this study. Rainfall scenarios were formed by applying a Huff third quartile rainfall distribution, which has a very similar shape to the distribution of domestic rainfall. Huff examines which section of the maximum amount of rainfall by duration occurs with four quartiles. The Huff third quartile distribution is similar to the rainfall distribution in Korea [24]. The Huff first, second, third, and fourth quartile distributions are respectively shown in Equations (1)–(4) [25].
(here, : Ratio of cumulative rainfall, and : Ratio of cumulative time)
Based on the regression equations shown above, each Huff distribution is first generated with a cumulative distribution. Then, the dispersed distribution is converted from the cumulative distribution. Finally, the synthetic rainfall event is obtained by applying the amount of rainfall to the dispersed distribution [26,27,28,29,30]. The cumulative distribution is used for the Huff distribution as a type of regression equation. The process used to generate the synthetic rainfall data is shown in Figure 1.
The four criteria nodes are selected based on a rainfall runoff simulation using Huff distributed synthetic rainfall data. The synthetic rainfall distribution is selected according to the specific urban drainage design systems used in the study area. However, if the urban drainage systems are designed using specific rainfall distribution in the target watershed, that distribution must be used. Therefore, the improved flood nomograph should use the same rainfall distribution as well.
At each duration, the synthetic rainfall is distributed from 1 mm in increments of 0.1 mm for the four criteria nodes. The Huff third quartile distribution, which has the same distribution as the design of the target area, is applied. It should be noted that the distribution of actual rainfall data may differ from the distribution of synthetic rainfall data used in this study. Because it is difficult to consider all types of rainfall in both the flood prediction and the design, the amount of rainfall used for flood prediction by the improved flood nomograph was consistent with the amount of rainfall used in the drainage network design.
2.3. Selecting Criteria Nodes for Improved Flood Nomograph
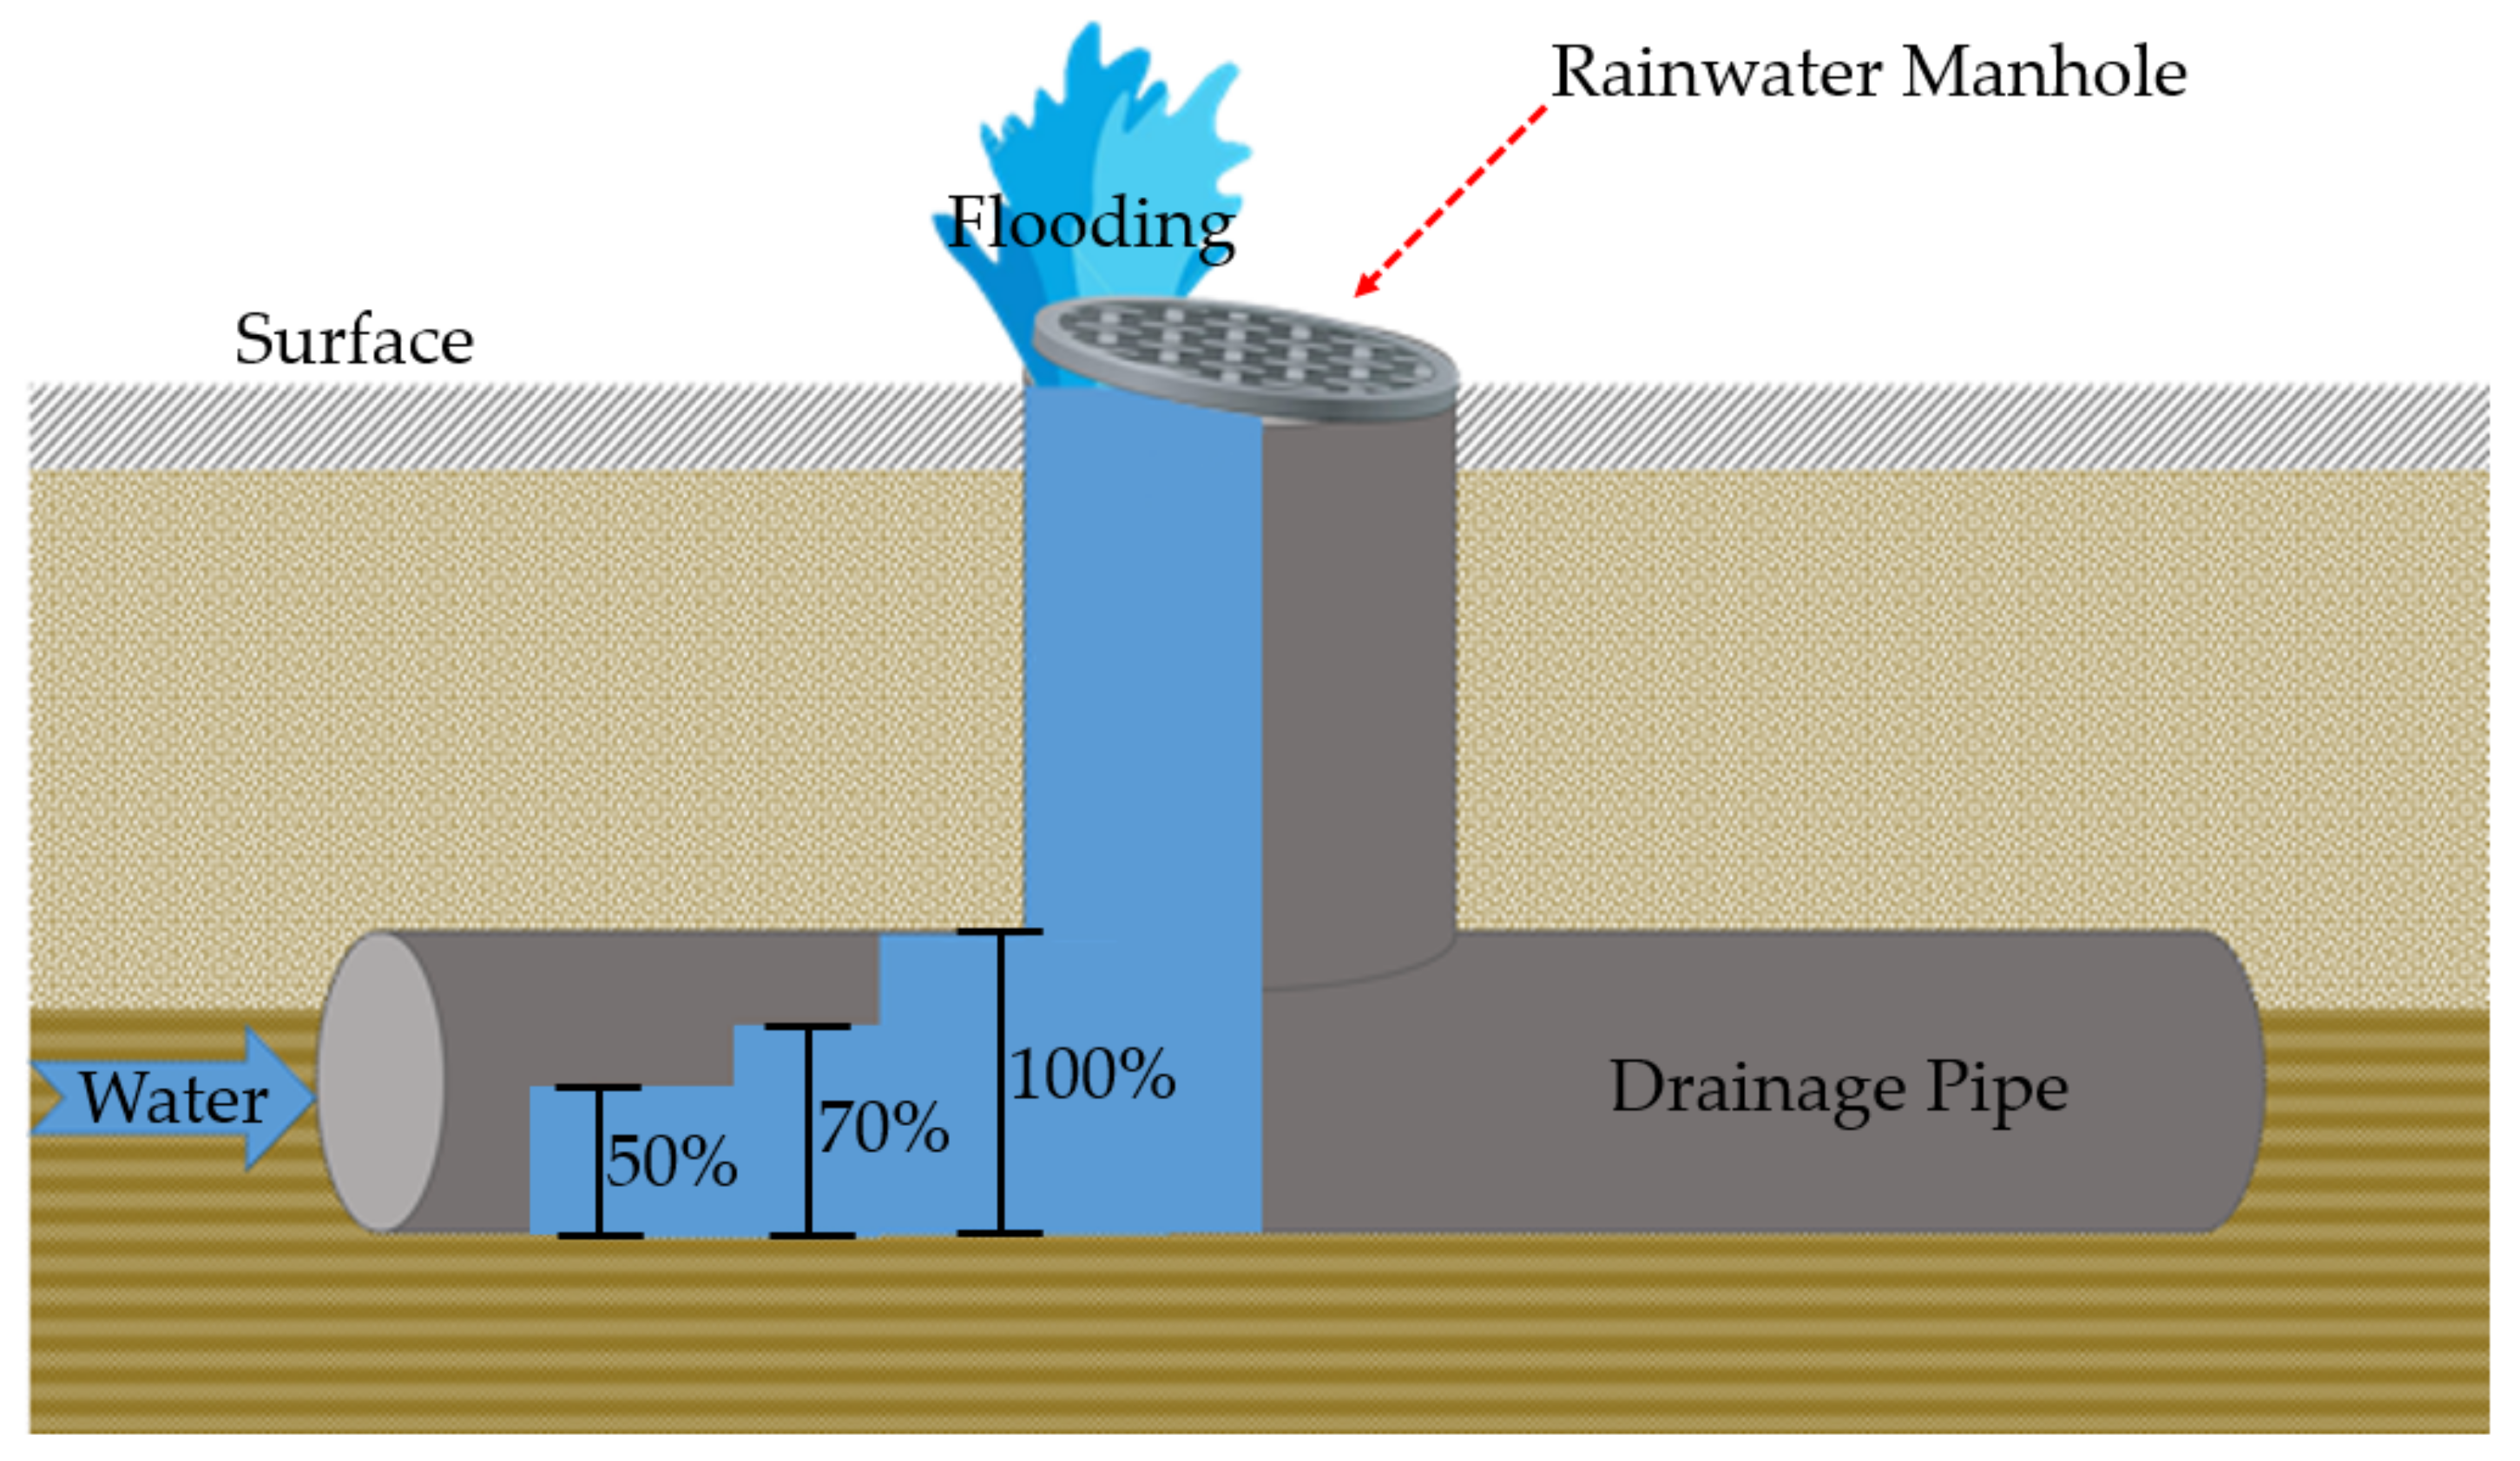
In this study, there are four criteria nodes in the improved flood nomograph. The scenarios were prepared for urban inundation by subdividing rainfall according to the degree to which rainfall can reach the highest level based on the rainwater manhole radius as well as the drainage pipe radius. Figure 2 shows a schematic of the four criteria used for the improved flood nomograph.
The monitoring node for the operation of drainage facilities was selected as the first flooding node in the urban drainage system [26,27,28,30]. If the monitoring node level is high, the decentralized reservoir at the top of the drainage network reserves the inflow from the drainage network; otherwise, the inflow is released. For a centralized reservoir at the downstream of the drainage network, if the monitoring node level is high, the drainage pump is operated early; otherwise, the drainage pump is operated normally.
When searching for the first flooding node in the rainfall runoff simulation, the initial rainfall value is 1 mm, which then increases in units of 0.1 mm until the first flooding occurs; at this time, the first flooding node and amount are checked. Many of the first flooding node rainfall intensities are converted from rainfall data. These rainfall intensities are then used to construct the flood nomograph, which is also the marginal point for flood prediction. This is the first flooding criterion of the four criteria.
The other three criteria involve drainage pipe levels. The scenarios were prepared for urban inundation by subdividing rainfall according to the degree to which rainfall can reach the highest level based on the rainwater manhole radius as well as the drainage pipe radius. In general, flood warnings are issued when the level at the point where the flood warning is issued is expected to continue to rise and exceed the boundary flood level; at this time, the level of the flood alert is embankment and floodgate. The level that requires a boundary for structures such as bridges is defined as the level at which a flow rate equivalent to 50/100 of the planned flood reaches the level when flowing, or once every two or three years [31]. In this study, 50% of the landscape was filled with water following the onset of rainfall by applying this to rainwater management as the criterion for a water immersion warning. Therefore, each point was obtained to calculate the rainfall that reached up to 50% of the pipe in the aforementioned synthetic rainfall, and then the rainwater was connected to draw up a flood nomograph. This was the warning criteria.
An alert is issued when the level at the point where the flood warning is issued is expected to continue to rise and eventually exceed the level of a hazardous flood; hazardous flood levels are embankment and floodgate. The level at which the risk of collapse of structures such as bridges is expected is the level at which a flow rate equivalent to 70/100 of the planned flood reaches the level when flowing, or once every five to 10 years [28]. In this study, 70% of the landscape after the onset of rain was set as the basis to warn of flooding. Therefore, each point was obtained to calculate the rainfall that reached up to 70% of the pipe in the aforementioned synthetic rainfall, and then the rainwater was connected to draw up a flood nomograph. This was the alert criteria.
Along with warnings and alerts, the danger level is required to secure the final preparation time before flooding occurs. Since flooding typically occurs from backflows in the rainwater manholes at each of the major points, the danger level was allowed to secure a sufficient amount of time for rain to rise up to the rainwater manholes on the ground after the pipe was full. Therefore, we prepared a nomograph for the danger stage of flooding by calculating the rainfall that does not occur during the rainfall scenario but causes severe conditions in all areas. Figure 3 shows a flow diagram illustrating the creation of the improved flood nomographs with the four criteria.
The synthetic rainfall used in the drainage network design is applied to the improved flood nomograph. There are a few steps involved in selecting the four criteria nodes. Among various rainfall durations, one duration should be chosen for the selection of the four criteria nodes. Synthetic rainfall distributions are generated by the Huff third quartile distribution. If the rainfall distributions differ, appropriate additional information related to the drainage network is necessary. The total initial synthetic rainfall amount is 1 mm. The synthetic rainfall distribution is distributed with this total amount of synthetic rainfall. Regardless of whether flooding occurs, the flooding occurrence and drainage pipe water levels are examined through rainfall runoff simulations. If there is flooding, the first flooding node, drainage pipe water level, and total rainfall amount are checked. By contrast, if there is no flooding, the 50%, 70%, and 100% drainage pipe water levels are checked. If the drainage pipe water level is not 50%, 70%, or 100%, the total amount of synthetic rainfall is increased in 0.1 mm increments. This procedure is repeated until the four criteria nodes are satisfied. Then, a different duration is selected, and the above procedure is repeated until all four of the criteria nodes are checked along with the total rainfall amount.
The rainfall values of the four criteria nodes are converted to rainfall intensities to generate improved flood nomographs. The rainfall runoff model should have the ability to display flood volume for all of the nodes used in the improved flood nomographs. Varying the durations increases the flood accuracy for flood forecasting with the results of the four criteria nodes.
2.4. Concept of Improved Flood Nomograph
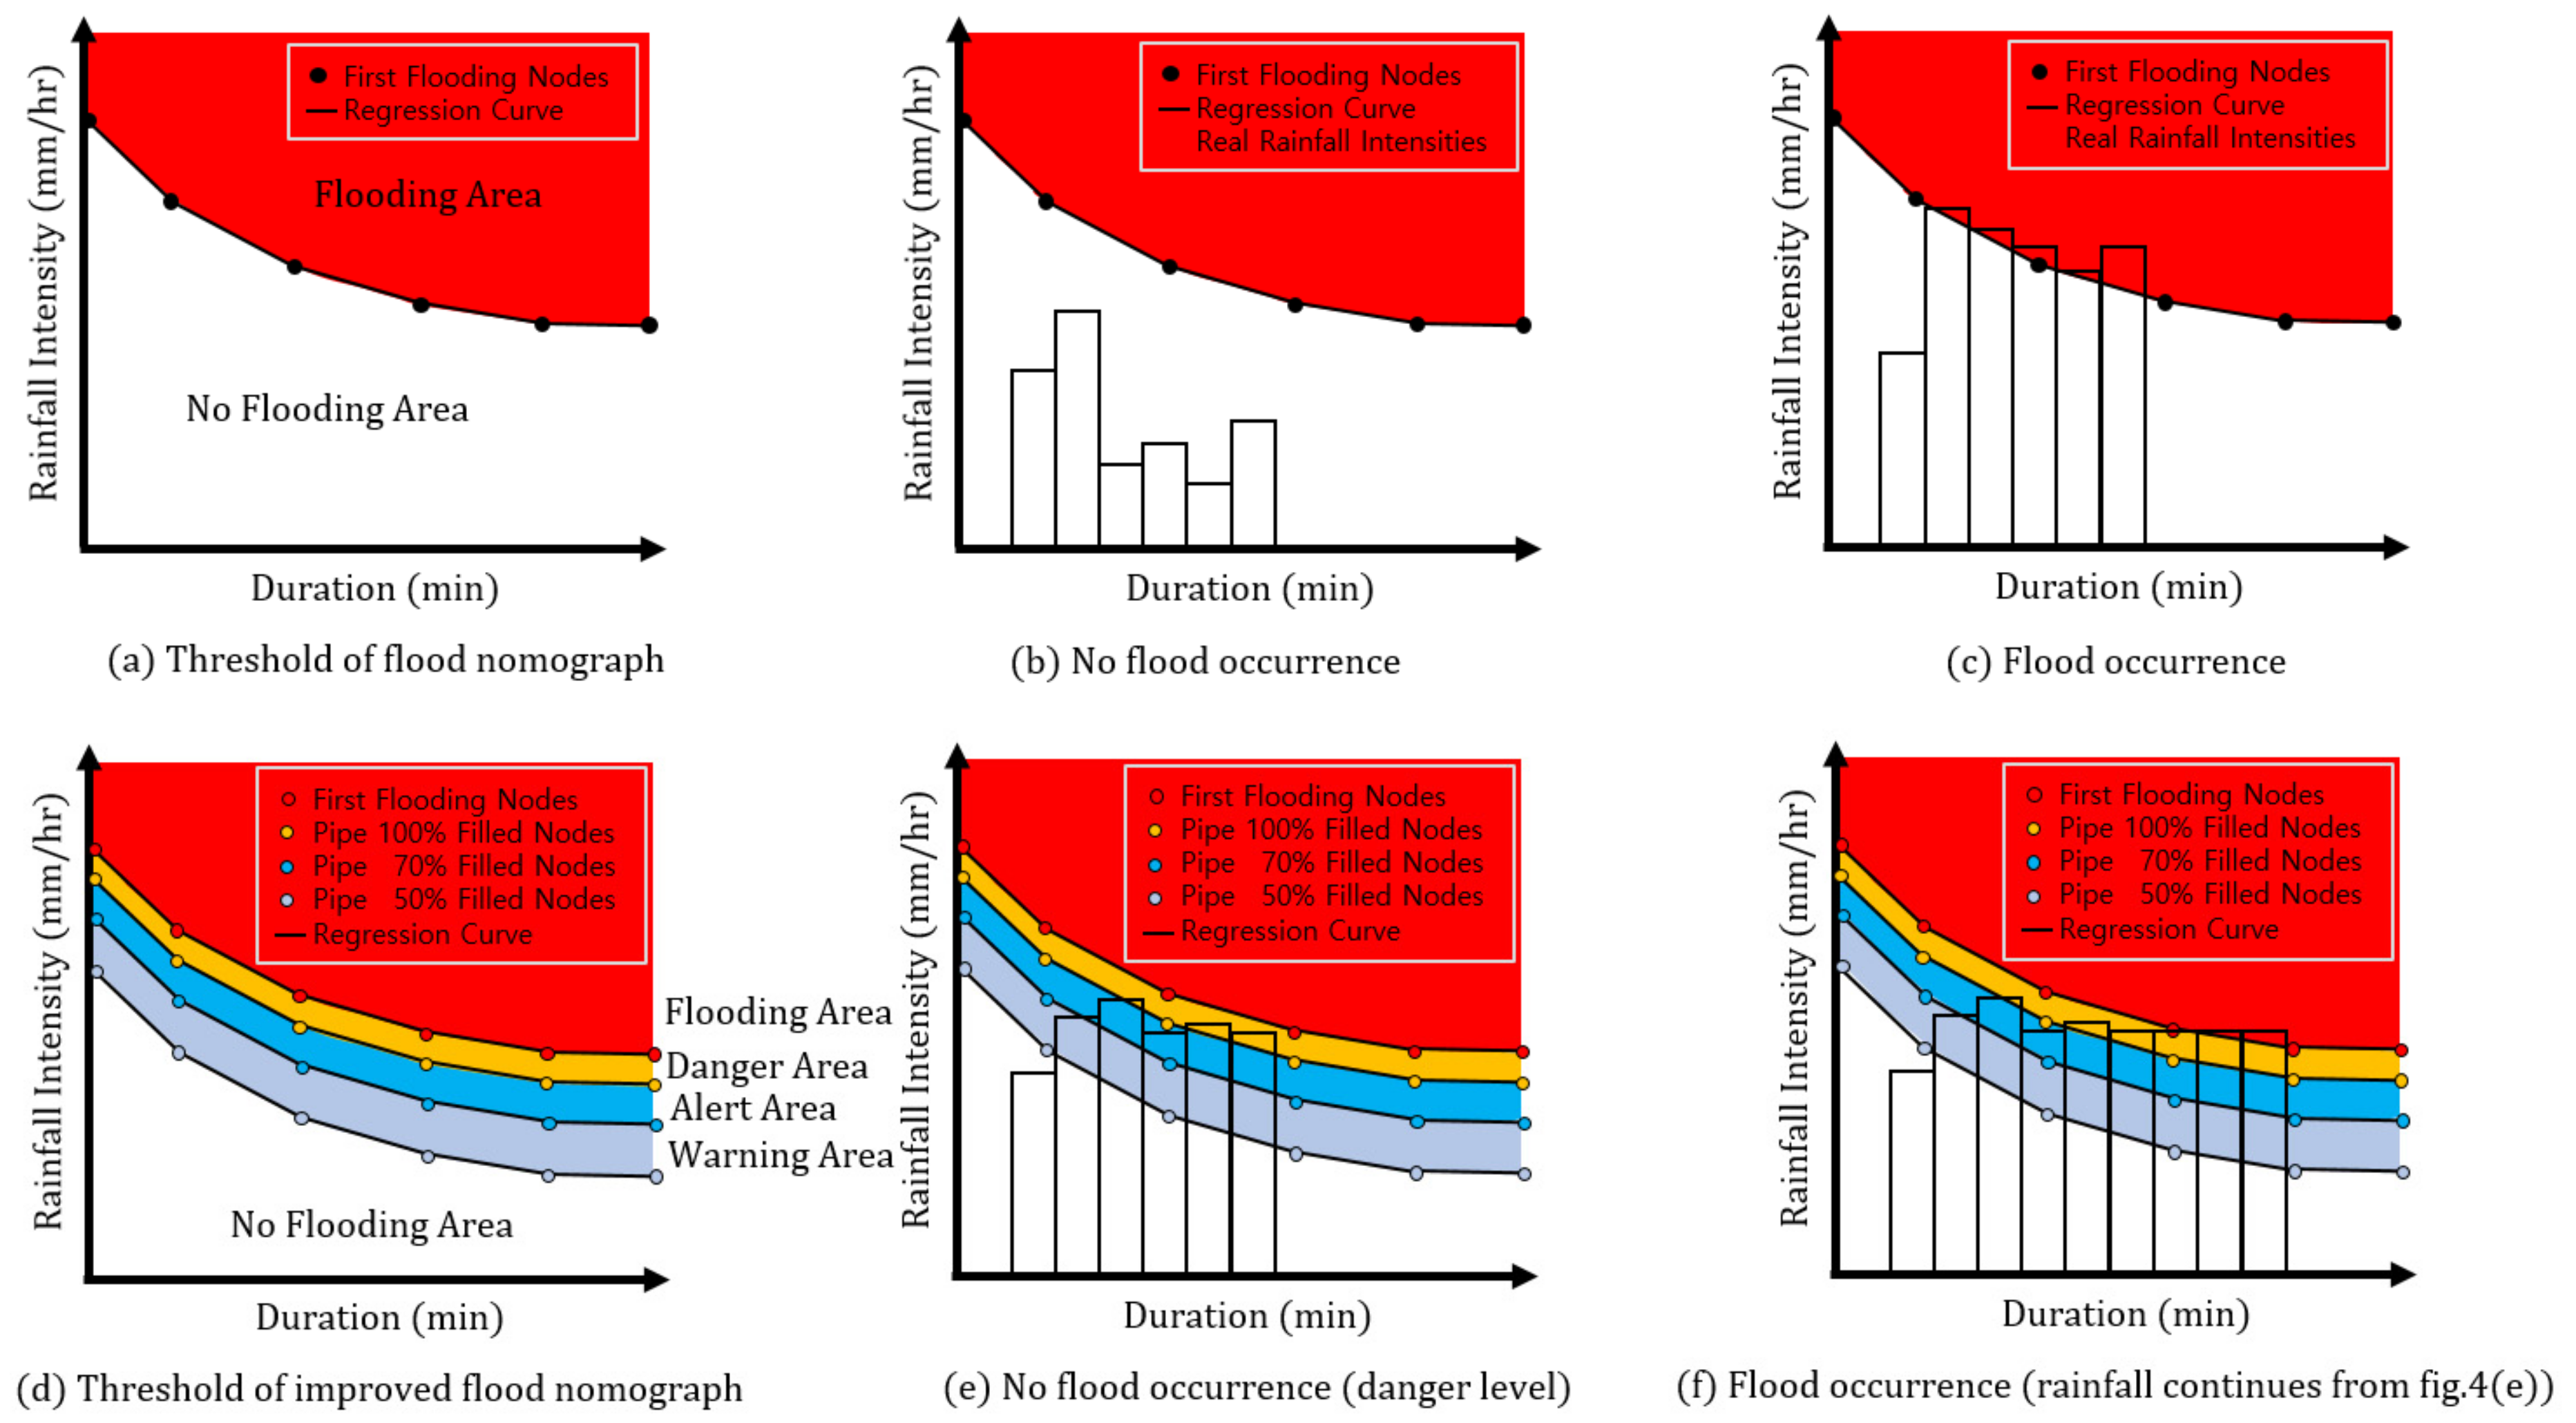
Based on flood forecasting, the improved flood nomograph concept uses the same rainfall distribution as the urban drainage design. If the rainfall intensity applied is higher than that of the first flood node, the target area is flooded. However, if the rainfall intensity applied is higher than the danger criteria but lower than the first flooding criteria, the target area is only considered to have the potential of flooding in the near future. The predicted rainfall data must have the same units as the actual rainfall data to be used in this process. Because actual rainfall events start and stop continuously during the wet season, the time between rainfall events should be defined when applying actual rainfall events [18]. The time between events refers to the time interval separating different rainfall events. The target watershed’s time of concentration can be used as the inter-event time in a flood [18]. Figure 4 shows a schematic of the improved flood nomographs used in flood forecasting.
Figure 4a shows that the rainfall intensities that are converted with the first flooding nodes are the constituent of the marginal point in a flood nomograph. In addition, the rainfall intensities of the first flooding’s regression curve generate the threshold value of the flood nomograph [18]. As shown in Figure 4b, the intensity of an actual rainfall event is smaller than the marginal point of the flood nomograph, meaning that there is either no flooding or not enough actual rainfall to cause flooding. However, Figure 4c shows that the rainfall intensities exceed the marginal point of the flood nomograph, meaning that a flood can occur. In Figure 4d, the improved flood nomograph is converted with the four criteria nodes combined with the first flooding nodes: (1) is the first flooding node, (2) pipe water level 100%, (3) pipe water level 70%, and (4) pipe water level 50%. The threshold values of these four criteria are generated from the regression curve of each criteria condition. Figure 4e shows that the actual rainfall event is lower than the first flooding marginal point of the improved flood nomograph, meaning that no flood has occurred. However, Figure 4f shows that if an actual rainfall event occurs continuously, then a flood can subsequently occur.
3. Applications and Results
3.1. Study Areas
Urban areas with moderate slopes and high population density were selected because of the precedent of being used as flood examples and the existence of warning systems in such areas. Further, areas with a history of past flood damage were selected to verify the improved flood nomograph example and warning systems.
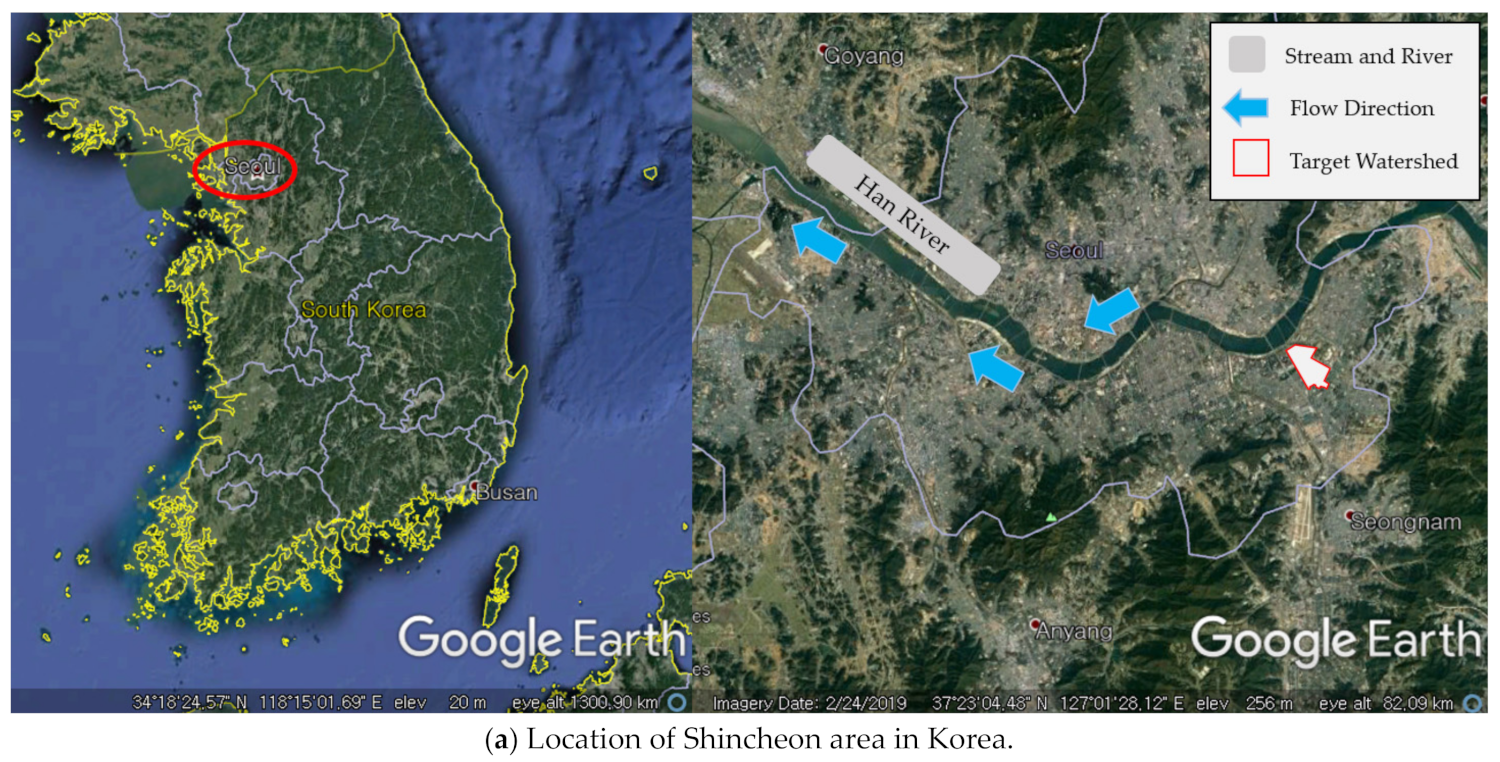
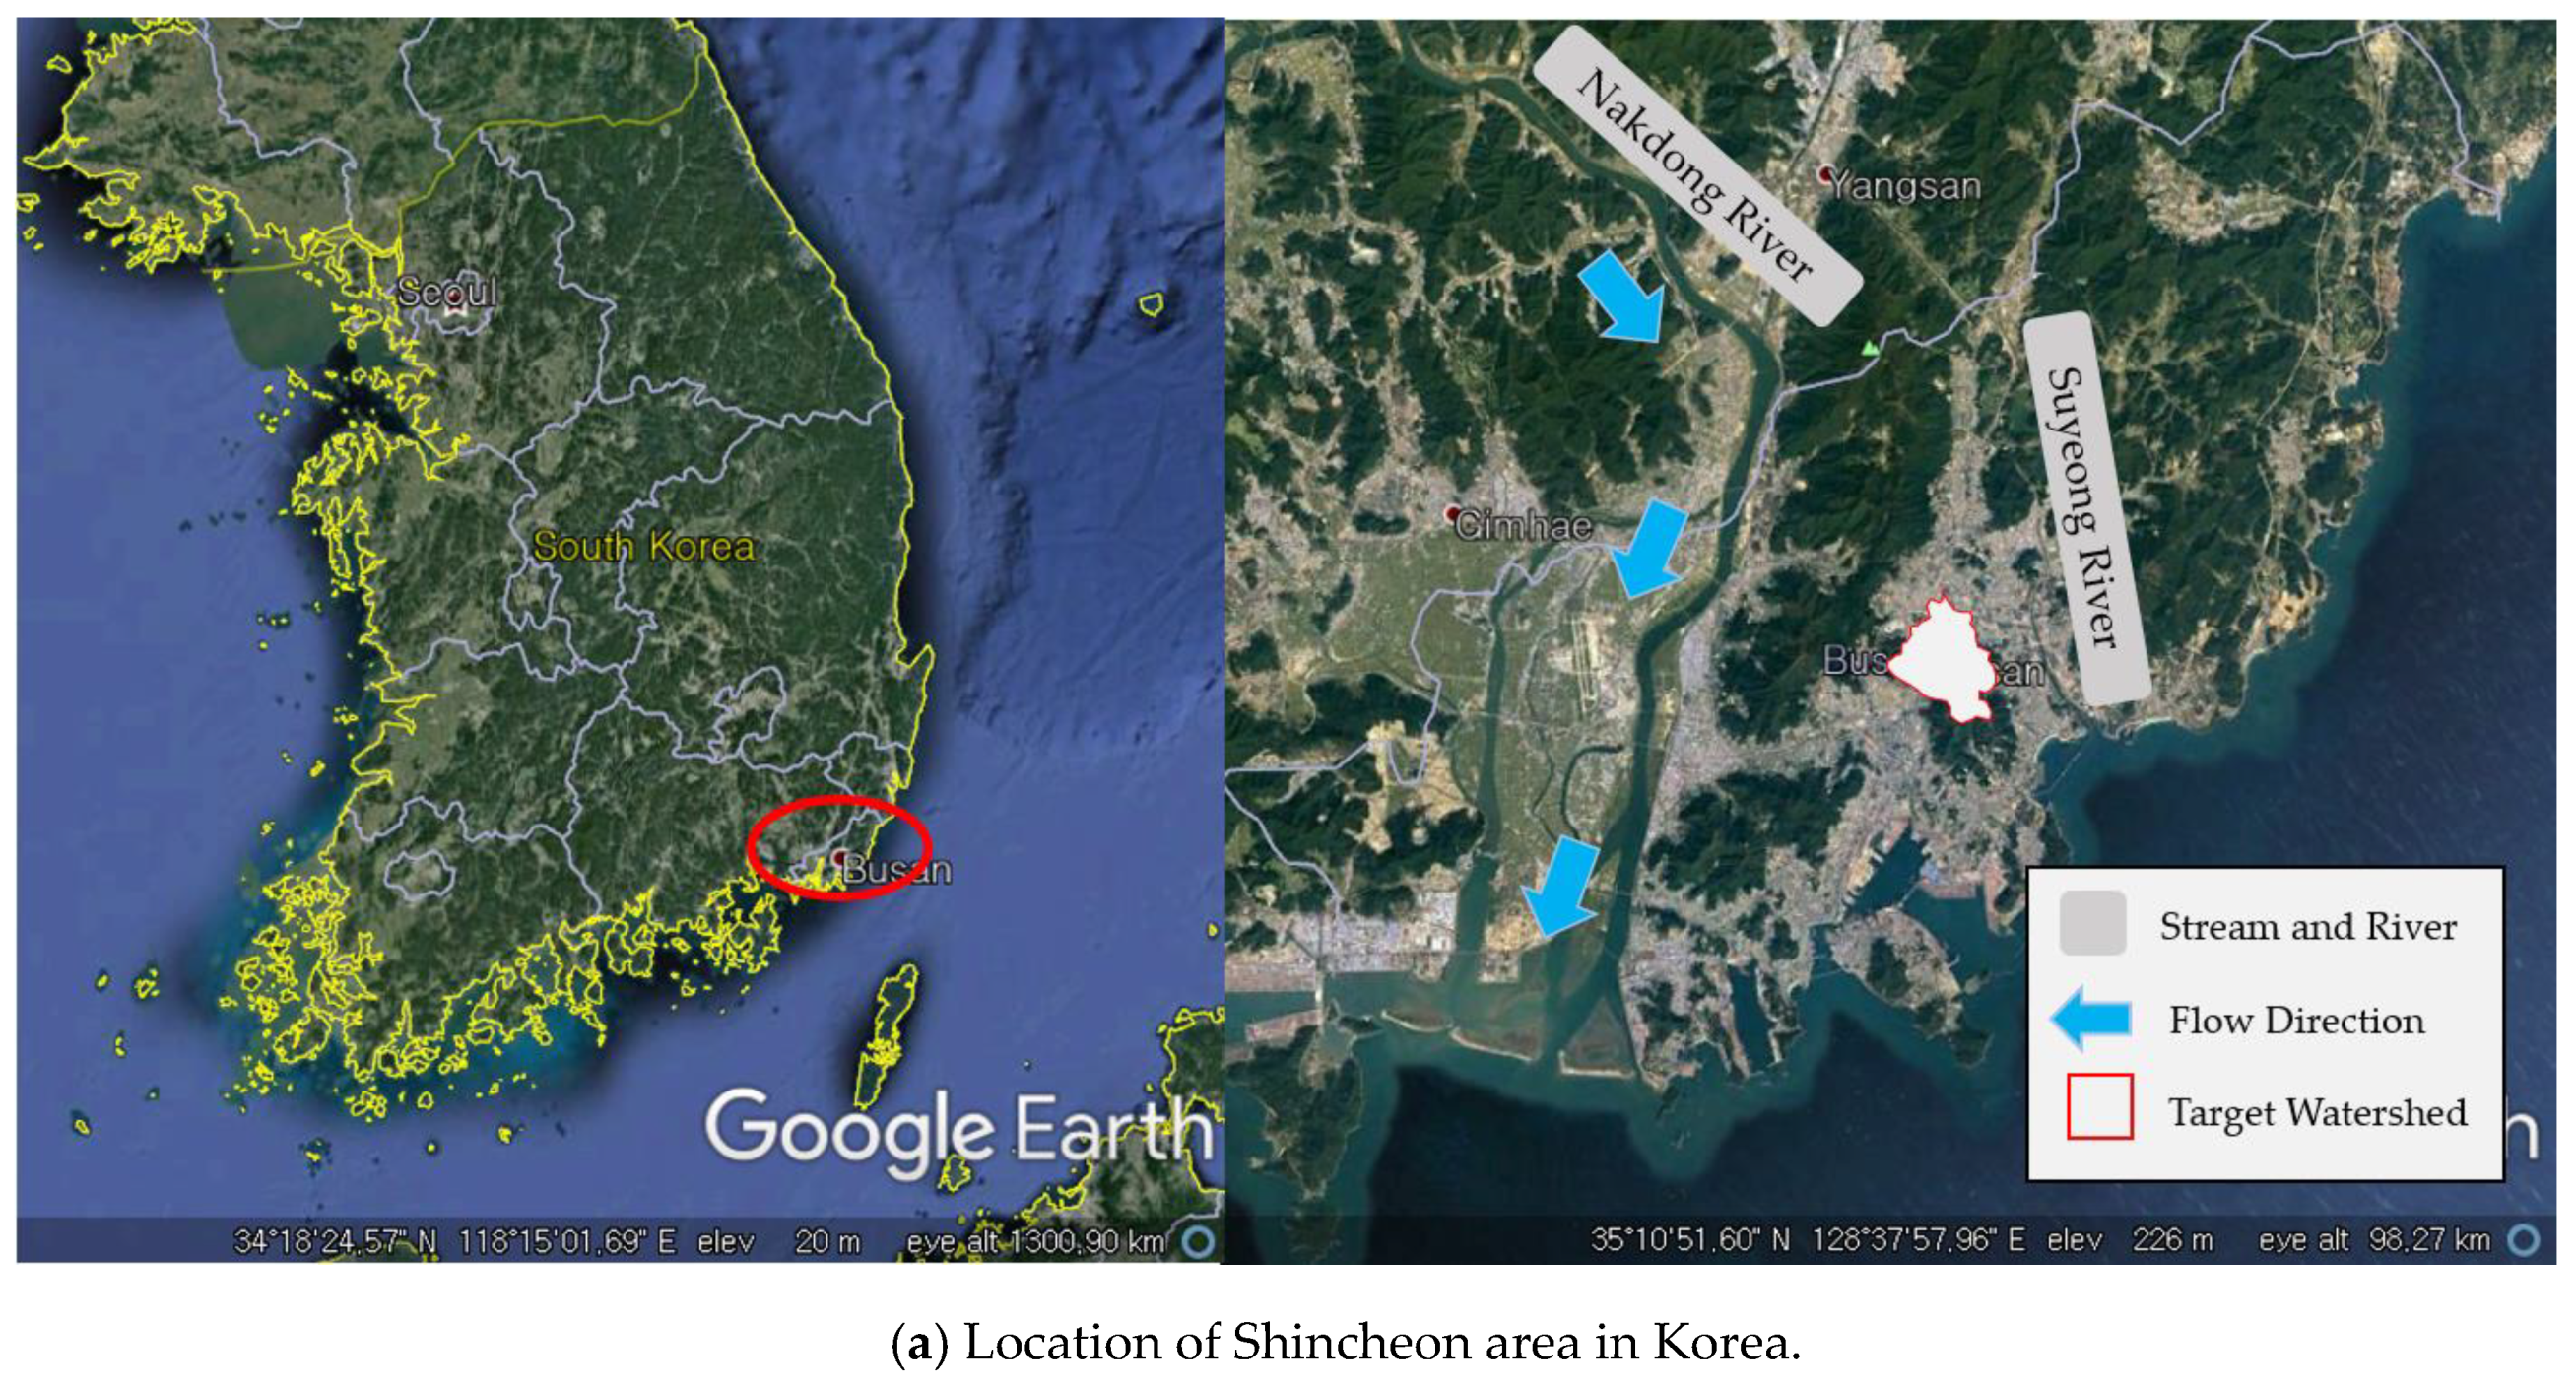
In 2009, 2010, 2011, and 2013, various areas were inundated due to urban flood in Shincheon area of Songpa-gu, Seoul. On 9 July 2009, due to heavy rain, the area of Hyundai apartment in Jamsil collapsed underground. On 21 September 2010, due to 264 mm of heavy rain in Songpa, 150 cases of flood support were requested, and the sewage system near the residential area was blocked or reversed, causing intensive flooding of underground. Heavy rains of 338 mm on 27 July 2011 flooded two-way roads to Olympic road under the Han River railroad bridge, leaving hundreds of vehicles trapped or submerged. On 22 July 2013 due to heavy Songpa rains, approximately 40 vehicles flooded. In 2012 and 2017, drainage areas adjacent to Geoje area of Yeonje-gu, Busan, were inundated. On 17 September 2012 and 11 September 2017, both caused Geoje area to flood in many residential places. Therefore, in this study, the Shincheon district and Geoje district, which have various historical flood events, were selected as the target watershed.
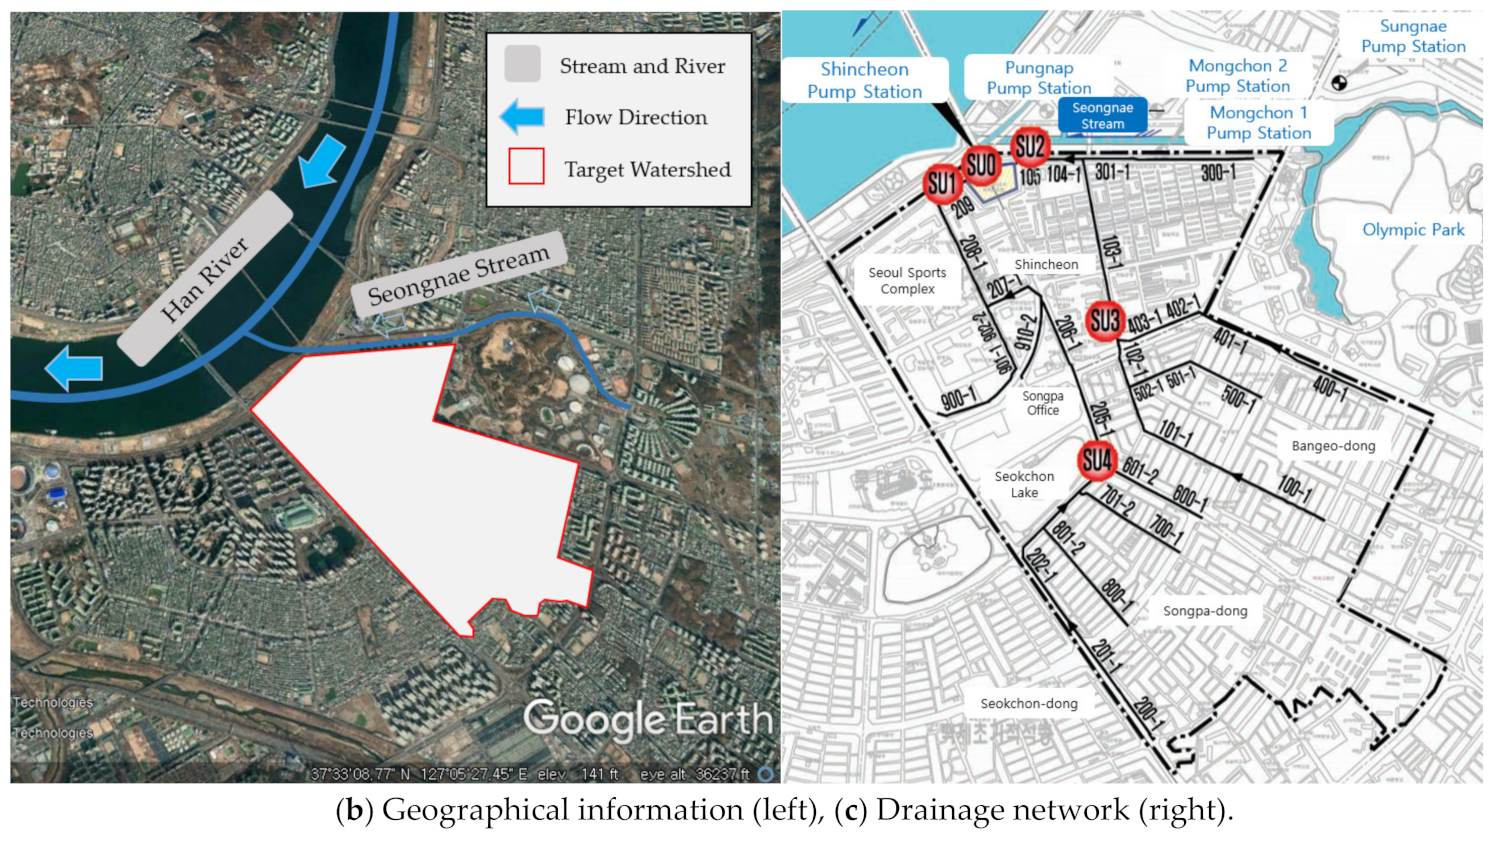
Most of the areas near the Sincheon pump station contain apartment complexes. The Songpa-gu Office is located there, the Seongnaecheon Stream flows along Olympic Park on the right, and Seokchon Lake is located in the watershed (Figure 5a,b). In addition, as shown in Figure 5b, a number of pump stations are located facing the Seongnaecheon Stream, and the gradient is very gentle. The total target watershed area is 3.6 km2, and the pump station consists of 11 pumps with 600 horsepower each. The pump station has a total pump capacity of 2256 m3/min, and the well-watershed area has a total volume of 92,000 m3. Water in the area around Songpa-gu Office, where natural drainage is difficult due to the high water level of the Han River during the wet season, is forced into the Han River through three channels. Figure 5c shows the shape and rainwater pipe diagram of the Sincheon pump station.
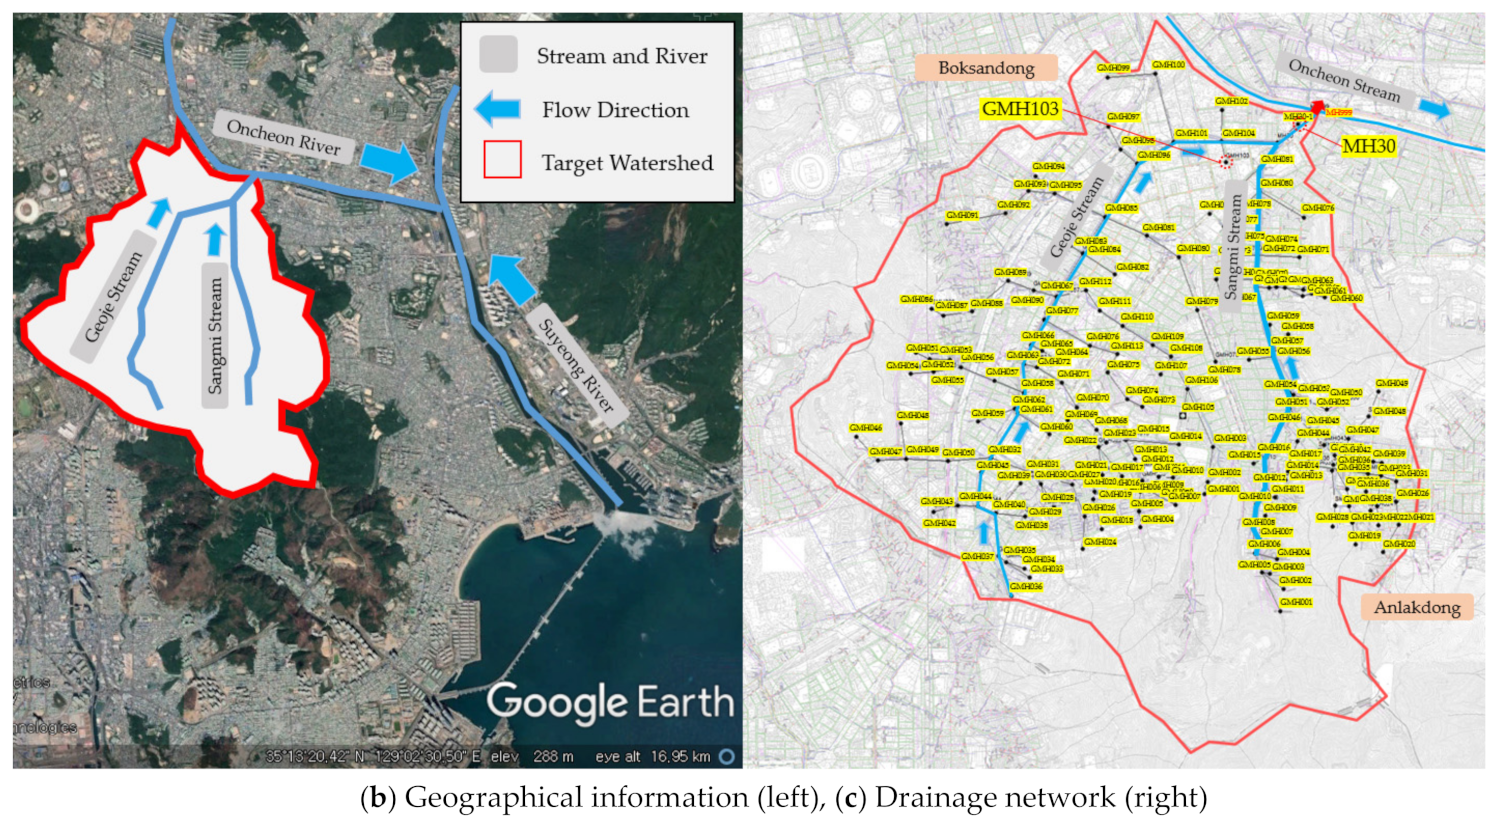
Oncheon Stream is a tributary of the Suyeong River, which flows through the heart of Busan. The tributaries of Oncheon Stream include Geoje Stream and Sangmi Stream, the channels of which are covered mostly by roads in the upstream and midstream reaches. In the downstream, Geoje and Sangmi Stream join and flow into Oncheon Stream. In Figure 6a,b, geographical information of Geoje area is shown. The Geoje area is 9.65 km2, and the Geoje and Sangmi Streams are 4.26 and 2.87 km long, respectively. Figure 6c includes additional information of the Geoje drainage network.
The EPA-SWMM (Storm Water Management Model) version 5.0 (Environmental Protection Agency, Washington, DC, USA) was used for rainfall-runoff simulation. This is a comprehensive model that simulates the runoff volume caused by rainfall in urban basins and the discharge of pollutants from surface and sewer pipes, traces runoff volume in sewage networks, and calculates detention volume. The Seoul Metropolitan Government and Busan Metropolitan Government provided information on the drainage network based on geographic information system data. The drainage system in Shincheon area has 35 links, 35 subcatchments, and 35 nodes in total. The drainage outlet is located north of the Shincheon target watershed near the Shincheon pump station. For the Geoje area, the drainage system has 195 links, 195 subcatchments, and 195 nodes in total. The outlet of the drainage network is located north of the Geoje area.
3.2. Calibration and Validation of the Rainfall Runoff Model in Study Areas
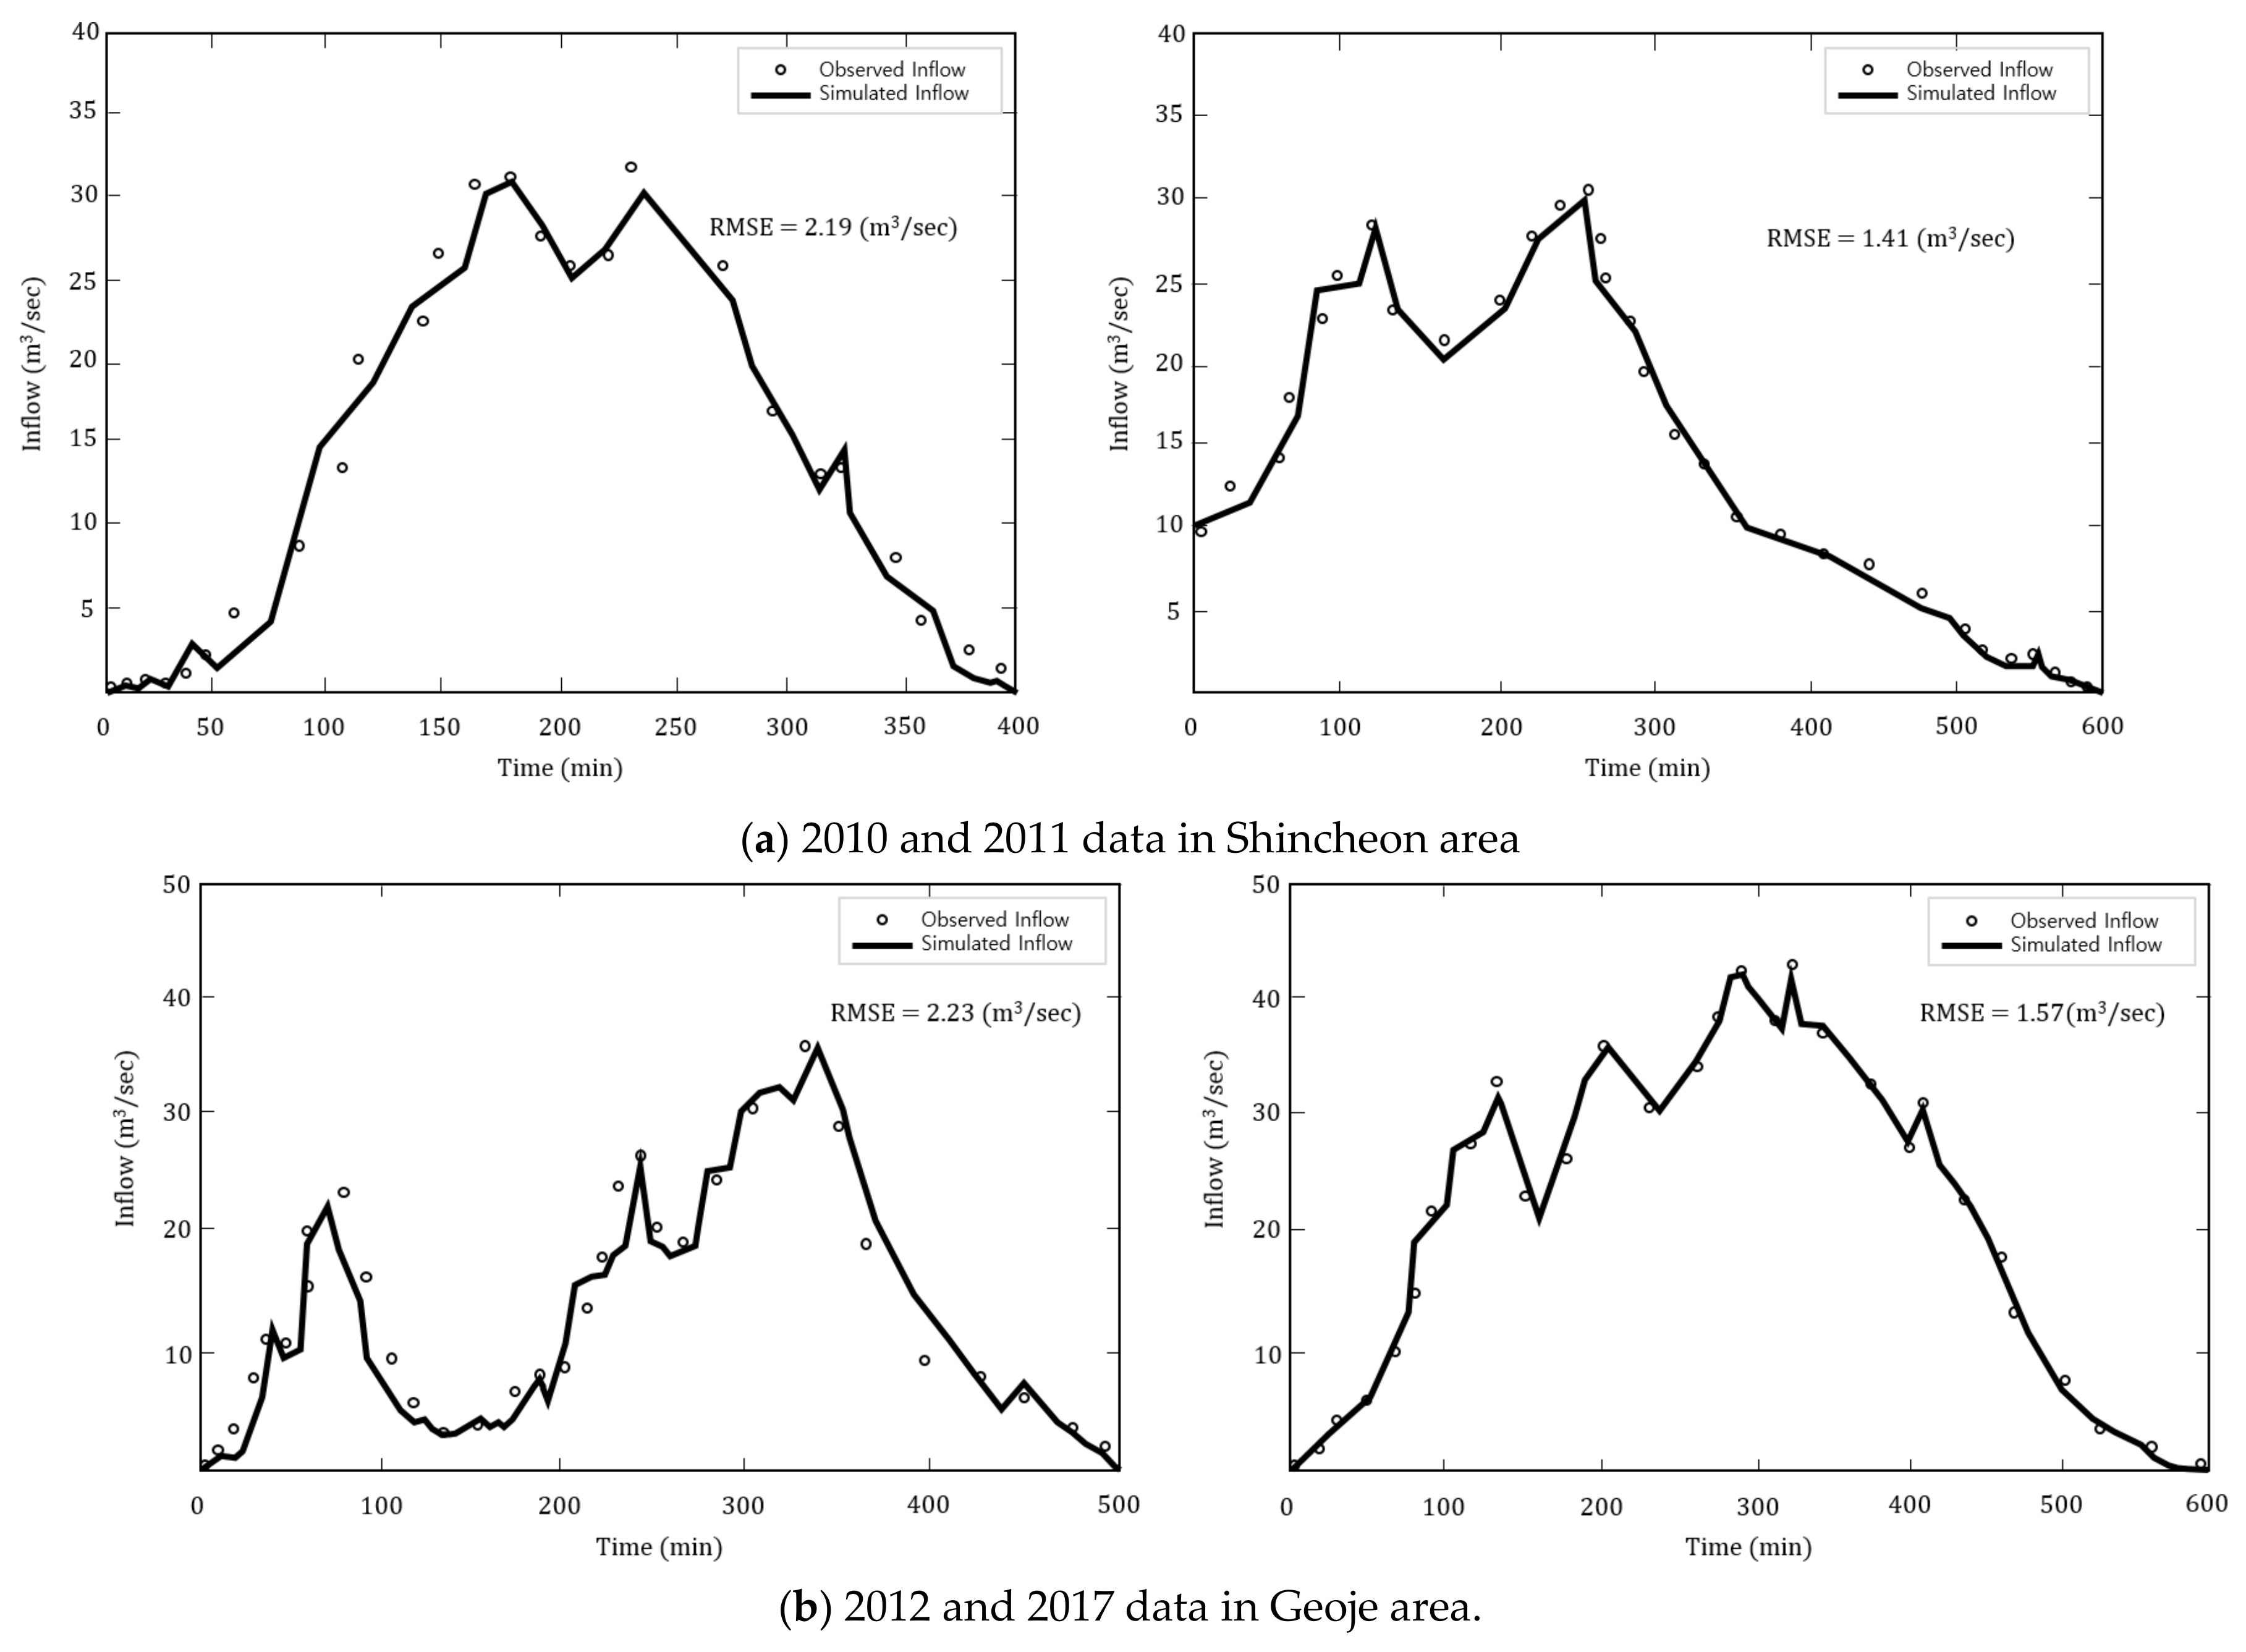
The model is manually calibrated. The calibration of the model is focused on four goals: Comparing peak time and peak discharge total runoff volume and reducing the root mean square error (RMSE) between the simulated and observed inflow data. The rainfall data for 9 September 2010 and 27 July 2011 in Shincheon area and 17 September 2012 and 11 September 2017 in Geoje area are used for the rainfall runoff model calibration. In the pump station, the centralized reservoir has no measuring device for inflow data. Therefore, the centralized reservoir level variance and pump operation records are used to estimate inflow. The accuracy of calibration/validation and the observed/simulated inflow hydrograph is shown in Figure 7.
The types and values of the calibrated parameter in rainfall runoff model is described in Table 1. Three parameters are used for the calibration and validation of the target basin: Width of subcatchment, percentage of slope, and percentage of impervious area. The total number of parameters are 105 for Shincheon area (subcatchment is 35) and 585 for Geoje area (subcatchment is 195). The roughness coefficient is assumed to be 0.015 for Shincheon area and 0.012 for Geoje area following a technical report written after the recent maintenance and rehabilitation of pump station and the design of detention reservoir, respectively.
3.3. The Four Criteria Nodes
The synthetic rainfall distribution depends on the drainage network design in the study area [18]. The drainage network design in the study area is conducted with the Huff third quartile distribution. The four criteria nodes are selected based on the rainfall runoff. The rainfall data for each criteria node has the same distribution but different amounts in the selection of each criteria node according to various durations.
Four criteria nodes were distributed from 10 to 720 min for synthetic rainfall durations. The initial rainfall amount was 1 mm, and this was increased by 0.1 mm until each criterion was satisfied. For the first flooding criterion, rainfall was increased until first flooding occurred. For the other three criteria, rainfall was increased until the pipe water levels reached 50%, 70%, and 100%. Table 2 shows a summary of the four criteria nodes in study areas.
As shown in Table 2, Shincheon area in Node 208 is the only node for each criteria case. Node 208 is located downstream of the Shincheon drainage network. For all durations, Node 208 was used as the threshold of improved flood nomograph.
In Geoje area, Node GMH103 is the first flooding and 100% filled node until 120 min, and Node MH30 after 120 min. For other criteria case, Node GMH103 is the 70% and 50% filled node until 180 min, and Node MH30 after 180 min. The Node GMH103 and MH30 are located downstream of the Geoje drainage network. In case of the first flooding and 100% filled node, Node GMH130 was used as the threshold for durations shorter than 120 min, and Node MH30 was used as the threshold for durations longer than 120 min. In case of the 70% and 50% filled node, Node GMH130 was used as the threshold for durations shorter than 180 min, and Node MH30 was used as the threshold for durations longer than 180 min. The total rainfall amount after 120 min remained constant in the first flooding node. This indicates that the maximum allowable volume of the Geoje drainage network was approximately 130 mm [18].
In previous references, the operation of main conduits was based on the first flooding node [26,27,28,29,30]. In Korea, most drainage conduits are classified as branch or main conduits depending on the drainage basin and the product of the runoff coefficient [26]. Specifically, a conduit is classified as a branch conduit if the data of the product is smaller than 0.12 km2; otherwise it is classified as a main conduit. For the improved flood nomograph, the four criteria nodes were selected for both branch and main conduits.
3.4. Improved Flood Nomograph
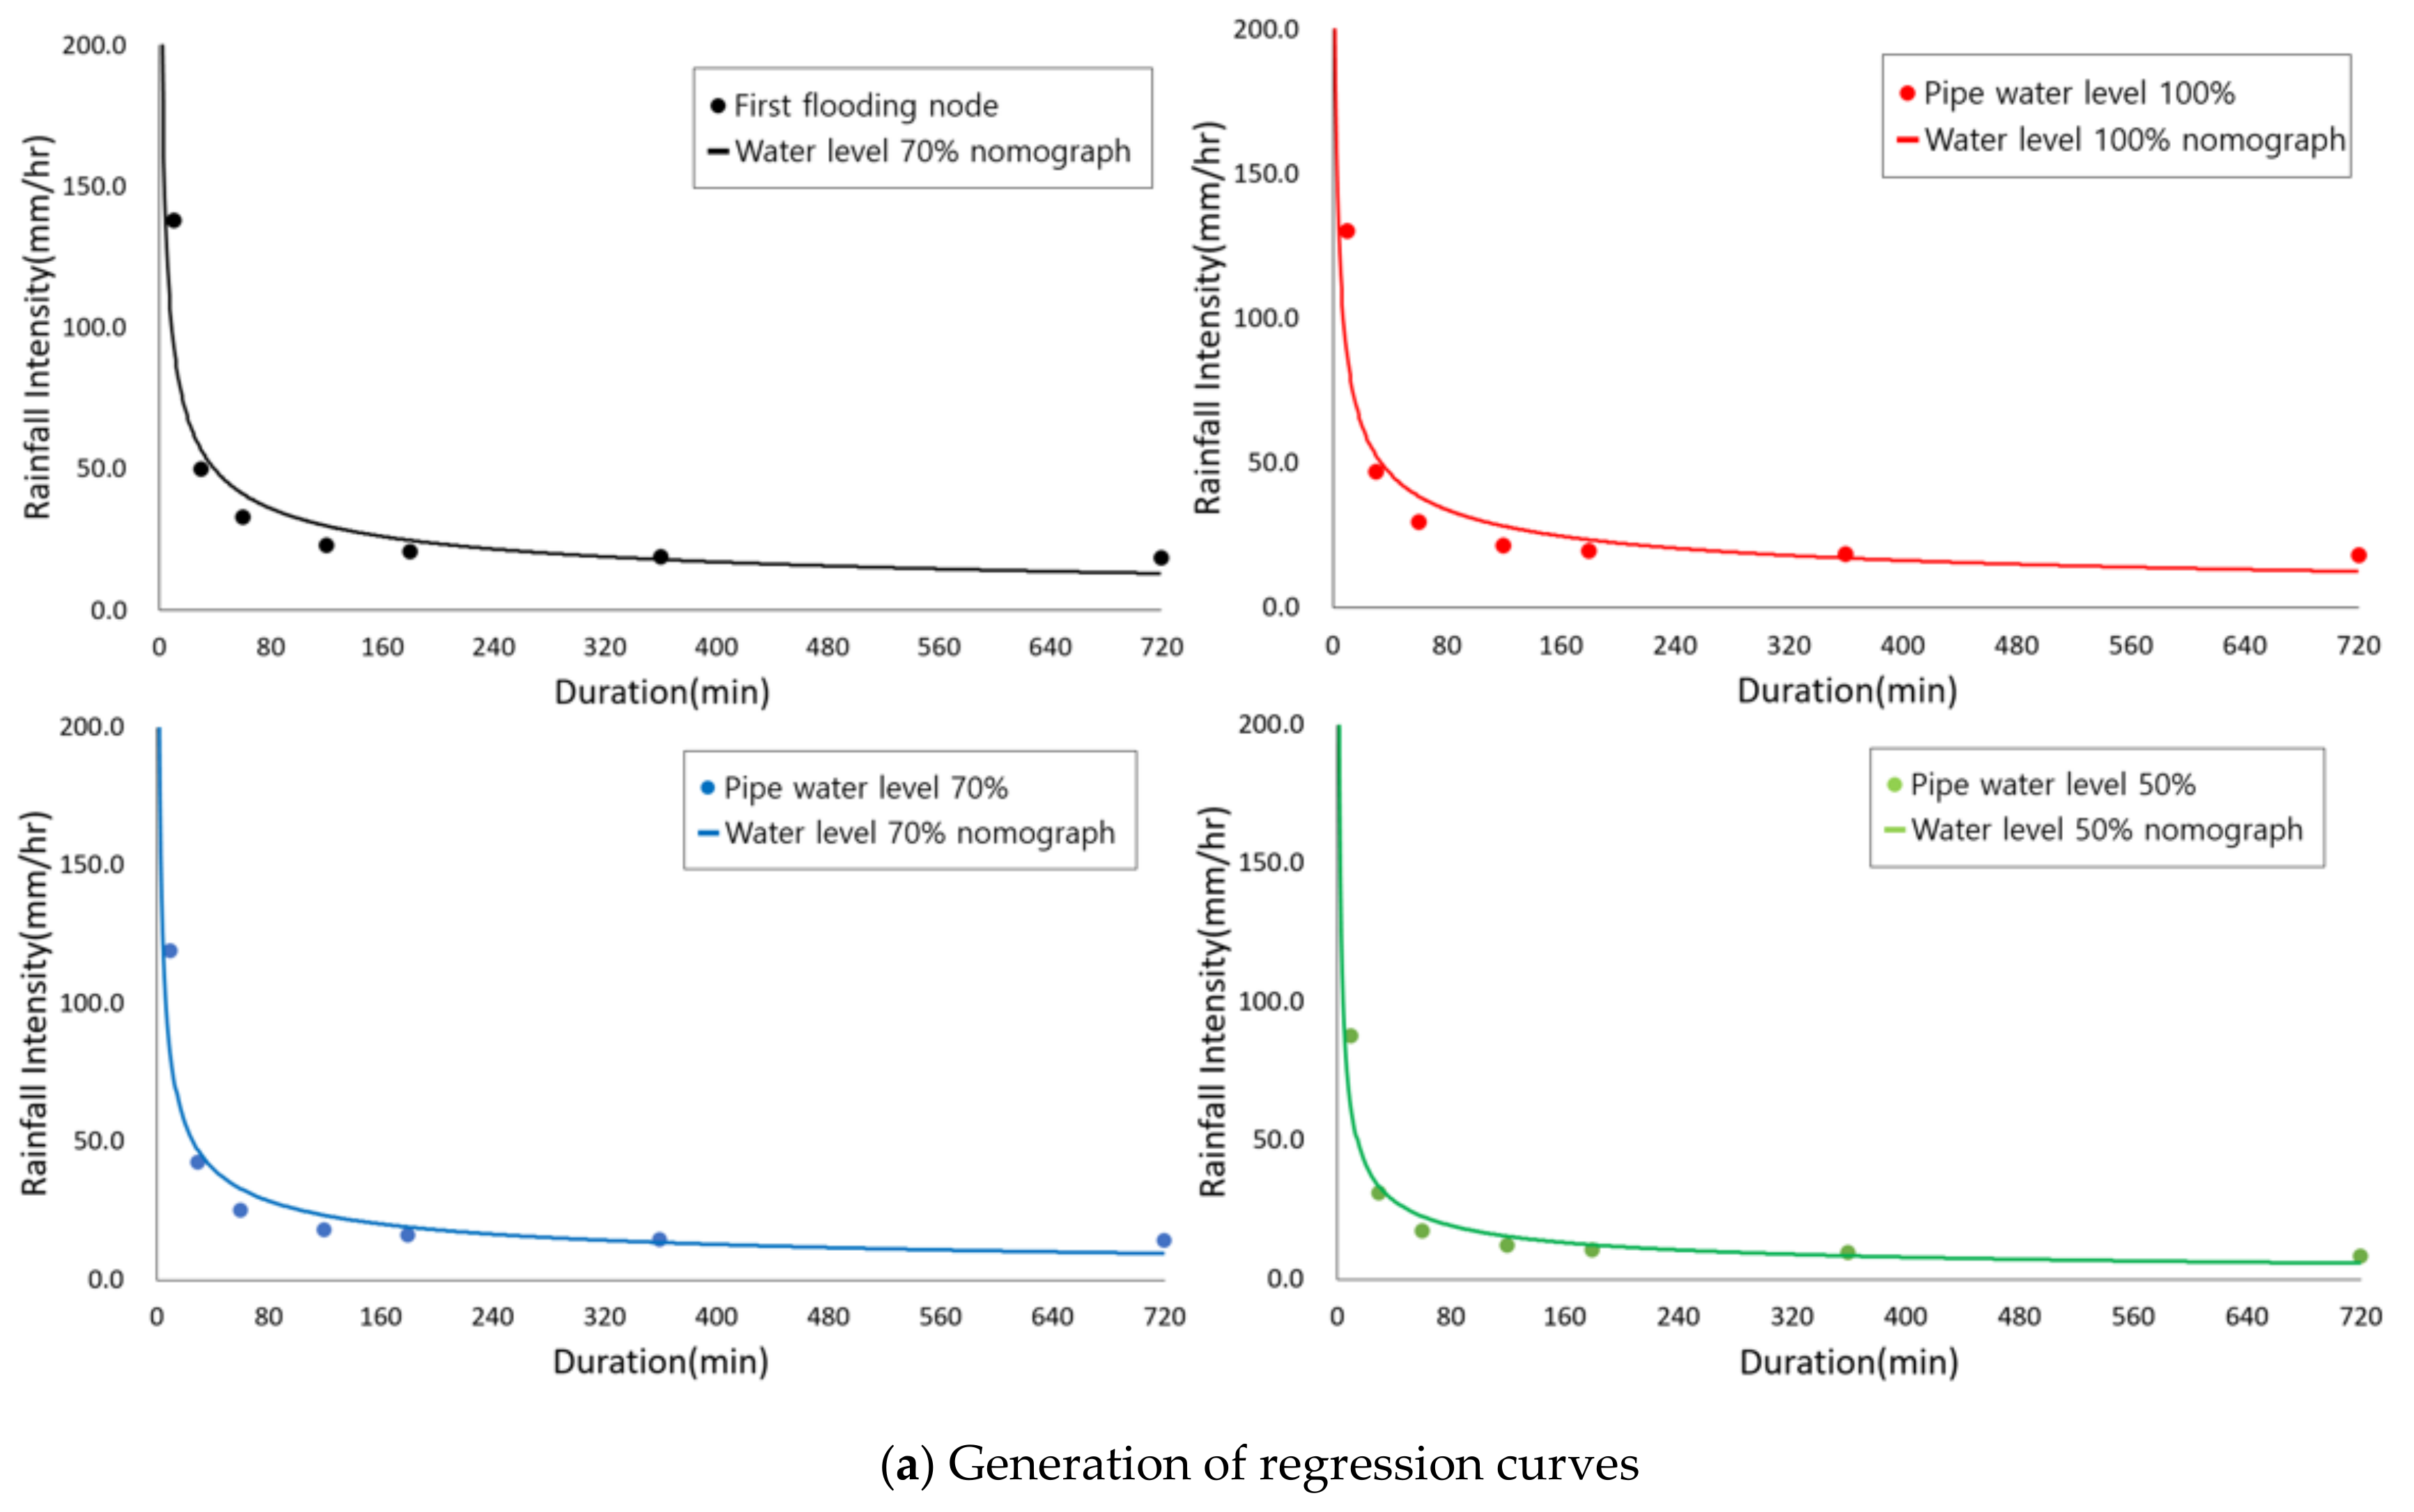
To generate an improved flood nomograph, regression curves of the four criteria rainfall intensities are required. Once the regression curves have been acquired, the regression equation for each criteria rainfall intensity can be generated. This regression equation is the marginal line for determining the warning, alert, danger, and inundation levels. The type of regression equation may recommend the form of a power function to facilitate application, but it is not limited. Figure 8 shows the generation process of the improved flood nomograph.
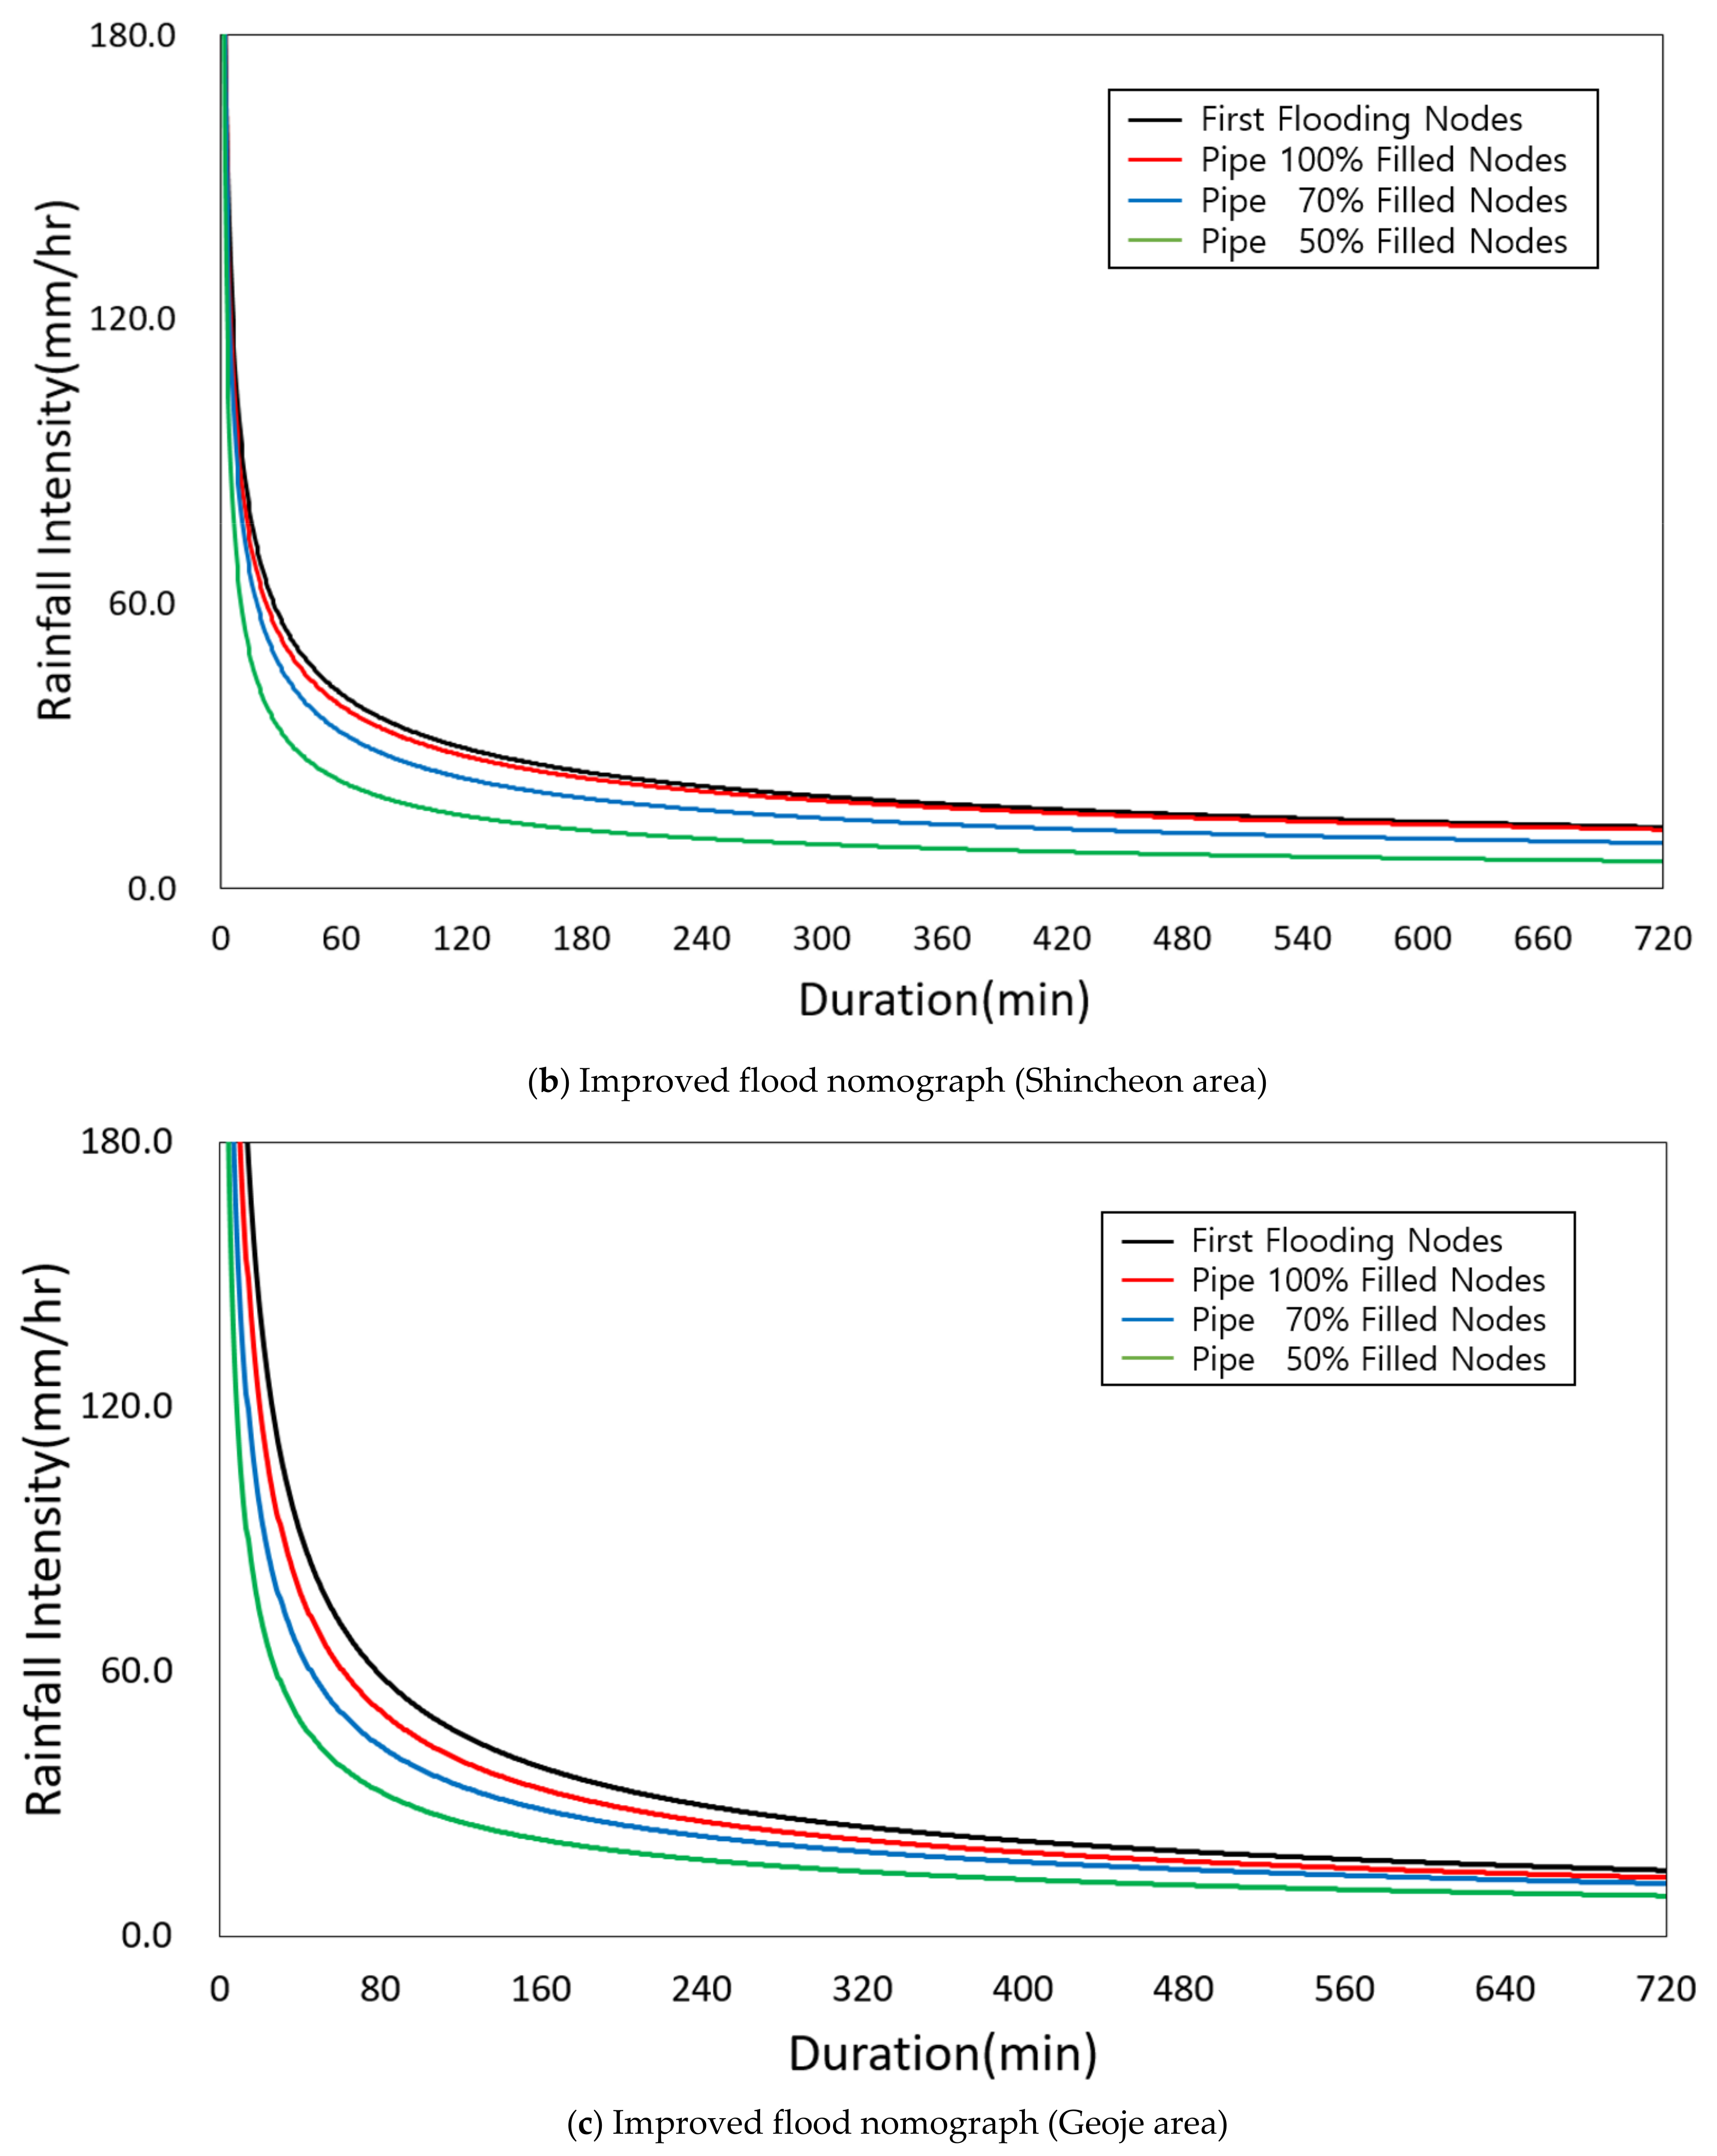
The four criteria rainfall intensities are converted to flooding volumes. The regression curves were drawn from the four criteria rainfall intensities. In Figure 8a, the marginal point of the improved flood nomograph was created. If the regression equation is uncertain, the threshold of the four criteria intensities can be connected [18]. The improved flood nomograph shown in Figure 8b and Figure 6c was generated by overlapping four criteria regression curves.
3.5. Application of Improved Flood Nomograph with Rainfall Data
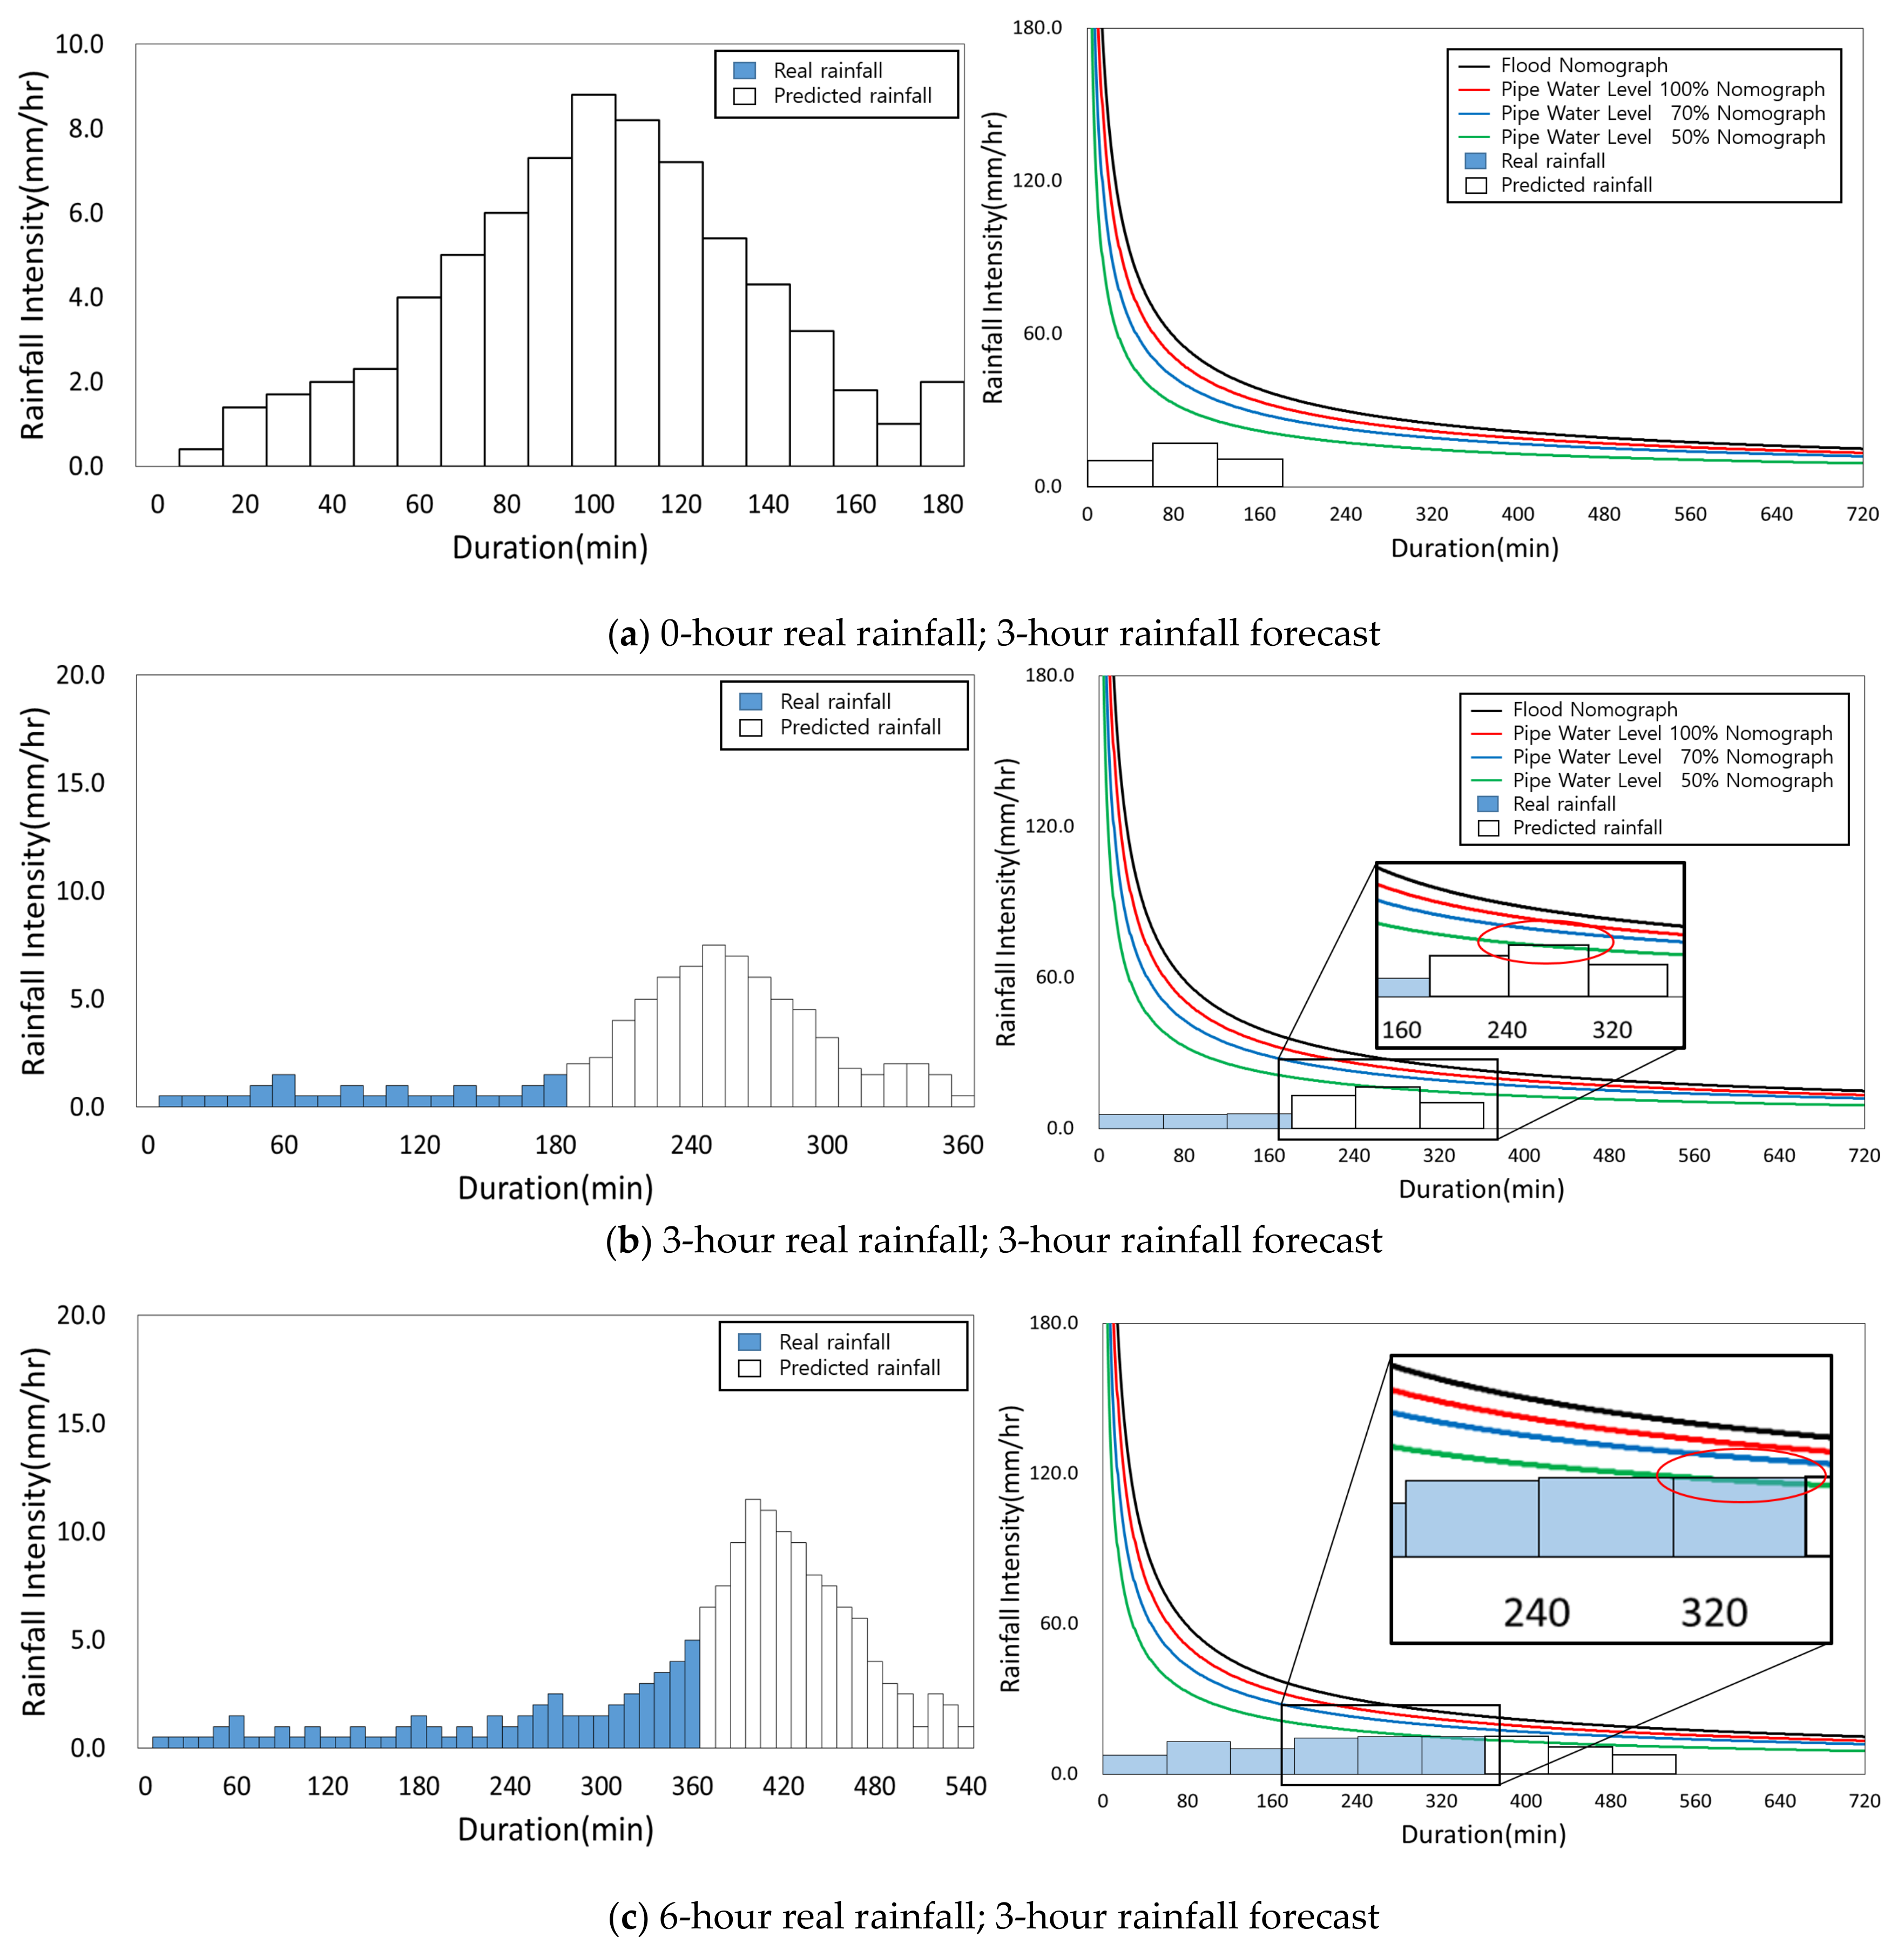
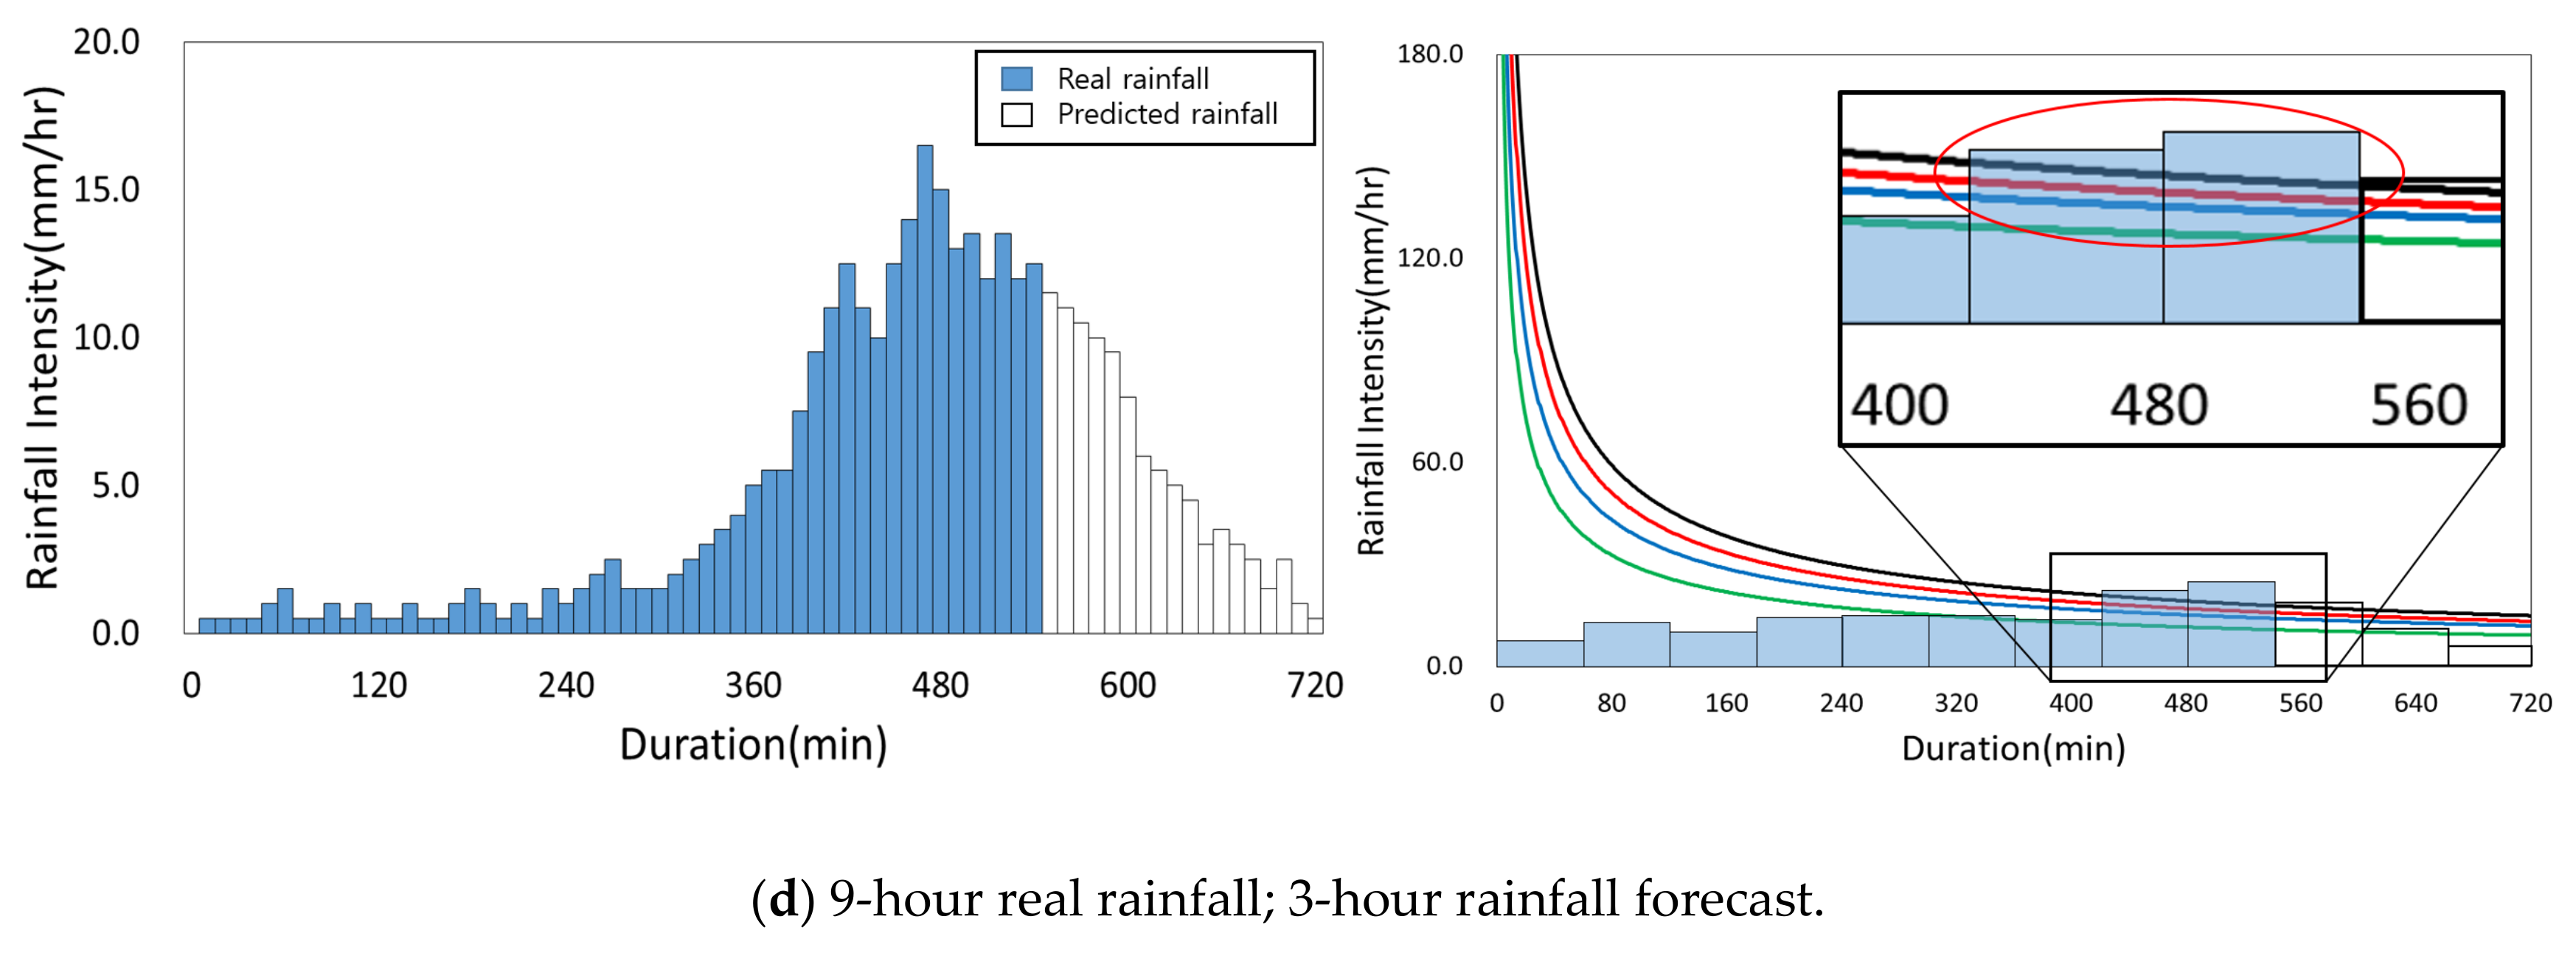
Historical rainfall data for 27 July 2011 (Shincheon area) and 11 September 2017 (Geoje area) was chosen as the rainfall data to apply to the improved flood nomograph. A 3-hour rainfall forecast was provided to the public by the Korea Meteorological Administration (KMA) [32]. The accurate flood forecasting is possible if the time interval of the applied rainfall data is in 1 or 5 min increments. However, this also makes the application process substantially longer. The application of the improved flood nomograph is shown in Figure 9 and Figure 10.
The initial conditions of the improved flood nomograph and 3-hour rainfall forecast are applied to the improved flood nomograph (Figure 9a). The threshold is located higher than the rainfall forecast intensity (Figure 9a and Figure 10a). The 3-hour forecast and real rainfall are also applied (Figure 9b and Figure 10b), and it can be seen that the 50% pipe water level threshold is located lower than the forecast and real rainfall intensities. This indicates that some of the pipes in the downstream of the drainage network are over 50% filled with water. The 6-hour rainfall forecast and 3-hour real rainfall are applied (Figure 9c and Figure 10c). Pipe water levels of 50%, 70%, and 100% and the first flooding flood nomograph threshold are located below the forecast and real rainfall intensities (Figure 9c,d and Figure 10d). This indicates that flooding is currently occurring and is expected to continue. The reason that flooding is still occurring for the 9-hour rainfall forecast and 3-hour real rainfall is that the threshold is lower than the intensities in the improved flood nomograph (Figure 9d and Figure 10d).
3.6. Flooding Stages of Improved Flood Nomograph
In Figure 11, the yellow line is the result of simulating a 3-hour continuous rainfall with 50-year frequency. This is the design frequency of the Sincheon pump station, representing a total of 177.1 mm of rainfall. In the beginning, the pump station design rainfall reaches the warning zone, then takes about 15 min before reaching the alert zone, so it can be considered that the pump station has time to prepare. Then, seven minutes are secured from alert to the danger zone. It can also be seen that three minutes are secured before flooding occurs in the danger zone. From warning to flooding, about 25 min are secured from flooding that occurs in the target watershed.
Based on the comparison of the design standard rainfall for the Shincheon pump station, it is estimated that disaster management at a pre-preparatory level is feasible, considering that it takes about 25 min from the issuance of a warning to the occurrence of flooding. It is also believed that the improved flood nomograph can minimize damage by securing time before flooding.
4. Conclusions
Previous studies proposed new approaches to prepare for or prevent floods with various flood forecasting models in a non-structural measure. Research into these kinds of flood forecasting methods was necessitated by the increasing occurrence of floods in cities that has led to substantial damages to both humans and property. In this study, an improved flood forecasting technique was proposed based on the selection of four criteria (pipe water levels of 50%, 70%, and 100%, and first flooding node) on Sincheon and Geoje area. The four criteria nodes for each duration were obtained using synthetic rainfall, which was distributed along the Huff third quartile distribution. The Huff third quartile distribution is the distribution most commonly applied to urban drainage facilities design in Korea. In each duration, the total synthetic rainfall amount is distributed from 1 mm with increments of 0.1 mm for the four criteria nodes. If there is flooding, the first flooding node, drainage pipe water level, and total rainfall amount are checked. By contrast, if there is no flooding, the 50%, 70%, and 100% drainage pipe water levels are checked. The rainfall amounts of the four criteria nodes are converted to rainfall intensities to generate improved flood nomographs. The strengths and weaknesses of the improved flood nomograph are as follows:
- When a target watershed is changed, a different improved flood nomograph must be created.
- For large watersheds, more than one improved flood nomograph is required.
- The results of the improved flood nomograph can differ depending on the flood damage.
- Rainfall data are only required when applying improved flood nomograph.
- The improved flood nomograph is applicable to single drainage basins in small area.
- Various time intervals of rainfall data can be applied to the improved flood nomograph.
- The four criteria in the improved flood nomograph can secure sufficient time to prepare for flooding.
- The selection of the rainfall distribution is important for generating improved flood nomograph.
The Shincheon and Geoje area are the target watershed for the improved flood nomograph. The data that were applied consisted of the predicted rainfall data from the KMA and the real rainfall data for 27 July 2011 (Shincheon area) and 11 September 2017 (Geoje area). A 10 min time interval for rainfall data was applied. Flood forecasting can be more accurate with smaller time intervals for rainfall data. Because only rainfall data are needed, an improved flood nomograph can easily be applied to any drainage network. An improved flood nomograph that is applicable to large watersheds instead of small watersheds should be investigated in future research. The selection of the rainfall distribution is important because it changes the shape of the regression curve in an improved flood nomograph. In future studies, various rainfall distribution will be used to generate the improved flood nomograph. This study is expected to serve as a resource to help predict and prepare for extreme rainfall that can potentially cause flood damage.
Author Contributions
Y.M.C. and E.H.L. carried out the survey of previous studies. Y.M.C. wrote the manuscript. Y.M.C. conducted all rainfall runoff simulations. Y.M.C., D.J.J., G.S.Y. and E.H.L. conceived the original idea of the proposed method.
Funding
This research was funded by the National Research Foundation (NRF) of Korea of the Korean government (NRF-2019R1I1A3A01059929).
Acknowledgments
This work was supported by a grant from The National Research Foundation (NRF) of Korea in the Korean government (NRF-2019R1I1A3A01059929).
Conflicts of Interest
The authors declare no conflicts of interest.
References
- Zhou, Q. A Review of Sustainable Urban Drainage Systems Considering the Climate Change and Urbanization Impacts. Water 2014, 6, 976–992. [Google Scholar] [CrossRef]
- Ahmadi, B.; Moradkhani, H. Revisiting hydrological drought propagation and recovery considering water quantity and quality. Hydrol. Process. 2019, 33, 1492–1505. [Google Scholar] [CrossRef]
- Arnbjerg-Nielsen, K.; Willems, P.; Olsson, J.; Beecham, S.; Pathirana, A.; Gregersen, I.B.; Madsen, H.; Nguyen, V.-T.-V. Impacts of climate change on rainfall extremes and urban drainage systems: A review. Water Sci. Technol. 2013, 68, 16–28. [Google Scholar] [CrossRef] [PubMed]
- Beven, K.; Kirkby, M.; Schofield, N.; Tagg, A. Testing a physically-based flood forecasting model (TOPMODEL) for three U.K. catchments. J. Hydrol. 1984, 69, 119–143. [Google Scholar] [CrossRef]
- Garrote, L.; Bras, R.L. A distributed model for real-time flood forecasting using digital elevation models. J. Hydrol. 1995, 167, 279–306. [Google Scholar] [CrossRef] [Green Version]
- Toth, E.; Brath, A.; Montanari, A. Comparison of short-term rainfall prediction models for real-time flood forecasting. J. Hydrol. 2000, 239, 132–147. [Google Scholar] [CrossRef]
- Jasper, K.; Gurtz, J.; Lang, H. Advanced flood forecasting in Alpine watersheds by coupling meteorological observations and forecasts with a distributed hydrological model. J. Hydrol. 2002, 267, 40–52. [Google Scholar] [CrossRef]
- Young, P.C. Advances in real–time flood forecasting. Philos. Trans. R. Soc. A Math. Phys. Eng. Sci. 2002, 360, 1433–1450. [Google Scholar] [CrossRef]
- Komma, J.; Blöschl, G.; Reszler, C. Soil moisture updating by Ensemble Kalman Filtering in real-time flood forecasting. J. Hydrol. 2008, 357, 228–242. [Google Scholar] [CrossRef]
- Doswell, C.A.; Brooks, H.E.; Maddox, R.A. Flash Flood Forecasting: An Ingredients-Based Methodology. Weather Forecast. 1996, 11, 560–581. [Google Scholar] [CrossRef]
- Andreussi, P.; Campolo, M.; Soldati, A. River flood forecasting with a neural network model. Water Resour. Res. 1999, 35, 1191–1197. [Google Scholar]
- Kim, G.; Barros, A.P. Quantitative flood forecasting using multisensor data and neural networks. J. Hydrol. 2001, 246, 45–62. [Google Scholar] [CrossRef]
- Solomatine, D.P.; Xue, Y. M5 Model Trees and Neural Networks: Application to Flood Forecasting in the Upper Reach of the Huai River in China. J. Hydrol. Eng. 2004, 9, 491–501. [Google Scholar] [CrossRef]
- Chau, K.W.; Wu, C.L.; Li, Y.S. Comparison of Several Flood Forecasting Models in Yangtze River. J. Hydrol. Eng. 2005, 10, 485–491. [Google Scholar] [CrossRef] [Green Version]
- Collier, C.G. Flash flood forecasting: What are the limits of predictability? Q. J. R. Meteorol. Soc. 2007, 133, 3–23. [Google Scholar] [CrossRef]
- Revecca, E.E.; Elisabeth, M.S.; Florian, P.; Thomas, C.P.; Albecht, H.W.; Andy, W.W.; Peter, S.; James, D.B.; Niclas, H.; Chantal, D.; et al. Continental and global scale flood forecasting systems. Wiley Interdiscip. Rev. Water 2016, 3, 391–418. [Google Scholar] [Green Version]
- Li, K.; Kan, G.; Ding, L.; Dong, Q.; Liu, K.; Liang, L. A novel flood forecasting method based on initial state variable correction. Water 2017, 10, 12. [Google Scholar] [CrossRef]
- Lee, E.H.; Kim, J.H.; Choo, Y.M.; Jo, D.J. Application of flood nomograph for flood forecasting in urban areas. Water 2018, 10, 53. [Google Scholar] [CrossRef]
- Lee, E.H.; Kim, J.H. Development of a flood-damage-based flood forecasting technique. J. Hydrol. 2018, 563, 181–194. [Google Scholar] [CrossRef]
- Yu, W.; Nakakita, E.; Kim, S.; Yamaguchi, K. Assessment of ensemble flood forecasting with numerical weather prediction by considering spatial shift of rainfall fields. KSCE J. Civ. Eng. 2018, 1–11. [Google Scholar] [CrossRef]
- Sadler, J.M.; Goodall, J.L.; Morsy, M.M.; Spencer, K. Modeling urban coastal flood severity from crowd-sourced flood reports using Poisson regression and random forest. J. Hydrol. 2018, 559, 43–55. [Google Scholar] [CrossRef]
- United States Environmental Protection Agency. Storm Water Management Model User’s Manual Version 5.0; EPA: Washington, DC, USA, 2010. [Google Scholar]
- Huff, F.A. Time distribution of rainfall in heavy storms. Water Resour. Res. 1967, 3, 1007–1019. [Google Scholar] [CrossRef]
- Yoon, Y.N.; Jung, J.H.; Ryu, J.H. Introduction of design flood estimation. J. Korea Water Resour. Assoc. 2013, 46, 55–68. [Google Scholar]
- Korea Precipitation Frequency Data Server. Available online: www.k-idf.re.kr (accessed on 27 June 2019).
- Lee, E.H.; Lee, Y.S.; Joo, J.G.; Jung, D.; Kim, J.H. Flood Reduction in Urban Drainage Systems: Cooperative Operation of Centralized and Decentralized Reservoirs. Water 2016, 8, 469. [Google Scholar] [CrossRef]
- Lee, E.H.; Lee, Y.S.; Joo, J.G.; Jung, D.; Kim, J.H. Investigating the Impact of Proactive Pump Operation and Capacity Expansion on Urban Drainage System Resilience. J. Water Resour. Plan. Manag. 2017, 143, 4017024. [Google Scholar] [CrossRef]
- Lee, E.H.; Kim, J.H. Design and Operation of Decentralized Reservoirs in Urban Drainage Systems. Water 2017, 9, 246. [Google Scholar] [CrossRef]
- Lee, E.H.; Kim, J.H. Development of Resilience Index Based on Flooding Damage in Urban Areas. Water 2017, 9, 428. [Google Scholar] [CrossRef]
- Lee, E.H.; Kim, J.H. Convertible Operation Techniques for Pump Stations Sharing Centralized Reservoirs for Improving Resilience in Urban Drainage Systems. Water 2017, 9, 843. [Google Scholar] [CrossRef]
- Han River Flood Control Office. Available online: www.hrfco.go.kr (accessed on 27 June 2019).
- Korea Meteorological Administration. Available online: www.kma.go.kr (accessed on 11 September 2017).
Figure 1.
Synthetic rainfall data generation process.

Figure 2.
Schematic of the four criteria.

Figure 3.
Improved flood nomograph flow diagram (with four criteria).

Figure 4.
Schematic of improved flood nomograph in flood forecasting.

Figure 5.
Geographical information and drainage network of Shincheon area.


Figure 6.
Geographical information and drainage network of Geoje area.


Figure 7.
Calibration and validation data.

Figure 8.
The generation process of improved flood nomograph.


Figure 9.
Application of the improved flood nomograph with historical rainfall data (Shincheon area).
Figure 9.
Application of the improved flood nomograph with historical rainfall data (Shincheon area).


Figure 10.
Application of the improved flood nomograph with historical rainfall data (Geoje area).


Figure 11.
Flooding stages of improved flood nomograph (Shincheon area).


Table 1.
Calibration parameters.
| Type | Subcatchments |
|---|---|
| Parameters | Width: 0–60 (m) |
| Percentage of slope: 0–100 (%) | |
| Percentage of impervious area: 0–100 (%) |
Table 2.
Summary of four criteria nodes.
(a) First flooding nodes.
| Duration (min) | Shincheon Area | Geoje Area | ||
|---|---|---|---|---|
| Node (Rainfall Amount) | Node (Rainfall Intensity) | Node (Rainfall Amount) | Node (Rainfall Intensity) | |
| 10 | 208 (22.5 mm) | 208 (135 mm/h) | GMH103 (30 mm) | GMH103 (180 mm/h) |
| 30 | 208 (25 mm) | 208 (50 mm/h) | GMH103 (46 mm) | GMH103 (92 mm/h) |
| 60 | 208 (31 mm) | 208 (31 mm/h) | GMH103 (86 mm) | GMH103 (86 mm/h) |
| 120 | 208 (46 mm) | 208 (23 mm/h) | GMH103 (130 mm) | GMH103 (65 mm/h) |
| 180 | 208 (62.1 mm) | 208 (20.7 mm/h) | MH30 (130 mm) | MH30 (43.3 mm/h) |
| 360 | 208 (114 mm) | 208 (19 mm/h) | MH30 (130 mm) | MH30 (21.7 mm/h) |
| 720 | 208 (222 mm) | 208 (18.5 mm/h) | MH30 (130 mm) | MH30 (10.8 mm/h) |
(b) Pipe water level 100% filled nodes.
| Duration (min) | Shincheon Area | Geoje Area | ||
|---|---|---|---|---|
| Node (Rainfall Amount) | Node (Rainfall Intensity) | Node (Rainfall Amount) | Node (Rainfall Intensity) | |
| 10 | 208 (21.7 mm) | 208 (130.4 mm/h) | GMH103 (27.2 mm) | GMH103 (163 mm/h) |
| 30 | 208 (23.4 mm) | 208 (46.8 mm/h) | GMH103 (37.7 mm) | GMH103 (75.3 mm/h) |
| 60 | 208 (29.6 mm) | 208 (29.6 mm/h) | GMH103 (71.3 mm) | GMH103 (71.3 mm/h) |
| 120 | 208 (43.2 mm) | 208 (21.6 mm/h) | GMH103 (102 mm) | GMH103 (51 mm/h) |
| 180 | 208 (58.5 mm) | 208 (19.5 mm/h) | MH30 (116.1 mm) | MH30 (38.7 mm/h) |
| 360 | 208 (110 mm) | 208 (18.3 mm/h) | MH30 (119.9 mm) | MH30 (20 mm/h) |
| 720 | 208 (215.6 mm) | 208 (18 mm/h) | MH30 (120.1 mm) | MH30 (10 mm/h) |
(c) Pipe water level 70% filled nodes.
| Duration (min) | Shincheon Area | Geoje Area | ||
|---|---|---|---|---|
| Node (Rainfall Amount) | Node (Rainfall Intensity) | Node (Rainfall Amount) | Node (Rainfall Intensity) | |
| 10 | 208 (19.8 mm) | 208 (119 mm/h) | GMH103 (21.2 mm) | GMH103 (119 mm/h) |
| 30 | 208 (21.2 mm) | 208 (42.3 mm/h) | GMH103 (33.3 mm) | GMH103 (66.5 mm/h) |
| 60 | 208 (25.1 mm) | 208 (25.1 mm/h) | GMH103 (58.3 mm) | GMH103 (58.3 mm/h) |
| 120 | 208 (35.8 mm) | 208 (17.9 mm/h) | GMH103 (86.3 mm) | GMH103 (43.1 mm/h) |
| 180 | 208 (47.6 mm) | 208 (15.9 mm/h) | GMH103 (98 mm) | GMH103 (32.7 mm/h) |
| 360 | 208 (87 mm) | 208 (14.5 mm/h) | MH30 (102.4 mm) | MH30 (17.1 mm/h) |
| 720 | 208 (168.4 mm) | 208 (14 mm/h) | MH30 (111.9 mm) | MH30 (9.3 mm/h) |
(d) Pipe water level 50% filled nodes.
| Duration (min) | Shincheon Area | Geoje Area | ||
|---|---|---|---|---|
| Node (Rainfall Amount) | Node (Rainfall Intensity) | Node (Rainfall Amount) | Node (Rainfall Intensity) | |
| 10 | 208 (14.6 mm) | 208 (87.6 mm/h) | GMH103 (18.8 mm) | GMH103 (113 mm/h) |
| 30 | 208 (15.4 mm) | 208 (30.7 mm/h) | GMH103 (25.6 mm) | GMH103 (51.2 mm/h) |
| 60 | 208 (17.3 mm) | 208 (17.3 mm/h) | GMH103 (36.3 mm) | GMH103 (36.3 mm/h) |
| 120 | 208 (23.9 mm) | 208 (11.9 mm/h) | GMH103 (57.2 mm) | GMH103 (28.6 mm/h) |
| 180 | 208 (31 mm) | 208 (10.3 mm/h) | GMH103 (70.8 mm) | GMH103 (23.6 mm/h) |
| 360 | 208 (55.4 mm) | 208 (9.2 mm/h) | MH30 (85.2 mm) | MH30 (14.2 mm/h) |
| 720 | 208 (98.3 mm) | 208 (8.2 mm/h) | MH30 (97.2 mm) | MH30 (8.1 mm/h) |
© 2019 by the authors. Licensee MDPI, Basel, Switzerland. This article is an open access article distributed under the terms and conditions of the Creative Commons Attribution (CC BY) license (http://creativecommons.org/licenses/by/4.0/).
Share and Cite
MDPI and ACS Style
Choo, Y.M.; Jo, D.J.; Yun, G.S.; Lee, E.H. A Study on the Improvement of Flood Forecasting Techniques in Urban Areas by Considering Rainfall Intensity and Duration. Water 2019, 11, 1883. https://doi.org/10.3390/w11091883
AMA Style
Choo YM, Jo DJ, Yun GS, Lee EH. A Study on the Improvement of Flood Forecasting Techniques in Urban Areas by Considering Rainfall Intensity and Duration. Water. 2019; 11(9):1883. https://doi.org/10.3390/w11091883
Chicago/Turabian StyleChoo, Yeon Moon, Deok Jun Jo, Gwan Seon Yun, and Eui Hoon Lee. 2019. "A Study on the Improvement of Flood Forecasting Techniques in Urban Areas by Considering Rainfall Intensity and Duration" Water 11, no. 9: 1883. https://doi.org/10.3390/w11091883
Note that from the first issue of 2016, this journal uses article numbers instead of page numbers. See further details here.