Long-Term Trends and Seasonality Detection of the Observed Flow in Yangtze River Using Mann-Kendall and Sen’s Innovative Trend Method


1
College of Hydraulic and Environmental Engineering, China Three Gorges University, Yichang 443002, China
2
Department of Petroleum, Koya Technical Institute, Erbil Polytechnic University, Erbil 44001, Kurdistan, Iraq
3
CERIS, Instituto Superior Tecnico, Universidade de Lisboa, Lisbon 1049-001, Portugal
4
Department of Environmental Engineering, College of Engineering, Knowledge University, Erbil 44001, Kurdistan, Iraq
5
School of Technology, IIia State University, 0162 Tbilisi, Georgia
*
Author to whom correspondence should be addressed.
Water 2019, 11(9), 1855; https://doi.org/10.3390/w11091855
Submission received: 28 July 2019
/
Revised: 31 August 2019
/
Accepted: 2 September 2019
/
Published: 5 September 2019
(This article belongs to the Section Hydrology)
Abstract
:Trend analysis of streamflow provides practical information for better management of water resources on the eve of climate change. Thus, the objective of this study is to evaluate the presence of possible trends in the annual, seasonal, maximum, and minimum flow of Yangtze River at Cuntan and Zhutuo stations in China for the period 1980 to 2015. The assessment was carried out using the Mann–Kendall trend test, and the innovative trend analysis, while Sen’s slope is used to estimate the magnitude of the changes. The results of the study revealed that there were increasing and decreasing trends at Cuntan and Zhutuo stations in different months. The mean annual flow was found to decrease at a rate of −26.76 m3/s and −17.37 m3/s at both stations. The minimum flow was found to significantly increase at a rate of 30.57 m3/s and 16.37 m3/s, at a 95% level of confidence. Maximum annual flows showed an increasing trend in both regions of the Yangtze River. On the seasonal scale, the results showed that stations are more sensitive to seasonal flow variability suggesting a probable flooding aggravation. The winter season showed an increasing flow trend, while summer showed a decreasing trend. The spring flow was found to have an increasing trend by the Mann–Kendall test at both stations, but in the Zhutuo Station, a decreasing trend was found by way of the innovative trend analysis method. However, the autumn flow indicated a decreasing trend over the region by the Mann–Kendall (MK) test at both stations while it had an increasing trend in Cuntan by the innovative trend analysis method. The result showed nonstationary increasing and decreasing flow trends over the region. Innovative trend analysis method has the advantage of detecting the sub-trends in the flow time series because of its ability to present the results in graphical format. The results of the study indicate that decreasing trends may create water scarcity if proper adaptation measures are not taken.
1. Introduction
Recently, the sharp increase in greenhouse gases emissions has resulted in a rise in temperature over many regions around the world [1,2,3]. The increasing temperature has induced various hydro-climatological hazards with lots of socio-economic consequences [4,5,6]. It has been observed that increasing temperature has altered the patterns of precipitation, which is one of the essential components of the global hydrologic cycle [7,8,9,10]. The changing trends have direct impacts on the river flow, and river flows are also found to be very sensitive with minor changes in the precipitation patterns [11,12,13]. The construction of hydraulic structures, notably dams and large weirs, can also be a significant cause of the streamflow reduction [3,14,15]. Thus, it is imperative and necessary to evaluate the trends in the river flow for sustainable development in water resources and in the same time maintaining adequate environmental flows releases downstream of the hydraulic structures [16,17].
Several authors reported that the trend assessment of streamflow is an essential analysis to make long-term water management plans, particularly with regards to water supply and hydropower production from water systems [18,19]. Streamflow data are regularly recorded and utilized for the planning and management of water resources [12,18,19,20]. In this regard, a review of the literature revealed that several studies are conducted to understand the changing characteristics of flow using river flow data around the world, including China [21,22,23].
China, located in Asia, is considered to be a hotspot for climate change [24,25,26]. Cao, Yan, Zhao, Zhu, Yu, Tang and Jones [25] reported that surface temperature over many stations of China’s mainland has increased by 0.26 °C ± 0.04 °C/decade from 1951 to 2017. Additionally, Wang and Chen [27] reported that the temperature of China would grow at a rate of 0.8 to 3.3 °C per three decades under RCP4.5 and RCP8.5 scenarios. Consequently, it can, that changing patterns of temperature will change the patterns of precipitation, which in turns impact the water resources of China. Therefore, it is crucial to evaluate the trends in the major rivers of the country. The Yangtze River of China is the longest river which is monitored by several stream gauges over the country [28]. The river is known to be the backbone for water resources and enhancing the economy of the country [29,30]. The river is found to experience the negative impacts of climate in the form of flash floods and droughts as well [29,31,32]. It is also observed that the effect of the river varies over distance and time [10]. In this study, the trends in the flow of the river at Cuntan and Zhutuo stations are assessed. Both stations are selected because of their location and availability of data over a longer period (≥30 years).
Several approaches are available in the literature for the assessment of the trends. However, the Sen slope estimator [33] and the Mann–Kendall (MK) trend test [34] are most widely used for hydrological trend analysis [35,36,37]. These non-parametric methods have several advantages such as the handling of missing data, the requirement of few assumptions, and independence of the data distribution [38,39,40]. However, the major drawback of the method is the influence of autocorrelation in data on its test significance. Several modifications in the MK test have been proposed to remove the influence of autocorrelation through pre-whitening of data [41,42,43,44]. However, recent studies have suggested that those are not sufficient enough to exclude the effect of long-term dependency on the data series on MK trend significance [45,46]. Besides, change in land use, and some earth-atmospheric phenomena often cause a localized change in climate and streamflow, which does not continue for a long [47,48]. Therefore, the trends estimated by the MK test may not always be the unidirectional trend.
Innovative trend analysis (ITA) proposed by Şen [33] is a non-parametric method which does not depends on data distribution, autocorrelation and length of data series. [34]. The ITA method allows robust estimation of the trend by ignoring the seasonal cycle and the length of time series. Besides, it allows examination of any hidden sub-trends present in the series. Thus, the ITA method can be used for estimation of a monotonic trend present in the time series which persist with time. The method has been widely applied in different studies around the world in recent years. Tabari, et al. [35] applied ITA along with the Mann–Kendall (MK) test to detect the trends in streamflow over eight stations in the north-west of Iran. Demir and Kisi [36] used ITA with MK to understand the direction of trends in the annual rainfall over several stations located in six provinces of Turkey. Dabanlı et al. [37] applied ITM and MK to assess the direction of trends in several variables such as relative humidity, temperature, rainfall, and runoff variables in Ergene Basin, Turkey. Öztopal and Şen [38] applied the ITA method for examining the rainfall trend at seven stations in Turkey. In another study, Tosunoglu and Kisi [34] assessed the trends in annual maximum duration and maximum yearly severity in Coruh River Basin, Turkey using ITA and MK test. Wu and Qian [39] evaluated the direction of trends using ITA, MK and linear regression using annual and seasonal rainfall rain gauges data of 14 stations located in Shaanxi Province, China. The review of the literature revealed that even ITA had been used in different studies; its application over China is still at infancy. Furthermore, the literature review revealed that no study had been published on analyzing the streamflow trend in the Yangtze River (Cuntan and Zhutuo stations) by the ITA method [34,40,41,42]. The trend estimated in the flow of Yangtze River using the MK test in the previous studies may be due to the variability (autocorrelations and cycles) in time series which may not persist for the long-run. Assessment of the unidirectional trend in river flow due to the changes in the environment is significant for long-term development and planning of water resources. The unidirectional trend in the streamflow of the Yangtze River estimated in this study using the ITA method by removing the influence of autocorrelations and cycles in the series can provide better understanding of the effect of environmental changes on Yangtze River flow and reliable management of the river basin.
The main objective of this study is to detect the trends in the long-term flow (monthly, annual, maximum, and minimum flows) of Yangtze River at Cuntan and Zhutuo stations using the innovative trend method. The obtained results using innovative trend method is compared with that obtained using the Mann–Kendall trend test. The paper is organized as follows: Section 2 shows information about the case study and datasets; Section 3 presents the applied methodology; Section 4 presents the main results, discussion, and interpretation of main results. Finally, the main concluding remarks achieved in this study are presented in Section 5.
2. Case Study and Datasets
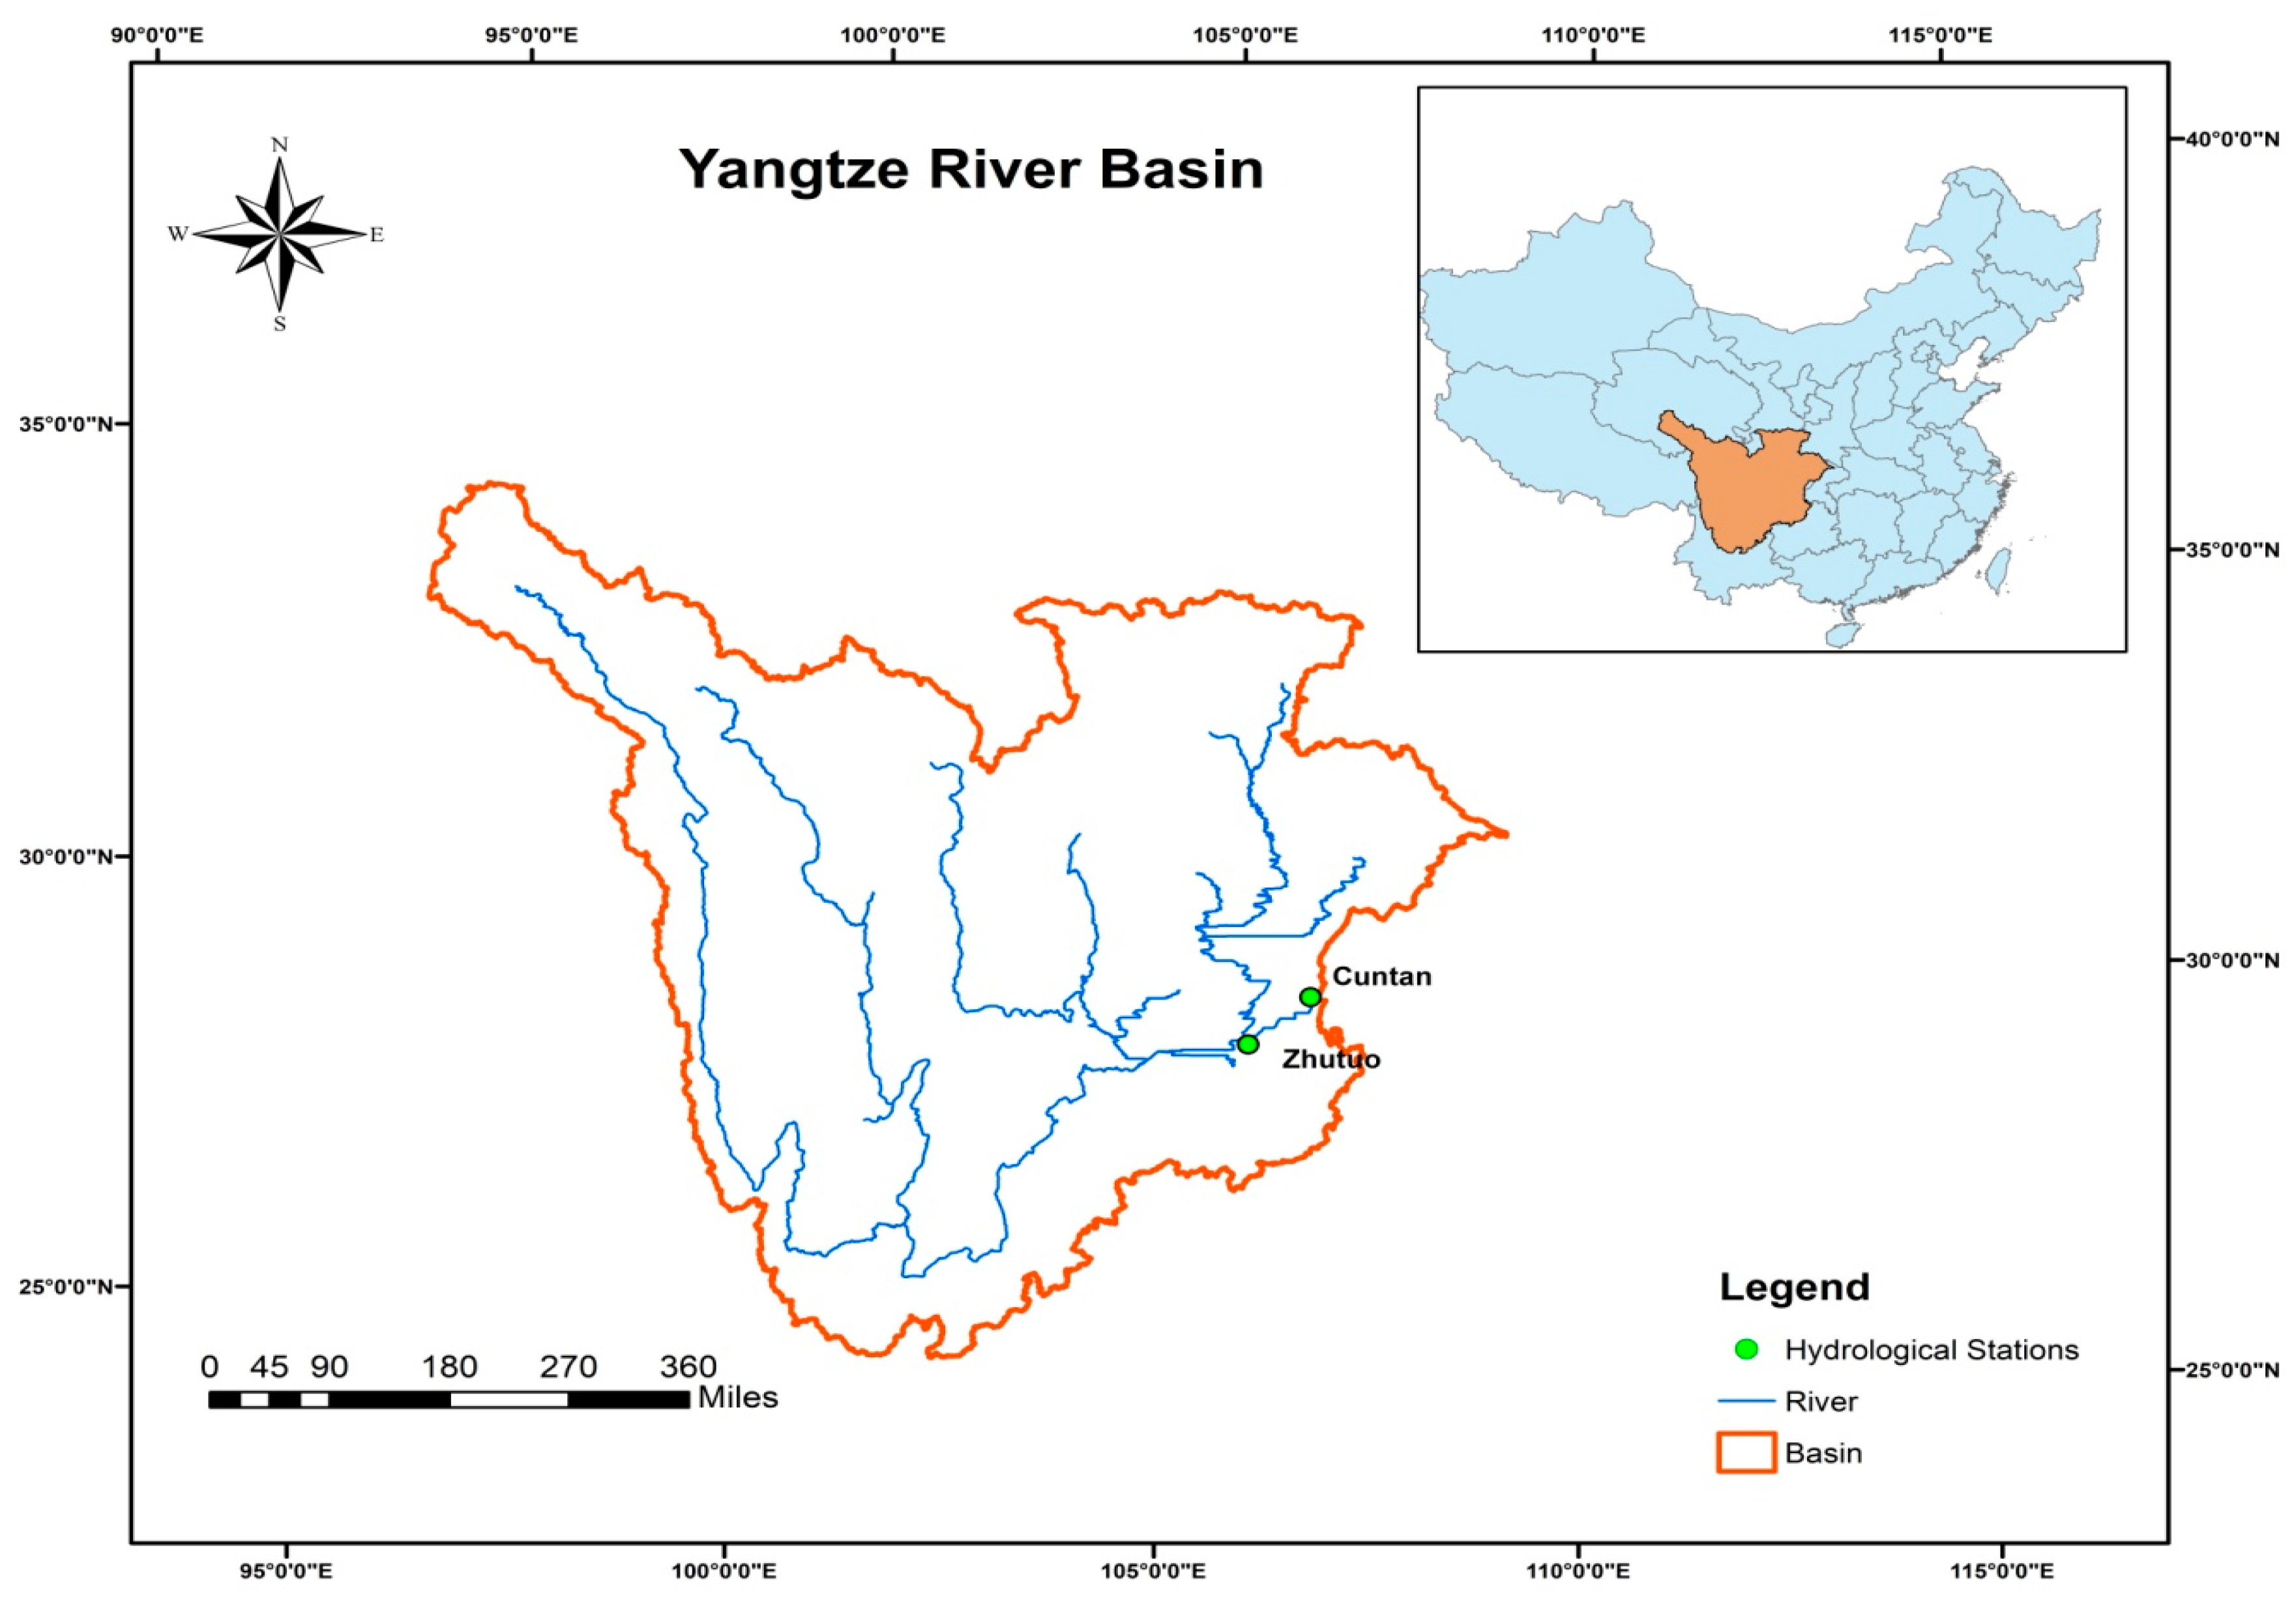
China is blessed with an abundant number of rivers flowing from north to south, including the Yangtze River, among others. The Yangtze River is one of the longest rivers around the world, which collects water from several catchments [43]. The flow is monitored through several gauges along the river [44]. The Yangtze River covers one-fifth of the entire country with a region of about 1.8 million km2. The mean annual precipitation over the basin varies from 300 to 500 mm in the western, 1600 to 1900 mm in the south-eastern sides. On the other hand, the mean annual temperature varies from 19 to 15 °C, individually [45]. The Yangtze River basin supplies about half of the wild animal and plant species and 40% of freshwater resources of the country [46].
Yangtze River has several monitoring stations, in this study, the trends in the streamflow recorded at Cuntan (Long. 106.60, Lat. 29.62) and Zhutuo (Long. 105.849, Lat. 29.01533) stations are considered. Both stations are considered due to their prime location and availability of data over a longer period. The locations of the stations are shown in Figure 1. The daily streamflow data for both stations were collected from the hydrological data center of the Ministry of Water Resources in China from 1980 to 2015, considering enough for trend analysis [44].
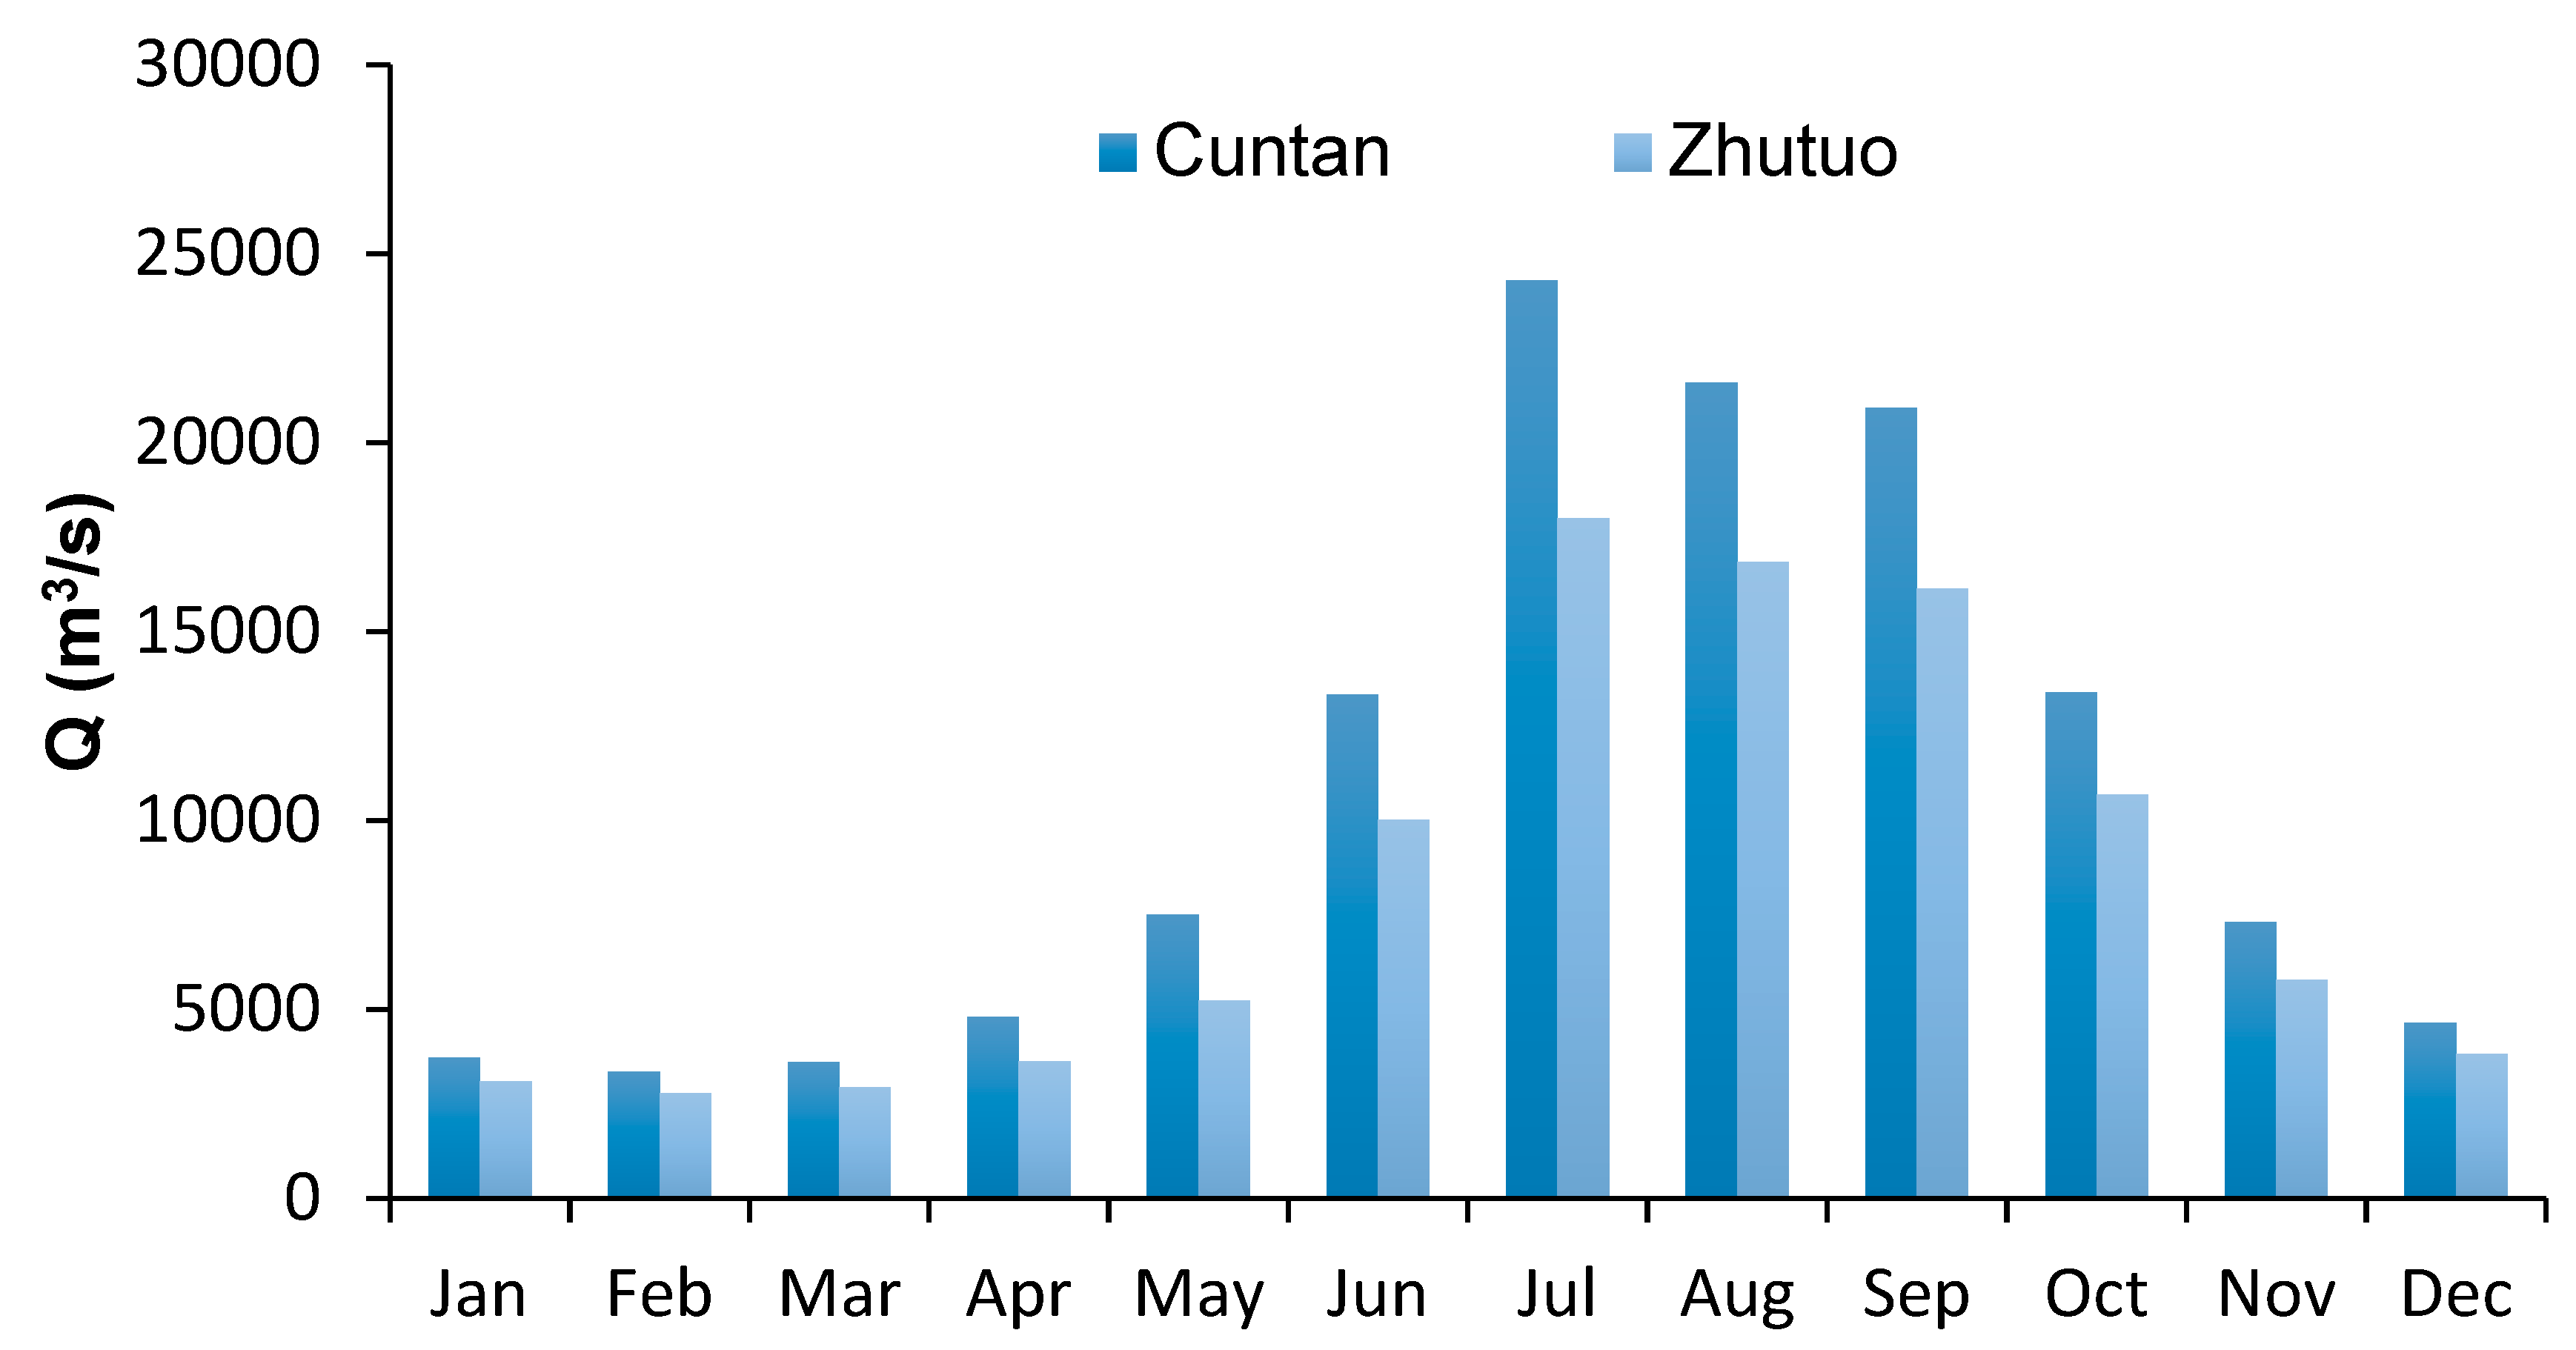
The seasonal distributions of monthly flow recorded at Cuntan and Zhutuo stations are presented in Figure 2.
Both stations have quite similar flow patterns. However, the flow over Cuntan station is higher than Zhutuo station. It can be observed that the highest flow occurred during July where the flow is recorded about 13,300 m3/s and 10,000 m3/s at Cuntan and Zhutuo stations respectively. On the other hand, the lowest flow occurs in February where the flow was recorded about 3350 m3/s and 2800 m3/s at Cuntan and Zhutuo stations respectively. The figure shows that flow is low in December, January, February, and March while relatively starts increasing from April to July. After reaching its peak in July, it decreases. The highest increase in flow during July is due to high precipitation over the region during that season.
3. Methodology
The streamflow data at Cuntan and Zhutuo were collected from the hydrological data center of the Ministry of Water Resources in China. The quality of the data was visually and statistically assessed. The distribution of streamflow data was assessed using gamma, generalized extreme value, and normal probability distribution functions (PDFs). The Sen’s slope test was then applied to estimate the change in streamflow in each month at both the stations. MK and ITM were applied to confirm the significance of the changes. Finally, the results obtained using the MK and ITM methods were compared. Details of the methods used are given in following sub-sections.
3.1. Distributional Analysis
The streamflow data were fitted with PDFs to understand the nature of the data. Several frequency distributions are available in the literature, and they are widely used to assess data behavior. In this study, gamma, generalized extreme value, and normal distributions were used to fit the river flow data, that are frequently applied in hydro-climatic studies are applied to the datasets of Zhutuo and Cuntan stations. The gamma and generalized extreme value are commonly used for skewed data while normal distribution is used in many cases; monthly data series generally follows a normal distribution [47]. Kolmogorov–Smirnov (KS) test is used for goodness of fit, which is a powerful test as compared to other tests to evaluate the goodness of fit Anderson–Darling and Chi-square test [47]. Thus, the test was applied on a single month, mean flow, annual maximum flow, and minimum yearly flow at a 95% level of confidence. The null hypothesis (H0) of the KS test is that the data follows the specified distribution, while the alternate hypothesis (H1) is that data is not following the specified distribution.
3.2. Estimation of Magnitude of Change
The Sen’s slope method [48] was used for the estimation of the change in annual and monthly streamflow for the period 1980–2015. The Sen’s slope (β) is calculated as the median of all the slopes estimated between all the successive data points of a river flow time series (x) as:
where, ∆y is the change in river flow due to the change in time, ∆t between two subsequent streamflow data. The Sen’s slope is a non-parametric method which has been found highly reliable for estimation of change over time [49,50,51,52].
3.3. Mann–Kendall Trend Test
There are several trend assessments approaches available in the literature. However, the Mann–Kendall test is the most widely used test for assessing the trends in hydro-climatic studies [18,52,53,54,55,56]. The Mann–Kendall test [57] which is recommended by the World Meteorological Organization (WMO) often used as because it has several advantages: It does consider the data distribution, and it can cope with the outliers [58,59,60,61]. Mann–Kendall test statistics (S) for river flow can be calculated using Equation (4). In Equation (2), n represent the sample size, whereas and are sequential data in series.
where, and are sequential data in the series and
The variance of S is estimated as,
whereas tp defines the ties of the pth value, and q represents the number of the tied value. The standardized test static for the Mann–Kendall test (Z) can be calculated, as shown in Equation (5):
The sign of Z indicates the direction of the trend. The negative value of Z indicates a decreasing trend and vice versa. At the 5% significance level, the null hypothesis of no trend is rejected if the absolute value of Z is higher than 1.64. The significance of the change in monthly and annual streamflow was estimated using the MK test.
3.4. Innovative Trend Analysis (ITA) Method
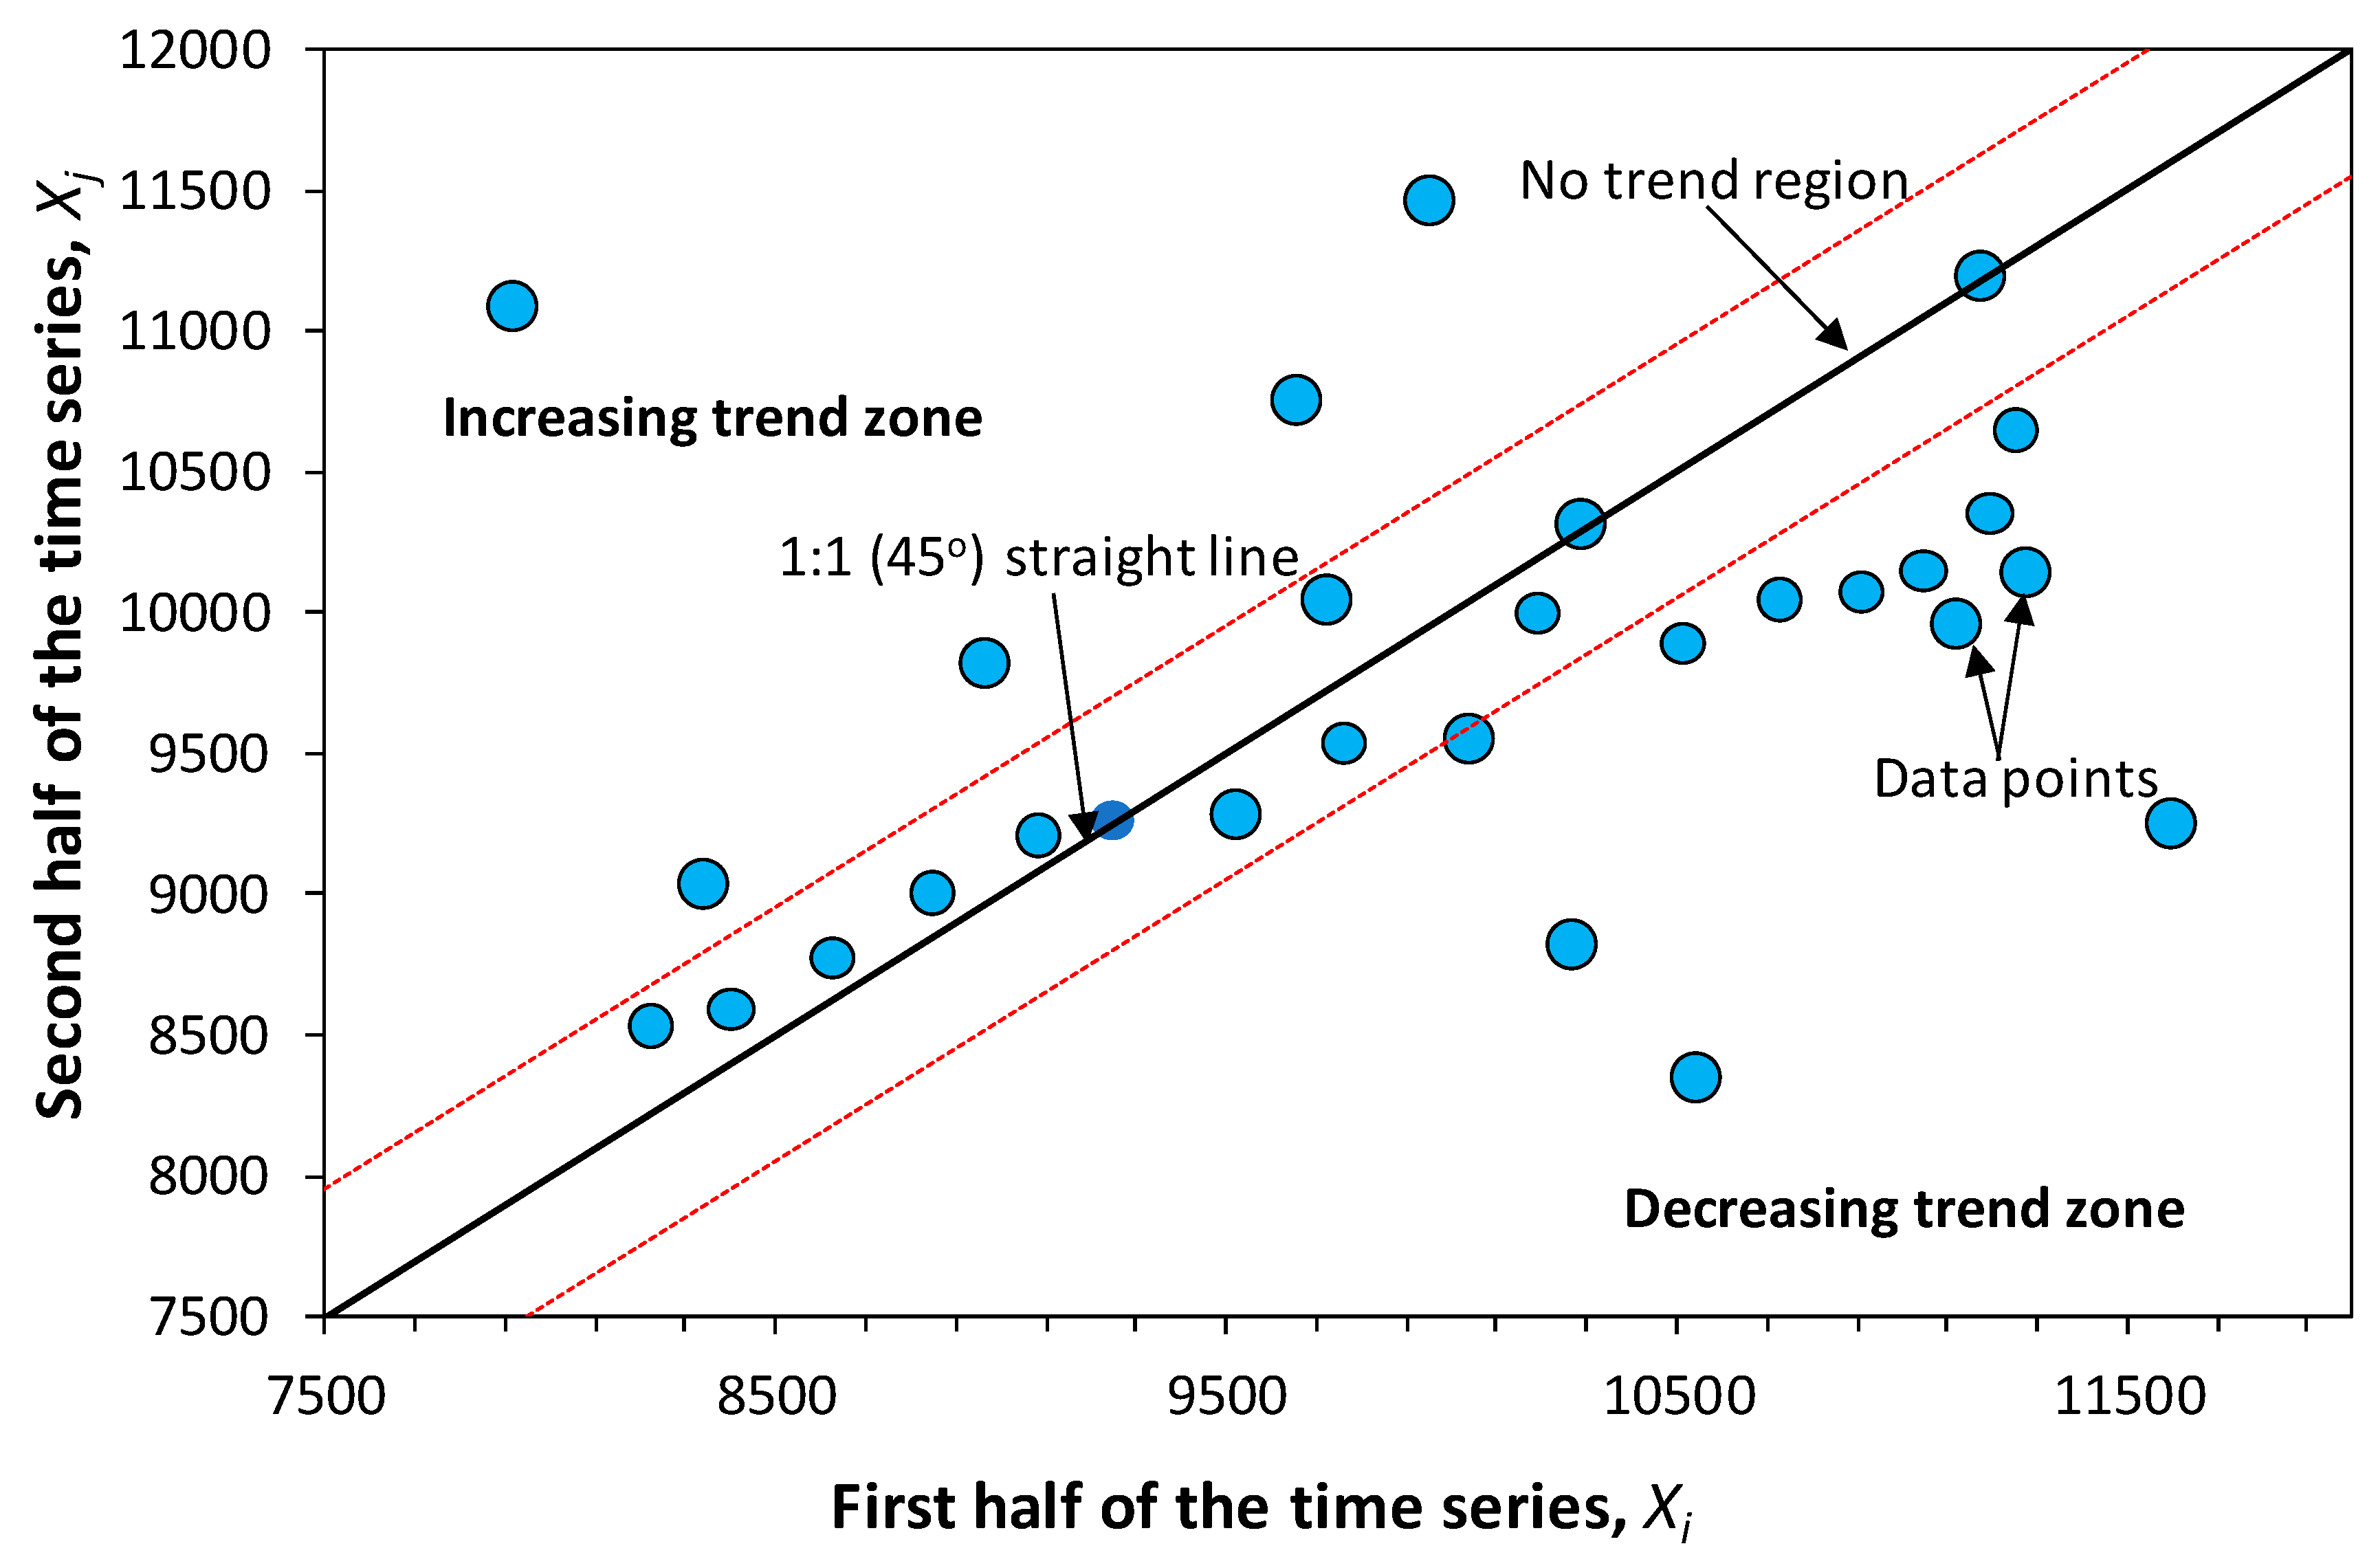
The concept of ITA was initially proposed by Şen [62] for the detection of trends in time series. In this method, data are equally divided into two segments between first dates to the last date. Both segments are arranged in ascending order and presented in the X and Y-axis. The first segment (Xi: i = 1, 2, …, n/2) is presented in the horizontal axis while the second segment (Xj: j = n/2 + 1, n/2 + 2, …, n) is presented in vertical axis in the Cartesian coordinate system. A bisector line at 1:1 (45°) divides the diagram into two equal triangles (Figure 3). The upper triangle represents an increasing trend, while a lower one indicates a decreasing trend. For the estimation of the trend, the statistic is computed as follows [49]:
where is the slope base on the ITA method, n is the sample size, and are the mean value of the first and second half of the series, respectively.
The null hypothesis (H0) of no significant trend cannot be rejected if the calculated slope value, s, remains below a critical value, . While the alternative hypothesis (Ha) of the presence of a significant trend in time series is applicable if . The probability density function (PDF) of the null hypothesis is required to derive from calculating the test significance. If the confidence limits of a standard normal PDF with zero mean and the standard deviation is at a significance level of α, the confidence limits (CL) of the trend slope is:
where is the slope standard deviation.
The details of the test can be found in Şen [33]. In this study, the significance of the change in monthly and annual streamflow was estimated using ITA. In the present study, the ITA method was applied at 10% significance levels considering the rarity of significant change in streamflow.
4. Results and Discussions
4.1. Distributional Analysis
Gamma, generalized extreme value and normal distribution were applied to investigate the fitting of the data. The methods were applied on monthly, mean annual, annual maximum and annual minimum flow. Fitness of data was evaluated using the data of both stations at a 95% level of confidence. The results are presented in Table 1. Considering 36 years (1980–2015) of streamflow data, the null hypothesis was rejected when the KS test statistics was more than 0.232. Bold figures in the table represent the rejected hypothesis at the 95% level of confidence, while values in italics indicate the best fit. As can be seen in Table 1, the null hypothesis was accepted for most of the months in all tests. In the Cuntan station, all data were found to follow the gamma and generalized extreme value distributions, while the null hypothesis was rejected in November for the generalized extreme value distribution. On the other hand, for Zhutuo Station, all data were found to follow the generalized extreme value distribution. Overall, the generalized extreme value was found to have the best fit for both stations data.
Both parametric and non-parametric methods are used for the assessment of trends. Parametric methods are more reliable compared to the non-parametric method. However, parametric methods are applicable only when the data is normally distributed. Distribution analysis of streamflow data at both stations revealed that none of them is normally distributed, which means parametric methods cannot be used for assessment of trends. Therefore, non-parametric methods (MK and ITA) were used for the assessment of trends in the present study.
4.2. Mann–Kendall Trends Analysis
The Sen’s slope and Mann Kendall trend test were individually applied at Cuntan and Zhutuo stations. The tests were applied at each month, annual mean, annual maximum, annual minimum, and seasonal flows for the period 1980 to 2015 at 90%, 95% and 99% confidence levels. The obtained results are presented in Table 2. Results show that there are positive (increasing) and negative (decreasing) trends in both stations. The highest negative trend can be seen in October while the highest positive trend can be seen in January at both stations.
The trends in annual mean at both stations revealed that flow is decreasing. However, the non-significant decrease is found relatively higher in Zhutuo compared to Cuntan. As the annual mean, maximum flow also shows a non-significantly decreasing trend. On the other side, mean minimum flow indicates significantly increasing trend (at a 0.99 confidence level) at a rate of 30.57 m3/s at Cuntan and a rate of 16.37 m3/s at Zhutuo stations. Spring season has an increasing trend, but it is not significant, while the autumn season has a significantly decreasing trend at the 90% confidence level. The autumn is decreased in both stations at a 99% level of confidence. Both stations show a significant increase in minimum and winter flow at a 99% level of confidence.
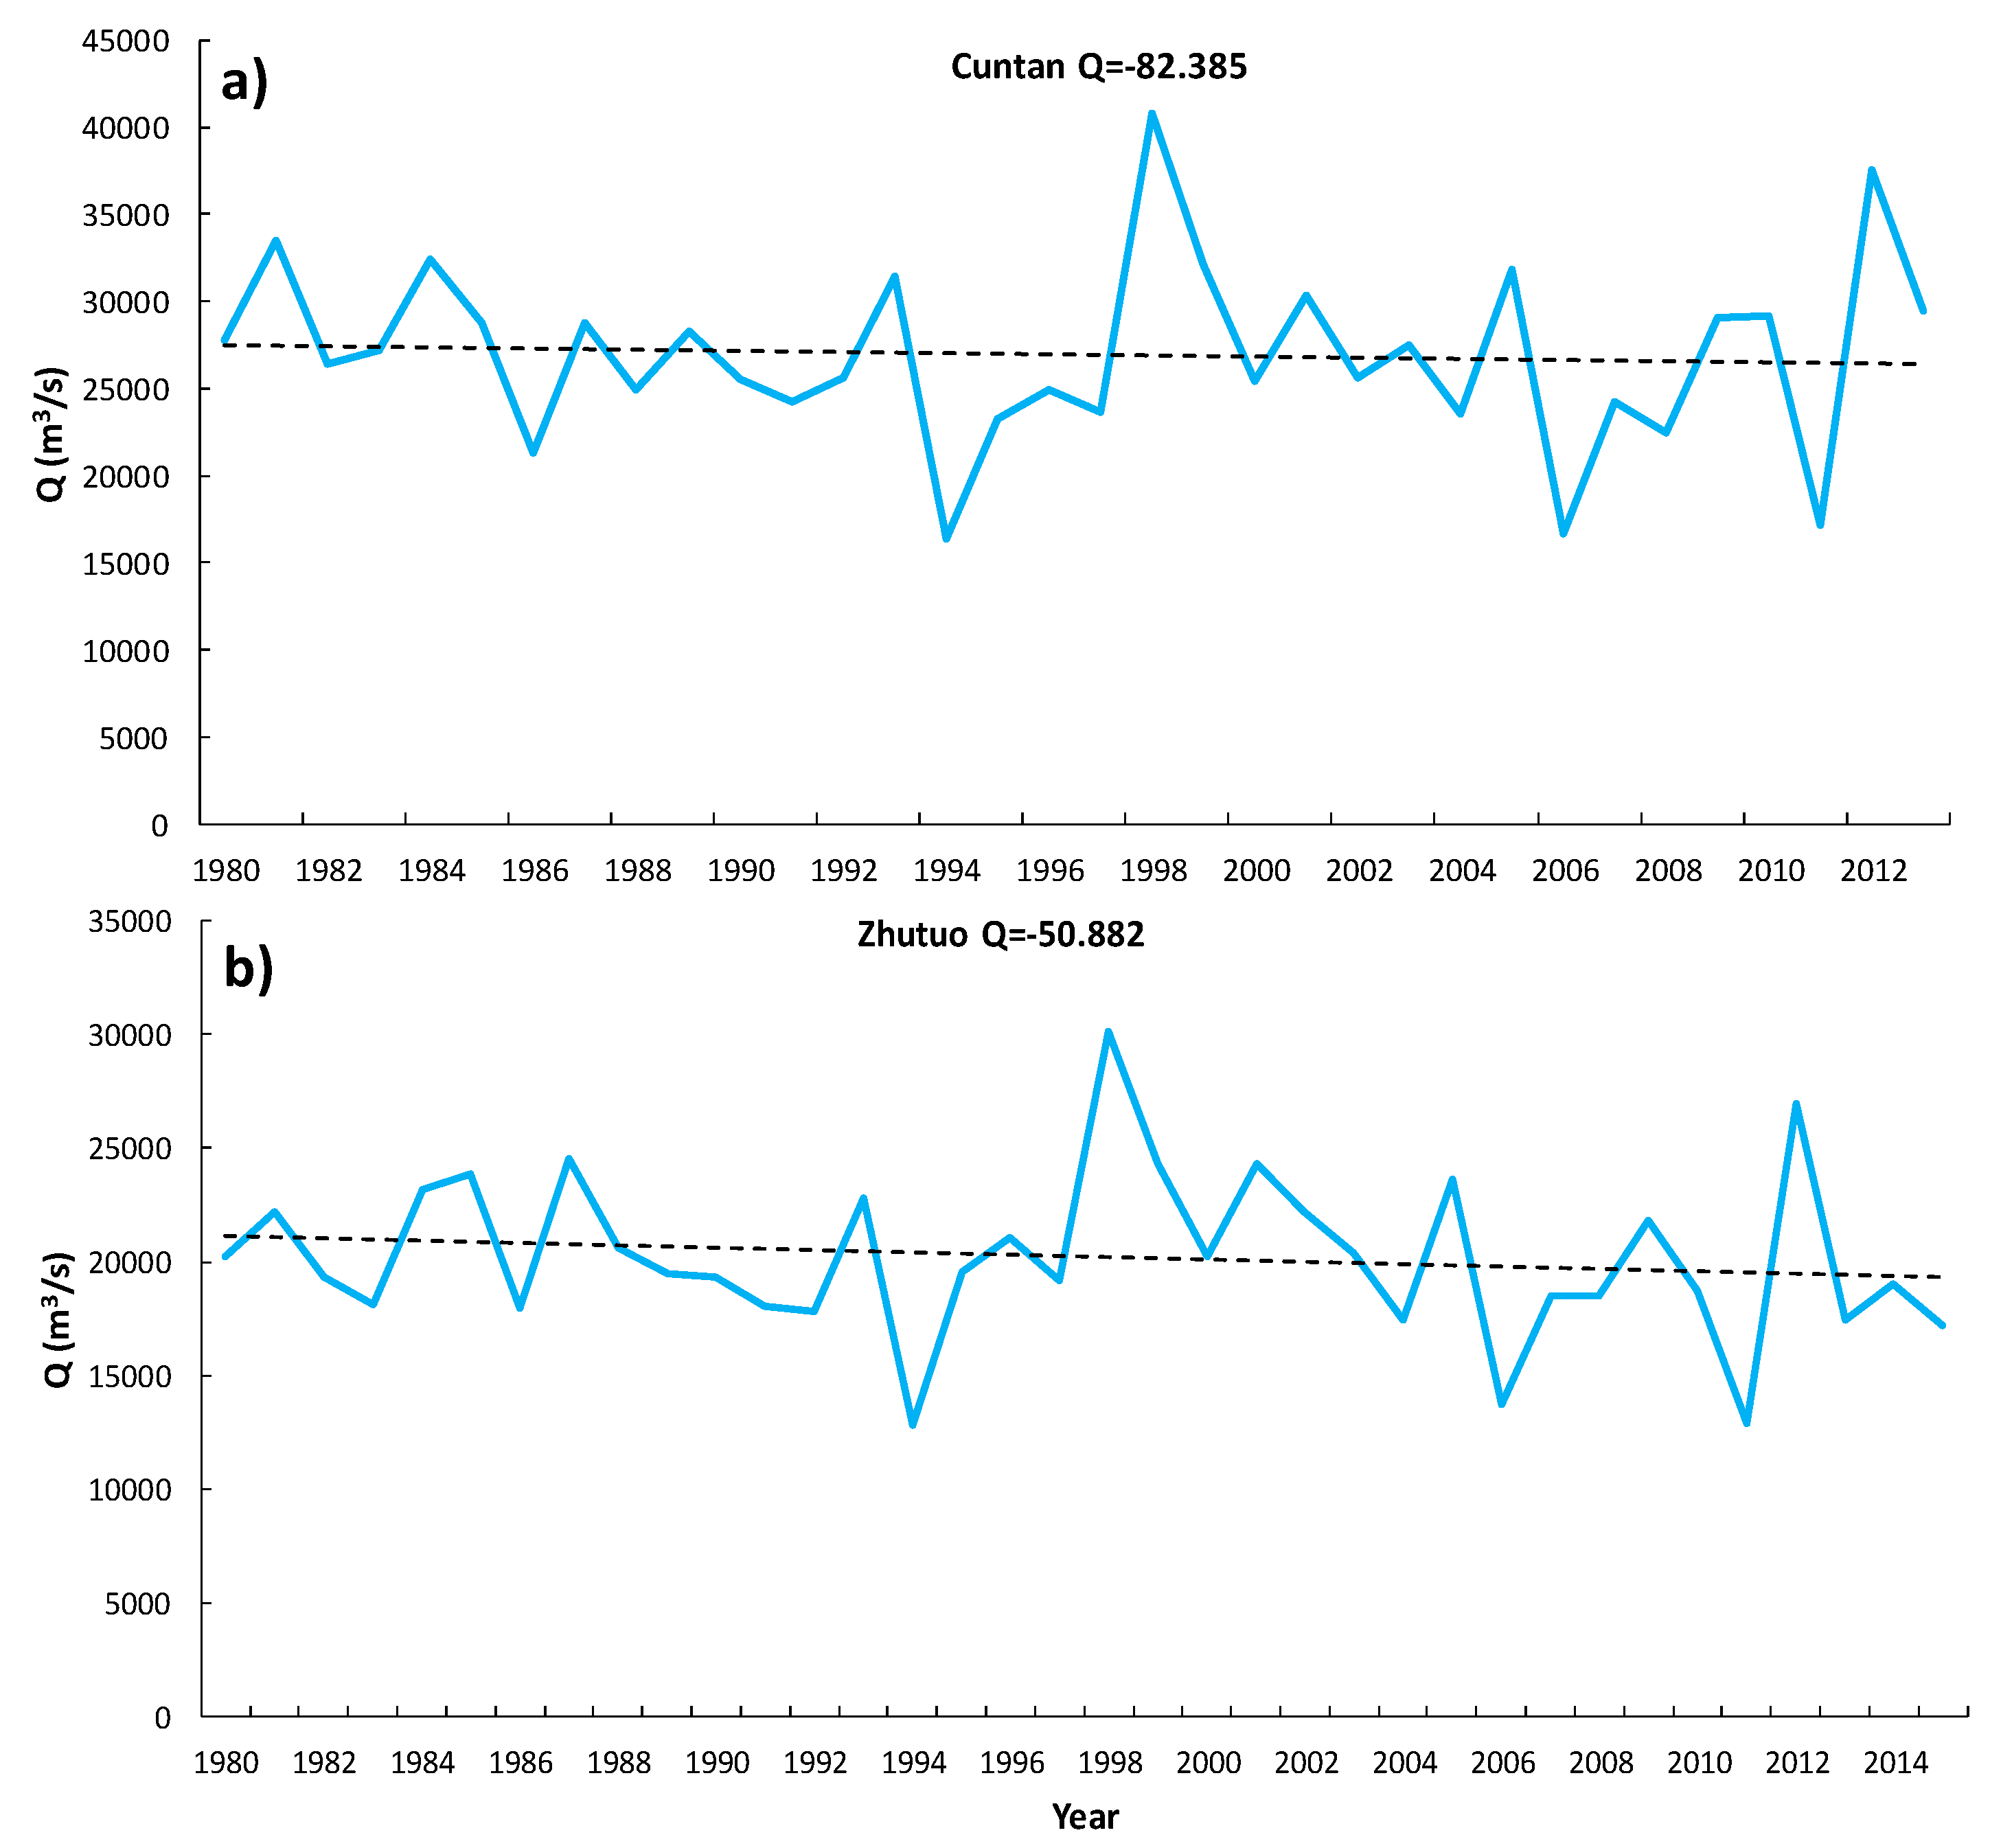
The trends in maximum flow assessed at the Cuntan and Zhutuo stations are shown in Figure 4. The trends were assessed based on the maximum flow recorded for each year. The figure shows that flow has a decreasing trend in both stations. The trend estimated using Sen’s slope shows a negative change of −82.385 m3/s/year for the Cuntan, while the Mann–Kendall trend test did not show significance trend at the 90%, 95% or 99% confidence levels. Zhutuo Station also shows a decreasing trend with a rate of −50.882 m3/s while the Mann–Kendall did not detect any significant trend for this station.
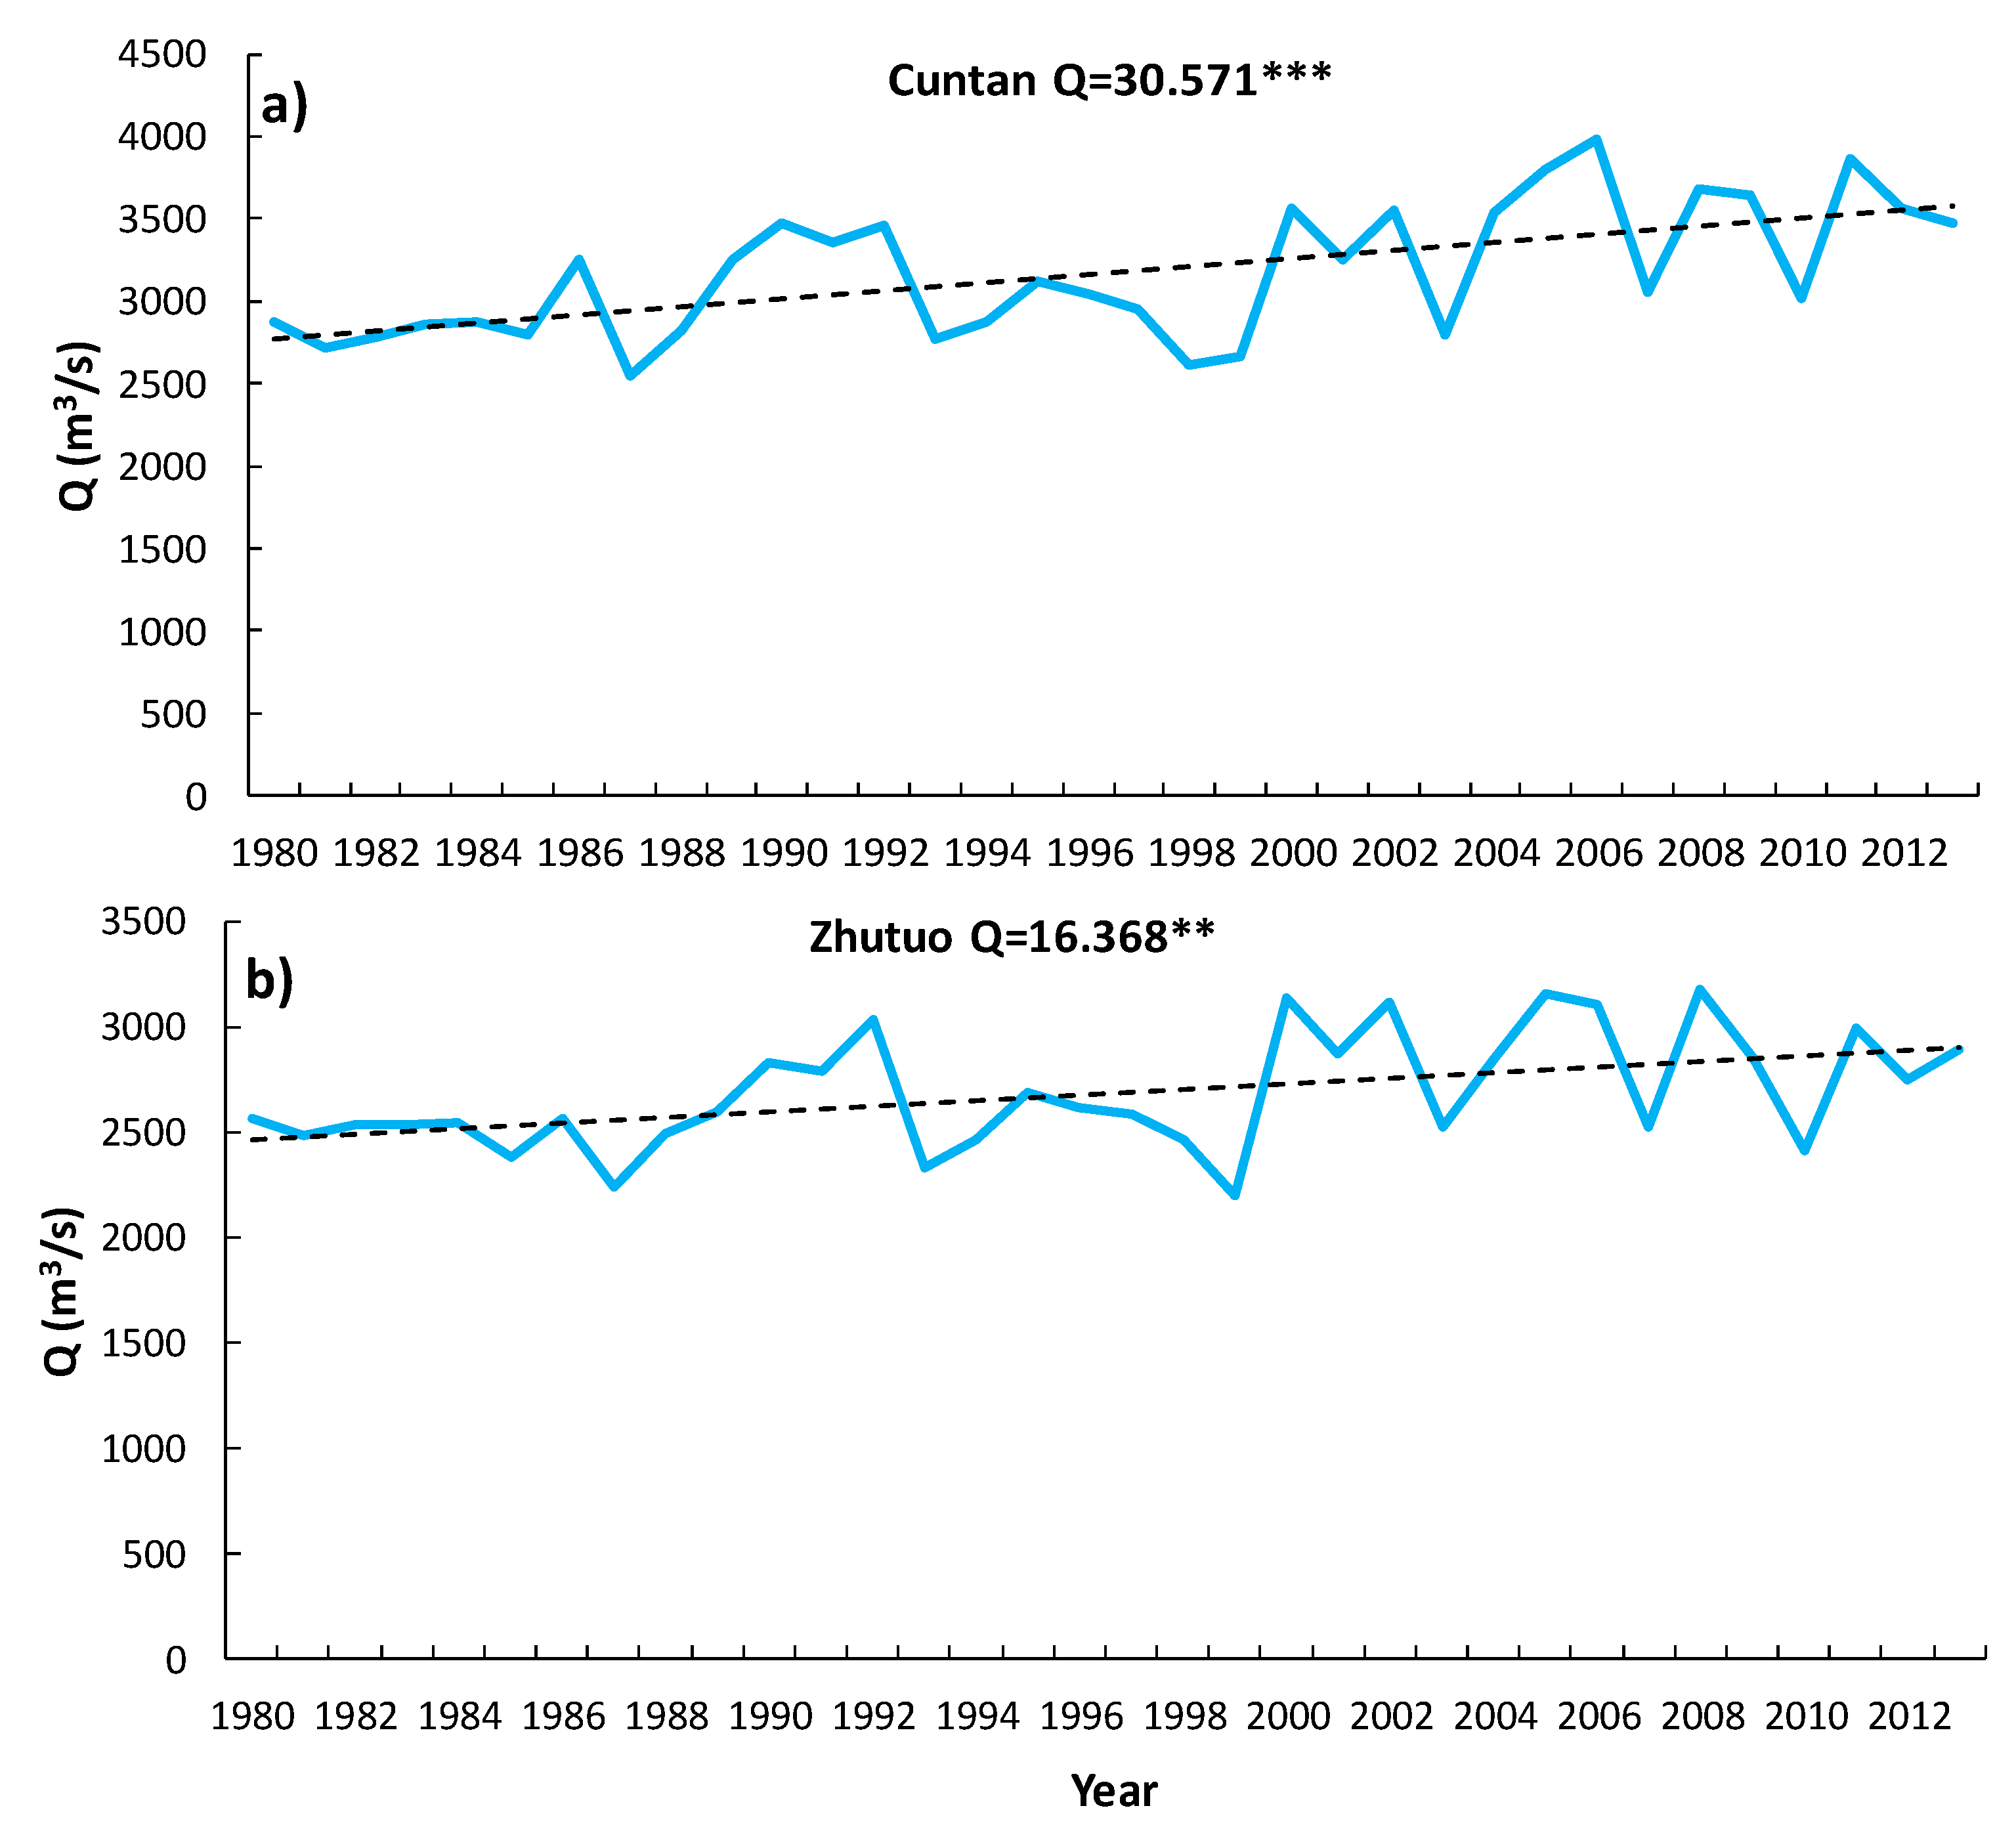
The trends in the minimum flow in both stations were also assessed. The assessment was performed based on the minimum values recorded each year. The obtained results are displayed in Figure 5. The figure clearly shows that there is an increase in flow in both stations. However, the increase is relatively higher for Cuntan Station. The Sen’s slope estimated a positive change of 30.571 m3/s. Similar to the Cuntan Station, the Zhutuo Station also showed a positive change of 16.368 m3/s. The change in the Zhutuo station was found to be significant at the 90% confidence level. According to the Mann–Kendal test, a significantly increasing trend was detected at the 99% confidence level for both stations. It is also important to note that the minimum flow was higher in the Cuntan compared to that of the Zhutuo Station. This could be due to the location of the Cuntan downstream.
4.3. Innovative Trend Analysis (ITA) Method
ITA, MK and Sen’s slope were applied to annual and seasonal scale (i.e., summer, autumn, winter, and spring), flow series for Cuntan and Zhutuo stations (Table 3). The results showed that there are some discrepancies with regards to ITA, MK and Sen’s slope. For example, in annual series, ITA showed a positive trend at Cuntan station while MK and Sen’s slope showed a negative trend, but in Zhutuo all the methods showed a negative trend. Similarly, in summer, ITA showed a positive and no trend for the Zhutuo and Cuntan while MK and Sen’s slope showed a negative trend in both stations. However, spring, autumn and winter have a similar type of trend in both stations. It can also be observed that there are significant differences in the values of all methods. For example, in winter, ITA has a value of 0.99 while MK showed 3.99 and Sen’s slope gave 23.5 at Cuntan Station.
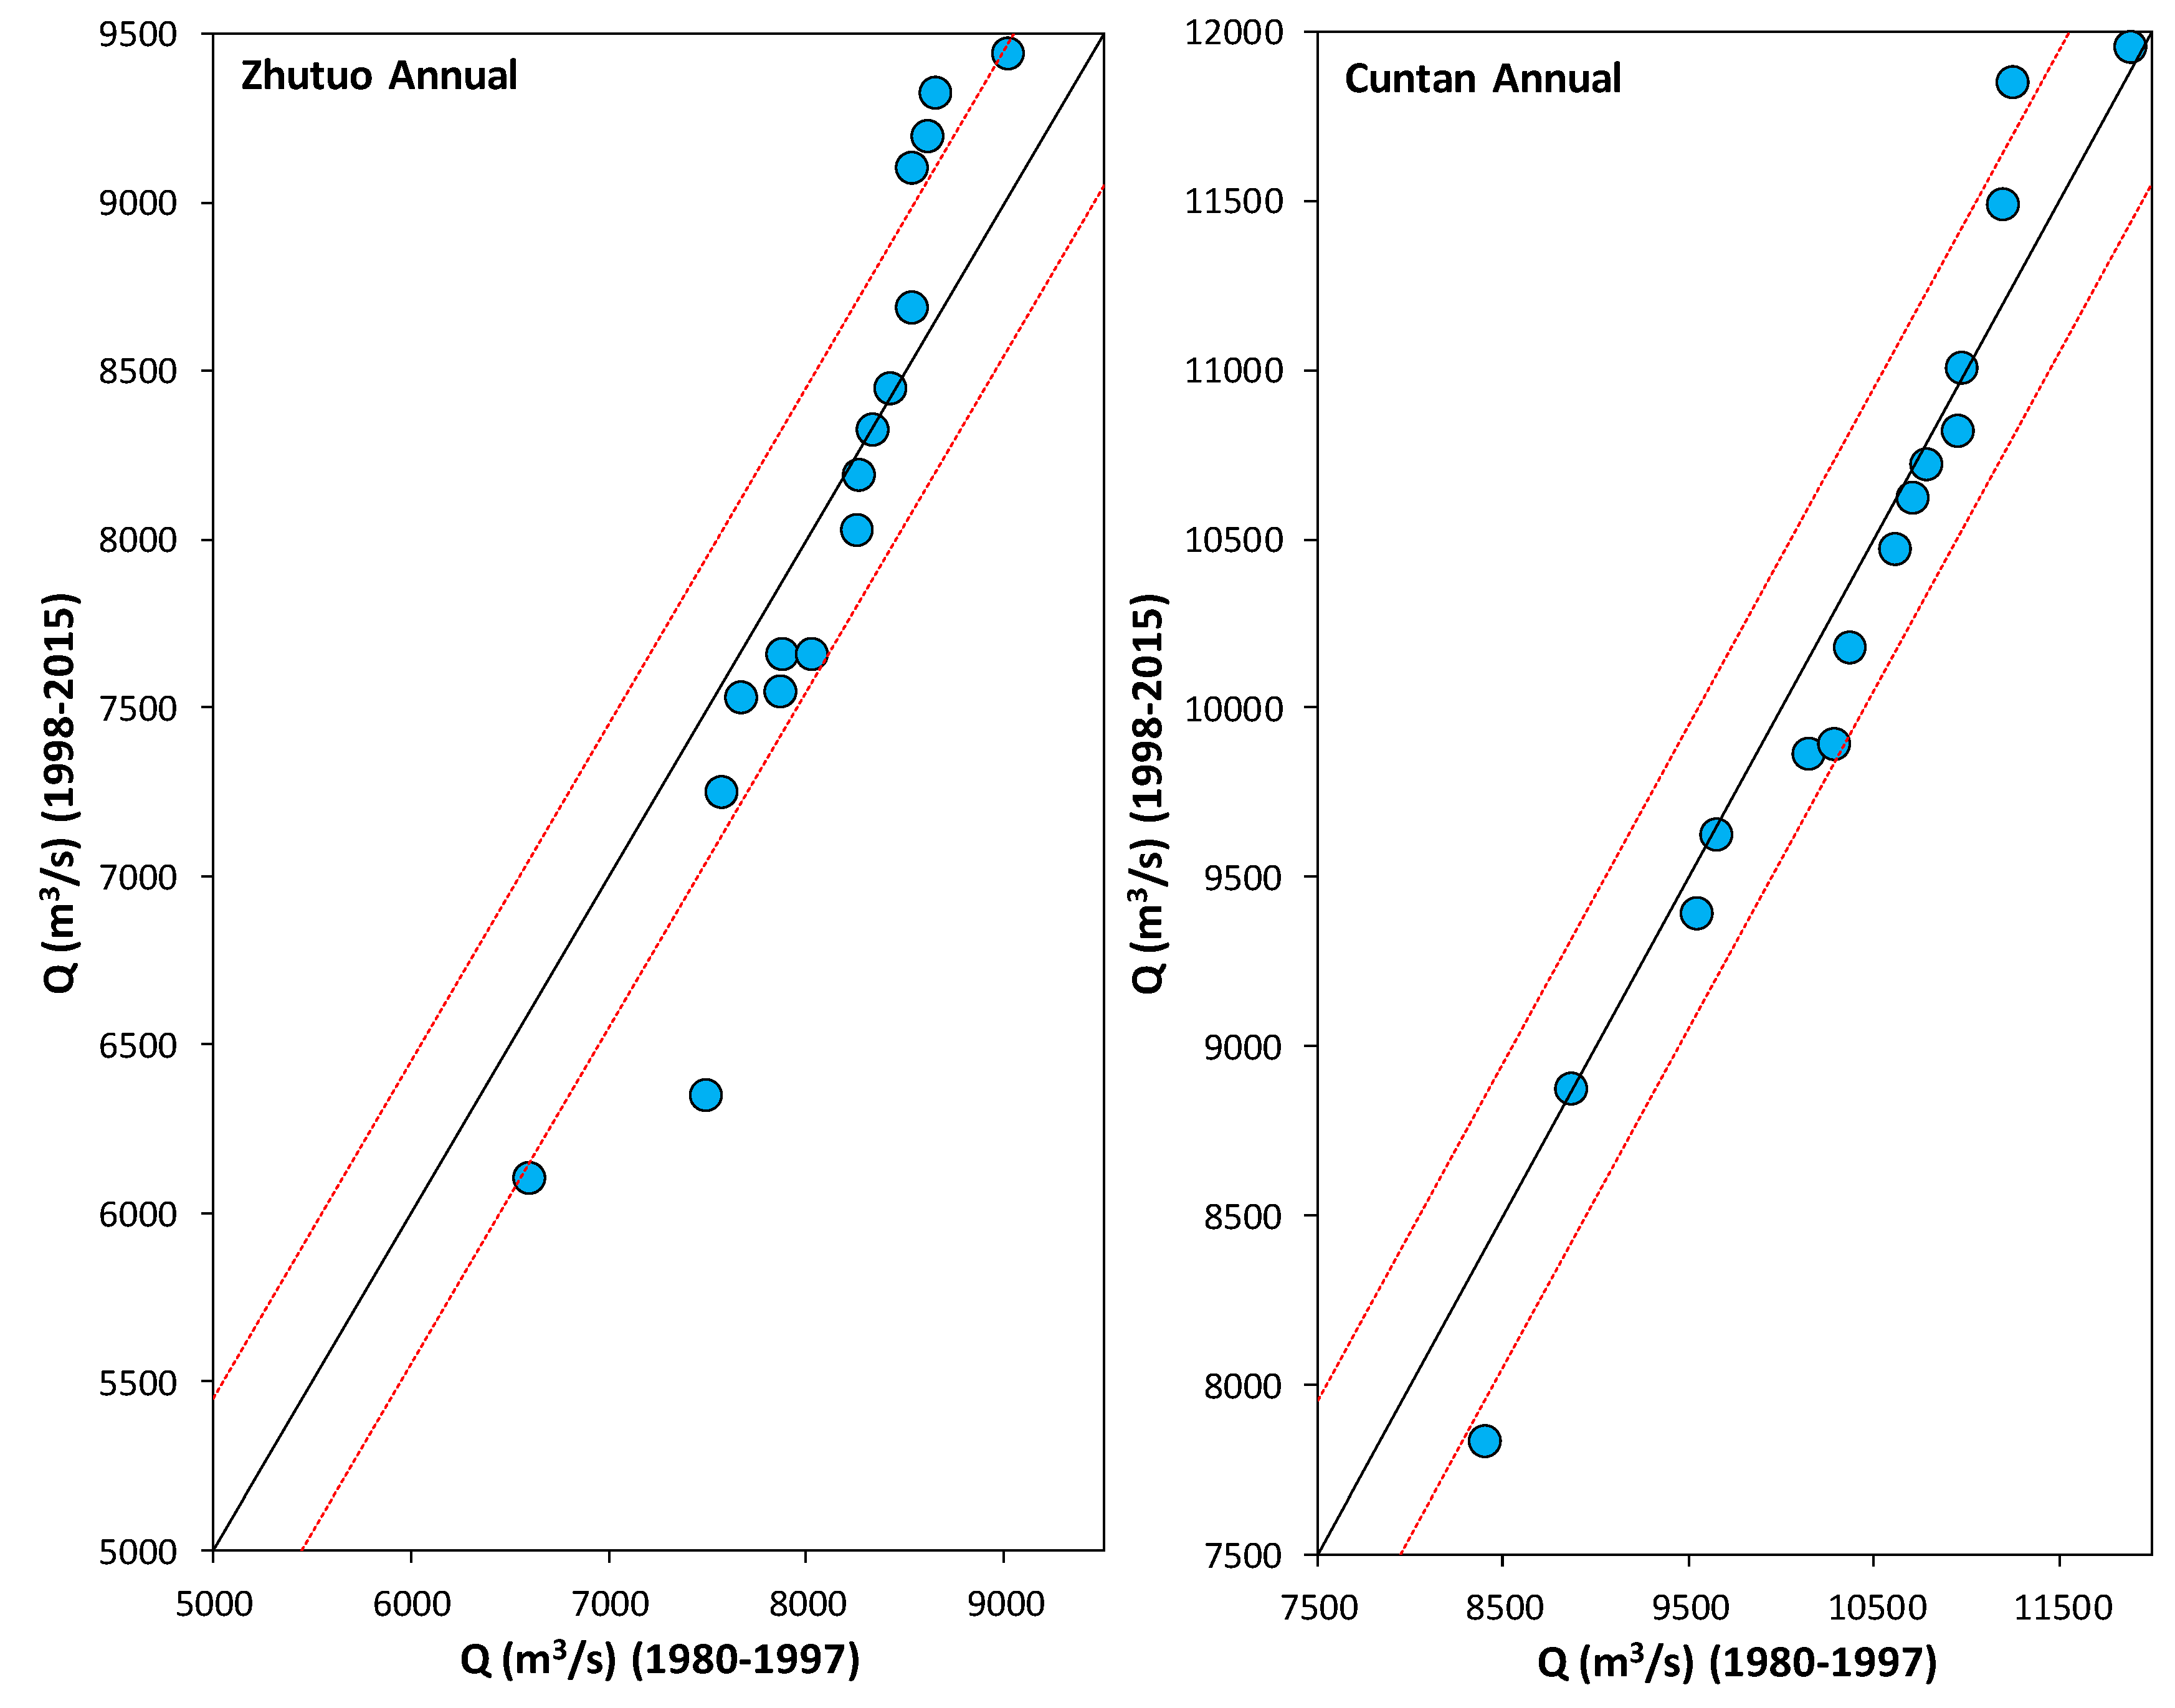
The results of the annual flow analysis using the ITA method are presented in Figure 6.
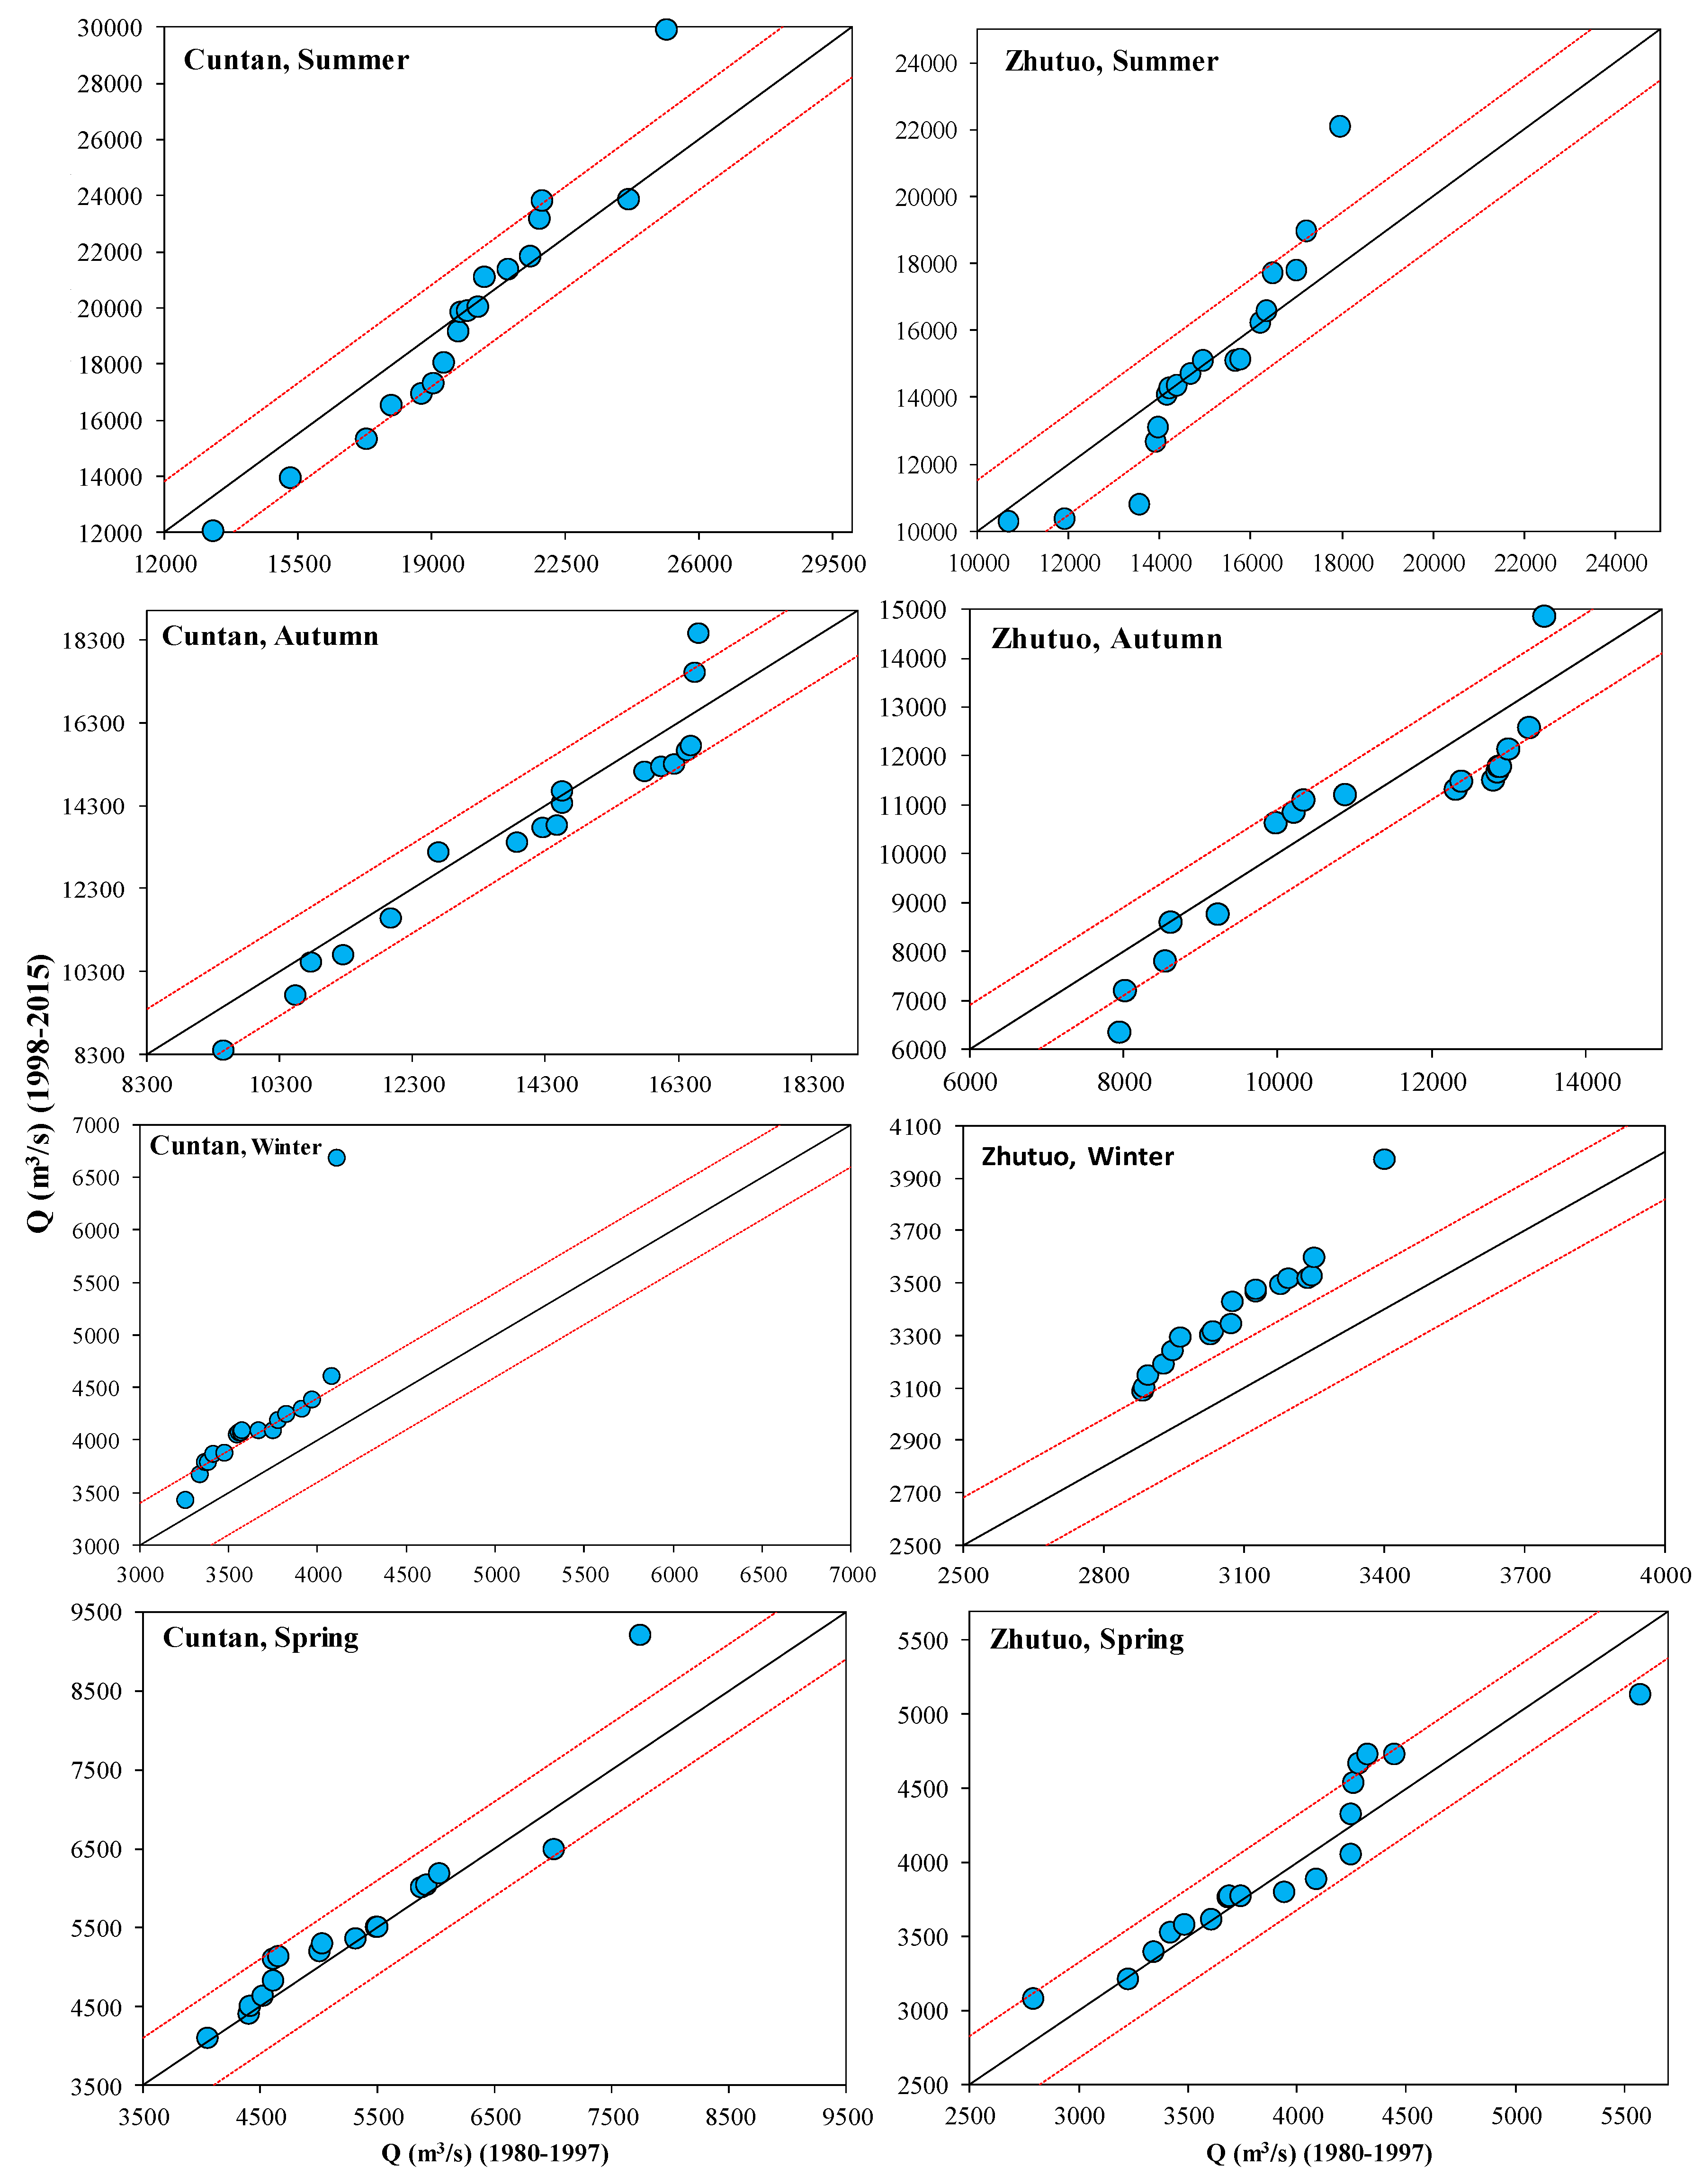
To conduct ITA, time-series data are equally divided into two segments, 1980–1997 and 1998–2015. The trends are inconsistent (both increasing and decreasing trends) across both stations. At both stations, the flow data fall within the 10% range from the 1:1 line; in both stations, the increasing trend is seen for the high flows. Seasonal flow trends of the ITA method for both stations are shown in Figure 7.
We can see that there is increasing and decreasing trends and some flow data are trendless, most of the data are between the range of 10% level of significance except the winter season. In both stations, winter clearly shows increasing trends. Summer and spring seasons of Zhutuo Station have increasing trends for the high flows, while the corresponding values of autumn show a decreasing trend. Low flows of both stations indicate a decreasing trend in both stations.
The ITA results of two stations given in Figure 6 and Figure 7 are summarized and compared with MK and Sen’s slope in Table 3. It is clear from the table that the ITA, MK and Sen’s slope give similar trend results for the content in spring, autumn, summer, and winter but different in annual flows. Similarly, in Zhutuo Station summer is different, but annual, spring autumn and winter are the same. However, ITA gives some positive or negative trends for both stations, although the MK and Sen’s slope tests indicate no trend for these stations.
The above analysis uncovered that there were significant decreasing and increasing trends in annual and seasonal flow data during 1980–2015 at two investigation stations located in the Yangtze River Basin. Then, there were significant decreasing (increasing) trends in seasonal (spring, summer, autumn, winter). In the previous years, throughout the world, various examinations have been led to trend analysis of meteorological data utilizing parametric and non-parametric methods, for example [63,64,65,66,67,68]. The spatial variability of trend is very important for impact assessments and adaptation of planning for floods, droughts, and extreme events [1,68] in the study region. In this study, a sum of eight series of annual and seasonal flows was analyzed by using MK and ITA methods at 10% significance level. The result of the comparison of MK and ITA methods are summarized in Table 3. It was seen from the table that the significant (positive and negative) trends were detected by the MK and ITA. Moreover, all significant trends (at a 10% level) can be detected by MK and ITA. The results of the comparison also revealed that the ITA method was superior to the MK method. In the ITA method, the data can be illustrated graphically on the Cartesian coordinate system; therefore, the visual inspection can be accounted for further interpretations [62]. Furthermore, the ITA method has the following advantages, such as (i) it does not depend on any distribution assumption, serial correlation, and seasonal cycle and (ii) it is simple to understand and calculate [1,67,68]. This new method can provide useful information and a priori view of the authorities and designers and can be used in climate change scenarios.
Results presented in the present study is based on observed data at two locations of Yangtze River for the period 1980–2015. Streamflow at different points along a river is highly correlated to each other. The similarity in results obtained at two stations also suggests similar trends in annual and seasonal streamflow at different locations of Yangtze River. Therefore, the results presented in this study can be considered as the trends for the Yangtze River. However, future research can be conducted with the availability of data from other locations to verify the findings of the present study. Besides, different modified versions of MK tests [41,42,43,44] can be used to assess trends in streamflow, and the obtained results can be compared with the finding of the present study.
5. Conclusions
This study assessed the presence of trends in the monthly and annual flows of Yangtze River China at Cuntan and Zhutuo stations. Trends were detected for the period from 1980 to 2015 using innovative trend analysis (ITA) method, Mann–Kendall (MK) and Sen’s slope estimator tests. The results of the study showed that both stations have significant increasing and decreasing flow at 95% and 99% confidence levels. The highest considerable decrease at a rate of 99% was observed in October both stations while the highest increase was observed in January. Significant increasing trends were detected at both stations in the winter and spring flows; annual flows were increased and decreased at both stations. While the autumn flow was decreased, the summer flow was increased and decreased. The decrease inflows indicate that authorities should take stern action to adapt against climate change. The findings of this study provide an insight into future development projects; for instance, it can present valuable information and a priori view to support the engineers and practitioners to implement the structures to be constructed to cope with the floods and droughts when looking at prevailing climatic events. The finding of the study can be beneficial in planning and management of water resources at Yangtze River.
Author Contributions
Conceptualization, R.A., A.K.; data curation, R.A., S.A.; formal analysis, R.A., S.A., A.K.; supervision, O.K.; writing–original draft, R.A.; writing–review and editing, R.A., A.K., O.K. All authors collaborated in carrying out this research.
Funding
The authors wish to sincerely thank the China Scholarship Council, China Three Gorges University for funding this study. Alban Kuriqi received a PhD grant by Fundação para a Ciência e a Tecnologia, I.P. (FCT), Portugal, under the PhD Programme FLUVIO–River Restoration and Management, grant number: PD/BD/114558/2016.
Acknowledgments
The authors wish to sincerely thank China Scholarship Council, China Three Gorges University, the hydrological data center of the Ministry of Water Resources in China for providing data in this study, and the anonymous reviewers for their valuable comments.
Conflicts of Interest
The authors declare no conflict of interest.
References
- Salman, S.A.; Shahid, S.; Ismail, T.; Ahmed, K.; Wang, X.J. Selection of climate models for projection of spatiotemporal changes in temperature of Iraq with uncertainties. Atmos. Res. 2018, 213, 509–522. [Google Scholar] [CrossRef]
- Ahmed, K.; Shahid, S.; Chung, E.S.; Wang, X.J.; Harun, S.B. Climate change uncertainties in seasonal drought severity-area-frequency curves: Case of arid region of Pakistan. J. Hydrol. 2019, 570, 473–485. [Google Scholar] [CrossRef]
- Ali, R.; Ismael, A.; Heryansyah, A.; Nawaz, N. Long term historic changes in the flow of lesser zab river, iraq. Hydrology 2019, 6, 22. [Google Scholar] [CrossRef]
- Van der Geest, K.; de Sherbinin, A.; Kienberger, S.; Zommers, Z.; Sitati, A.; Roberts, E.; James, R. The impacts of climate change on ecosystem services and resulting losses and damages to people and society. In Loss and Damage from Climate Change: Concepts, Methods and Policy Options; Mechler, R., Bouwer, L.M., Schinko, T., Surminski, S., Linnerooth-Bayer, J., Eds.; Springer International Publishing: Cham, Switzerland, 2019; pp. 221–236. [Google Scholar] [CrossRef]
- Iqbal, Z.; Shahid, S.; Ahmed, K.; Ismail, T.; Nawaz, N. Spatial distribution of the trends in precipitation and precipitation extremes in the sub-Himalayan region of Pakistan. Theor. Appl. Climatol. 2019. [Google Scholar] [CrossRef]
- Sa’adi, Z.; Shahid, S.; Ismail, T.; Chung, E.S.; Wang, X.J. Distributional changes in rainfall and river flow in Sarawak, Malaysia. Asia Pac. J. Atmos. Sci. 2017, 53, 489–500. [Google Scholar] [CrossRef]
- Sa’adi, Z.; Shahid, S.; Ismail, T.; Chung, E.S.; Wang, X.J. Trends analysis of rainfall and rainfall extremes in Sarawak, Malaysia using modified Mann–Kendall test. Meteorol. Atmos. Phys. 2017, 1–15. [Google Scholar] [CrossRef]
- Hegerl, G.C.; Black, E.; Allan, R.P.; Ingram, W.J.; Polson, D.; Trenberth, K.E.; Chadwick, R.S.; Arkin, P.A.; Sarojini, B.B.; Becker, A.; et al. Challenges in Quantifying Changes in the Global Water Cycle. Bull. Am. Meteorol. Soc. 2015, 96, 1097–1115. [Google Scholar] [CrossRef] [Green Version]
- Asefa, T.; Clayton, J.; Adams, A.; Anderson, D. Performance evaluation of a water resources system under varying climatic conditions: Reliability, Resilience, Vulnerability and beyond. J. Hydrol. 2014, 508, 53–65. [Google Scholar] [CrossRef]
- Ahmed, K.; Shahid, S.; Nawaz, N.; Khan, N. Modeling climate change impacts on precipitation in arid regions of Pakistan: A non-local model output statistics downscaling approach. Theor. Appl. Climatol. 2018, 1–18. [Google Scholar] [CrossRef]
- Lobanova, A.; Liersch, S.; Nunes, J.P.; Didovets, I.; Stagl, J.; Huang, S.; Koch, H.; Rivas López, M.d.R.; Maule, C.F.; Hattermann, F.; et al. Hydrological impacts of moderate and high-end climate change across European river basins. J. Hydrol. Reg. Stud. 2018, 18, 15–30. [Google Scholar] [CrossRef]
- Cigizoglu, H.; Bayazit, M.; Önöz, B. Trends in the maximum, mean, and low flows of Turkish rivers. J. Hydrometeorol. 2005, 6, 280–290. [Google Scholar] [CrossRef]
- Biemans, H.; Speelman, L.H.; Ludwig, F.; Moors, E.J.; Wiltshire, A.J.; Kumar, P.; Gerten, D.; Kabat, P. Future water resources for food production in five South Asian river basins and potential for adaptation--a modeling study. Sci. Total Environ. 2013, 468–469, S117–S131. [Google Scholar] [CrossRef]
- Qutbudin, I.; Shiru, M.S.; Sharafati, A.; Ahmed, K.; Al-Ansari, N.; Yaseen, Z.M.; Shahid, S.; Wang, X. Seasonal Drought Pattern Changes Due to Climate Variability: Case Study in Afghanistan. Water 2019, 11, 1096. [Google Scholar] [CrossRef]
- Shiru, M.S.; Shahid, S.; Alias, N.; Chung, E.S. Trend Analysis of Droughts during Crop Growing Seasons of Nigeria. Sustainability 2018, 10, 871. [Google Scholar] [CrossRef]
- Kuriqi, A.; Pinheiro, A.N.; Sordo-Ward, A.; Garrote, L. Influence of hydrologically based environmental flow methods on flow alteration and energy production in a run-of-river hydropower plant. J. Clean. Prod. 2019, 232, 1028–1042. [Google Scholar] [CrossRef]
- Kuriqi, A.; Pinheiro, A.N.; Sordo-Ward, A.; Garrote, L. Trade-off between environmental flow policy and run-of-river hydropower generation in Mediterranean climate. Eur. Water 2017, 60, 123–130. [Google Scholar] [CrossRef]
- Abghari, H.; Tabari, H.; Hosseinzadeh Talaee, P. River flow trends in the west of Iran during the past 40years: Impact of precipitation variability. Glob. Planet. Chang. 2013, 101, 52–60. [Google Scholar] [CrossRef]
- Afshar, A.A.; Hasanzadeh, Y.; Besalatpour, A.A.; Pourreza-Bilondi, M. Climate change forecasting in a mountainous data scarce watershed using CMIP5 models under representative concentration pathways. Theor. Appl. Climatol. 2016, 129, 683–699. [Google Scholar] [CrossRef]
- Ardıçlıoğlu, M.; Kuriqi, A. Calibration of channel roughness in intermittent rivers using HEC-RAS model: Case of Sarimsakli creek, Turkey. SN Appl. Sci. 2019, 1. [Google Scholar] [CrossRef]
- Wickramagamage, P. Spatial and temporal variation of rainfall trends of Sri Lanka. Theor. Appl. Climatol. 2015, 125, 1–12. [Google Scholar] [CrossRef]
- Liuzzo, L.; Bono, E.; Sammartano, V.; Freni, G. Analysis of spatial and temporal rainfall trends in Sicily during the 1921–2012 period. Theor. Appl. Climatol. 2015, 126, 1–17. [Google Scholar] [CrossRef]
- Döll, P.; Fiedler, K.; Zhang, J. Global-scale analysis of river flow alterations due to water withdrawals and reservoirs. Hydrol. Earth Syst. Sci. 2009, 13, 2413–2432. [Google Scholar] [CrossRef] [Green Version]
- Zhang, X.; Dong, Q.; Costa, V.; Wang, X. A hierarchical Bayesian model for decomposing the impacts of human activities and climate change on water resources in China. Sci. Total Environ. 2019, 665, 836–847. [Google Scholar] [CrossRef]
- Cao, L.; Yan, Z.; Zhao, P.; Zhu, Y.; Yu, Y.; Tang, G.; Jones, P. Climatic warming in China during 1901–2015 based on an extended dataset of instrumental temperature records. Environ. Res. Lett. 2017, 12, 064005. [Google Scholar] [CrossRef]
- Chen, W.; Jiang, Z.; Li, L. Probabilistic projections of climate change over China under the SRES A1B scenario using 28 AOGCMs. J. Clim. 2011, 24, 4741–4756. [Google Scholar] [CrossRef]
- Wang, L.; Chen, W. A CMIP5 multimodel projection of future temperature, precipitation, and climatological drought in China. Int. J. Climatol. 2014, 34, 2059–2078. [Google Scholar] [CrossRef]
- Chen, J.; Fang, X.; Wen, Z.; Chen, Q.; Ma, M.; Huang, Y.; Wu, S.; Yang, L. Spatio-Temporal Patterns and Impacts of Sediment Variations in Downstream of the Three Gorges Dam on the Yangtze River, China. Sustainability 2018, 10, 4093. [Google Scholar] [CrossRef]
- Fang, J.; Kong, F.; Fang, J.; Zhao, L. Observed changes in hydrological extremes and flood disaster in Yangtze River Basin: Spatial–temporal variability and climate change impacts. Nat. Hazards 2018, 93, 89–107. [Google Scholar] [CrossRef]
- Gao, B.; Yang, D.; Zhao, T.; Yang, H. Changes in the eco-flow metrics of the Upper Yangtze River from 1961 to 2008. J. Hydrol. 2012, 448, 30–38. [Google Scholar] [CrossRef]
- Kuriqi, A.; Ardiçlioǧlu, M. Investigation of hydraulic regime at middle part of the Loire River in context of floods and low flow events. Pollack Period. 2018, 13, 145–156. [Google Scholar] [CrossRef]
- Kuriqi, A.; Ardiçlioglu, M.; Muceku, Y. Investigation of seepage effect on river dike’s stability under steady state and transient conditions. Pollack Period. 2016, 11, 87–104. [Google Scholar] [CrossRef]
- Şen, Z. Innovative trend analysis methodology. J. Hydrol. Eng. 2011, 17, 1042–1046. [Google Scholar] [CrossRef]
- Tosunoglu, F.; Kisi, O. Trend Analysis of Maximum Hydrologic Drought Variables Using Mann–Kendall and Şen’s Innovative Trend Method. River Res. Appl. 2017, 33, 597–610. [Google Scholar] [CrossRef]
- Tabari, H.; Taye, M.T.; Willems, P. Statistical assessment of precipitation trends in the upper Blue Nile River basin. Stoch. Environ. Res. Risk Assess. 2015, 29, 1751–1761. [Google Scholar] [CrossRef]
- Demir, V.; Kisi, O. Comparison of Mann-Kendall and innovative trend method (Şen trend) for monthly total precipitation (Middle Black Sea Region, Turkey). In Proceedings of the Conference 3rd International Balkans Conference on Challenges of Civil Engineering, 3-BCCCE, Tirana, Albania, 19–21 May 2016. [Google Scholar]
- Dabanlı, İ.; Şen, Z.; Yeleğen, M.Ö.; Şişman, E.; Selek, B.; Güçlü, Y.S. Trend Assessment by the Innovative-Şen Method. Water Resour. Manag. 2016, 30, 5193–5203. [Google Scholar] [CrossRef]
- Öztopal, A.; Şen, Z. Innovative Trend Methodology Applications to Precipitation Records in Turkey. Water Resour. Manag. 2017, 31, 727–737. [Google Scholar] [CrossRef]
- Wu, H.; Qian, H. Innovative trend analysis of annual and seasonal rainfall and extreme values in Shaanxi, China, since the 1950s. Int. J. Climatol. 2017, 37, 2582–2592. [Google Scholar] [CrossRef]
- Kisi, O. An innovative method for trend analysis of monthly pan evaporations. J. Hydrol. 2015, 527, 1123–1129. [Google Scholar] [CrossRef]
- Malik, A.; Kumar, A.; Guhathakurta, P.; Kisi, O. Spatial-temporal trend analysis of seasonal and annual rainfall (1966–2015) using innovative trend analysis method with significance test. Arab. J. Geosci. 2019, 12, 328. [Google Scholar] [CrossRef]
- Sanikhani, H.; Kisi, O.; Mirabbasi, R.; Meshram, S.G. Trend analysis of rainfall pattern over the Central India during 1901–2010. Arab. J. Geosci. 2018, 11, 437. [Google Scholar] [CrossRef]
- Su, B.; Jiang, T.; Jin, W. Recent trends in observed temperature and precipitation extremes in the Yangtze River basin, China. Theor. Appl. Climatol. 2006, 83, 139–151. [Google Scholar] [CrossRef]
- Wang, Y.; Wang, D.; Lewis, Q.W.; Wu, J.; Huang, F. A framework to assess the cumulative impacts of dams on hydrological regime: A case study of the Yangtze River. Hydrol. Process. 2017, 31, 3045–3055. [Google Scholar] [CrossRef]
- Zhang, Q.; Xu, C.Y.; Zhang, Z.; Chen, Y.D.; Liu, C.L.; Lin, H. Spatial and temporal variability of precipitation maxima during 1960–2005 in the Yangtze River basin and possible association with large-scale circulation. J. Hydrol. 2008, 353, 215–227. [Google Scholar] [CrossRef]
- Hollert, H. Processes and environmental quality in the Yangtze River system. Environ. Sci. Pollut. Res. 2013, 20, 6904–6906. [Google Scholar] [CrossRef] [Green Version]
- Noor, M.; Ismail, T.; Chung, E.S.; Shahid, S.; Sung, J. Uncertainty in Rainfall Intensity Duration Frequency Curves of Peninsular Malaysia under Changing Climate Scenarios. Water 2018, 10, 1750. [Google Scholar] [CrossRef]
- Sen, P.K. Estimates of the regression coefficient based on Kendall’s tau. J. Am. Stat. Assoc. 1968, 63, 1379–1389. [Google Scholar] [CrossRef]
- Khan, N.; Shahid, S.; Ismail, T.; Ahmed, K.; Nawaz, N. Trends in heat wave related indices in Pakistan. Stoch. Environ. Res. Risk Assess. 2018, 33, 287–302. [Google Scholar] [CrossRef]
- Khan, N.; Shahid, S.; Ismail, T.B.; Wang, X.J. Spatial distribution of unidirectional trends in temperature and temperature extremes in Pakistan. Theor. Appl. Climatol. 2018. [Google Scholar] [CrossRef]
- Pranuthi, G.; Dubey, S.; Tripathi, S.; Chandniha, S. Trend and change point detection of precipitation in urbanizing Districts of Uttarakhand in India. Indian J. Sci. Technol. 2014, 7, 1573–1582. [Google Scholar]
- Ahmed, K.; Shahid, S.; Nawaz, N. Impacts of climate variability and change on seasonal drought characteristics of Pakistan. Atmos. Res. 2018, 214, 364–374. [Google Scholar] [CrossRef]
- Hannaford, J.; Buys, G. Trends in seasonal river flow regimes in the UK. J. Hydrol. 2012, 475, 158–174. [Google Scholar] [CrossRef] [Green Version]
- Piniewski, M.; Marcinkowski, P.; Kundzewicz, Z.W. Trend detection in river flow indices in Poland. Acta Geophys. 2018, 66, 347–360. [Google Scholar] [CrossRef] [Green Version]
- Ahmed, K.; Shahid, S.; Wang, X.J.; Nawaz, N.; Khan, N. Spatiotemporal Changes in Aridity of Pakistan during 1901-2016. Hydrol. Earth Syst. Sci. Discuss. 2019, 2019, 1–27. [Google Scholar] [CrossRef]
- Mann, H.B. Nonparametric Tests Against Trend. Econometrica 1945, 13, 245. [Google Scholar] [CrossRef]
- Ahmed, K.; Shahid, S.; Chung, E.S.; Ismail, T.; Wang, X.J. Spatial distribution of secular trends in annual and seasonal precipitation over Pakistan. Clim. Res. 2017, 74, 95–107. [Google Scholar] [CrossRef]
- Nashwan, M.S.; Shahid, S. Spatial distribution of unidirectional trends in climate and weather extremes in Nile river basin. Theor. Appl. Climatol. 2018, 137, 1181–1199. [Google Scholar] [CrossRef]
- Sonali, P.; Nagesh Kumar, D. Review of trend detection methods and their application to detect temperature changes in India. J. Hydrol. 2013, 476, 212–227. [Google Scholar] [CrossRef]
- Nashwan, M.S.; Shahid, S.; Rahim, N.A. Unidirectional trends in annual and seasonal climate and extremes in Egypt. Theor. Appl. Climatol. 2018, 136, 457–473. [Google Scholar] [CrossRef]
- Şen, Z. Innovative trend significance test and applications. Theor. Appl. Climatol. 2015, 127, 939–947. [Google Scholar] [CrossRef]
- Brunetti, M.; Caloiero, T.; Coscarelli, R.; Gullà, G.; Nanni, T.; Simolo, C. Precipitation variability and change in the Calabria region (Italy) from a high resolution daily dataset. Int. J. Climatol. 2012, 32, 57–73. [Google Scholar] [CrossRef]
- Ay, M.; Kisi, O. Investigation of trend analysis of monthly total precipitation by an innovative method. Theor. Appl. Climatol. 2014, 120, 617–629. [Google Scholar] [CrossRef]
- Caloiero, T.; Coscarelli, R.; Ferrari, E. Application of the Innovative Trend Analysis Method for the Trend Analysis of Rainfall Anomalies in Southern Italy. Water Resour. Manag. 2018, 32, 4971–4983. [Google Scholar] [CrossRef]
- Caloiero, T.; Coscarelli, R.; Ferrari, E. Analysis of Monthly Rainfall Trend in Calabria (Southern Italy) through the Application of Statistical and Graphical Techniques. Proceedings 2018, 2, 629. [Google Scholar] [CrossRef]
- Güçlü, Y.S.; Dabanlı, İ.; Şişman, E.; Şen, Z. Air quality (AQ) identification by innovative trend diagram and AQ index combinations in Istanbul megacity. Atmos. Pollut. Res. 2019, 10, 88–96. [Google Scholar] [CrossRef]
- Al Balasmeh, O.; Babbar, R.; Karmaker, T. Trend analysis and ARIMA modeling for forecasting precipitation pattern in Wadi Shueib catchment area in Jordan. Arab. J. Geosci. 2019, 12. [Google Scholar] [CrossRef]
- Cui, L.; Wang, L.; Lai, Z.; Tian, Q.; Liu, W.; Li, J. Innovative trend analysis of annual and seasonal air temperature and rainfall in the Yangtze River Basin, China during 1960–2015. J. Atmos. Sol. Terr. Phys. 2017, 164, 48–59. [Google Scholar] [CrossRef]
Figure 1.
Location of Cuntan and Zhutuo hydrological stations in the Yangtze River Basin.

Figure 2.
Seasonal distribution of streamflow at Cuntan and Zhutuo.

Figure 3.
The innovative trend analysis (ITA) method shows increasing and decreasing trend zones.

Figure 4.
Trends in the maximum annual river flow at (a) Cuntan and (b) Zhutuo stations.

Figure 5.
Trends in the minimum annual river flow at (a) Cuntan and (b) Zhutuo stations. Following symbols: ***, ** and * represents significance at 90%, 95% and 99% confidence levels.
Figure 5.
Trends in the minimum annual river flow at (a) Cuntan and (b) Zhutuo stations. Following symbols: ***, ** and * represents significance at 90%, 95% and 99% confidence levels.

Figure 6.
Results of annual flow trends at Cuntan and Zhutuo stations in Yangtze River Basin by using the ITA method.
Figure 6.
Results of annual flow trends at Cuntan and Zhutuo stations in Yangtze River Basin by using the ITA method.

Figure 7.
ITA analysis method for Cuntan and Zhutuo stations in seasonal flow trends.


Table 1.
Kolmogorov–Smirnov test statistics obtained during the fitting distribution of streamflow data on Cuntan and Zhutuo stations.
Table 1.
Kolmogorov–Smirnov test statistics obtained during the fitting distribution of streamflow data on Cuntan and Zhutuo stations.
| Month/Season | Cuntan | Zhutuo | ||||
|---|---|---|---|---|---|---|
| Gamma | Gen. Extreme Value | Normal | Gamma | Gen. Extreme Value | Normal | |
| January | 0.135 | 0.089 | 0.157 | 0.091 | 0.065 | 0.106 |
| February | 0.128 | 0.107 | 0.149 | 0.101 | 0.083 | 0.108 |
| March | 0.123 | 0.088 | 0.144 | 0.117 | 0.085 | 0.137 |
| April | 0.114 | 0.072 | 0.148 | 0.114 | 0.060 | 0.143 |
| May | 0.100 | 0.077 | 0.129 | 0.070 | 0.063 | 0.084 |
| June | 0.122 | 0.098 | 0.138 | 0.095 | 0.087 | 0.096 |
| July | 0.075 | 0.078 | 0.079 | 0.103 | 0.076 | 0.126 |
| August | 0.127 | 0.127 | 0.159 | 0.151 | 0.132 | 0.125 |
| September | 0.191 | 0.124 | 0.159 | 0.192 | 0.108 | 0.160 |
| October | 0.093 | 0.097 | 0.109 | 0.093 | 0.078 | 0.120 |
| November | 0.077 | 0.541 | 0.099 | 0.112 | 0.069 | 0.133 |
| December | 0.140 | 0.112 | 0.141 | 0.082 | 0.061 | 0.076 |
| Mean annual | 0.068 | 0.077 | 0.075 | 0.092 | 0.093 | 0.089 |
| Annual Maximum flow | 0.088 | 0.085 | 0.089 | 0.125 | 0.123 | 0.121 |
| Annual Minimum flow | 0.068 | 0.077 | 0.075 | 0.154 | 0.119 | 0.166 |
| Spring | 0.126 | 0.075 | 0.152 | 0.105 | 0.086 | 0.124 |
| Summer | 0.108 | 0.108 | 0.105 | 0.129 | 0.119 | 0.113 |
| Autumn | 0.144 | 0.083 | 0.120 | 0.136 | 0.091 | 0.111 |
| Winter | 0.184 | 0.096 | 0.200 | 0.078 | 0.063 | 0.088 |
Table 2.
Trends in annual, maximum, minimum, and seasonal river flow obtained using Sen’s slope and Mann–Kendall (MK) trend test at Cuntan and Zhutuo stations. The negative values of MK test statistics indicate decreasing while the positive values indicate an increasing trend in streamflow.
Table 2.
Trends in annual, maximum, minimum, and seasonal river flow obtained using Sen’s slope and Mann–Kendall (MK) trend test at Cuntan and Zhutuo stations. The negative values of MK test statistics indicate decreasing while the positive values indicate an increasing trend in streamflow.
| Cuntan | Zhutuo | |||||
|---|---|---|---|---|---|---|
| Time Series | MK | Significance | Sen’s Slope | MK | Signific. | Sen’s Slope |
| January | 4.81 | *** | 36.15 | 4.30 | *** | 20.14 |
| February | 3.50 | *** | 27.51 | 3.17 | *** | 16.87 |
| March | 3.61 | *** | 42.67 | 3.09 | *** | 24.47 |
| April | 1.87 | * | 32.03 | 1.32 | 18.10 | |
| May | −0.29 | −11.31 | −1.13 | −17.83 | ||
| June | −1.19 | −48.48 | −1.51 | −54.48 | ||
| July | −1.02 | −113.48 | −1.73 | * | −112.65 | |
| August | −1.21 | −112.07 | −0.48 | −25.77 | ||
| September | −1.16 | −98.08 | −0.91 | −52.83 | ||
| October | −1.81 | * | −71.12 | −1.84 | * | −87.04 |
| November | −0.67 | −16.12 | −1.02 | −11.35 | ||
| December | 0.99 | 8.61 | 0.91 | 5.43 | ||
| Maximum | −0.64 | −82.39 | −1.24 | −50.88 | ||
| Minimum | 4.13 | *** | 30.57 | 3.23 | *** | 16.37 |
| Annual | −1.19 | −26.76 | −1.40 | −17.36 | ||
| Spring | 1.46 | 21.74 | 1.19 | 9.54 | ||
| Summer | −1.21 | −65.90 | −1.35 | −56.53 | ||
| Autumn | −1.68 | * | −61.03 | −1.81 | * | −55.78 |
| Winter | 3.99 | *** | 23.49 | 3.75 | *** | 13.65 |
***, ** and * represents significance at 90%, 95% and 99% confidence levels corresponding to critical z values of 1.65, 1.96 and 2.58, respectively.
Table 3.
ITA, MK and Sen’s slope results for the annual and seasonal flow series of Cuntan and Zhutuo stations.
Table 3.
ITA, MK and Sen’s slope results for the annual and seasonal flow series of Cuntan and Zhutuo stations.
| Season | Method | Station | |
|---|---|---|---|
| Cuntan | Zhutuo | ||
| Annual | ITA | 0.05 | −0.01 |
| β | −26.8 | −17.4 | |
| MK | −1.19 | −1.40 | |
| Spring | ITA | 0.28 | 0.17 |
| β | 21.74 | 9.55 | |
| MK | 1.46 | 1.19 | |
| Summer | ITA | 0 | 0.02 |
| β | −65.9 | −56.5 | |
| MK | −1.21 | −1.35 | |
| Autumn | ITA | −0.15 | −0.39 |
| β | −61.03 | −55.78 | |
| MK | −1.68 | −1.81 | |
| Winter | ITA | 0.99 | 1.00 |
| β | 23.5 | 13.66 | |
| MK | 3.99 | 3.75 | |
© 2019 by the authors. Licensee MDPI, Basel, Switzerland. This article is an open access article distributed under the terms and conditions of the Creative Commons Attribution (CC BY) license (http://creativecommons.org/licenses/by/4.0/).
Share and Cite
MDPI and ACS Style
Ali, R.; Kuriqi, A.; Abubaker, S.; Kisi, O. Long-Term Trends and Seasonality Detection of the Observed Flow in Yangtze River Using Mann-Kendall and Sen’s Innovative Trend Method. Water 2019, 11, 1855. https://doi.org/10.3390/w11091855
AMA Style
Ali R, Kuriqi A, Abubaker S, Kisi O. Long-Term Trends and Seasonality Detection of the Observed Flow in Yangtze River Using Mann-Kendall and Sen’s Innovative Trend Method. Water. 2019; 11(9):1855. https://doi.org/10.3390/w11091855
Chicago/Turabian StyleAli, Rawshan, Alban Kuriqi, Shadan Abubaker, and Ozgur Kisi. 2019. "Long-Term Trends and Seasonality Detection of the Observed Flow in Yangtze River Using Mann-Kendall and Sen’s Innovative Trend Method" Water 11, no. 9: 1855. https://doi.org/10.3390/w11091855
Note that from the first issue of 2016, this journal uses article numbers instead of page numbers. See further details here.