Trends in Drought over the Northeast United States


1
Department of Civil Engineering and NOAA-CREST, City College of New York, New York, NY 10031, USA
2
Department of Economics and NOAA-EPP Earth System Sciences and Remote Sensing Technologies Scholar, City College of New York, New York, NY 10031, USA
*
Author to whom correspondence should be addressed.
Water 2019, 11(9), 1834; https://doi.org/10.3390/w11091834
Submission received: 25 July 2019
/
Revised: 23 August 2019
/
Accepted: 28 August 2019
/
Published: 4 September 2019
(This article belongs to the Special Issue Global Changes in Drought Frequency and Severity)
Abstract
:The Northeast United States is a generally wet region that has had substantial increases in mean precipitation over the past decades, but also experiences damaging droughts. We evaluated drought frequency, intensity, and duration trends in the region over the period 1901–2015. We used a dataset of Standardized Precipitation Evapotranspiration Index (SPEI), a measure of water balance based on meteorology that is computed at multiple timescales. It was found that the frequency of droughts decreased over this period, but their average intensity and duration did not show consistent changes. There was an increase in mean SPEI, indicating mostly wetter conditions, but also in an increase in SPEI variance, which kept the likelihood of extremely dry conditions from decreasing as much as would be expected from the wetter mean state. The changes in the SPEI mean and variance, as well as the decrease in drought frequency, were most pronounced for longer timescales. These results are consistent with the paradigm of hydrologic intensification under global warming, where both wet and dry extremes may increase in severity alongside changes in mean precipitation.
1. Introduction
The Northeast (NE) United States (US) is the nation’s most densely populated and wealthiest region. Extreme hydrologic conditions, including droughts as well as floods, can have major economic impacts across sectors ranging from residential to commercial to agricultural. The most severe drought recorded in the region occurred from 1962 to 1965 [1,2]. Such droughts are associated with specific atmospheric circulation and sea surface temperature anomalies [3,4]. Precipitation has overall increased substantially in the NE over the 20th Century, though with spatial variation [5]. The most recent major droughts in the region occurred as part of a continental dry period from 1998 to 2004 [6,7]. Prolonged droughts and wet periods in previous centuries in the region have been reconstructed from tree-ring records [8]. The region has warmed faster than the global average since 1900, resulting in less precipitation falling as snow and earlier snowmelt than in the past [2,9,10]. Besides global warming, regional climate forcings such as short-lived air pollutants [11] and local land use change, including urbanization and suburbanization [12], may also drive hydrologic trends.
Regional trends in drought can be considered in the context of hydrologic impacts of global warming and other climate changes. In general, global warming is projected to cause hydrologic intensification, with both droughts and floods becoming more common and severe globally (though with regional variability) [13,14]; this pattern is also found in some analyses of global observational data from recent decades [15,16,17]. Both precipitation and evaporation are projected to increase, and precipitation is projected to fall in heavier, more sporadic bursts that are punctuated by longer and more severe dry spells, a pattern of hydrologic intensification that again is expected to prevail with considerable regional variability [18,19,20,21,22,23,24,25,26,27,28,29,30]. Climate models simulate more frequent droughts in the NE under further global warming over the 21st Century due to greater evaporation and less consistent precipitation [2].
For the United States as a whole, one study found no significant trend in droughts (defined as anomalously low precipitation) from 1960 to 2010, but an increase in the frequency of droughts with concurrent heatwaves (defined as anomalously high temperature) [31]. Drought in recent decades has increased the vulnerability of forests particularly in the western United States to insects and fire, affecting forest structure and diversity [32]. In an analysis of drought trends across the United States from 1979 to 2013, both decreased precipitation and warmer temperature were identified as contributing to increasing drought trends, while in different regions with decreasing drought (including most of the NE), trends in average temperature, specific humidity and net radiation all played roles [33].
Given these considerations, our main objective here is to better understand trends in drought over the NE based on historic observations. We consider spatial patterns in drought trends as well as different aspects of drought risk, including drought frequency, intensity, and duration. We also consider how trends in drought relate to changes in the probability distribution of moisture status over the NE, and to what extent these reflect hydrologic intensification.
2. Methods
2.1. Meteorological Data
The drought indicator considered here is the Standardized Precipitation Evapotranspiration Index (SPEI), which is based on anomalies in monthly average precipitation (P) minus reference evapotranspiration (ET) [34,35,36]. ET can be estimated based on temperature and possibly also windspeed, sunniness, and other climatic variables, using one of several available approaches.
SPEI can be computed at different timescales, making it possible to assess both long and short term drought [37]. The aggregation of P minus ET for a set of n months, followed by standardization to zero mean and unit standard deviation, yields SPEI for different timescales [35]. For example, SPEI-1 indicates normalized P minus ET anomaly for the current month ( 1 month), while SPEI-12 is based on P minus ET summed over the past year ( 12 months). Positive SPEI values denote wetter than average conditions, while negative values denote drier than average conditions. SPEI is an elaboration of the earlier Standardized Precipitation Index (SPI) [38], which is similarly standardized and computable for different timescales. However, SPI is based only on precipitation and does not explicitly account for temperature. SPEI is therefore well suited for drought risk assessment and prediction [37,39,40,41,42].
Monthly SPEI data were acquired from the Global SPEI Database, SPEIbase (version 2.5.1), for 1901–2015 and aggregation timescales of 1–48 months at the highest available spatial resolution of 0.5 [43]. The SPEI values are determined based on University of East Anglia Climate Research Unit (CRU) gridded monthly precipitation and reference evapotranspiration (version TS 3.24.01) [44]. The P minus ET values are transformed to standard normal distributions using the log-logistic distribution fitted with the unbiased probability weighted moments method [36]. ET is calculated by CRU using the Food and Agricultural Organization (FAO) Penman-Monteith method for evapotranspiration from a notional well-watered grass surface [43].
2.2. Study Region
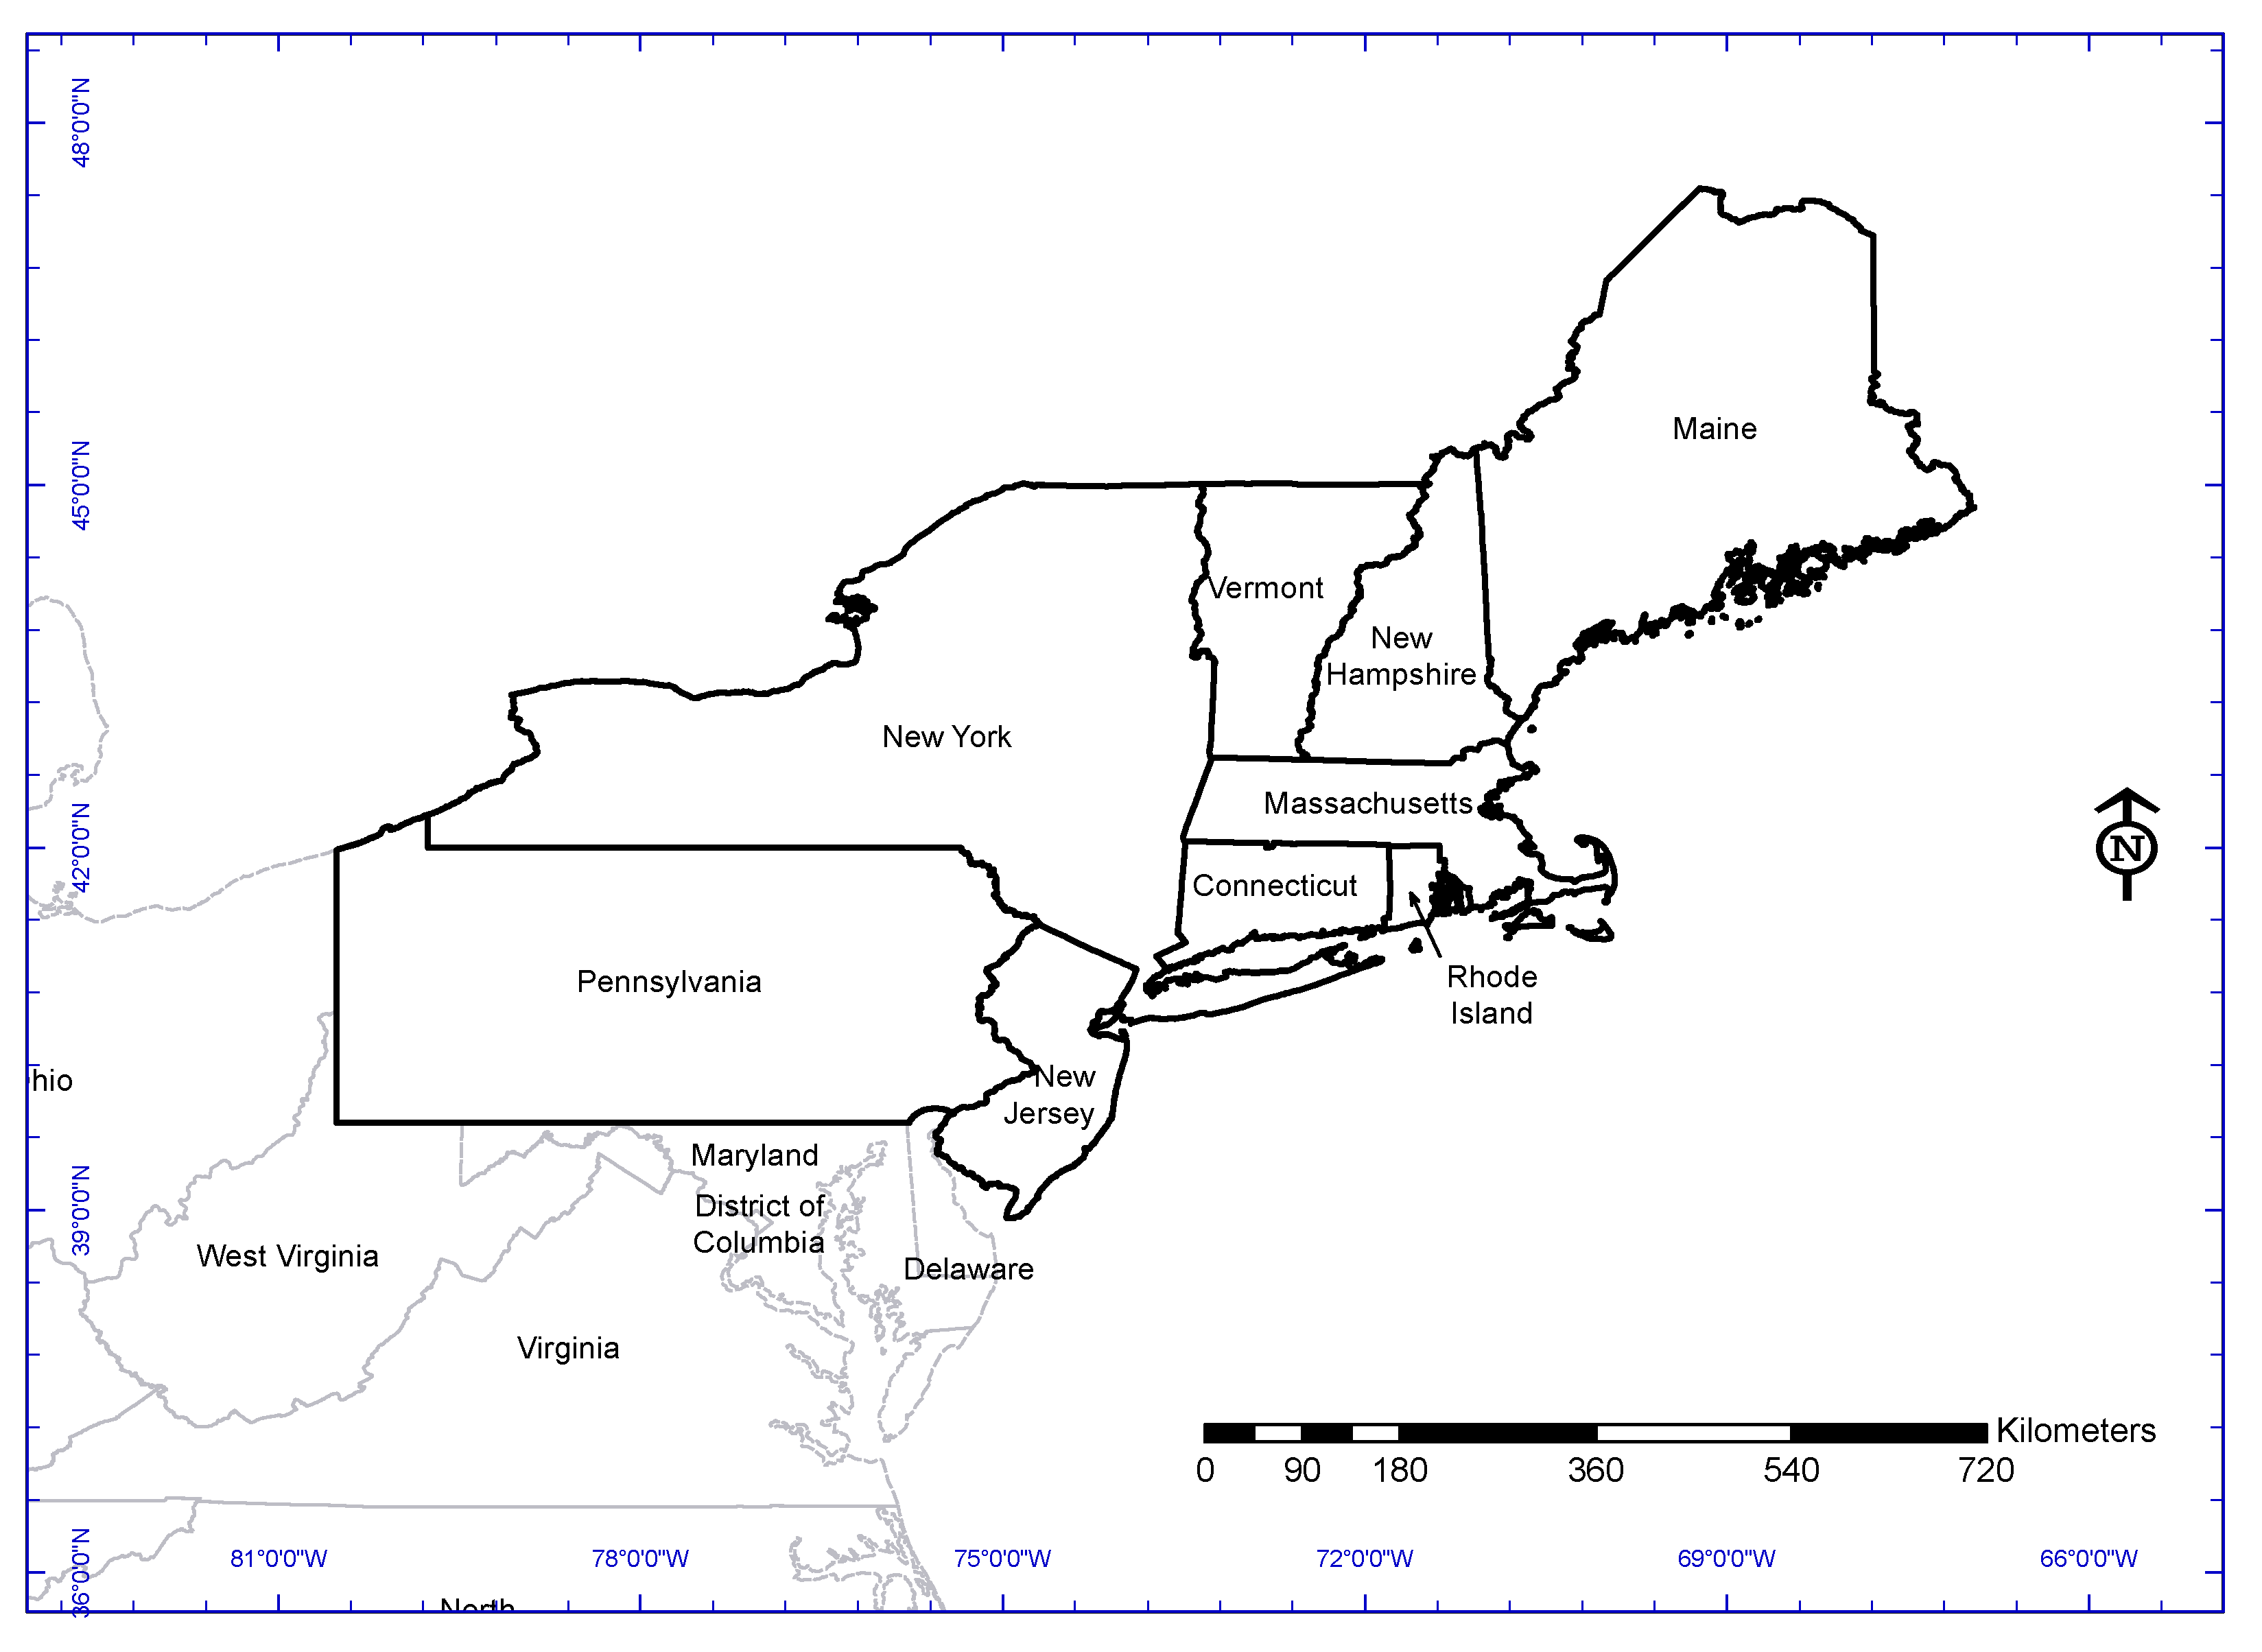
The NE is defined by the US Census Bureau as comprising New England (Connecticut, Maine, Massachusetts, New Hampshire, Rhode Island, and Vermont states) and the Mid-Atlantic (New Jersey, New York, and Pennsylvania states; Figure 1). The NE is also identified as a climate region by the US National Centers for Environmental Information [45].
The NE is characterized by a humid temperate climate, with precipitation distributed throughout the year. Based on the US Climate Divisional Database [46], the regional average temperature for 1901–2015 was 7.6 C, ranging from −5.8 C in January to 20.6 C in July, and mean daily precipitation ranged from 2.4 mm in February to 3.6 mm in June, summing to 1082 mm per year. Over that period, we can estimate from linear regression that annual temperature warmed by 1.3 C while annual precipitation increased by 125 mm per year.
The NE US boundary was taken from the Census Bureau. SPEIbase grid cells whose centers were within the region were included in the analysis.
2.3. Defining and Analyzing Drought Frequency, Intensity, and Duration
We followed the popular US Drought Monitor (a collaboration of the National Drought Mitigation Center at the University of Nebraska-Lincoln, the United States Department of Agriculture, and the National Oceanic and Atmospheric Administration) in defining drought as the driest 20% of conditions in the historic record [47]. Given that SPEI values follow an approximately standard normal distribution for each grid cell and calendar month, this yielded a threshold of −0.84 (the 20th percentile of a standard normal distribution). For the SPEI time series at any given aggregation timescale and location, we defined a drought as one or more consecutive months of below-threshold SPEI.
By analogy with established practice for analyzing heavy rainfall events [48,49,50,51,52,53], we consider trends in drought frequency, intensity, and duration over the NE region. Analyses have been carried out for these drought characteristics in different areas, such as Greece [54], the Contiguous US with emphasis on North Dakota [55] and Iraq [42].
To estimate trends in drought frequency, we carried out linear regression of the time series formed by assigning each non-drought month the value 0 and each month within a drought of length l the value . The average value of this time series over a given period was the frequency of droughts over that period. To allow for autocorrelation in this time series when testing for significance, we included the previous month’s value as well as time as predictors in the linear regression.
We define drought intensity as the average amount by which the SPEI is under the threshold during each drought. Linear regression to assess trends was carried out for each grid cell and aggregation timescale across droughts, with each drought’s midpoint time as the independent variable. Linear regression to detect trends in drought duration was similarly carried out across droughts. Trends in drought characteristics are shown across timescales, normalized to their average values in each gridcell, and mapped for selected timescales including 1 month (the shortest aggregation period) and 12 months (relevant to longer-term impacts on vegetation and water supplies) [41,56].
To better understand the trends seen in drought characteristics, we compared the actual trends to those expected under an idealized statistical model of regional SPEI. In this model, the SPEI-1 time series is a sequence of serially uncorrelated random variables that each follow a normal distribution whose mean and variance are changing linearly in time, such that the overall average is 0 and the overall sample variance is 1. Idealized SPEI-n series for larger n were obtained as moving averages of the SPEI-1 values, scaled to unit sample variance. 100 synthetic realizations of SPEI were generated under this idealized model, for which the only quantities derived from the actual SPEI data were the positive linear trends in the SPEI-1 mean and variance (of 0.229 and 0.082 per century respectively). When comparing drought statistics in this synthetic data set with those of actual SPEI, discrepancies may be due, for example, to non-normality, spatial variability within the NE region, or nonlinear time evolution of hydroclimate.
To relate changes in drought characteristics to the broader SPEI distribution, we also calculated the regional SPEI mean and variance for the first and last 30 years of complete SPEI data, 1905–1934 and 1986–2015 respectively. We plotted the histograms of SPEI over each of these periods and compared them with those expected under a normal distribution with the same mean and variance.
3. Results
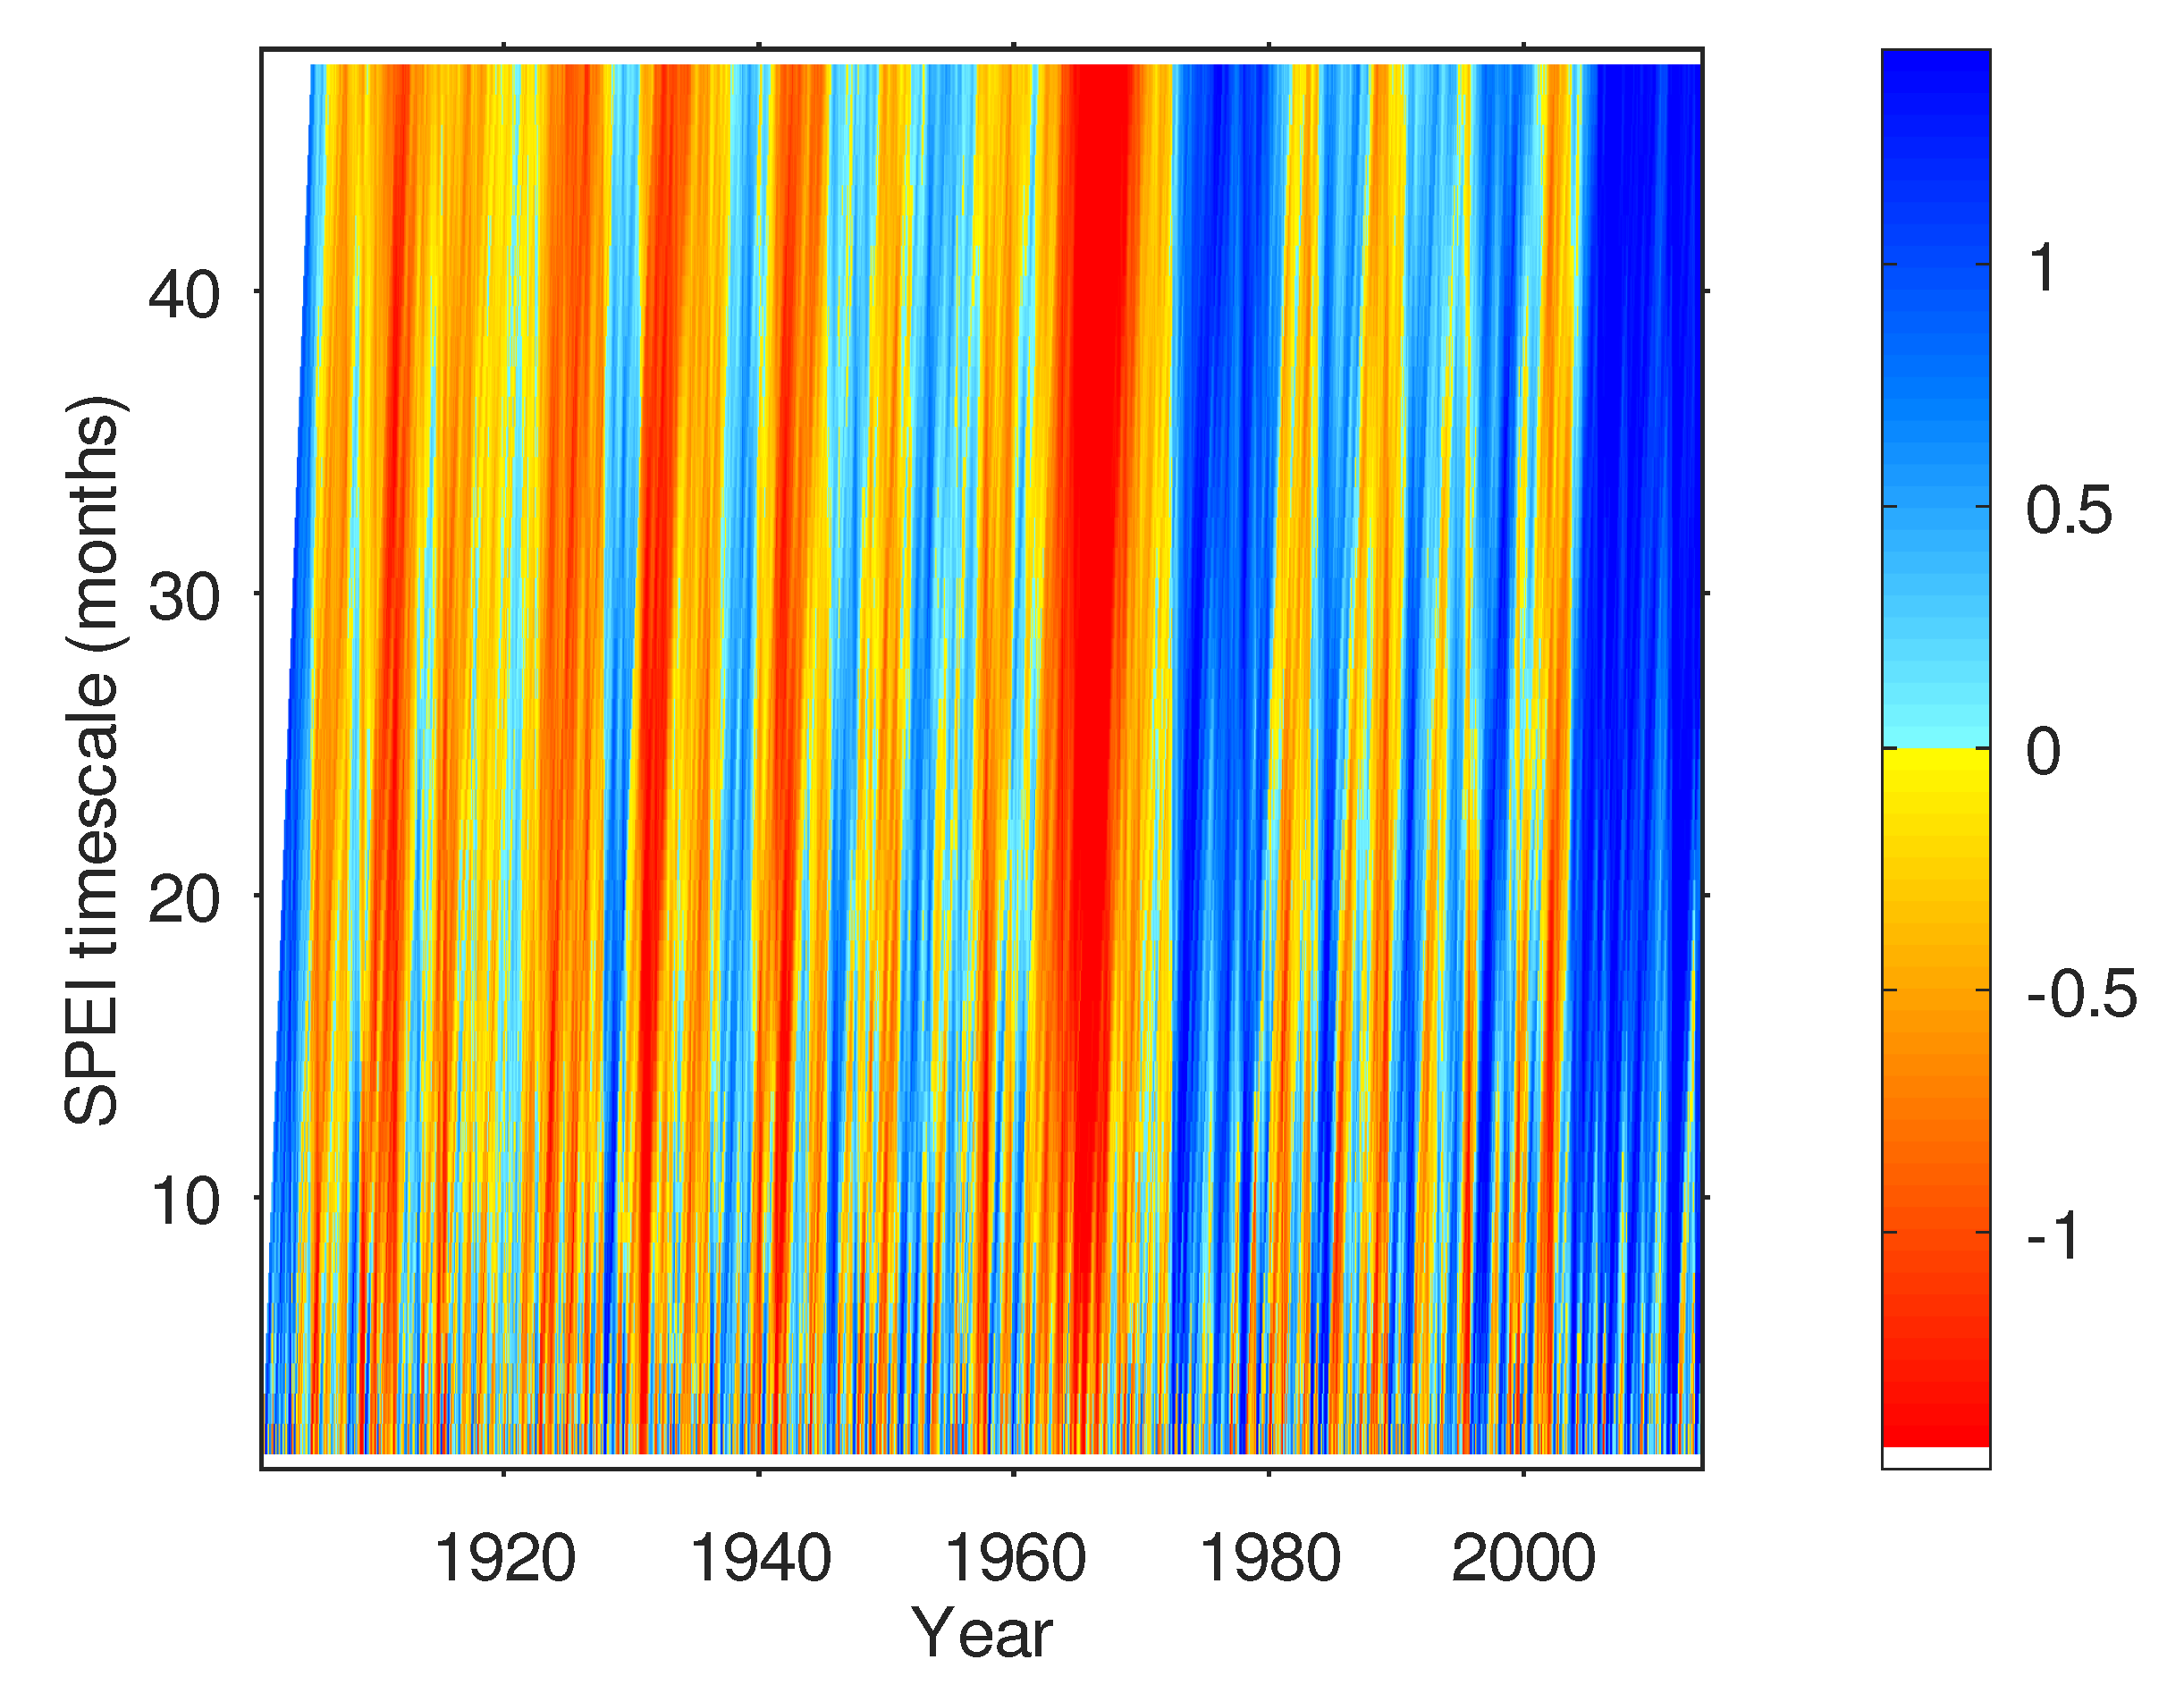
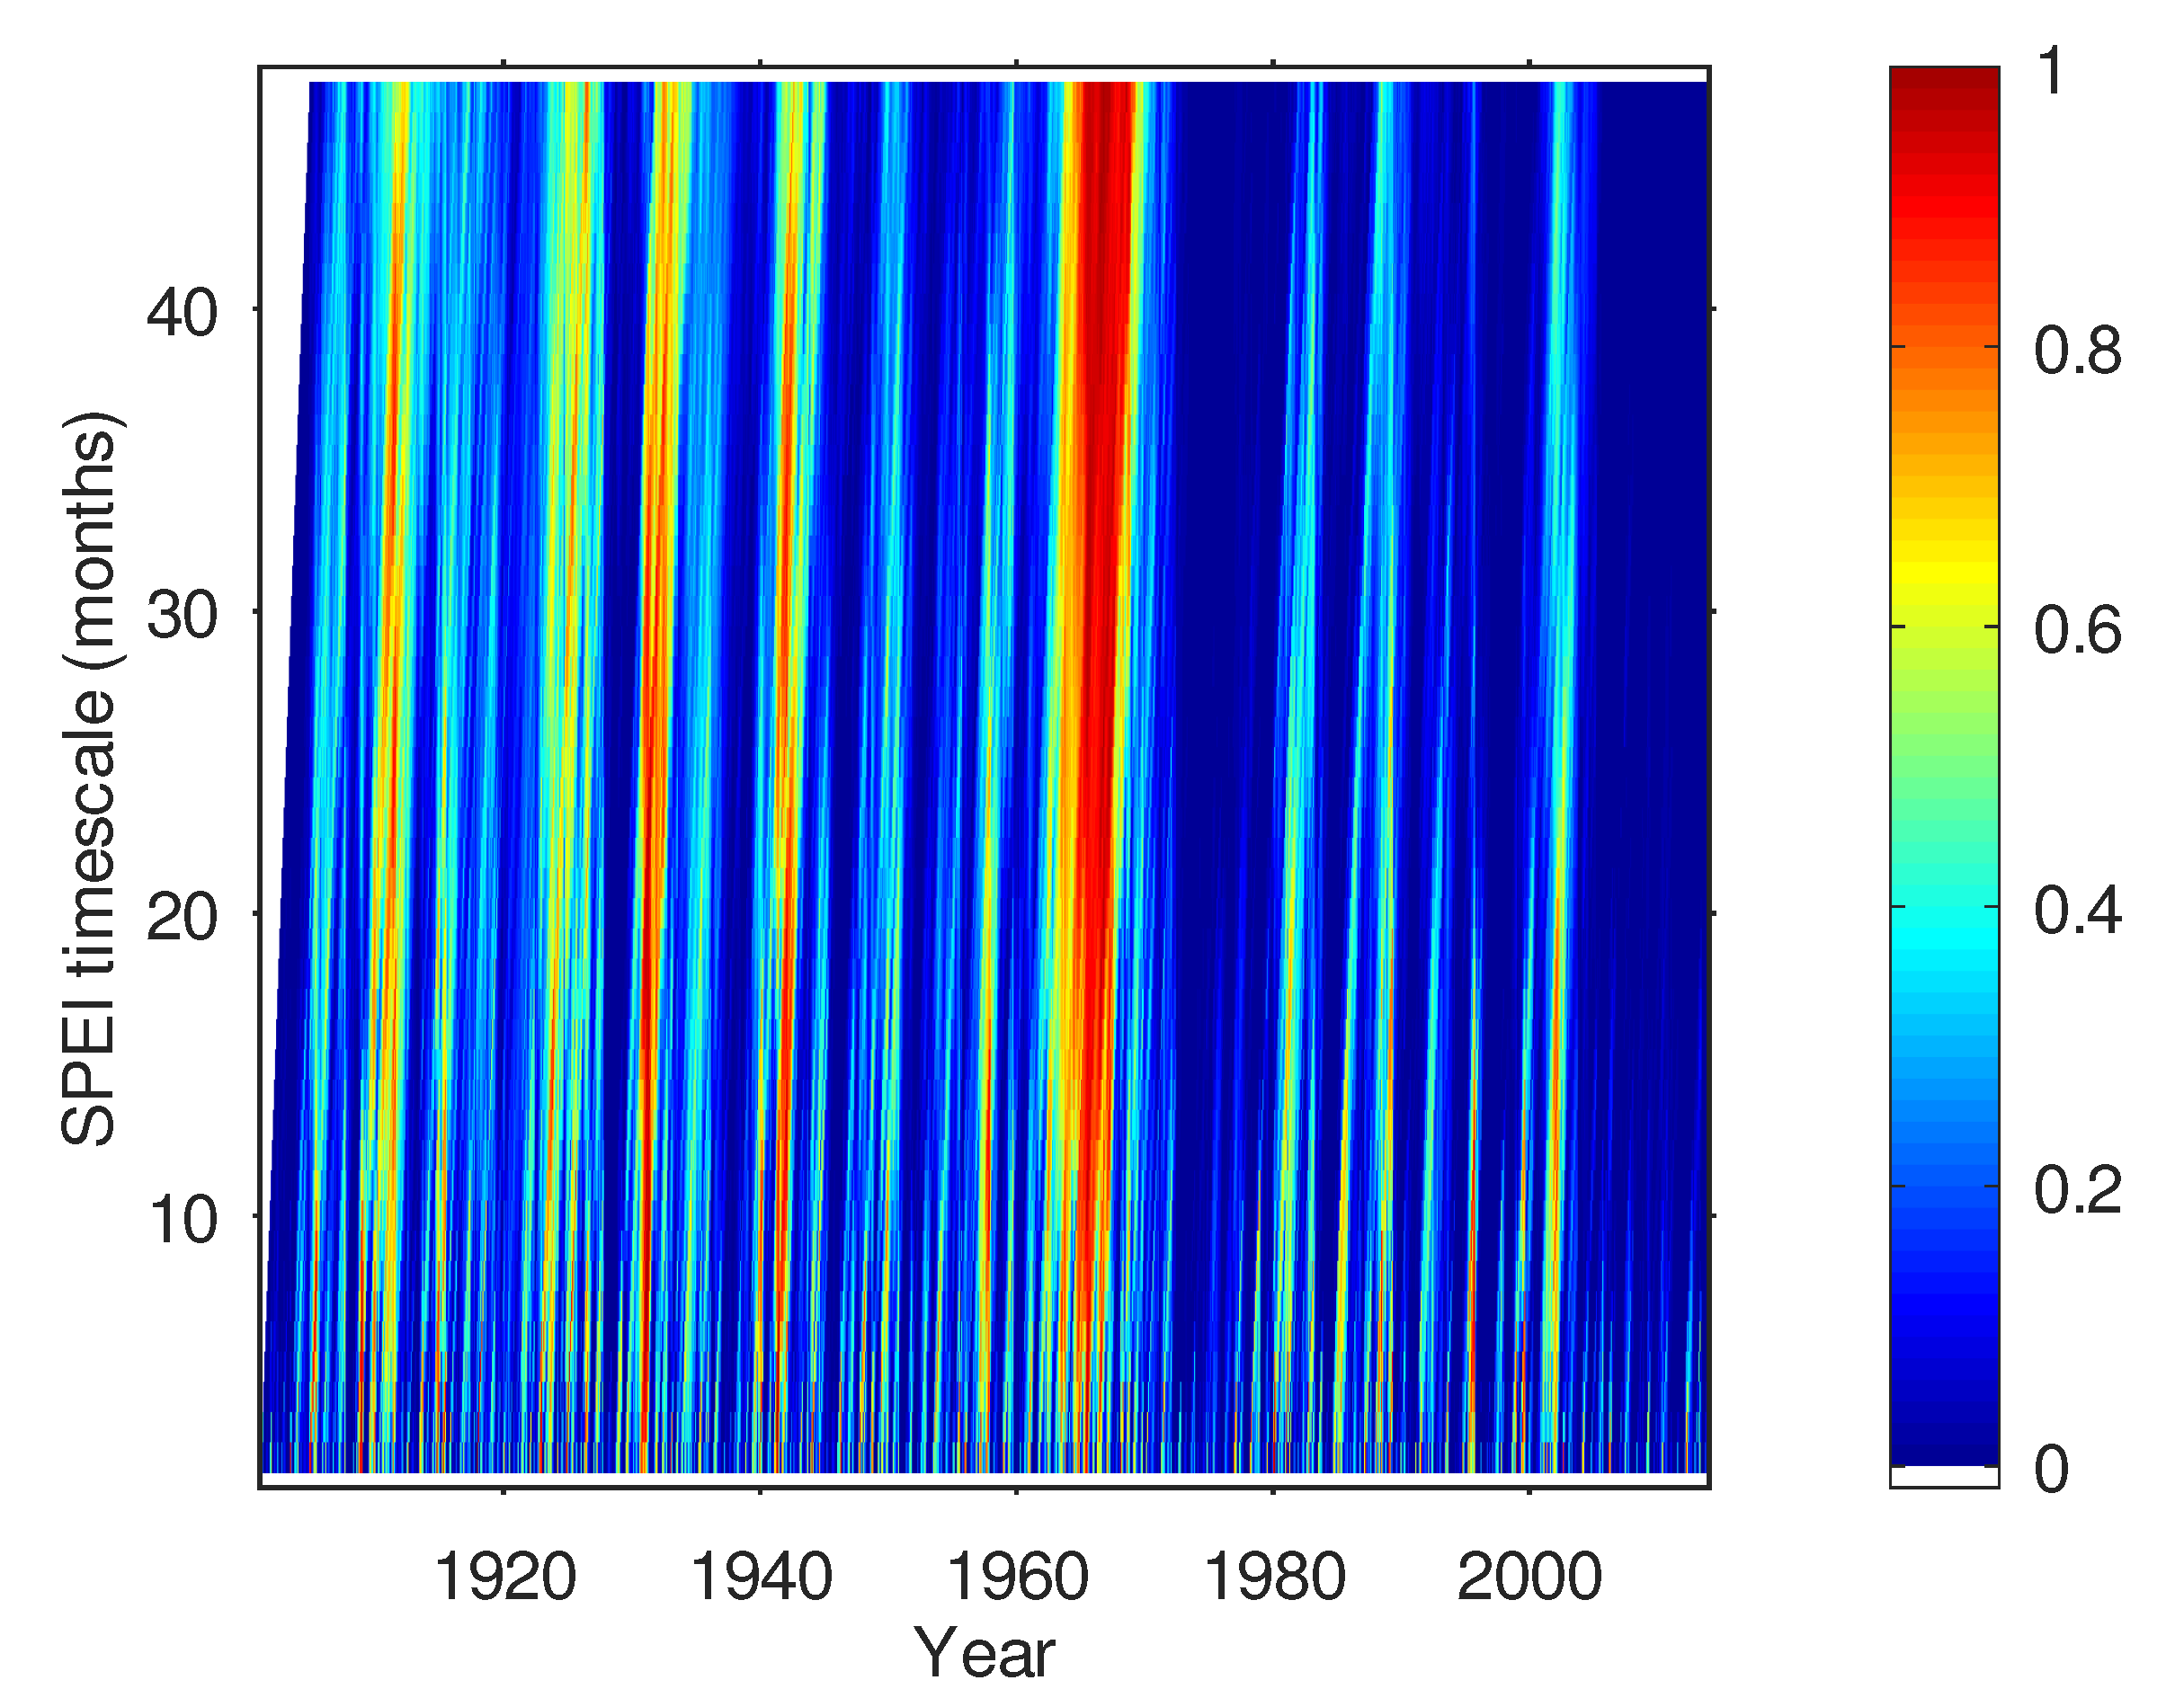
Regional mean SPEI across aggregation timescales (Figure 2) showed the broad hydroclimate trends discussed above, shifting to more positive values, indicating moister conditions, from the 1970s onward. As expected from the way they are defined, the longer SPEI timescales, shown towards the top of Figure 2, showed slower oscillations between wet and dry periods. The longer SPEI timescales indicated most clearly major regional droughts, most notably in the 1960s but also, for example, in the early 1930s and early 2000s. These periods also appeared as times when most of the region experienced drought, as measured across a range of timescales (Figure 3). On average, as expected based on the chosen threshold, an average of about 20% of the grid cells were in drought at any one time based on any given aggregation timescale, though the mean area fraction in drought decreased over time.
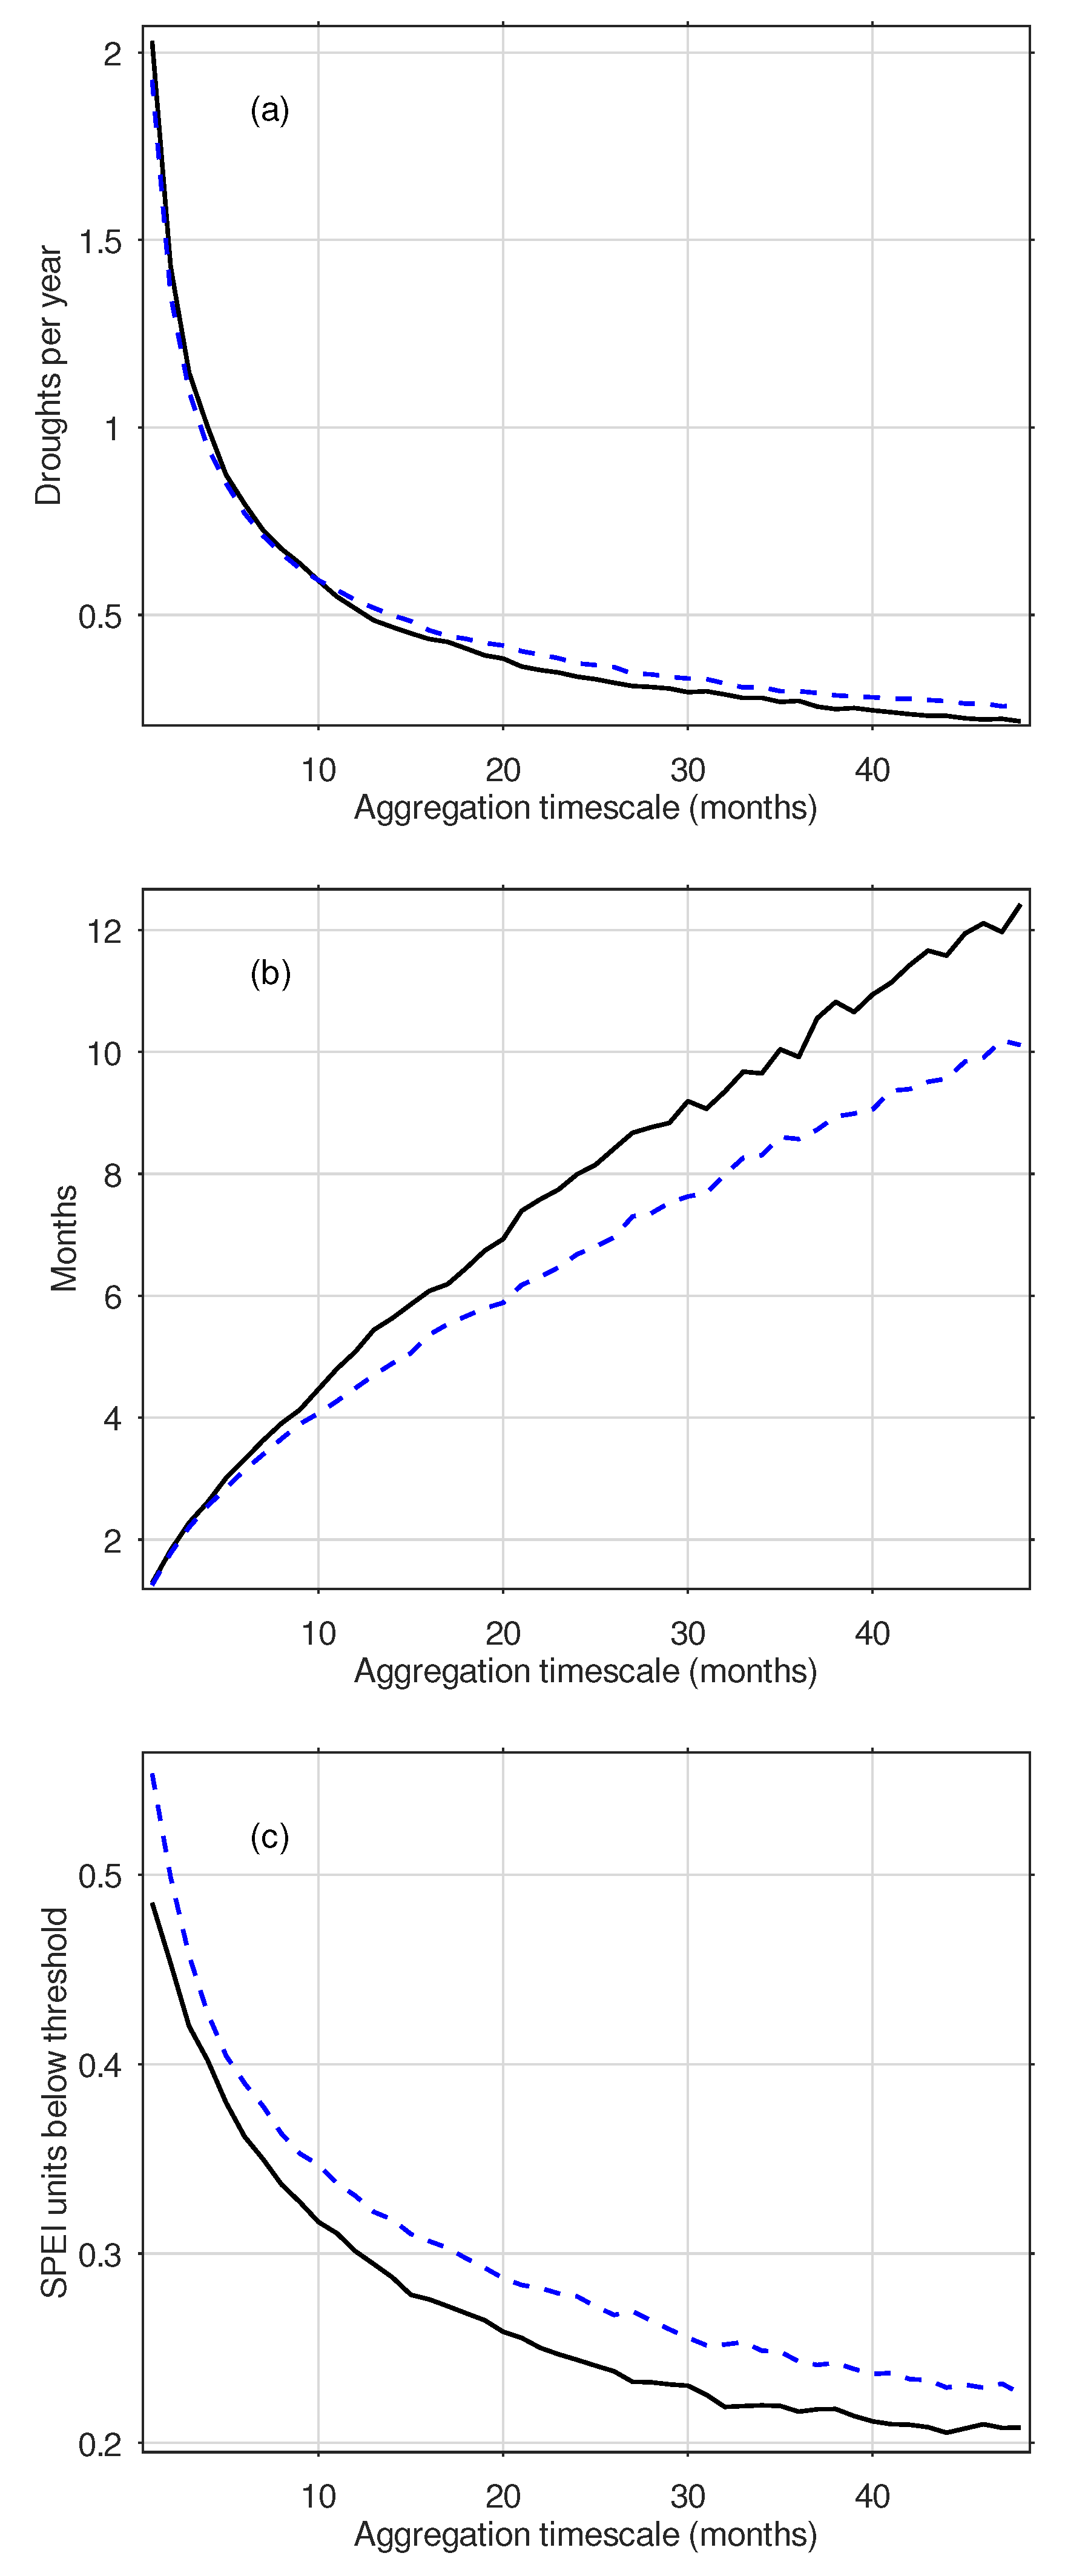
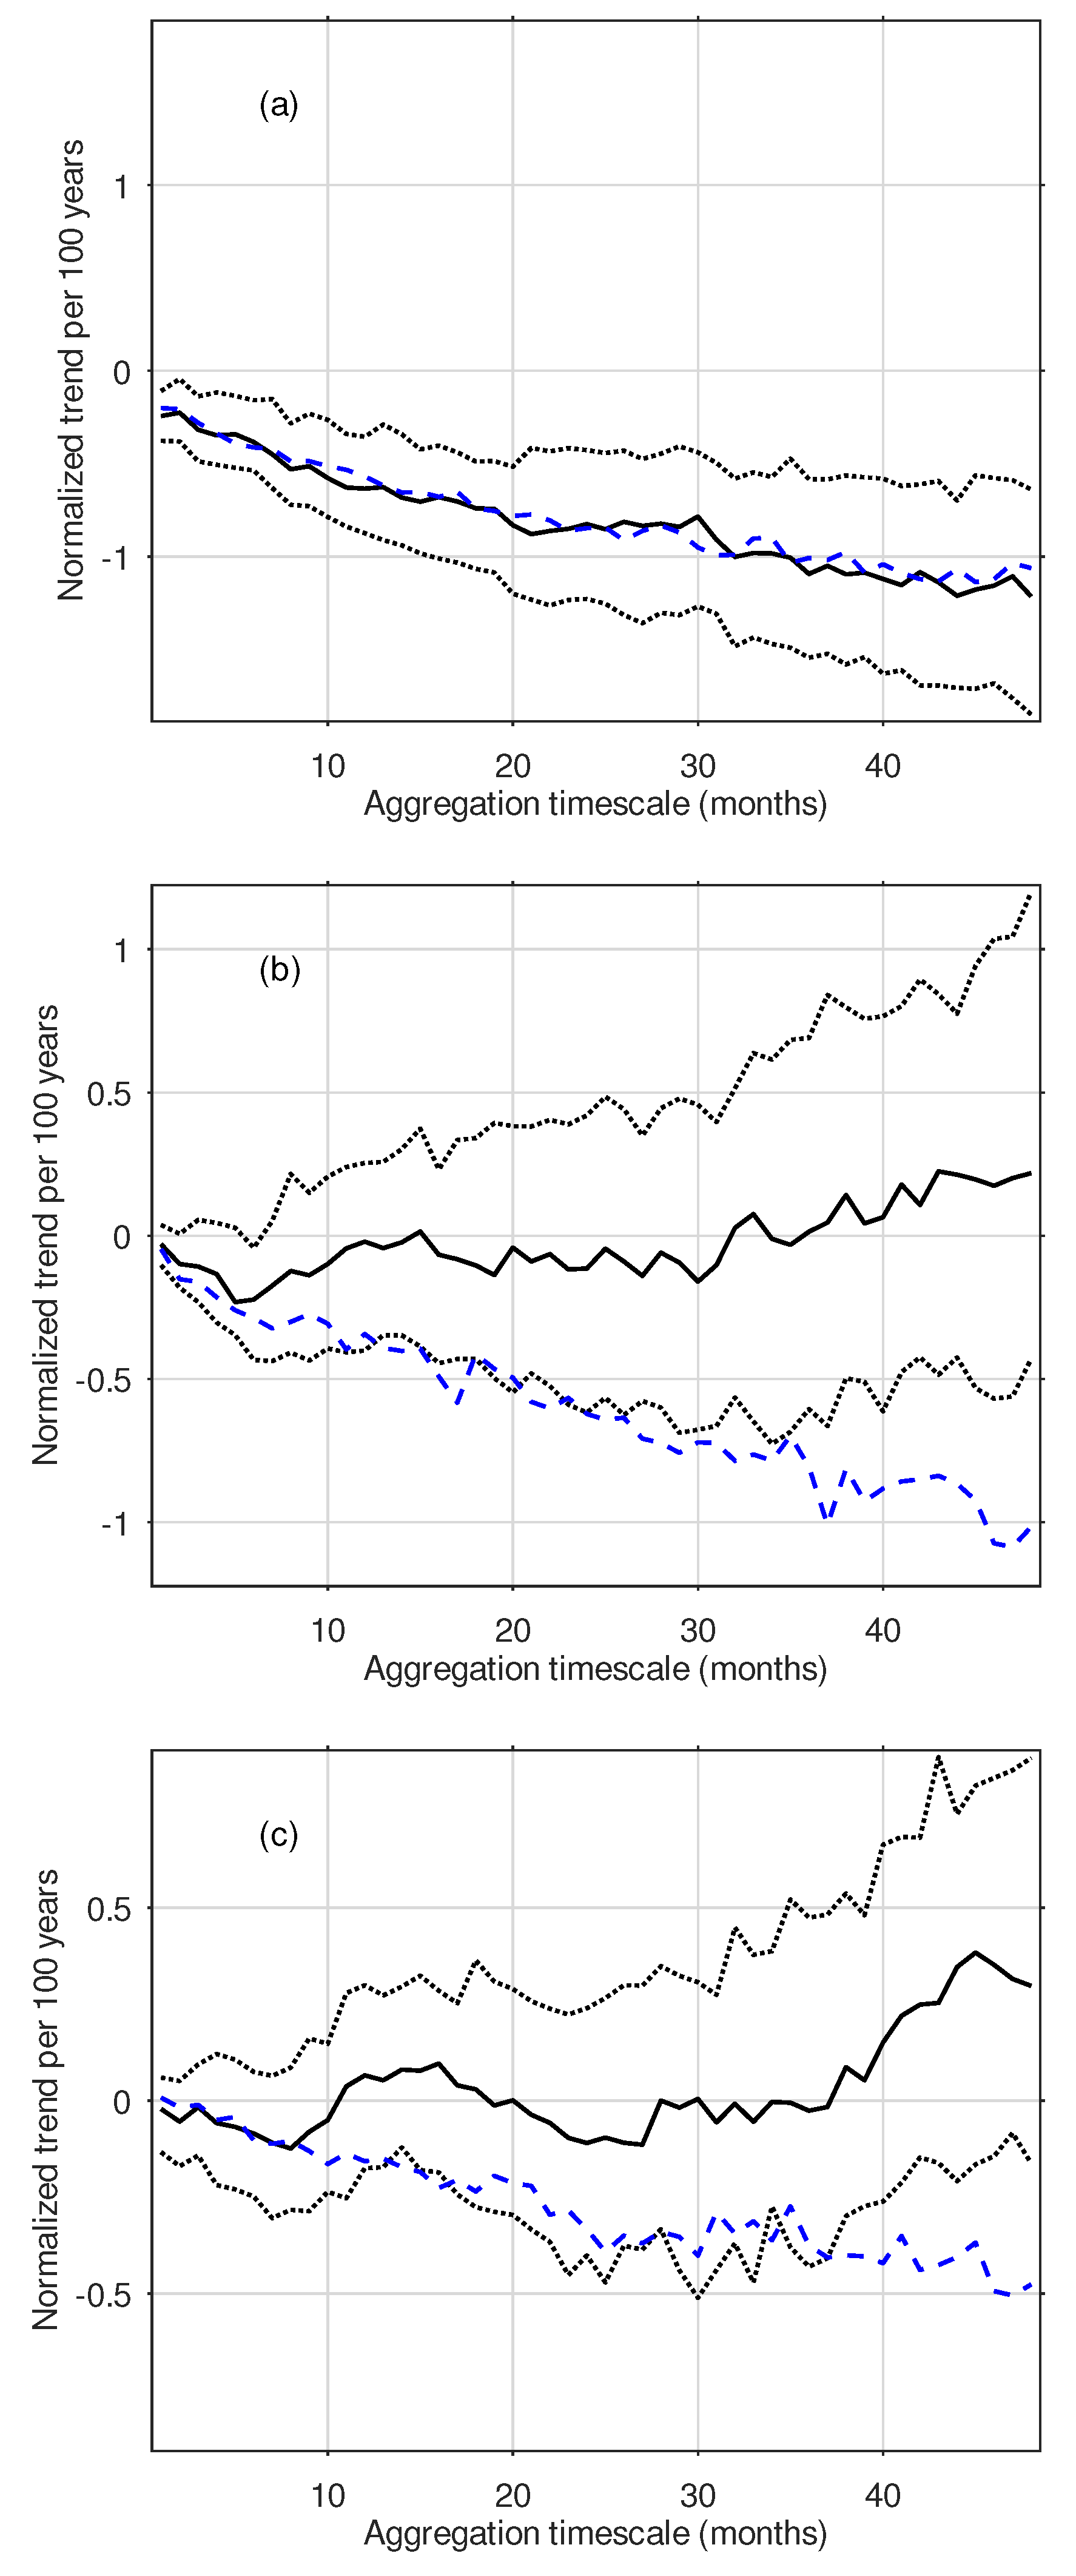
On average, as we go to progressively longer aggregation timescales, droughts become less frequent (Figure 4a) and last longer (Figure 4b) though with lower mean intensity (Figure 4c). These characteristics can be understood as consequences of the moving average process involved in going to longer SPEI aggregation timescales, coupled with the very low correlation of monthly hydroclimate anomalies between adjacent months in this region. Thus, at the 1-month timescale, the mean drought duration is under 2 months (Figure 4b), meaning that a below-threshold monthly SPEI-1 is usually followed by non-drought SPEI-1 the following month. In fact, the general dependence of drought characteristics on aggregation timescale is well captured by our idealized simulation of SPEI, in which spatial variability is ignored and SPEI-1 has no temporal autocorrelation beyond a long-term linear trend (dashed blue curves in Figure 4). However, the increase in drought duration as aggregation timescales get longer was more than expected from the idealized simulation (Figure 4b), which could be due to autocorrelation of P minus ET over timescales of a year or more, or else to non-normality in the P minus ET distribution that results in the longer-timescale SPEI not being a linear combination of SPEI-1.
Drought frequency decreased substantially for the vast majority of gridcells in the NE over 1901–2015, and the relative decrease was greater for longer aggregation timescales, consistent with expectations from our idealized model (Figure 5a). Drought duration tended to decrease over time for most aggregation timescales, except for the longest ones of over 3 years (Figure 5b). Drought intensity similarly showed a weak tendency to decrease for most of the aggregation timescales while increasing for the longest ones (Figure 5c). The duration and intensity trends were not uniform across gridcells, with the range of the 25th to 75th percentile of gridcells generally including zero, but for longer aggregation timescales tended to be more positive than expected from our idealized model (Figure 5b,c).
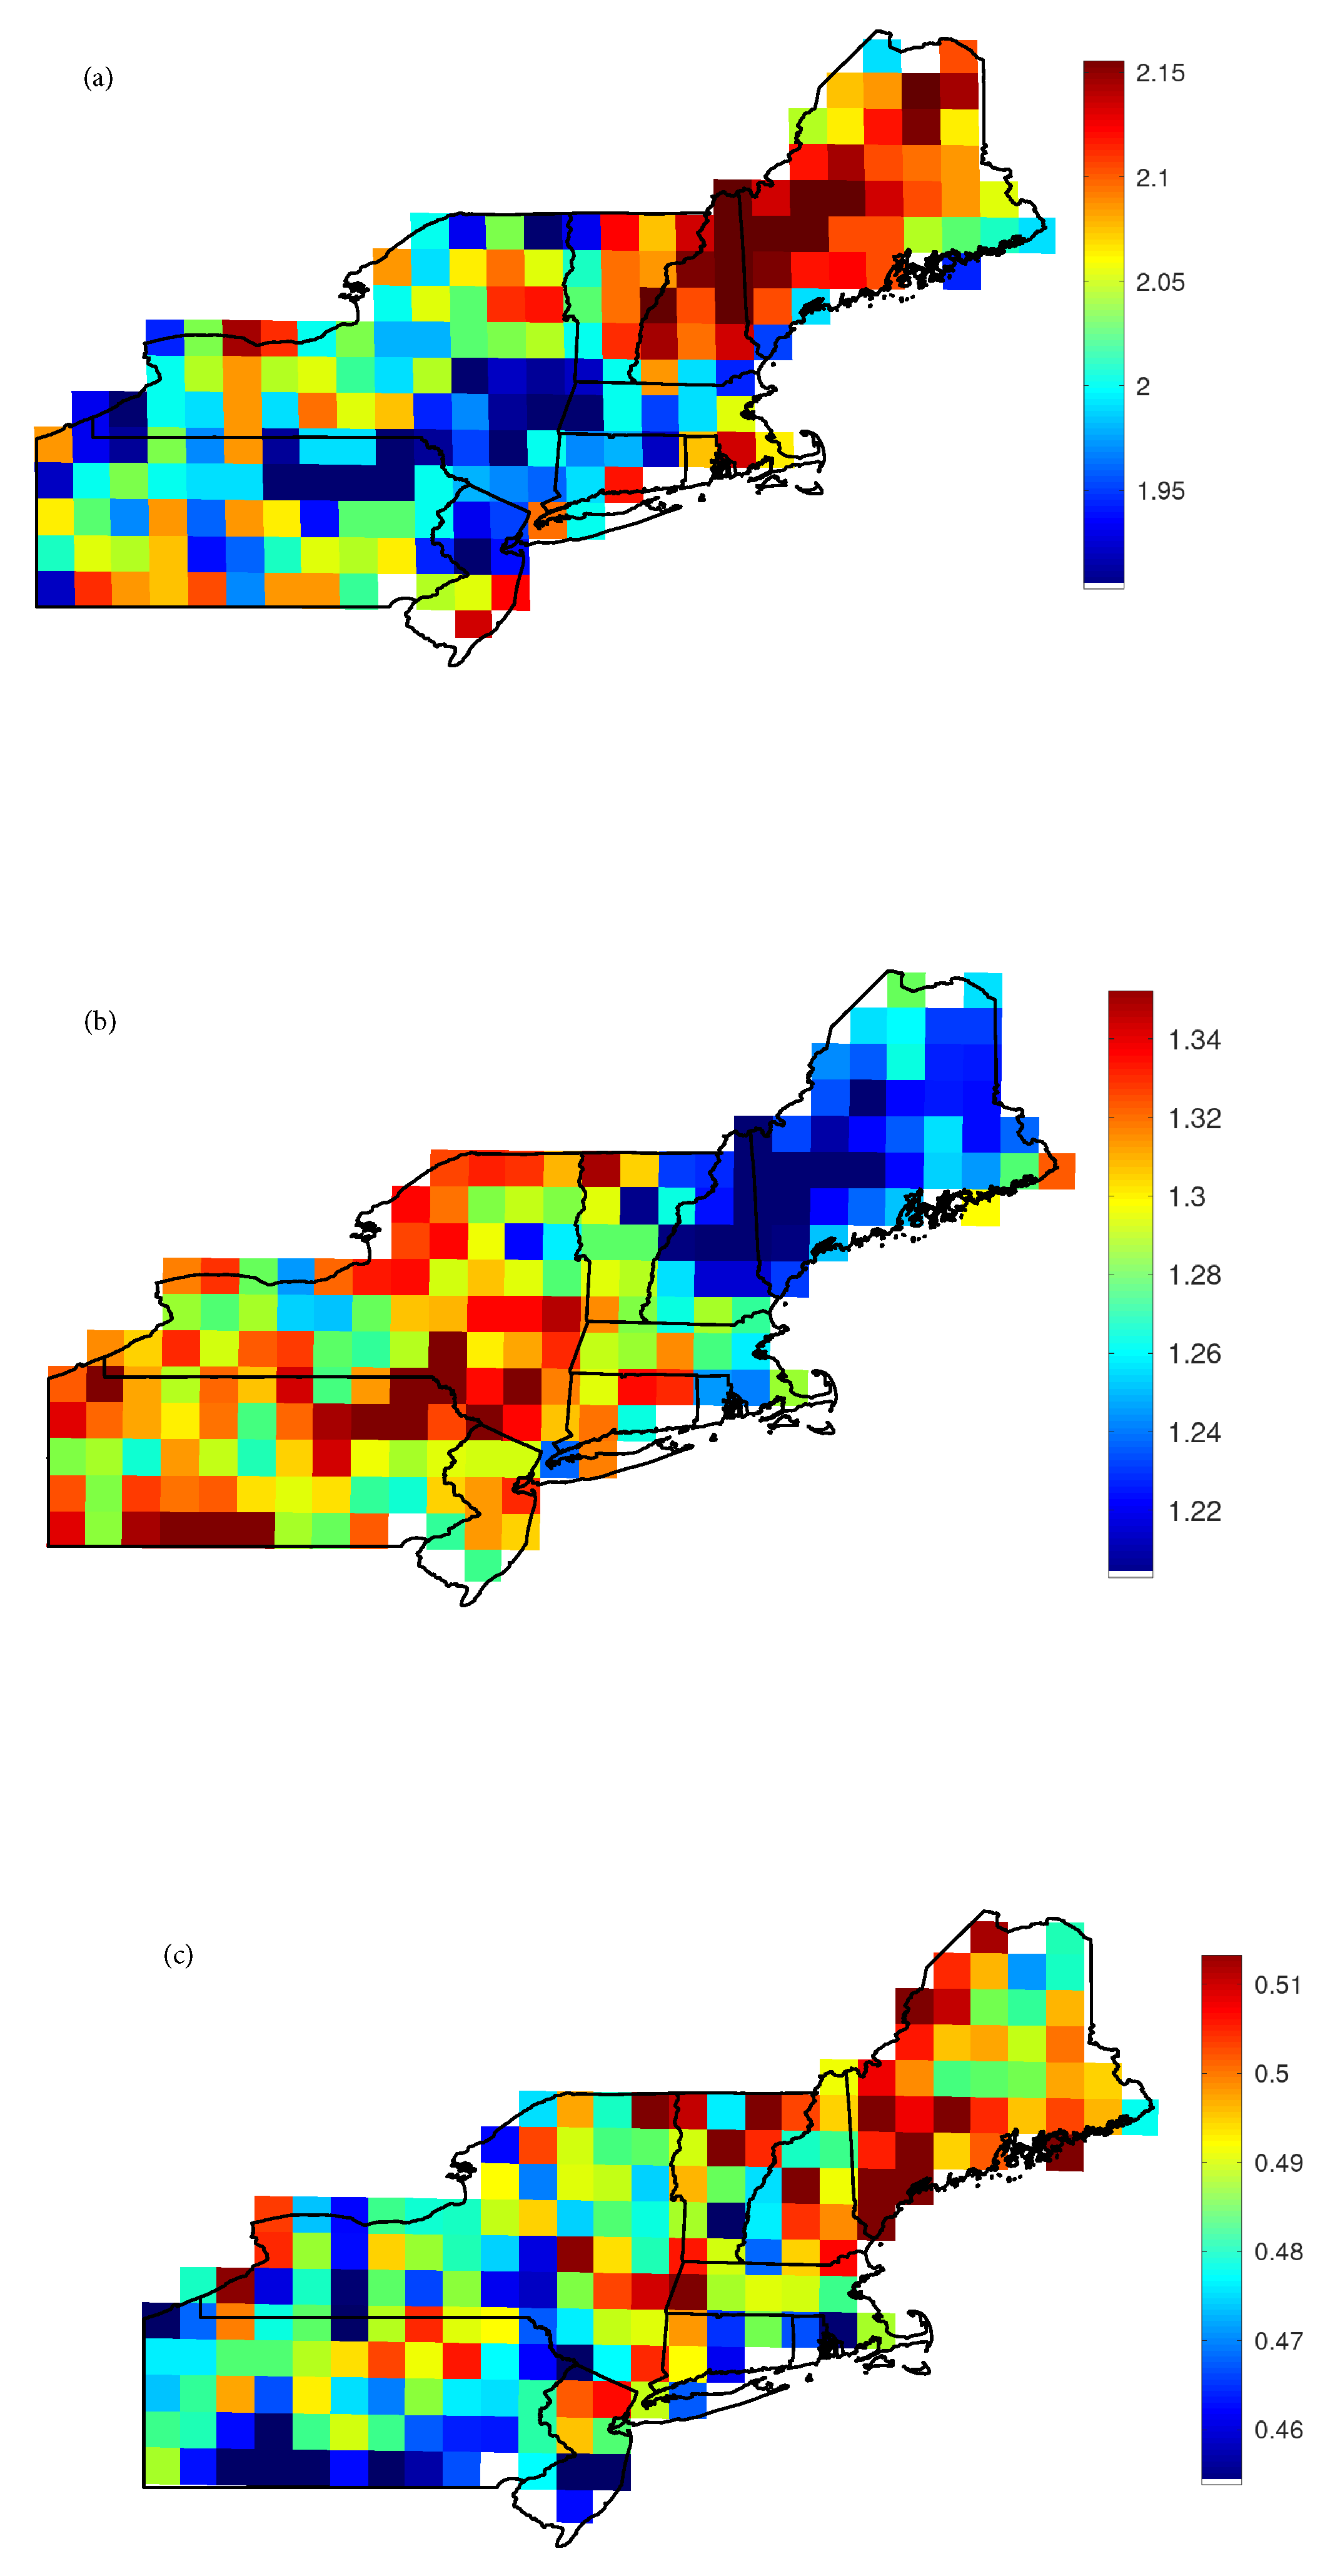
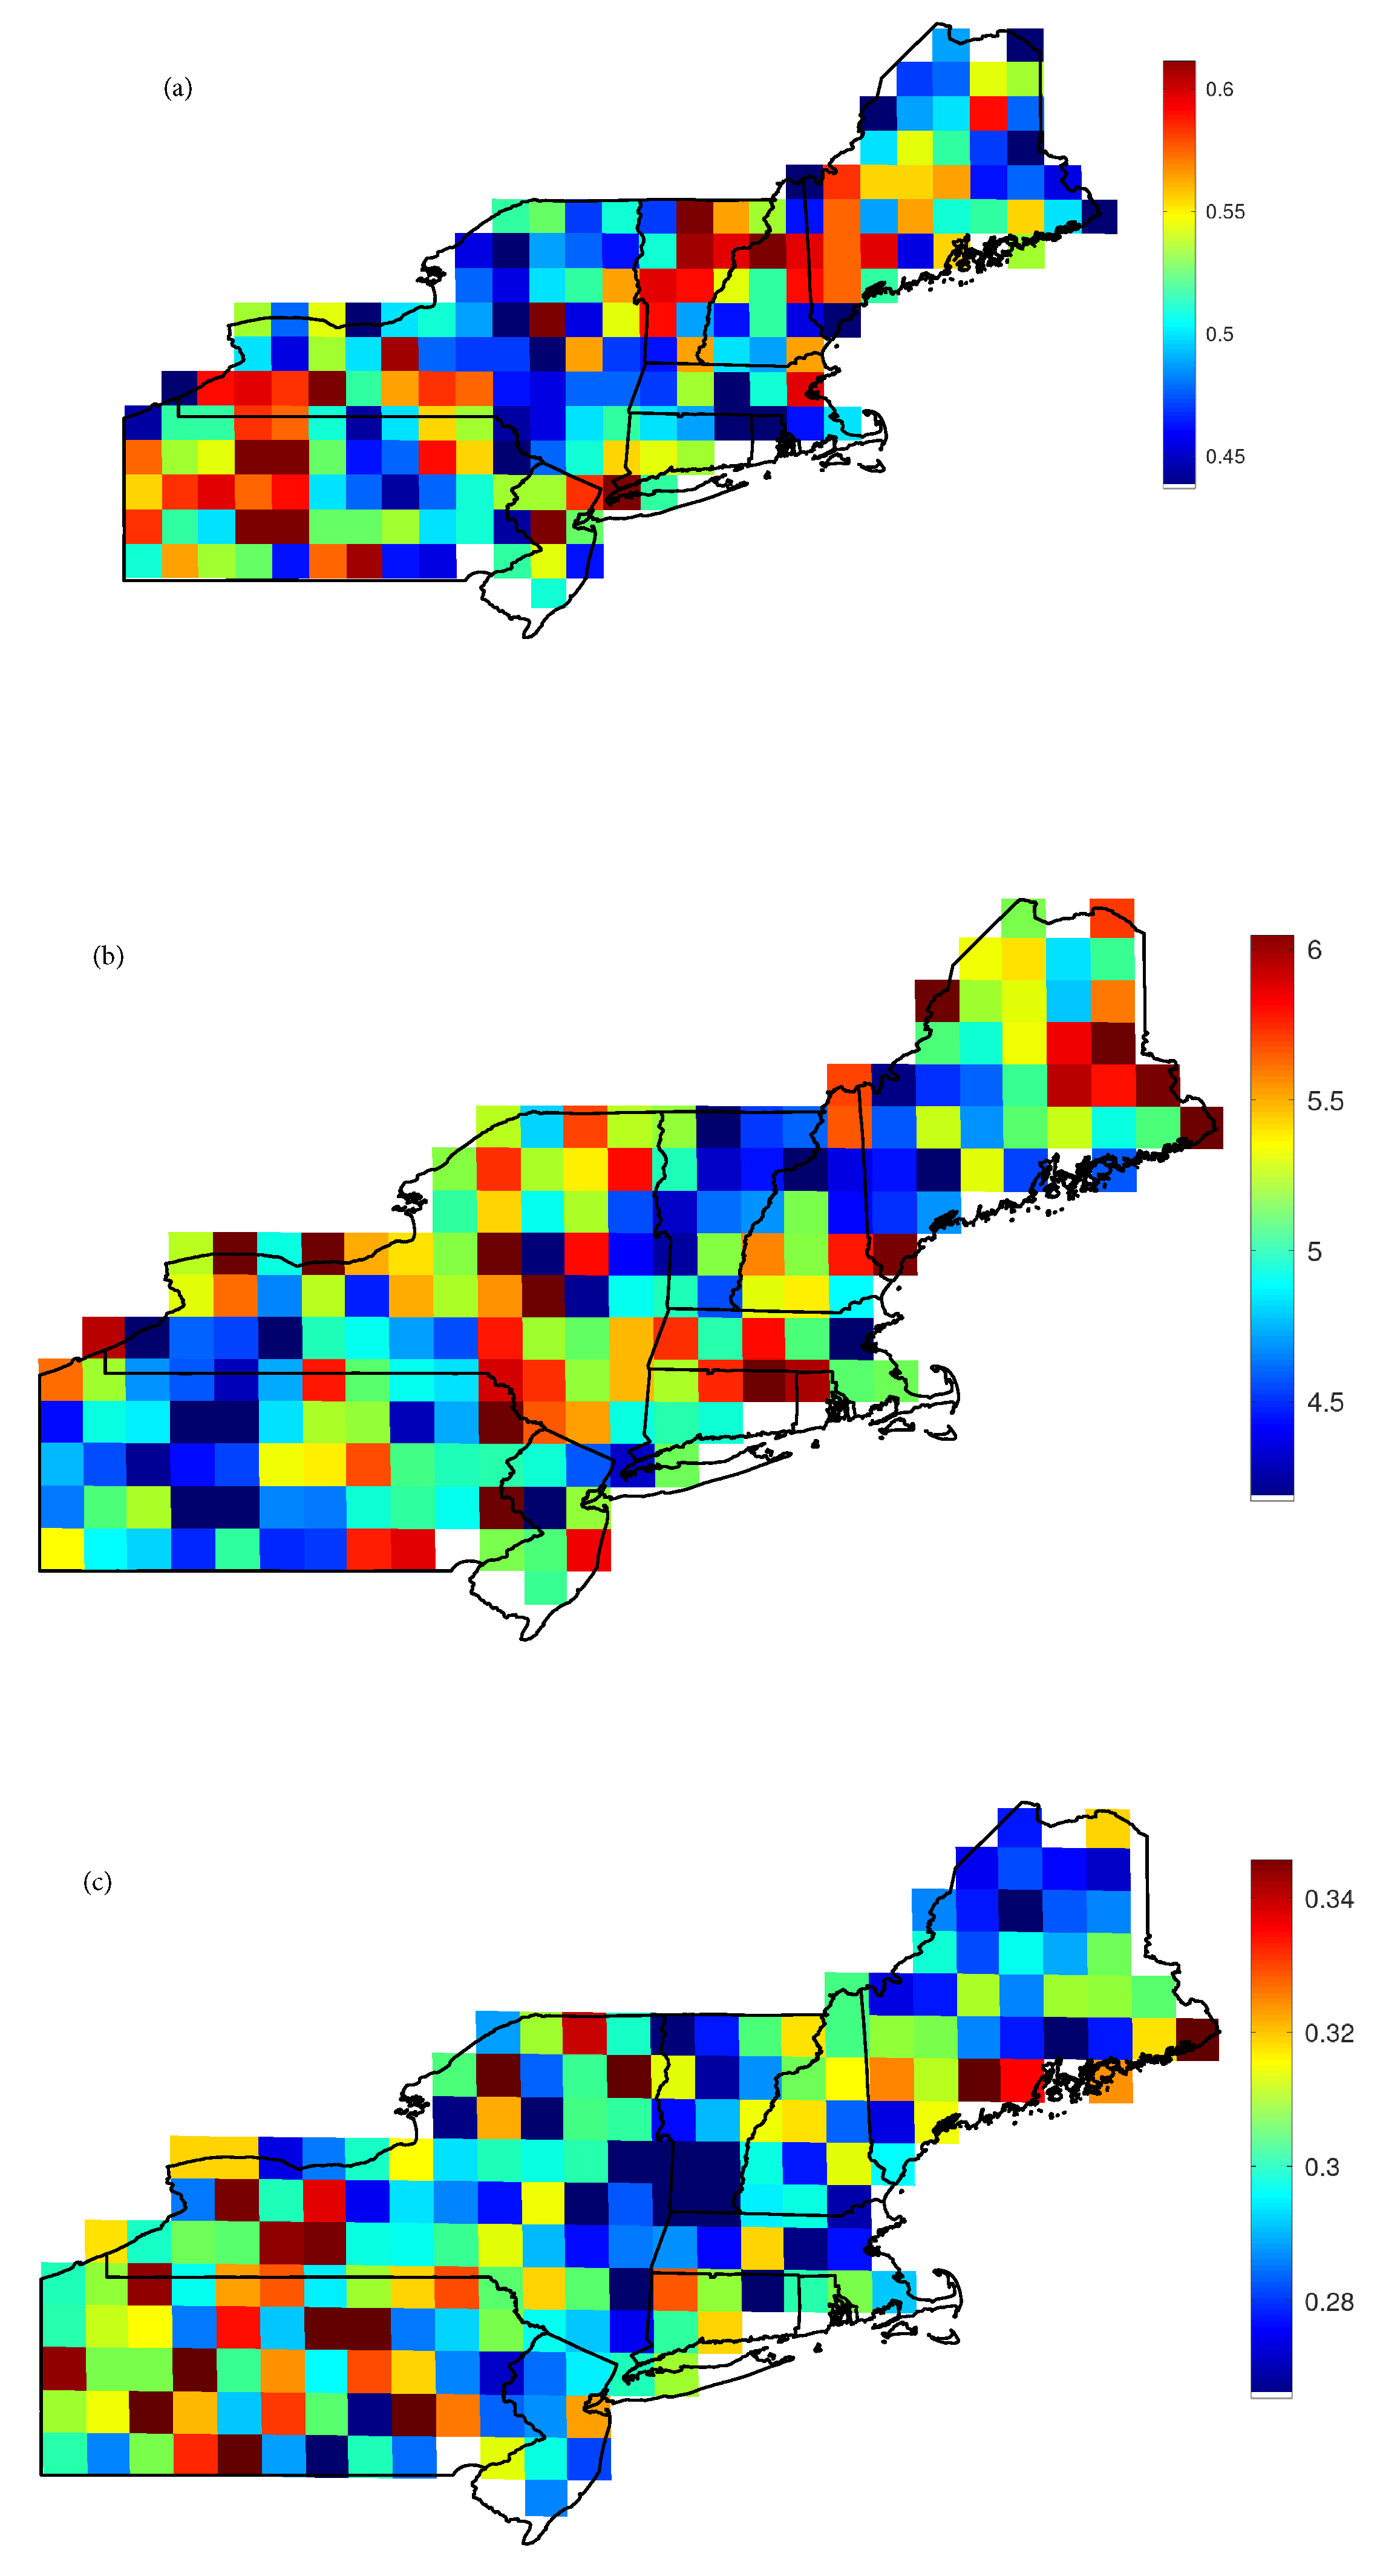
Mapping the mean drought characteristics shows that there was relatively little spatial variation across the region, consistent with the normalized nature of SPEI and the broadly similar climate over the region. For SPEI-1, the northern part of the NE tended to have somewhat more frequent, shorter, more intense droughts (Figure 6), but this pattern was not evident for SPEI-12 (Figure 7).
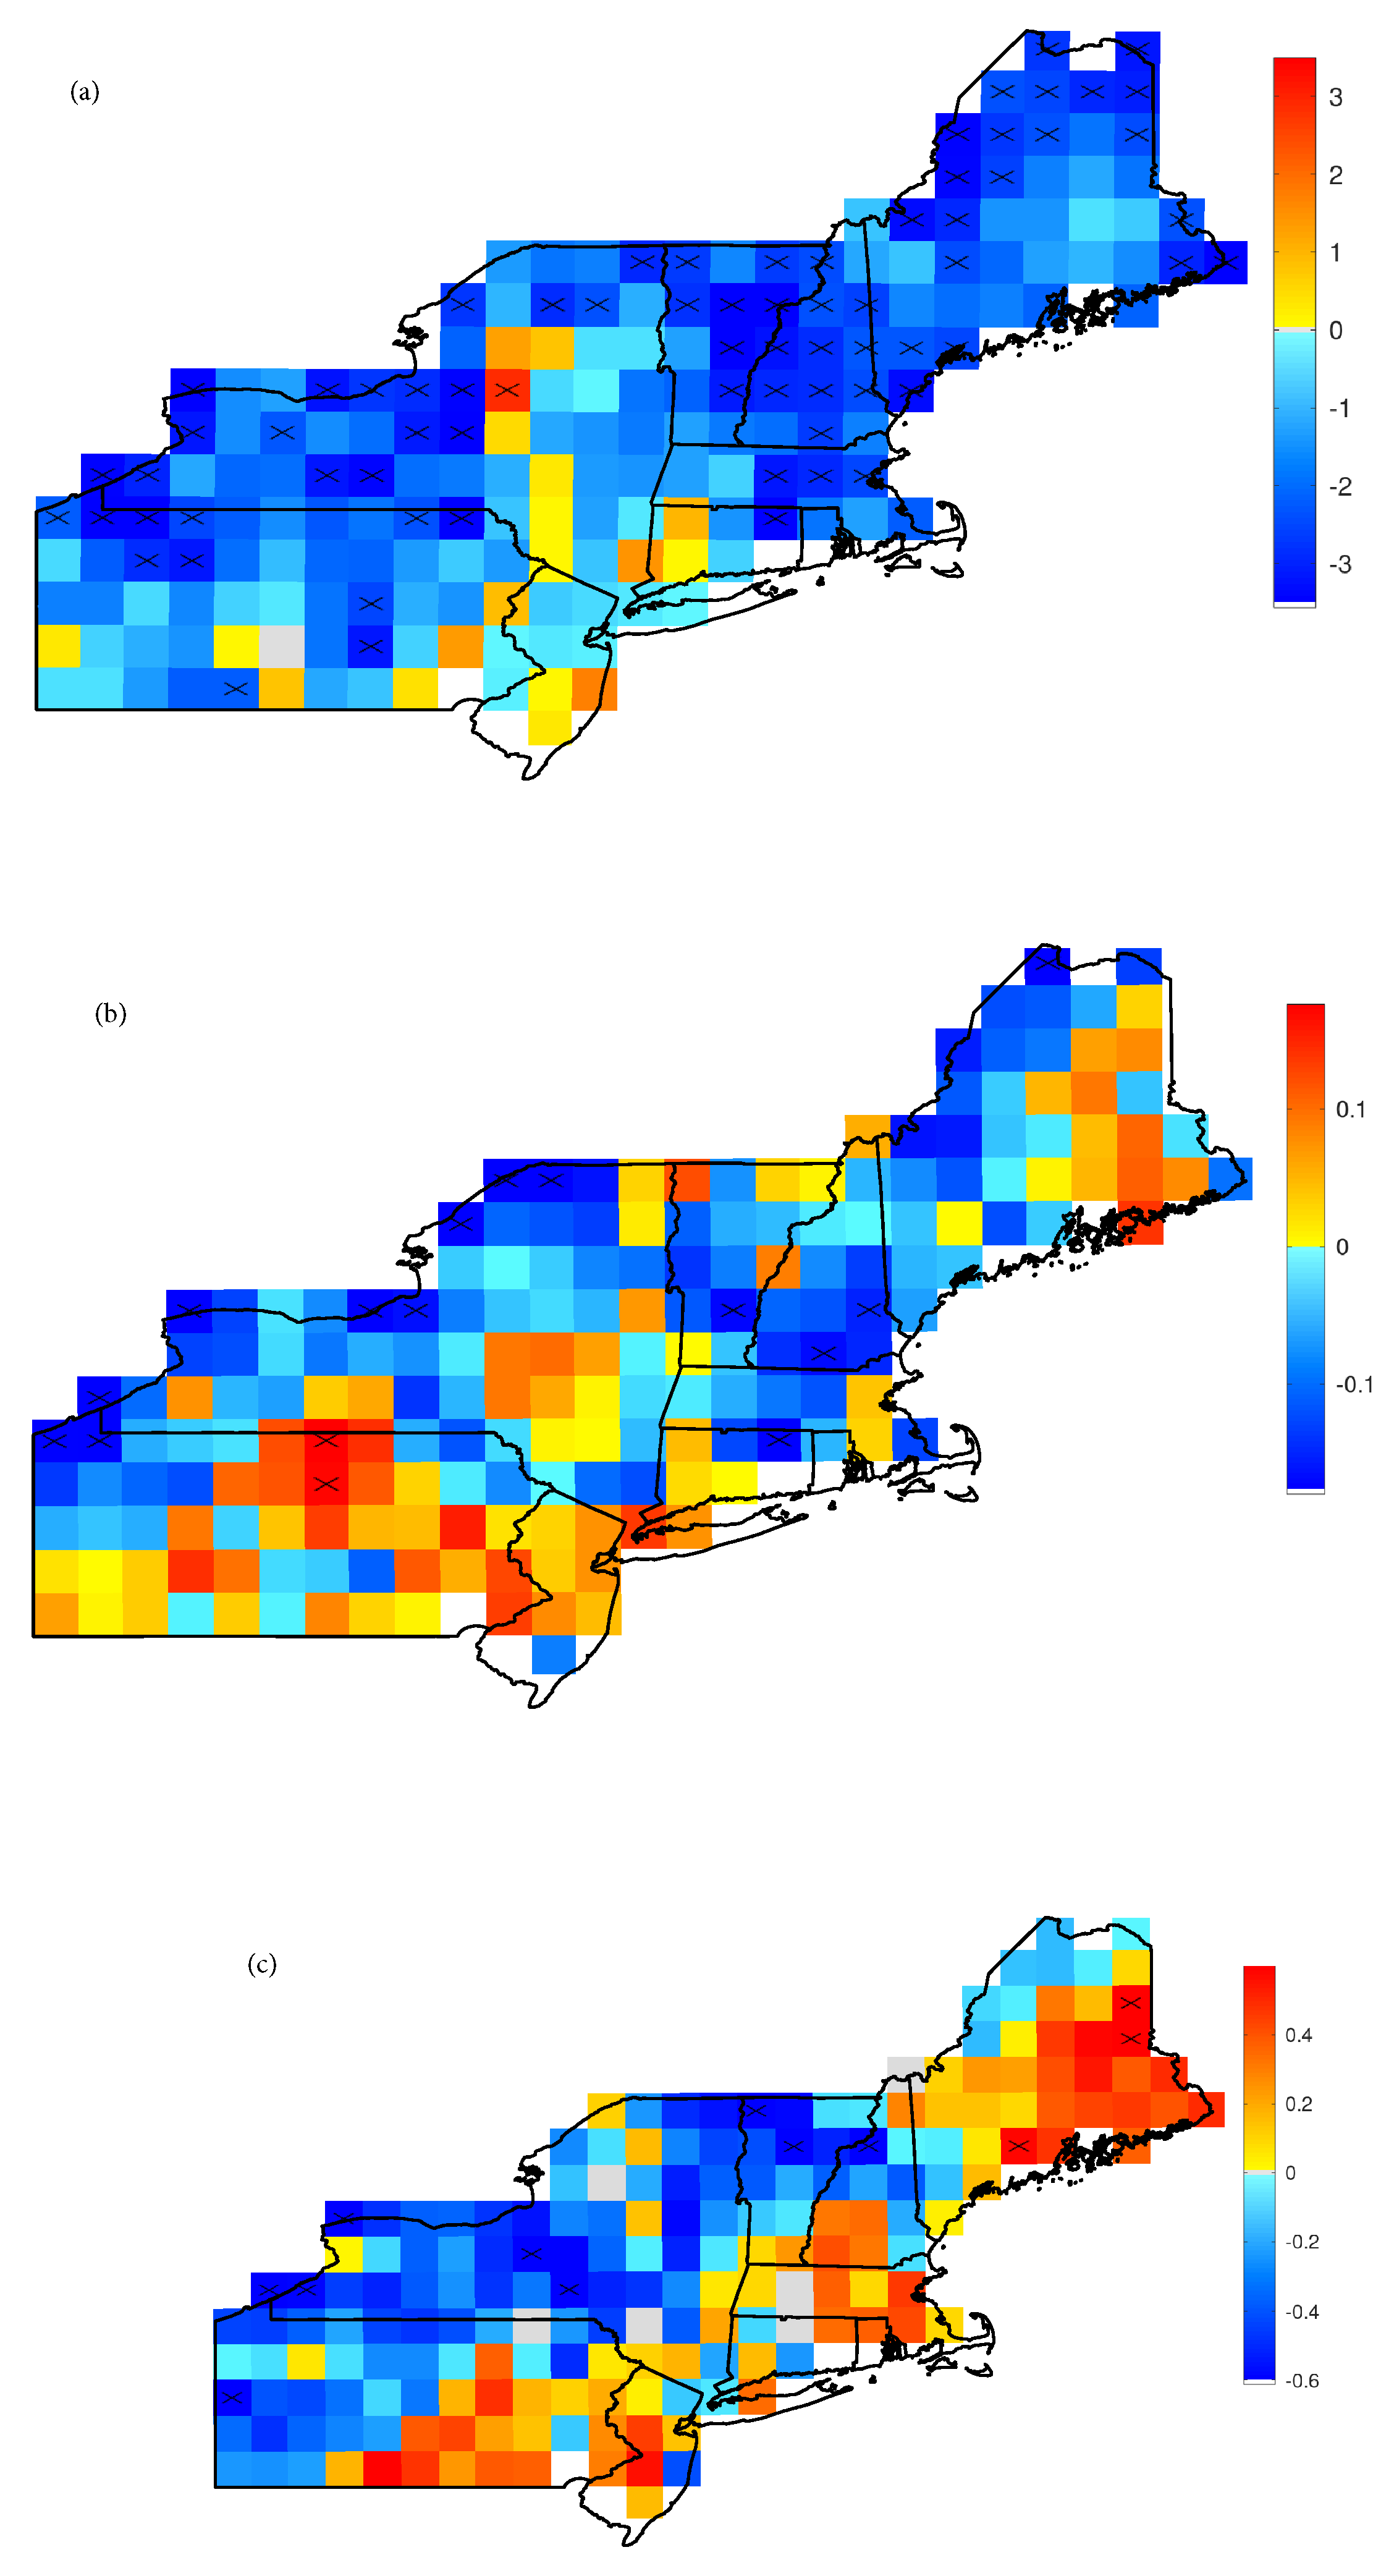
Linear trends in drought characteristics are overwhelmingly negative for frequency, with many of the gridcells having significant negative trends, particularly in the northeast half of the region and over longer aggregation timescales (Figure 8a and Figure 9a). For drought duration and intensity, trends are less consistent, and only significantly different from zero at a few grid cells (Figure 8b,c and Figure 9b,c).
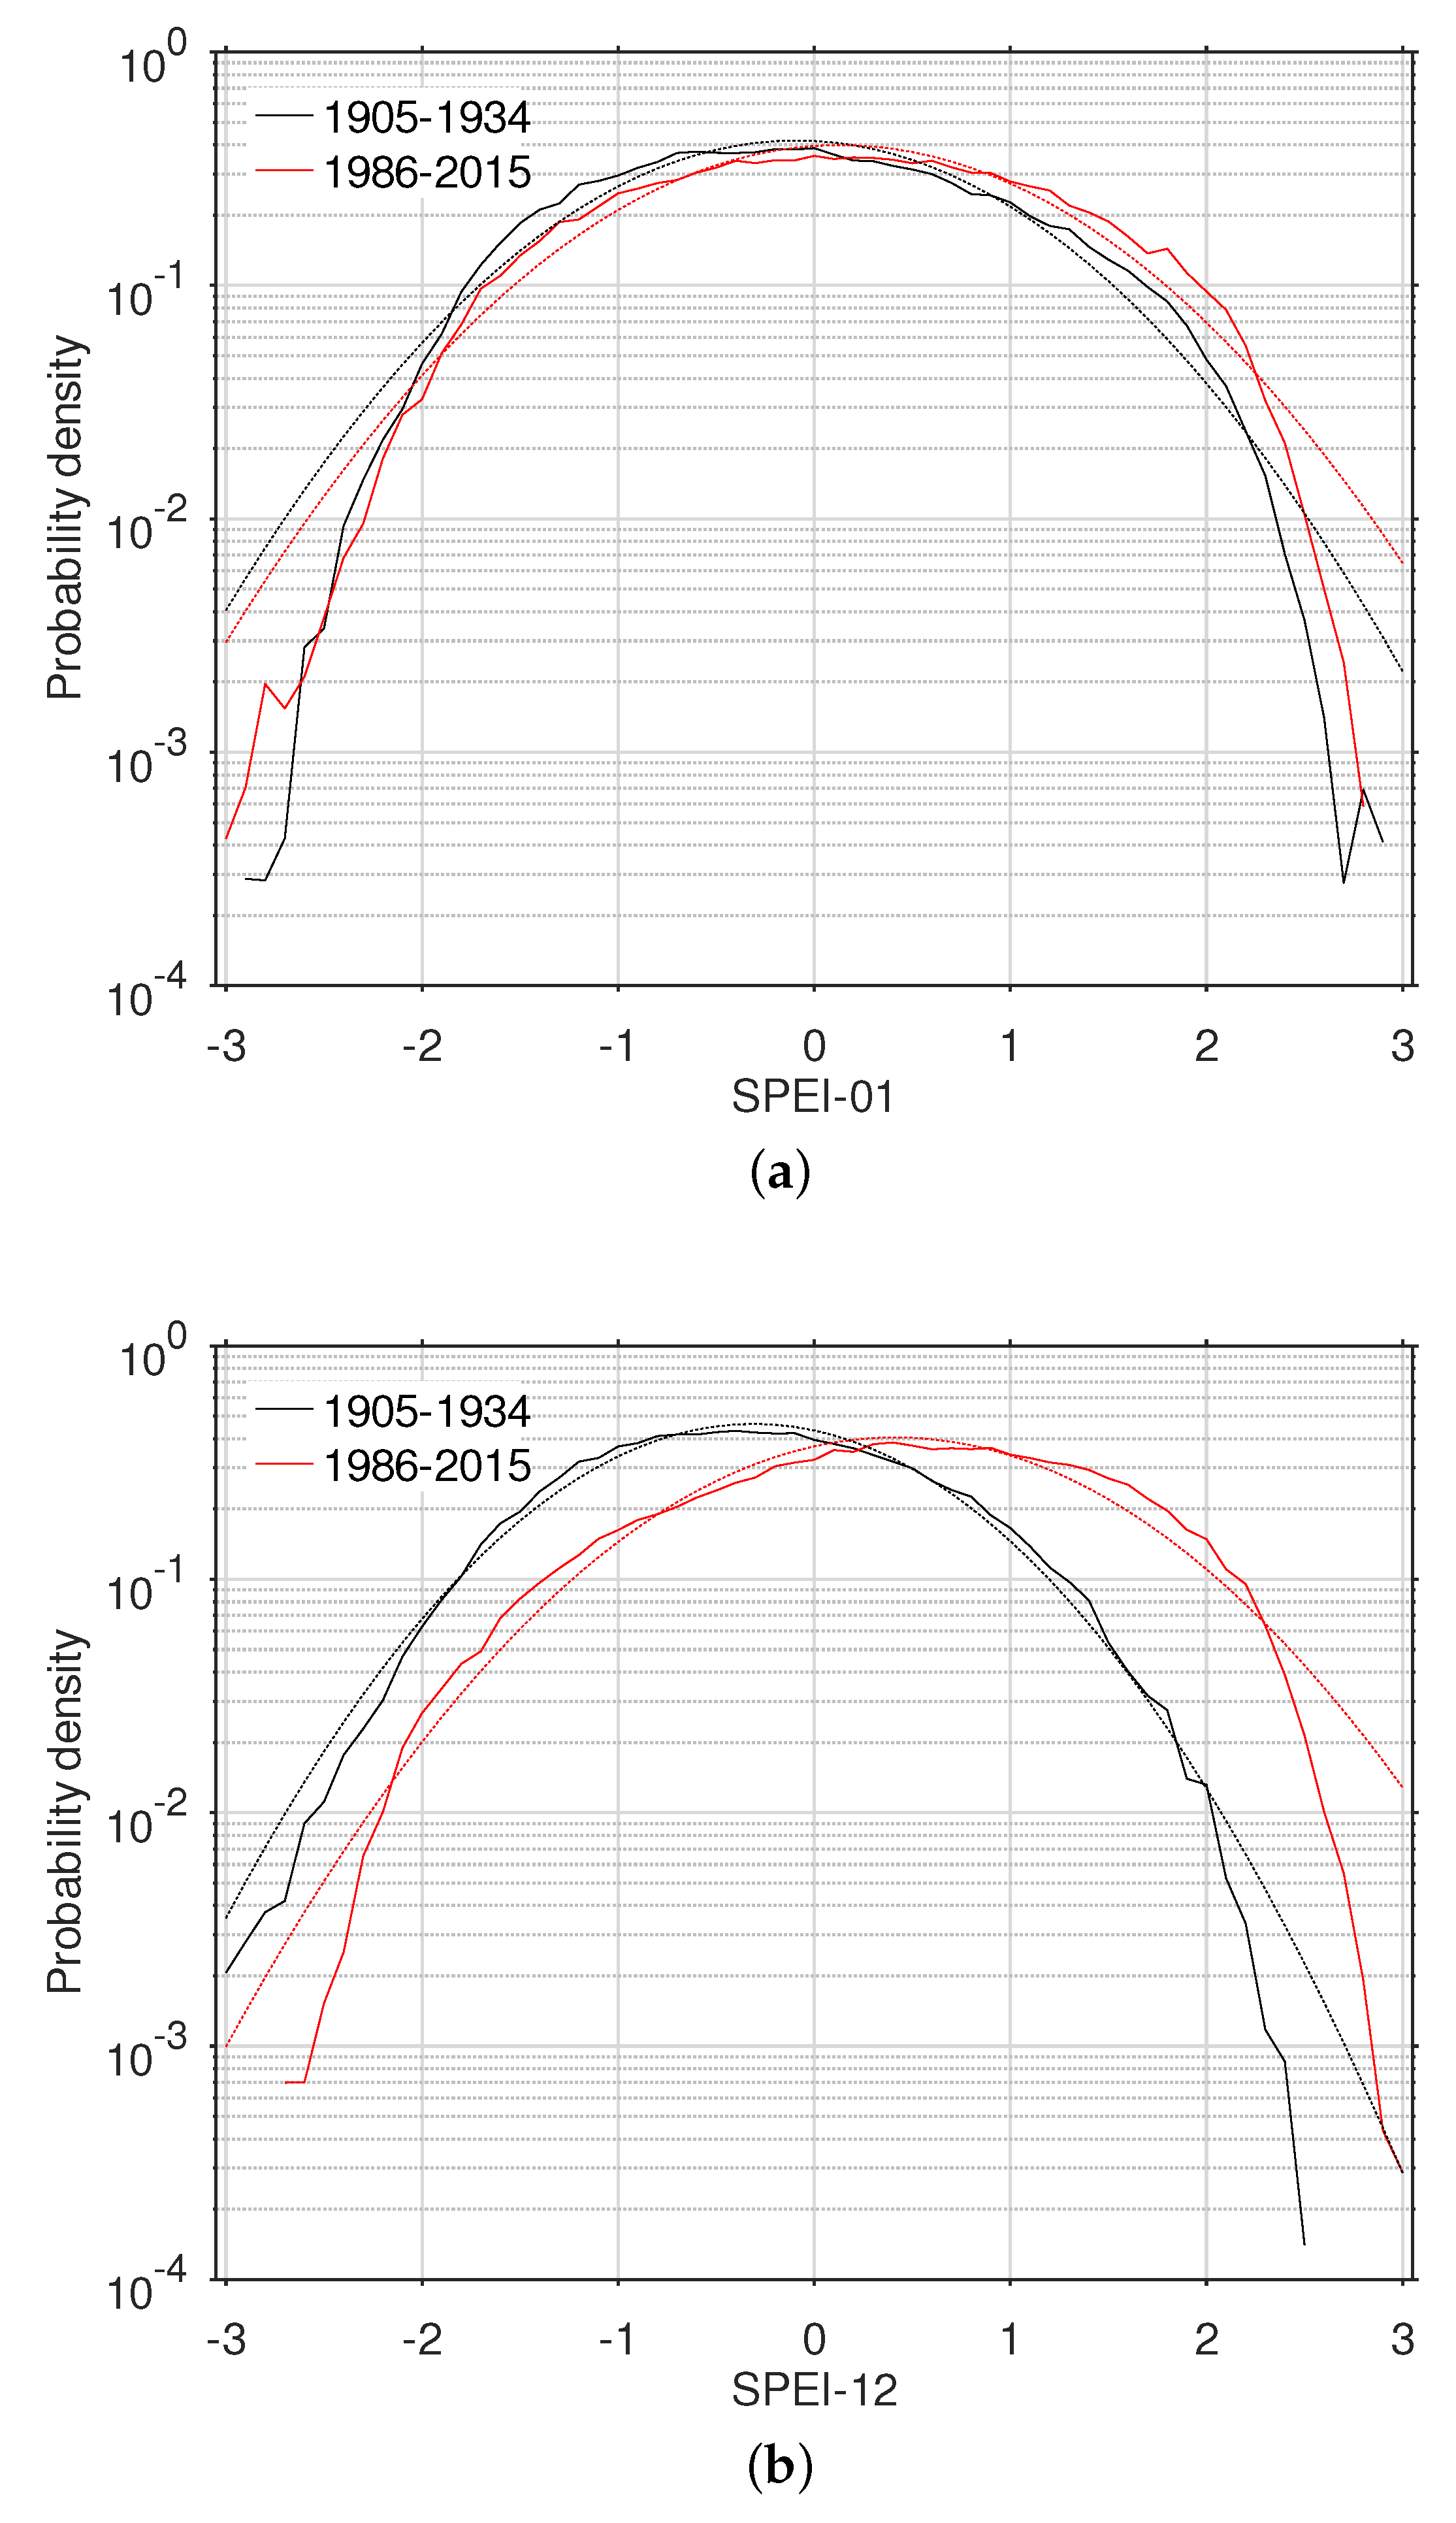
Regional mean SPEI-1 increased 0.22 units between 1905–1934 and 1986–2015, from −0.09 to +0.13, while its standard deviation increased 5%, from 0.95 to 0.99. At longer aggregation timescales the increases in both the mean and the variance were greater, as expected from the moving-average nature of SPEI. Thus, SPEI-12 increased 0.72 units, from −0.31 to +0.41, while its standard deviation increased 14%, from 0.86 to 0.98. The empirical probability distributions tended to be thin-tailed (platykurtic) compared to a normal distribution, with fewer extreme values (i.e., more than 2 to 2.5 standard deviations from the mean) than expected (Figure 10); this is consistent with average drought intensities being lower than expected under a normal distribution of SPEI (Figure 4c). The frequency of high SPEI values, indicating very wet conditions, greatly increased between 1905–1934 and 1986–2015, consistent with the increasing SPEI mean and variance. The frequency of very low SPEI values, indicating drought conditions, generally decreased, but not by as much as the high SPEI extremes became more frequent (Figure 10), as the increased SPEI variance partly offset the effect of higher SPEI mean on the frequency of dry extremes. The probability of drought (SPEI <−0.84) decreased from 24% (SPEI-1) or 29% (SPEI-12) for 1905–1934 to 19% (SPEI-1) or 12% (SPEI-12) for 1986–2015, showing a much larger decrease in drought probability for the longer aggregation timescales.
4. Discussion
Our results confirm that the NE has become much wetter since the beginning of the 20th Century. As a result, the fraction of the area in drought and the frequency of droughts at most locations, as defined using a constant threshold, has declined substantially. The frequency of longer-duration droughts (as indicated by SPEI with long aggregation timescales) has declined the most, as the increase in mean precipitation was more likely to be evident over longer durations. This regional trend is different from the global trend of increasing drought risk [15,57] and also from predictions of increasing drought risk over the NE due to global warming [2].
Despite the NE having undergone a globally exceptional moistening and reduction in drought risk, our findings show that it has not escaped the overall trend toward hydrologic intensification. The variance of SPEI has increased over time, with the longest aggregation timescales seeing the largest fractional increases in variance. This has meant that drought risk has not decreased under the moister mean climate as much as would be expected with constant variance. Although drought frequency has decreased, drought intensity and duration showed no significant change, contrary to the declines expected from the moister mean climate. One somewhat analogous finding is from Finland, where over 1962–2011 drought area, as assessed using SPEI-12, has increased despite an increasing precipitation trend [58].
To better assess future drought risks, historic observations, such as those analyzed here, need to be compared with climate model outputs. As an example, Ahmadalipour et al. [59] studied drought spatial extent, intensity, and frequency by season over the contiguous US at the 3-month timescale using observational data for 1950–2005 as well as statistically downscaled Coupled Model Intercomparison Project Phase 5 climate model simulations for 1950–2099. They found that drought area defined by SPEI-3 was projected to decrease over the Northeast during winter and spring and increase in summer over the future period 2006–2099 compared to the historical period. Ahmadalipour et al. [60] compared modeled changes between the 20th and 21st century in SPI, SPEI, and a standardized streamflow index for a river basin in the northwest US. They found that while SPI, reflecting only precipitation change, did not show an increase in drought intensity and duration, the other indices, which account for the effects of warming on water balance, did.
Statistical time series models and methods, such as the idealized statistical model considered here, can also help clarify the nature and evolution of drought risks. Thus, Apurv and Cai [61] evaluated whether drought risk could be considered stationary over 1901–2017 using SPI-6 derived from gridded precipitation over the contiguous US, finding that over the Northeast, drought severity has declined significantly over this time period, and that this decline was correlated with global warming and the Pacific Decadal Oscillation positive phase. By contrast, for parts of the central US, the stationarity assumption appeared to be justified for drought risk over this time period. Patterns in the covariability of precipitation and temperature anomalies have also been studied using model outputs and historic analysis of observations [62]. Modeling such patterns across timescales can aid in seasonal drought prediction [63,64].
Paleoclimate studies can provide further important information on drought risk. For example, in the NE, tree ring evidence indicates that century-long dry periods have previously occurred, and that these included droughts of similar intensity to the 1960s one but longer [65].
Strengths of the current study include considering drought trends over a long time period over a well-observed region and analyzing the evolution of multiple aspects of drought (frequency, intensity, and duration) over a broad range of timescales. The current work also has some limitations. One such limitation is that of relying on SPEI to define drought. SPEI is based on P minus ET as an indicator of water balance. While the gridded P field is based on measurements, ET is not measured directly, but rather estimated from measurements of other meteorological fields using the Penman-Monteith method. The method used to estimate ET can affect the regional drought trend estimated from SPEI data sets [40]. Lu et al. [66] found that for a watershed in central Pennsylvania, actual ET increased much faster over 1968–2012 than ET would indicate, due to a longer growing season greatly enhancing transpiration, which helped explain a finding of more frequent low summer streamflow that was unexpected given P and ET alone. On the other hand, another analysis showed increases in annual minimum and median streamflow over the NE over 1941–1999 [67], which is consistent with higher SPEI and lower inferred drought frequency. Trends in SPEI thus need be compared with direct observations of, for example, streamflow, soil moisture, and groundwater table [68,69,70,71] to better understand commonalities and differences in the vulnerability to drought of different components of the regional hydrologic system [72,73]. A World Meteorological Organization Workshop on Indices and Early Warning Systems for Drought recommended using SPI, which is based on only precipitation, as an indicator of meteorologic drought, and developing a composite index that would ideally also be based on streamflow, reservoir levels, snowpack, and groundwater levels for hydrological drought monitoring [74]. Whether drought is damaging depends on how water demand, as well as supply, changes with time [75]. Additionally, the 0.5 resolution of the SPEI data is insufficient to fully resolve hydroclimate gradients in parts of the NE, particularly mountain areas, and the extent to which drought trends diverge within the region remains uncertain. Finally, continued monitoring of SPEI and other climate indices in the region is necessary to better distinguish forced climate change from unforced climate variability [4] and as part of monitoring the larger continental climate shifts projected to ensue under continued global warming [76].
5. Conclusions
In summary, we studied trends in drought characteristics over the NE US over 1901–2015. We found that a shift to wetter mean conditions has led to less frequent droughts, although variability in water balance (as quantified by SPEI) has increased and the duration and intensity of droughts that do occur has not changed consistently. These results can be placed within a global framework of water cycle intensification and increased variability, together with large differences in hydrologic trends between regions.
Author Contributions
Conceptualization, all authors; methodology, all authors; formal analysis, N.Y.K.; writing—original draft preparation, N.Y.K. and D.H.; writing—review and editing, N.Y.K. and T.L.; visualization, all authors.
Funding
This research was funded by the National Oceanic and Atmospheric Administration Educational Partnership Program with Minority-Serving Institutions – Cooperative Science Center for Earth System Sciences and Remote Sensing Technologies under the Cooperative Agreement Grant number NA16SEC4810008. The statements contained within this article are not the opinions of the funding agency or the United States government but reflect the authors’ opinions.
Conflicts of Interest
The authors declare no conflict of interest. The funders had no role in the design of the study; in the collection, analyses, or interpretation of data; in the writing of the manuscript, or in the decision to publish the results.
References
- Namias, J. Nature and possible causes of the Northeastern United States drought during 1962–1965. Mon. Weather Rev. 1966, 94, 543–554. [Google Scholar] [CrossRef]
- Hayhoe, K.; Wake, C.P.; Huntington, T.G.; Luo, L.; Schwartz, M.D.; Sheffield, J.; Wood, E.; Anderson, B.; Bradbury, J.; DeGaetano, A.; et al. Past and future changes in climate and hydrological indicators in the US Northeast. Clim. Dyn. 2007, 28, 381–407. [Google Scholar] [CrossRef]
- Namias, J. Some causes of United States drought. J. Clim. Appl. Meteorol. 1983, 22, 30–39. [Google Scholar] [CrossRef]
- Seager, R.; Pederson, N.; Kushnir, Y.; Nakamura, J.; Jurburg, S. The 1960s drought and the subsequent shift to a wetter climate in the Catskill Mountains region of the New York City watershed. J. Clim. 2012, 25, 6721–6742. [Google Scholar] [CrossRef]
- Huntington, T.G.; Richardson, A.D.; McGuire, K.J.; Hayhoe, K. Climate and hydrological changes in the northeastern United States: Recent trends and implications for forested and aquatic ecosystems. Can. J. For. Res. 2009, 39, 199–212. [Google Scholar] [CrossRef]
- Lotter, D.; Seidel, R.; Liebhardt, W. The performance of organic and conventional cropping systems in an extreme climate year. Am. J. Altern. Agric. 2003, 18, 1–9. [Google Scholar] [CrossRef]
- Seager, R. The turn of the century North American drought: Global context, dynamics, and past analogs. J. Clim. 2007, 20, 5527–5552. [Google Scholar] [CrossRef]
- Devineni, N.; Lall, U.; Pederson, N.; Cook, E. A tree-ring-based reconstruction of Delaware river basin streamflow using hierarchical Bayesian regression. J. Clim. 2013, 26, 4357–4374. [Google Scholar] [CrossRef]
- Hodgkins, G.A.; Dudley, R.W.; Huntington, T.G. Changes in the timing of high river flows in New England over the 20th Century. J. Hydrol. 2003, 278, 244–252. [Google Scholar] [CrossRef] [Green Version]
- Huntington, T.G.; Hodgkins, G.A.; Keim, B.D.; Dudley, R.W. Changes in the proportion of precipitation occurring as snow in New England (1949–2000). J. Clim. 2004, 17, 2626–2636. [Google Scholar] [CrossRef]
- Wu, P.; Christidis, N.; Stott, P. Anthropogenic impact on Earth’s hydrological cycle. Nat. Clim. Chang. 2013, 3, 807–810. [Google Scholar] [CrossRef]
- Lin, Y.; Liu, A.; Ma, E.; Li, X.; Shi, Q. Impacts of future urban expansion on regional climate in the Northeast megalopolis, USA. Adv. Meteorol. 2013, 2013, 362925. [Google Scholar] [CrossRef]
- Seager, R.; Naik, N.; Vogel, L. Does global warming cause intensified interannual hydroclimate variability? J. Clim. 2012, 25, 3355–3372. [Google Scholar] [CrossRef]
- Asadieh, B.; Krakauer, N.Y. Global change in streamflow extremes under climate change over the 21st century. Hydrol. Earth Syst. Sci. 2017, 21, 5863–5874. [Google Scholar] [CrossRef] [Green Version]
- Dai, A. Drought under global warming: A review. Wiley Interdiscip. Rev. Clim. Chang. 2011, 2, 45–65. [Google Scholar] [CrossRef]
- Dai, A. Characteristics and trends in various forms of the Palmer Drought Severity Index (PDSI) during 1900–2008. J. Geophys. Res. 2011, 116, D12115. [Google Scholar] [CrossRef]
- Trenberth, K.E.; Dai, A.; van der Schrier, G.; Jones, P.D.; Barichivich, J.; Briffa, K.R.; Sheffield, J. Global warming and changes in drought. Nat. Clim. Chang. 2014, 4, 17–22. [Google Scholar] [CrossRef]
- Huntington, T.G. Evidence for intensification of the global water cycle: Review and synthesis. J. Hydrol. 2006, 319, 83–95. [Google Scholar] [CrossRef]
- Sheffield, J.; Wood, E. Projected changes in drought occurrence under future global warming from multi-model, multi-scenario, IPCC AR4 simulations. Clim. Dyn. 2008, 31, 79–105. [Google Scholar] [CrossRef]
- O’Gorman, P.A.; Schneider, T. The physical basis for increases in precipitation extremes in simulations of 21st-century climate change. Proc. Natl. Acad. Sci. USA 2009, 106, 14773–14777. [Google Scholar] [CrossRef] [Green Version]
- Trenberth, K. Changes in precipitation with climate change. Clim. Res. 2011, 47, 123–138. [Google Scholar] [CrossRef] [Green Version]
- Giorgi, F.; Im, E.S.; Coppola, E.; Diffenbaugh, N.S.; Gao, X.J.; Mariotti, L.; Shi, Y. Higher hydroclimatic intensity with global warming. J. Clim. 2011, 24, 5309–5324. [Google Scholar] [CrossRef]
- Polson, D.; Hegerl, G.C.; Allan, R.P.; Sarojini, B.B. Have greenhouse gases intensified the contrast between wet and dry regions? Geophys. Res. Lett. 2013, 40, 4783–4787. [Google Scholar] [CrossRef] [Green Version]
- Chou, C.; Chiang, J.C.H.; Lan, C.W.; Chung, C.H.; Liao, Y.C.; Lee, C.J. Increase in the range between wet and dry season precipitation. Nat. Geosci. 2013, 6, 263–267. [Google Scholar] [CrossRef]
- Kumar, S.; Lawrence, D.M.; Dirmeyer, P.A.; Sheffield, J. Less reliable water availability in the 21st century climate projections. Earth’s Future 2014, 2, 152–160. [Google Scholar] [CrossRef]
- Krakauer, N.Y.; Fekete, B.M. Are climate model simulations useful for forecasting precipitation trends? Hindcast and synthetic-data experiments. Environ. Res. Lett. 2014, 9, 024009. [Google Scholar] [CrossRef] [Green Version]
- Asadieh, B.; Krakauer, N.Y. Global trends in extreme precipitation: Climate models versus observations. Hydrol. Earth Syst. Sci. 2015, 19, 877–891. [Google Scholar] [CrossRef]
- Asadieh, B.; Krakauer, N.Y. Impacts of changes in precipitation amount and distribution on water resources studied using a model rainwater harvesting system. J. Am. Water Resour. Assoc. 2016, 52, 1450–1471. [Google Scholar] [CrossRef]
- Lickley, M.; Solomon, S. Drivers, timing and some impacts of global aridity change. Environ. Res. Lett. 2018, 13, 104010. [Google Scholar] [CrossRef]
- Mallakpour, I.; Sadegh, M.; AghaKouchak, A. A new normal for streamflow in California in a warming climate: wetter wet seasons and drier dry seasons. J. Hydrol. 2018. [Google Scholar] [CrossRef]
- Mazdiyasni, O.; AghaKouchak, A. Substantial increase in concurrent droughts and heatwaves in the United States. Proc. Natl. Acad. Sci. USA 2015, 112, 11484–11489. [Google Scholar] [CrossRef] [PubMed] [Green Version]
- Clark, J.S.; Iverson, L.; Woodall, C.W.; Allen, C.D.; Bell, D.M.; Bragg, D.C.; D’Amato, A.W.; Davis, F.W.; Hersh, M.H.; Ibanez, I.; et al. The impacts of increasing drought on forest dynamics, structure, and biodiversity in the United States. Glob. Change Biol. 2016, 22, 2329–2352. [Google Scholar] [CrossRef] [PubMed] [Green Version]
- Ficklin, D.L.; Maxwell, J.T.; Letsinger, S.L.; Gholizadeh, H. A climatic deconstruction of recent drought trends in the United States. Environ. Res. Lett. 2015, 10, 044009. [Google Scholar] [CrossRef]
- Beguería, S.; Vicente-Serrano, S.M.; Angulo-Martínez, M. A multiscalar global drought dataset: The SPEIbase: A new gridded product for the analysis of drought variability and impacts. Bull. Am. Meteorol. Soc. 2010, 91, 1351–1356. [Google Scholar] [CrossRef]
- Vicente-Serrano, S.M.; Beguería, S.; López-Moreno, J.I. A multiscalar drought index sensitive to global warming: the Standardized Precipitation Evapotranspiration Index. J. Clim. 2010, 23, 1696–1718. [Google Scholar] [CrossRef]
- Beguería, S.; Vicente-Serrano, S.M.; Reig, F.; Latorre, B. Standardized precipitation evapotranspiration index (SPEI) revisited: Parameter fitting, evapotranspiration models, tools, datasets and drought monitoring. Int. J. Climatol. 2014, 34, 3001–3023. [Google Scholar] [CrossRef]
- Huang, K.; Yi, C.; Wu, D.; Zhou, T.; Zhao, X.; Blanford, W.J.; Wei, S.; Wu, H.; Ling, D.; Li, Z. Tipping point of a conifer forest ecosystem under severe drought. Environ. Res. Lett. 2015, 10, 024011. [Google Scholar] [CrossRef]
- Guttman, N.B. Accepting the standardized precipitation index: A calculation algorithm. J. Am. Water Resour. Assoc. 1999, 35, 311–322. [Google Scholar] [CrossRef]
- Turco, M.; Ceglar, A.; Prodhomme, C.; Soret, A.; Toreti, A.; Doblas-Reyes, F. Summer drought predictability over Europe: Empirical versus dynamical forecasts. Environ. Res. Lett. 2017, 12, 084006. [Google Scholar] [CrossRef]
- Dewes, C.F.; Rangwala, I.; Barsugli, J.J.; Hobbins, M.T.; Kumar, S. Drought risk assessment under climate change is sensitive to methodological choices for the estimation of evaporative demand. PLoS ONE 2017, 12, 1–22. [Google Scholar] [CrossRef]
- Andujar, E.; Krakauer, N.Y.; Yi, C.; Kogan, F. Ecosystem drought response timescales from thermal emission versus shortwave remote sensing. Adv. Meteorol. 2017, 2017, 8434020. [Google Scholar] [CrossRef]
- Hameed, M.; Ahmadalipour, A.; Moradkhani, H. Apprehensive drought characteristics over Iraq: Results of a multidecadal spatiotemporal assessment. Geosciences 2018, 8, 58. [Google Scholar] [CrossRef]
- Beguería, S.; Latorre, B.; Reig, F.; Vicente-Serrano, S.M. sbegueria/SPEIbase: Version 2.5.1. Glob. SPEI Database 2017. [Google Scholar] [CrossRef]
- Harris, I.; Jones, P.; Osborn, T.; Lister, D. Updated high-resolution grids of monthly climatic observations—The CRU TS3.10 Dataset. Int. J. Climatol. 2014, 34, 623–642. [Google Scholar] [CrossRef]
- Karl, T.; Koss, W.J. Regional and National Monthly, Seasonal, and Annual Temperature Weighted by Area, 1895–1983; Technical Report; National Climatic Data Center (U.S.): Asheville, NC, USA, 1984. [Google Scholar]
- Vose, R.S.; Applequist, S.; Squires, M.; Durre, I.; Menne, M.J.; Williams, C.N.; Fenimore, C.; Gleason, K.; Arndt, D. Improved historical temperature and precipitation time series for U.S. climate divisions. J. Appl. Meteorol. Climatol. 2014, 53, 1232–1251. [Google Scholar] [CrossRef]
- Svoboda, M.; LeComte, D.; Hayes, M.; Heim, R.; Gleason, K.; Angel, J.; Rippey, B.; Tinker, R.; Palecki, M.; Stooksbury, D.; et al. The Drought Monitor. Bull. Am. Meteorol. Soc. 2002, 83, 1181–1190. [Google Scholar] [CrossRef]
- Aron, G.; Wall, D.J.; White, E.L.; Dunn, C.N. Regional rainfall intensity-duration-frequency curves for Pennsylvania. J. Am. Water Resour. Assoc. 1988, 23, 479–485. [Google Scholar] [CrossRef]
- Sivapalan, M.; Blöschl, G. Transformation of point rainfall to areal rainfall: Intensity-duration-frequency curves. J. Hydrol. 1998, 204, 150–167. [Google Scholar] [CrossRef]
- Koutsoyiannis, D.; Kozonis, D.; Manetas, A. A mathematical framework for studying rainfall intensity-duration-frequency relationships. J. Hydrol. 1998, 206, 118–135. [Google Scholar] [CrossRef]
- Madsen, H.; Mikkelsen, P.S.; Rosbjerg, D.; Harremoës, P. Regional estimation of rainfall intensity-duration-frequency curves using generalized least squares regression of partial duration series statistics. Water Resour. Res. 2002, 38, 1239. [Google Scholar] [CrossRef]
- Singh, V.P.; Zhang, L. IDF curves using the Frank Archimedean copula. J. Hydrol. Eng. 2007, 12, 651–662. [Google Scholar] [CrossRef]
- Wang, D.; Hagen, S.C.; Alizad, K. Climate change impact and uncertainty analysis of extreme rainfall events in the Apalachicola River Basin, Florida. J. Hydrol. 2013, 480, 125–135. [Google Scholar] [CrossRef]
- Livada, I.; Assimakopoulos, V.D. Spatial and temporal analysis of drought in Greece using the Standardized Precipitation Index (SPI). Theor. Appl. Climatol. 2007, 89, 143–153. [Google Scholar] [CrossRef]
- Leelaruban, N.; Padmanabhan, G. Drought occurrences and their characteristics across selected spatial scales in the Contiguous United States. Geosciences 2017, 7, 59. [Google Scholar] [CrossRef]
- Vicente-Serrano, S.M.; Gouveia, C.; Camarero, J.J.; Beguería, S.; Trigo, R.; López-Moreno, J.I.; Azorín-Molina, C.; Pasho, E.; Lorenzo-Lacruz, J.; Revuelto, J.; et al. Response of vegetation to drought time-scales across global land biomes. Proc. Natl. Acad. Sci. USA 2013, 110, 52–57. [Google Scholar] [CrossRef] [PubMed]
- Dai, A. Increasing drought under global warming in observations and models. Nat. Clim. Chang. 2013, 3, 52–58. [Google Scholar] [CrossRef]
- Irannezhad, M.; Ahmadi, B.; Kløve, B.; Moradkhani, H. Atmospheric circulation patterns explaining climatological drought dynamics in the boreal environment of Finland, 1962–2011. Int. J. Climatol. 2017, 37, 801–817. [Google Scholar] [CrossRef]
- Ahmadalipour, A.; Moradkhani, H.; Svoboda, M. Centennial drought outlook over the CONUS using NASA-NEX downscaled climate ensemble. Int. J. Climatol. 2017, 37, 2477–2491. [Google Scholar] [CrossRef]
- Ahmadalipour, A.; Moradkhani, H.; Demirel, M.C. A comparative assessment of projected meteorological and hydrological droughts: Elucidating the role of temperature. J. Hydrol. 2017, 553, 785–797. [Google Scholar] [CrossRef] [Green Version]
- Apurv, T.; Cai, X. Evaluation of the stationarity assumption for meteorological drought risk estimation at the multi-decadal scale in contiguous US. Water Resour. Res. 2019. [Google Scholar] [CrossRef]
- Rana, A.; Moradkhani, H.; Qin, Y. Understanding the joint behavior of temperature and precipitation for climate change impact studies. Theor. Appl. Climatol. 2017, 129, 321–339. [Google Scholar] [CrossRef]
- Yan, H.; Moradkhani, H.; Zarekarizi, M. A probabilistic drought forecasting framework: A combined dynamical and statistical approach. J. Hydrol. 2017, 548, 291–304. [Google Scholar] [CrossRef] [Green Version]
- Kang, H.; Sridhar, V. Improved drought prediction using near real-time climate forecasts and simulated hydrologic conditions. Sustainability 2018, 10, 1799. [Google Scholar] [CrossRef]
- Pederson, N.; Bell, A.R.; Cook, E.R.; Lall, U.; Devineni, N.; Seager, R.; Eggleston, K.; Vranes, K.P. Is an epic pluvial masking the water insecurity of the greater New York City region? J. Clim. 2013, 26, 1339–1354. [Google Scholar] [CrossRef]
- Lu, H.; Bryant, R.B.; Buda, A.R.; Collick, A.S.; Folmar, G.J.; Kleinman, P.J.A. Long-term trends in climate and hydrology in an agricultural, headwater watershed of central Pennsylvania, USA. J. Hydrol. Reg. Stud. 2015, 4, 713–731. [Google Scholar] [CrossRef] [Green Version]
- McCabe, G.J.; Wolock, D.M. A step increase in streamflow in the conterminous United States. Geophys. Res. Lett. 2002, 29, 2185. [Google Scholar] [CrossRef]
- Brutsaert, W. Annual drought flow and groundwater storage trends in the eastern half of the United States during the past two-third century. Theor. Appl. Climatol. 2010, 100, 93–103. [Google Scholar] [CrossRef]
- Temimi, M.; Lakhankar, T.; Zhan, X.; Cosh, M.H.; Krakauer, N.Y.; Fares, A.; Kelly, V.; Khanbilvardi, R.; Kumassi, L. Soil moisture retrieval using ground-based L-band passive microwave observations in northeastern USA. Vadose Zone J. 2014, 13. [Google Scholar] [CrossRef]
- Krakauer, N.Y. Stakeholder-driven research for climate adaptation in New York City. In New Trends in Earth Science Outreach and Engagement: The Nature of Communication; Advances in Natural and Technological Hazards Research; Drake, J., Kontar, Y., Rife, G., Eds.; Springer: Berlin, Germany, 2014; Volume 38. [Google Scholar] [CrossRef]
- Xu, Y.; Wang, L.; Ross, K.; Liu, C.; Berry, K. Standardized soil moisture index for drought monitoring based on Soil Moisture Active Passive observations and 36 years of North American Land Data Assimilation System data: A case study in the southeast United States. Remote Sens. 2018, 10, 301. [Google Scholar] [CrossRef]
- Van Loon, A.F. Hydrological drought explained. Wiley Interdiscip. Rev. Water 2015, 2, 359–392. [Google Scholar] [CrossRef]
- Steinemann, A.; Iacobellis, S.F.; Cayan, D.R. Developing and evaluating drought indicators for decision-making. J. Hydrometeorol. 2015, 16, 1793–1803. [Google Scholar] [CrossRef]
- Hayes, M.; Svoboda, M.; Wall, N.; Widhalm, M. The Lincoln declaration on drought indices: Universal meteorological drought index recommended. Bull. Am. Meteorol. Soc. 2011, 92, 485–488. [Google Scholar] [CrossRef]
- Etienne, E.; Devineni, N.; Khanbilvardi, R.; Lall, U. Development of a Demand Sensitive Drought Index and its application for agriculture over the conterminous United States. J. Hydrol. 2016, 534, 219–229. [Google Scholar] [CrossRef] [Green Version]
- Seager, R.; Feldman, J.; Lis, N.; Ting, M.; Williams, A.P.; Nakamura, J.; Liu, H.; Henderson, N. Whither the 100th meridian? The once and future physical and human geography of America’s arid–humid divide. Part II: The meridian moves east. Earth Interac. 2018, 22, 1–24. [Google Scholar] [CrossRef]
Figure 1.
Map of study region.

Figure 2.
Mean monthly SPEI at different aggregation timescales over the NE US, 1901–2015.

Figure 3.
Fraction of NE US experiencing drought using definitions based on different SPEI aggregation timescales, 1901–2015.
Figure 3.
Fraction of NE US experiencing drought using definitions based on different SPEI aggregation timescales, 1901–2015.

Figure 4.
Mean at different SPEI aggregation timescales over the NE US, 1901–2015: (a) Drought frequency, (b) Drought duration, (c) Drought intensity. The dashed blue curve shows simulated values under an idealized model of SPEI.
Figure 4.
Mean at different SPEI aggregation timescales over the NE US, 1901–2015: (a) Drought frequency, (b) Drought duration, (c) Drought intensity. The dashed blue curve shows simulated values under an idealized model of SPEI.

Figure 5.
Median trend (and, in dotted lines, 25th and 75th percentiles) across gridcells at different aggregation timescales over the NE US, 1901–2015: (a) Drought frequency, (b) Drought duration, (c) Drought intensity. Each trend is given per century and normalized by dividing over the average frequency, duration, or intensity for the same gridcell and aggregation timescale. The dashed blue curve shows simulated values under an idealized model of SPEI where its mean and variance increase linearly with time.

Figure 6.
Mean drought characteristics over the NE US, 1901–2015, as defined using 1 month aggregation-timescale SPEI: (a) Drought frequency (droughts per year), (b) Drought duration (months), (c) Drought intensity (SPEI units).
Figure 6.
Mean drought characteristics over the NE US, 1901–2015, as defined using 1 month aggregation-timescale SPEI: (a) Drought frequency (droughts per year), (b) Drought duration (months), (c) Drought intensity (SPEI units).

Figure 7.
Same as Figure 6, but for 12 month aggregation timescale SPEI.
Figure 7.
Same as Figure 6, but for 12 month aggregation timescale SPEI.

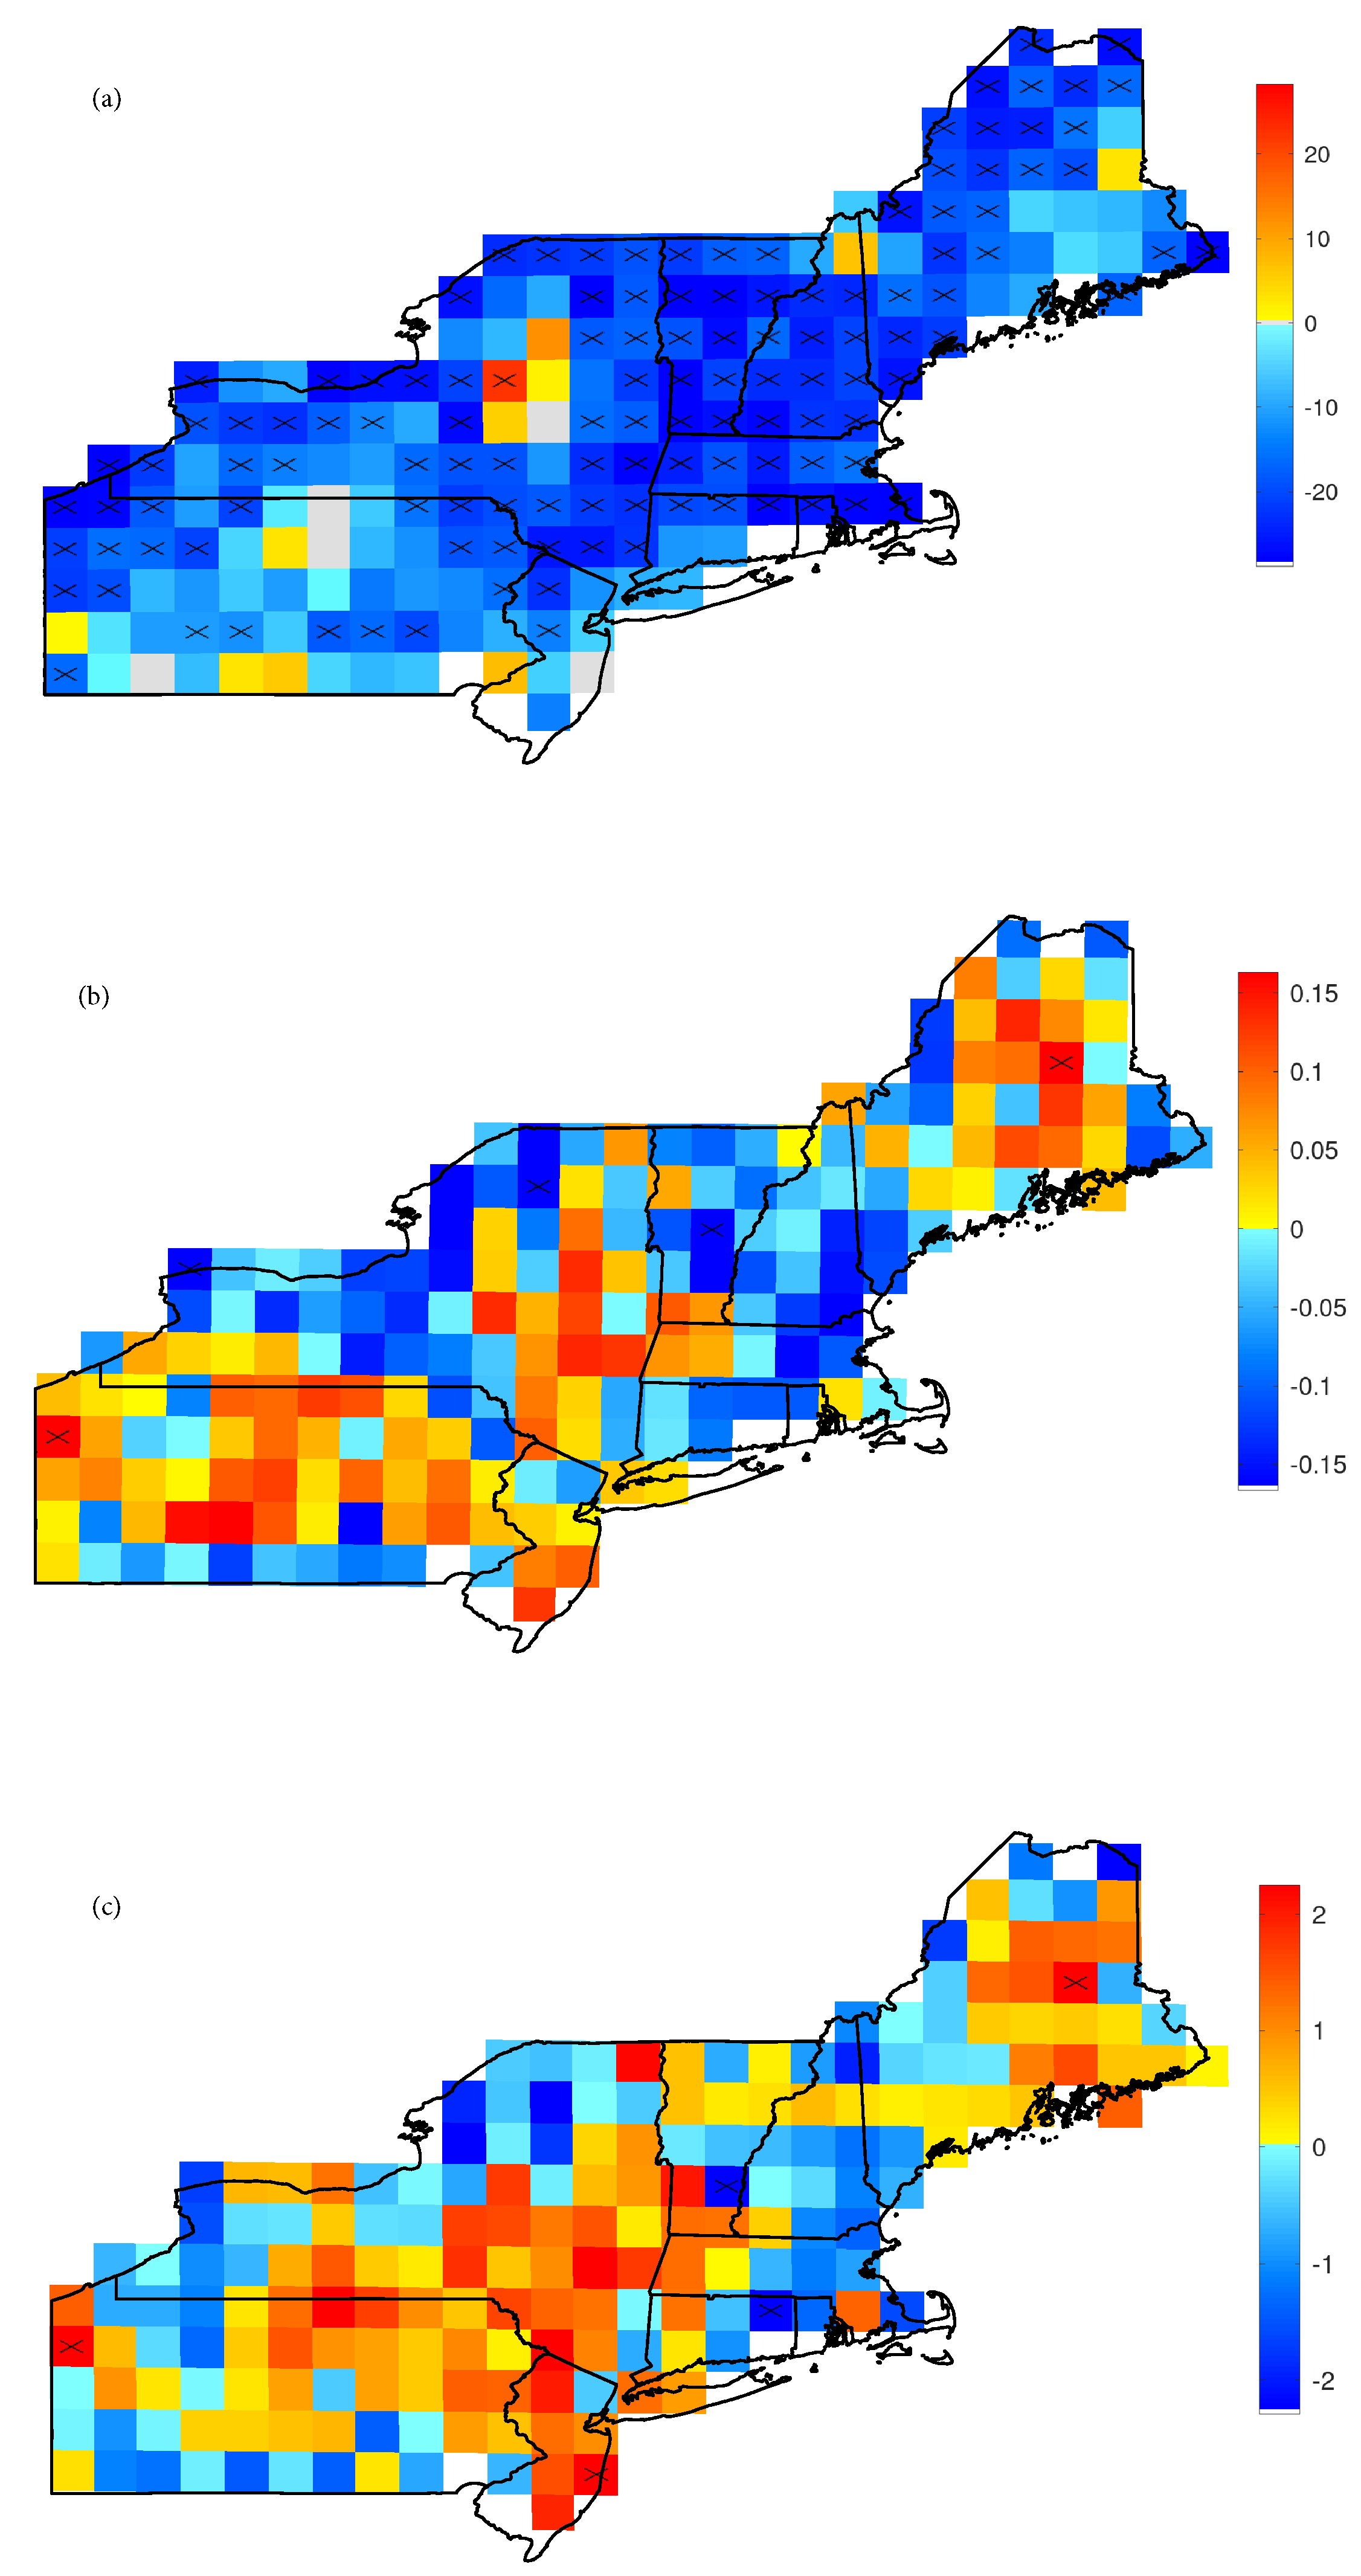
Figure 8.
Linear trends in drought characteristics over the NE US, 1901–2015, as defined using 1 month aggregation timescale SPEI: (a) Drought frequency (droughts per year), (b) Drought duration (months), (c) Drought intensity (SPEI units). The trends are per century, divided by the mean value. X marks gridcells with trends that are significantly different from zero at the 95% confidence level.

Figure 9.
Same as Figure 8, but for 12 month aggregation timescale SPEI.
Figure 9.
Same as Figure 8, but for 12 month aggregation timescale SPEI.

Figure 10.
Probability densities of SPEI in the NE over two 30-year periods. Dotted lines show the densities for normal distributions with the same respective means and variances. (a) SPEI with 1 month aggregation timescale, (b) 12 month aggregation timescale.
Figure 10.
Probability densities of SPEI in the NE over two 30-year periods. Dotted lines show the densities for normal distributions with the same respective means and variances. (a) SPEI with 1 month aggregation timescale, (b) 12 month aggregation timescale.

© 2019 by the authors. Licensee MDPI, Basel, Switzerland. This article is an open access article distributed under the terms and conditions of the Creative Commons Attribution (CC BY) license (http://creativecommons.org/licenses/by/4.0/).
Share and Cite
MDPI and ACS Style
Krakauer, N.Y.; Lakhankar, T.; Hudson, D. Trends in Drought over the Northeast United States. Water 2019, 11, 1834. https://doi.org/10.3390/w11091834
AMA Style
Krakauer NY, Lakhankar T, Hudson D. Trends in Drought over the Northeast United States. Water. 2019; 11(9):1834. https://doi.org/10.3390/w11091834
Chicago/Turabian StyleKrakauer, Nir Y., Tarendra Lakhankar, and Damien Hudson. 2019. "Trends in Drought over the Northeast United States" Water 11, no. 9: 1834. https://doi.org/10.3390/w11091834
Note that from the first issue of 2016, this journal uses article numbers instead of page numbers. See further details here.