Effects of Spur Dikes on Water Flow Diversity and Fish Aggregation

1
State key laboratory of Hydrology-Water Resource and Hydraulic Engineering, Nanjing Hydraulic Research Institute, Nanjing 210029, China
2
College of Water Conservancy and Hydropower Engineering, Hohai University, Nanjing 210098, China
*
Author to whom correspondence should be addressed.
Water 2019, 11(9), 1822; https://doi.org/10.3390/w11091822
Submission received: 1 August 2019
/
Revised: 25 August 2019
/
Accepted: 29 August 2019
/
Published: 31 August 2019
(This article belongs to the Special Issue Environmental Hydraulics Research)
Abstract
:As a typical waterway modification, the spur dike narrows the water cross section, which increases the flow velocity and flushes the riverbed. Meanwhile, it also protects ecological diversity and improves river habitat. Different types of spur dikes could greatly impact the interaction between flow structure and local geomorphology, which in turn affects the evolution of river aquatic habitats. Four different types of spur dikes—including rock-fill, permeable, w-shaped rock-fill, and w-shaped permeable—were evaluated using flume experiments for spur dike hydrodynamics and fish aggregation effects. Based on Shannon’s entropy, an index for calculating water flow diversity is proposed. Additionally, the impact of the different spur dikes on water flow diversity and the relationship between water flow diversity and fish aggregation effects were studied. The water flow diversity index around the spur dike varied from 1.13 to 2.96. The average aggregation rate of test fish around the spur dike was 5% to 28%, and the attraction effect increased with increasing water flow diversity. Furthermore, we plotted the relationship between water flow diversity index and average fish aggregation rate. A fish hydroacoustic study conducted on the Laohutan fish-bone dike in the Dongliu reach of downstream Yangtze River showed that the fish aggregation effect of the permeable spur dike was greater than the rock-fill spur dike. These research results could provide theoretical support for habitat heterogeneity research and ecologically optimal design of spur dikes.
1. Introduction
Shipping is one of the important functions of rivers. Meanwhile, waterway remediation is an important means to improve waterway conditions. As a typical waterway modification, the spur dike narrows the water cross section, which increases flow velocity and flushes the riverbed. However, it affects the local river habitat as well by changing the interaction between water flow and sediment, and local geomorphology within the range of influence of the spur dike.
Recently, many researchers and engineers have studied the ecological effects of spur dikes through model tests, numerical simulations and on-site observations. The results show that spur dikes can enhance river habitat heterogeneity and improve the suitability of fish habitats under low and medium water flows. The tributary area behind the spur dike provides a habitat for plankton and benthic animals, and it also provides a good living environment and shelter for juveniles with a particular fish-aggregation effect [1,2,3,4,5,6,7]. The improvement of habitat quality can provide more living space for aquatic organisms [8,9]. Concurrently, a low-speed zone, or even still water zone, is formed behind the spur dike due to its blocking effect. Consequently, it is easy for fine sand and silt to accumulate, making the environment unstable and not conducive to benthic organism survival [10]. Furthermore, the still water area is not suitable fish habitat [11]. To increase quantity and quality of the habitat around the spur dike and strengthen its ecological effect, new layouts of dikes or permeable ecological spur dike are proposed. While retaining the effects of narrowing the water cross section to increase the flow velocity and flush the riverbed, the new spur dike has interrelated and complementary diverse flows, refuges and bait effects. In particular, the diverse flows encourage various plankton and benthic animals to remain as food for fish. The shelter formed by the proposed structure could be used by small animals such as juveniles to avoid predation and should become an excellent micro-habitat. The spur dike of new layouts such as notched spur dikes, J-Hook, cross vane and double cross vane were proposed and applied in the Upper Mississippi River restoration and the Austrian Danube River [12,13,14,15]. Presently, there are a variety of ecological spur dikes such as the fish nest ecological, the deflector ecological, the four-side six-edge permeable, the square ecological, the open-hole trapezoidal ecological, and the open-hole semi-circular ecological spur dike in China. Great parts of them have already been applied in channel regulation projects along the Yangtze River and Xijiang River [3,16,17,18,19].
The impacts of spur dikes on habitats has mainly been assessed by calculating and comparing the weighted available area (WUA) or the suitable habitat area, under different combinations of water flow and dike type. Additionally, the weighted available area (WUA) or the suitable habitat area is simulated using a habitat model (e.g., PHABSIM- the Physical Habitat Simulation System, [20,21]), which is based on the preference of aquatic organisms for habitat factors such as water depth, flow velocity, and sediment quality. However, fish use of habitats is not only determined by flow velocity, water depth, or sediment quality, but also closely related to water flow turbulence. Turbulence is common in rivers, rough terrain, plants in the river, stone blocks and artificial structures such as spur dikes, which can cause turbulence in the water flow. However, turbulence is not always correlated with velocity—particularly in pools and around roughness elements [22,23]. Fish will adjust their swimming mode and frequency of fishtail swing to conserve energy from the turbulent water flow. Furthermore, the turbulent water flow can reduce the probability of fish being preyed upon. Moreover, the turbulent kinetic energy can better reflect on the fish aggregation status than the flow velocity. Therefore, some scholars have suggested incorporating turbulence into fish habitat assessment management [11,24,25,26,27,28,29,30,31,32]. Turbulence and its relationship with fish swimming and shoaling are complex, so the effects of turbulence are generally not considered in the habitat models. Some scholars have suggested that turbulence could be described with vorticity or vortex scale to analyze the complexity of water flow. However, the vortex is three-dimensional, time-dependent, and the scale varies greatly. Even when using a two-dimensional vortex, it is difficult to describe the complexity of water flow. Furthermore, it is difficult to extrapolate laboratory results to the field [4,30,33,34]. Generally, there is a lack of a clear calculation method for water flow diversity using physical mechanisms that accurately reflect the impact of spur dikes on water flow diversity and its relationship to fish aggregation.
W-Weir is a habitat enhancement structure applied in middle and small rivers. It is a submerged closure dam and its symmetry plane coincides with the centerline of the river [35]. It is w-shaped along the direction of the water flow. The angle between the first section of the dike and the flume is 20–30°. W-Weir can lower the water surface gradient along the river and decreases flow velocity nearshore, which improves the stability of the riverbank. Two back flow areas and two pools are formed downstream of W-Weir, where rapid flow and slow alternates, and step-pool morphology is generated. It provides habitat and spawning ground for fish and other dwellers. Based on the ecological mechanism of W-Weir, a w-shaped spur dike was proposed by Lu Y. et al. (2018) [36]. Its layout is similar to W-Weir, but not cover the whole cross section river. The w-shaped permeable spur dike is stacked with permeable frames of four sides and six edges, each with a length of 1.0 m and a section diameter of 0.1 m × 0.1 m, which is widely used in the Yangtze river waterway training as revetment. The w-shaped permeable spur dike is applied in the ecological conservation area in Lianhuazhougang within Dongliu reach, which is part of the waterway Project 645—the process of dredging the Yangtze to increase the depth of the waterway between Wuhan to Anqing to 6 m, and to 4.5 m from Wuhan to Yichang.
To determine the influence of different types of spur dikes on water flow diversity and the relationship between water flow diversity and fish aggregation, we therefore used flume experiments in rock-fill, permeable, w-shaped rock-fill, and w-shaped permeable spur dikes. The flow velocity, turbulent kinetic energy and fish distribution around the spur dike were measured. Subsequently, a water flow diversity index was proposed, and its relationship with the average fish aggregation rate was determined. A fish hydroacoustic study was carried out on Laohutan fish-bone dike in the Dongliu reach of the Yangtze River to investigate the fish aggregation effects of rock-fill and permeable spur dikes in the field.
2. Experiments
2.1. Experimental Design
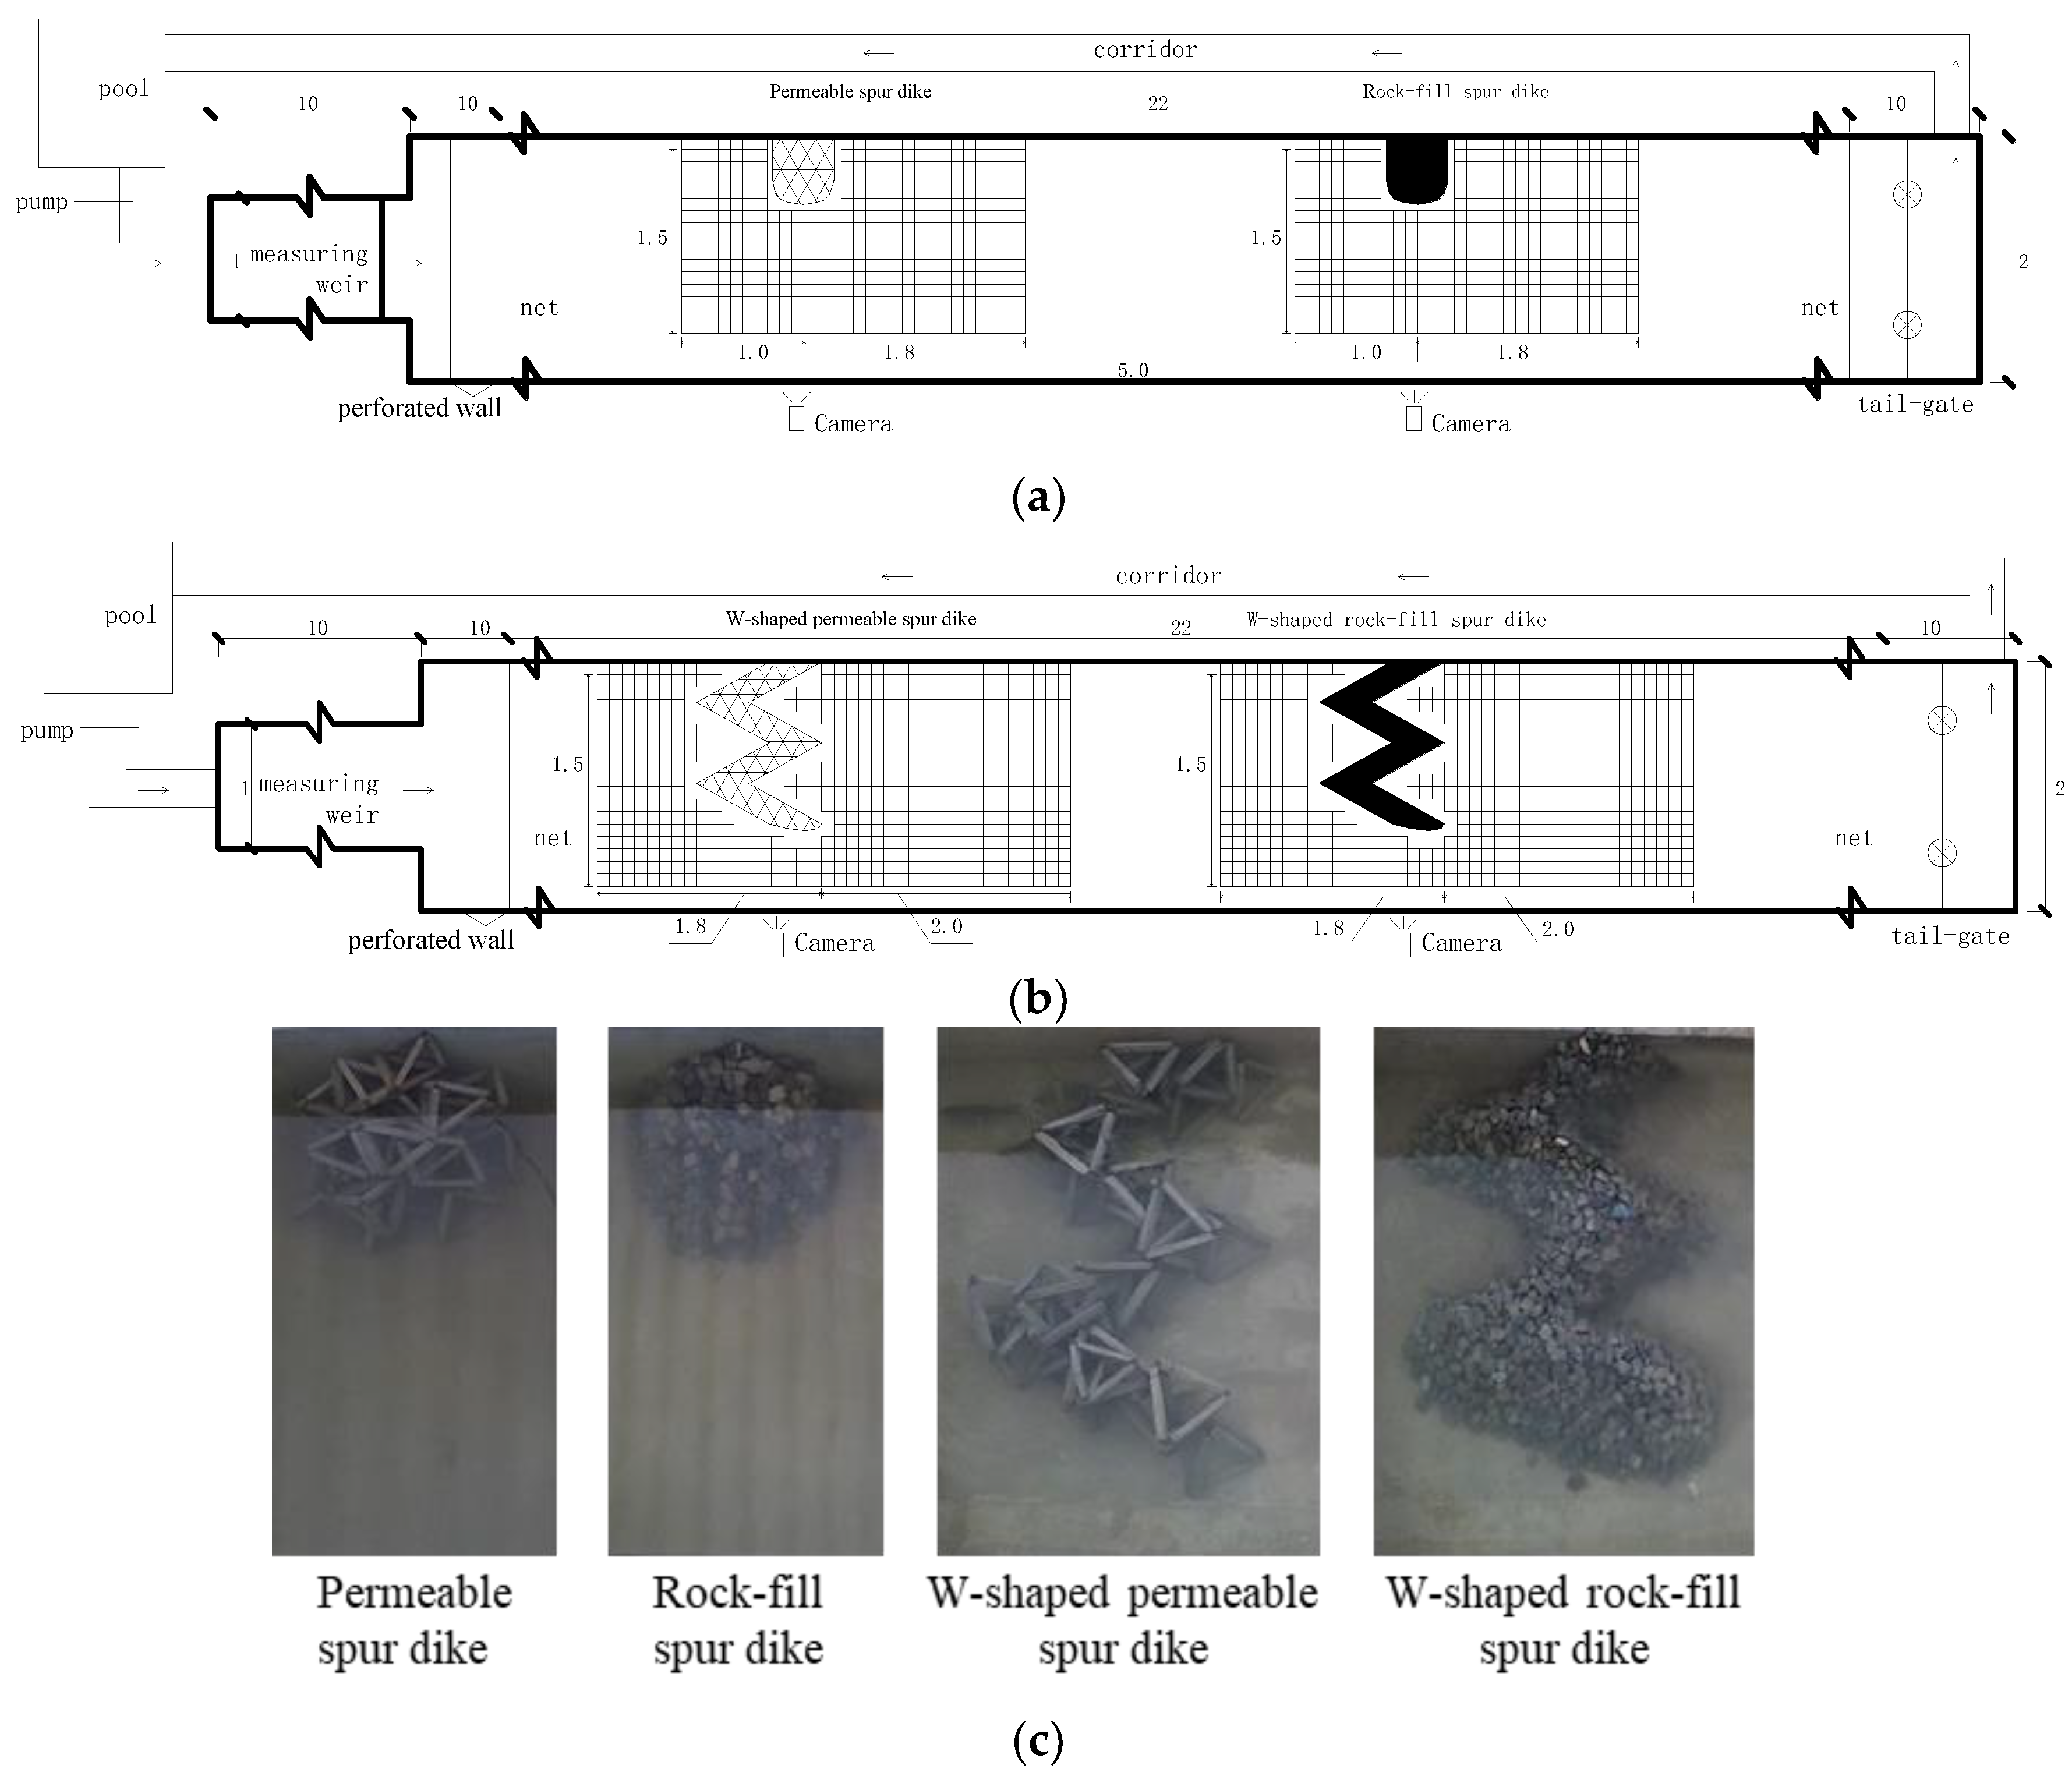
The flume experiments were carried out at the Basic Theory Sediment Laboratory of the Tiexinqiao Test Base, Nanjing Hydraulic Research Institute. The test setup is shown in Figure 1. The flume is 42 m long, 2 m wide and 1 m deep, and flow velocity is controlled by a rectangular thin-walled weir with a maximum flow velocity of 0.60 m3/s. There are two 1 m energy-dissipating walls at the flume water inlet used to smooth the water flow. Nets are placed at the second wall position and at 32 m from the beginning of the flume inlet. The test section is 10 m long and located in the middle of the flume.
The test was divided into two groups. The first group consisted of a rock-fill spur dike and a permeable spur dike (Figure 1a,c). The rock-fill spur dike was made with 80 mm particle sized gravel with a porosity of about 10% (proportion of void volume with spur dike to the volume of spur dike, the same below). The permeable spur dike was stacked with permeable frames of four sides and six edges each with a length of 20 cm and a section diameter of 2 cm × 2 cm with porosity of about 80%. The permeable frame spur dike was placed 5 m upstream of the rock-fill spur dike on the left side, both of them were perpendicular to the side wall of the flume. The spur dike is 0.55 m long and 0.50 m high. Its relative length is 0.28 (ratio of length of spur dike to width of flume). The second group consisted of a w-shaped rock-fill spur dike and a w-shaped permeable spur dike (Figure 1b,c). It is w-shaped along the direction of the water flow, and the spur dike root to the spur dike head is composed of four straight-line dikes, each with an 80 cm axis length. The w-shaped permeable spur dike is located 5 m upstream of the w-shaped rock-fill spur dike and on the left side of the flume. The angle between the first section of the dike and the flume is 30°, and the angle between adjacent dikes is 60°. The straight-line distance from the starting point of the spur dike root to the spur dike head is 1.2 m (relative length is 0.60, ratio of the straight-line distance from the starting point of the spur dike root to the spur dike head to width of flume), and the height of the spur dike is 0.35 m.
The flow velocity was measured with an acoustic doppler velocimetry system (Sontek ADV, Sontek, Inc., San Diego California, CA, USA). The data acquisition frequency was 25 Hz and processed by winADV (a post-processing software, developed by the USA Department of the Interior). After removing data with a correlation coefficient lower than 70 and a signal-to-noise ratio less than 20, the average flow velocity and the three-dimensional pulsation flow square root at each measurement point were obtained.
The crucian, which are sensitive to changes in water flow, were selected as the test fish. The fish had a body length of about 15 cm and were caught from a natural reservoir. Initially, they were kept in a 2 m × 1.2 m × 0.9 m (length × width × depth) pool for three days, with regular feeding and the water changed regularly. Feeding was curtailed one day before the test. The fish distribution during the test was recorded by a high-definition camera mounted about 3 m above the spur dike. The camera resolution was 1920 × 1280 pixels, 25 frames per second.
2.2 Experimental Procedure
For all experiments, the test flow discharge of the rock-fill and permeable spur dikes was 0.12, 0.18 and 0.24 m3/s, and the water depth was 0.60 m. The test flow discharge of the w-shaped rock-fill and w-shaped permeable spur dikes was 0.18 and 0.20 m3/s, and the water depths were 0.35 and 0.40 m, respectively. Flow conditions of all experiment were listed in Table 1. The flow velocity of the water layer 5 cm from the bottom was measured as the representative flow velocity of the corresponding point. A total of 900 data measurements were made at each point. The measurement range of the rock-fill and permeable spur dikes is as follows: 1.0 m upstream from the dike axis and 1.80 m downstream of the dike in the direction of water flow. The streamwise direction starts from the side of the dike root, from 0.1 to 1.6 m, and the measurement interval is 0.1 m. The measurement range of the w-shaped rock-fill and w-shaped permeable spur dikes is from 1.8 m upstream to 2.0 m downstream from the dike along the direction of water flow. The streamwise direction is from 0.1 to 1.6 m, and the measurement interval is 0.1 m, as shown in Figure 1.
The water flow conditions for the fish aggregation test and the spur dike setup were the same as the hydrodynamic test. For each test, after the water level and flow velocity were adjusted to working conditions, 25 fish were placed near the net at the tail of the flume. The camera was used to record the aggregation status of the test fish around the spur dike. After the test, the fish were removed and separated. It should be noted that different fish groupings were used in each test. Each test started at 9:30 a.m. and ended at 15:30 p.m. on the same day. During the test, no one was close to the flume, and the test fish distribution was observed on the video recorder through the camera.
2.3. Data Processing
(1) Flow data process:
The flow velocity of each point was calculated using the recorded average flow velocity. The calculation formula is as follows
where , , and are the average flow velocity in the streamwise, transverse, and vertical directions of the measurement point, respectively.
The turbulent kinetic energy can be calculated by the following formula:
where , , and are streamwise, transverse, and vertical pulsating flow velocity. are the difference between the instantaneous flow velocity and the average flow velocity. , , and are instantaneous flow velocity in the streamwise, transverse, and vertical directions.
(2) Flow data standardized:
When the test group is different, the numerical values of the hydrodynamic parameters are quite different, and the flow velocity and the turbulent kinetic energy are inconsistent, making comparisons difficult. Therefore, the data was standardized. The standardization of dispersion (min–max standardization) preserves the data trend and “compresses” the data to 0–1, facilitating the comparison of multiple datasets, so this method was used to normalize the flow velocity and turbulent kinetic energy data. The calculation for standardization of dispersion can be expressed by:
where is the standardized data, Xmin, Xmax, Xi are the minimum, maximum and i-th data respectively.
(3) Fish aggregative data process:
At the beginning of the test, the fish were adapting to the conditions, so their positions changed greatly. Therefore, only the fish data from 10:00 a.m. to 15:00 p.m. were used in the actual analysis. A sample was taken every 30 min, and each sample was 5 min long. A picture was taken at every 10 s to record the frequency and position of the test fish. To eliminate influence of flow conditions and spur dike size on laboratory test data and on-site observation data, the average aggregation rate (AAR) was used to express the attraction effect of the spur dike on test fish [37]. This index indicates the ratio of the amount of gathered fish around the spur dike to the total number of test fish after setting each spur dike and is calculated by the following formula:
where Ni is the number of fish gathered around the spur dike of the i-th observation, N is the total number of test fish, and n is the number of observations.
3. Results and Discussion
3.1. Mean Flow Characteristic
Table 1 shows the range of average flow velocity and turbulent kinetic energy around different types of spur dikes in the two different test groups. As listed in Table 1, mean flow velocity of different spur dikes at the same statistical area within a test is almost the same, but the max-min range is different, as that of the rock-fill spur dike is larger than the permeable spur dike. Both mean turbulent kinetic energy and the max-min range of the rock-fill spur dike are larger than that of the permeable spur dikes of the same statistical area within a test, especially for the w-shaped spur dikes. Generally speaking, spur dikes extend max-min range of velocity and turbulent kinetic energy, especially the rock-fill and the w-shaped rock-fill spur dikes.
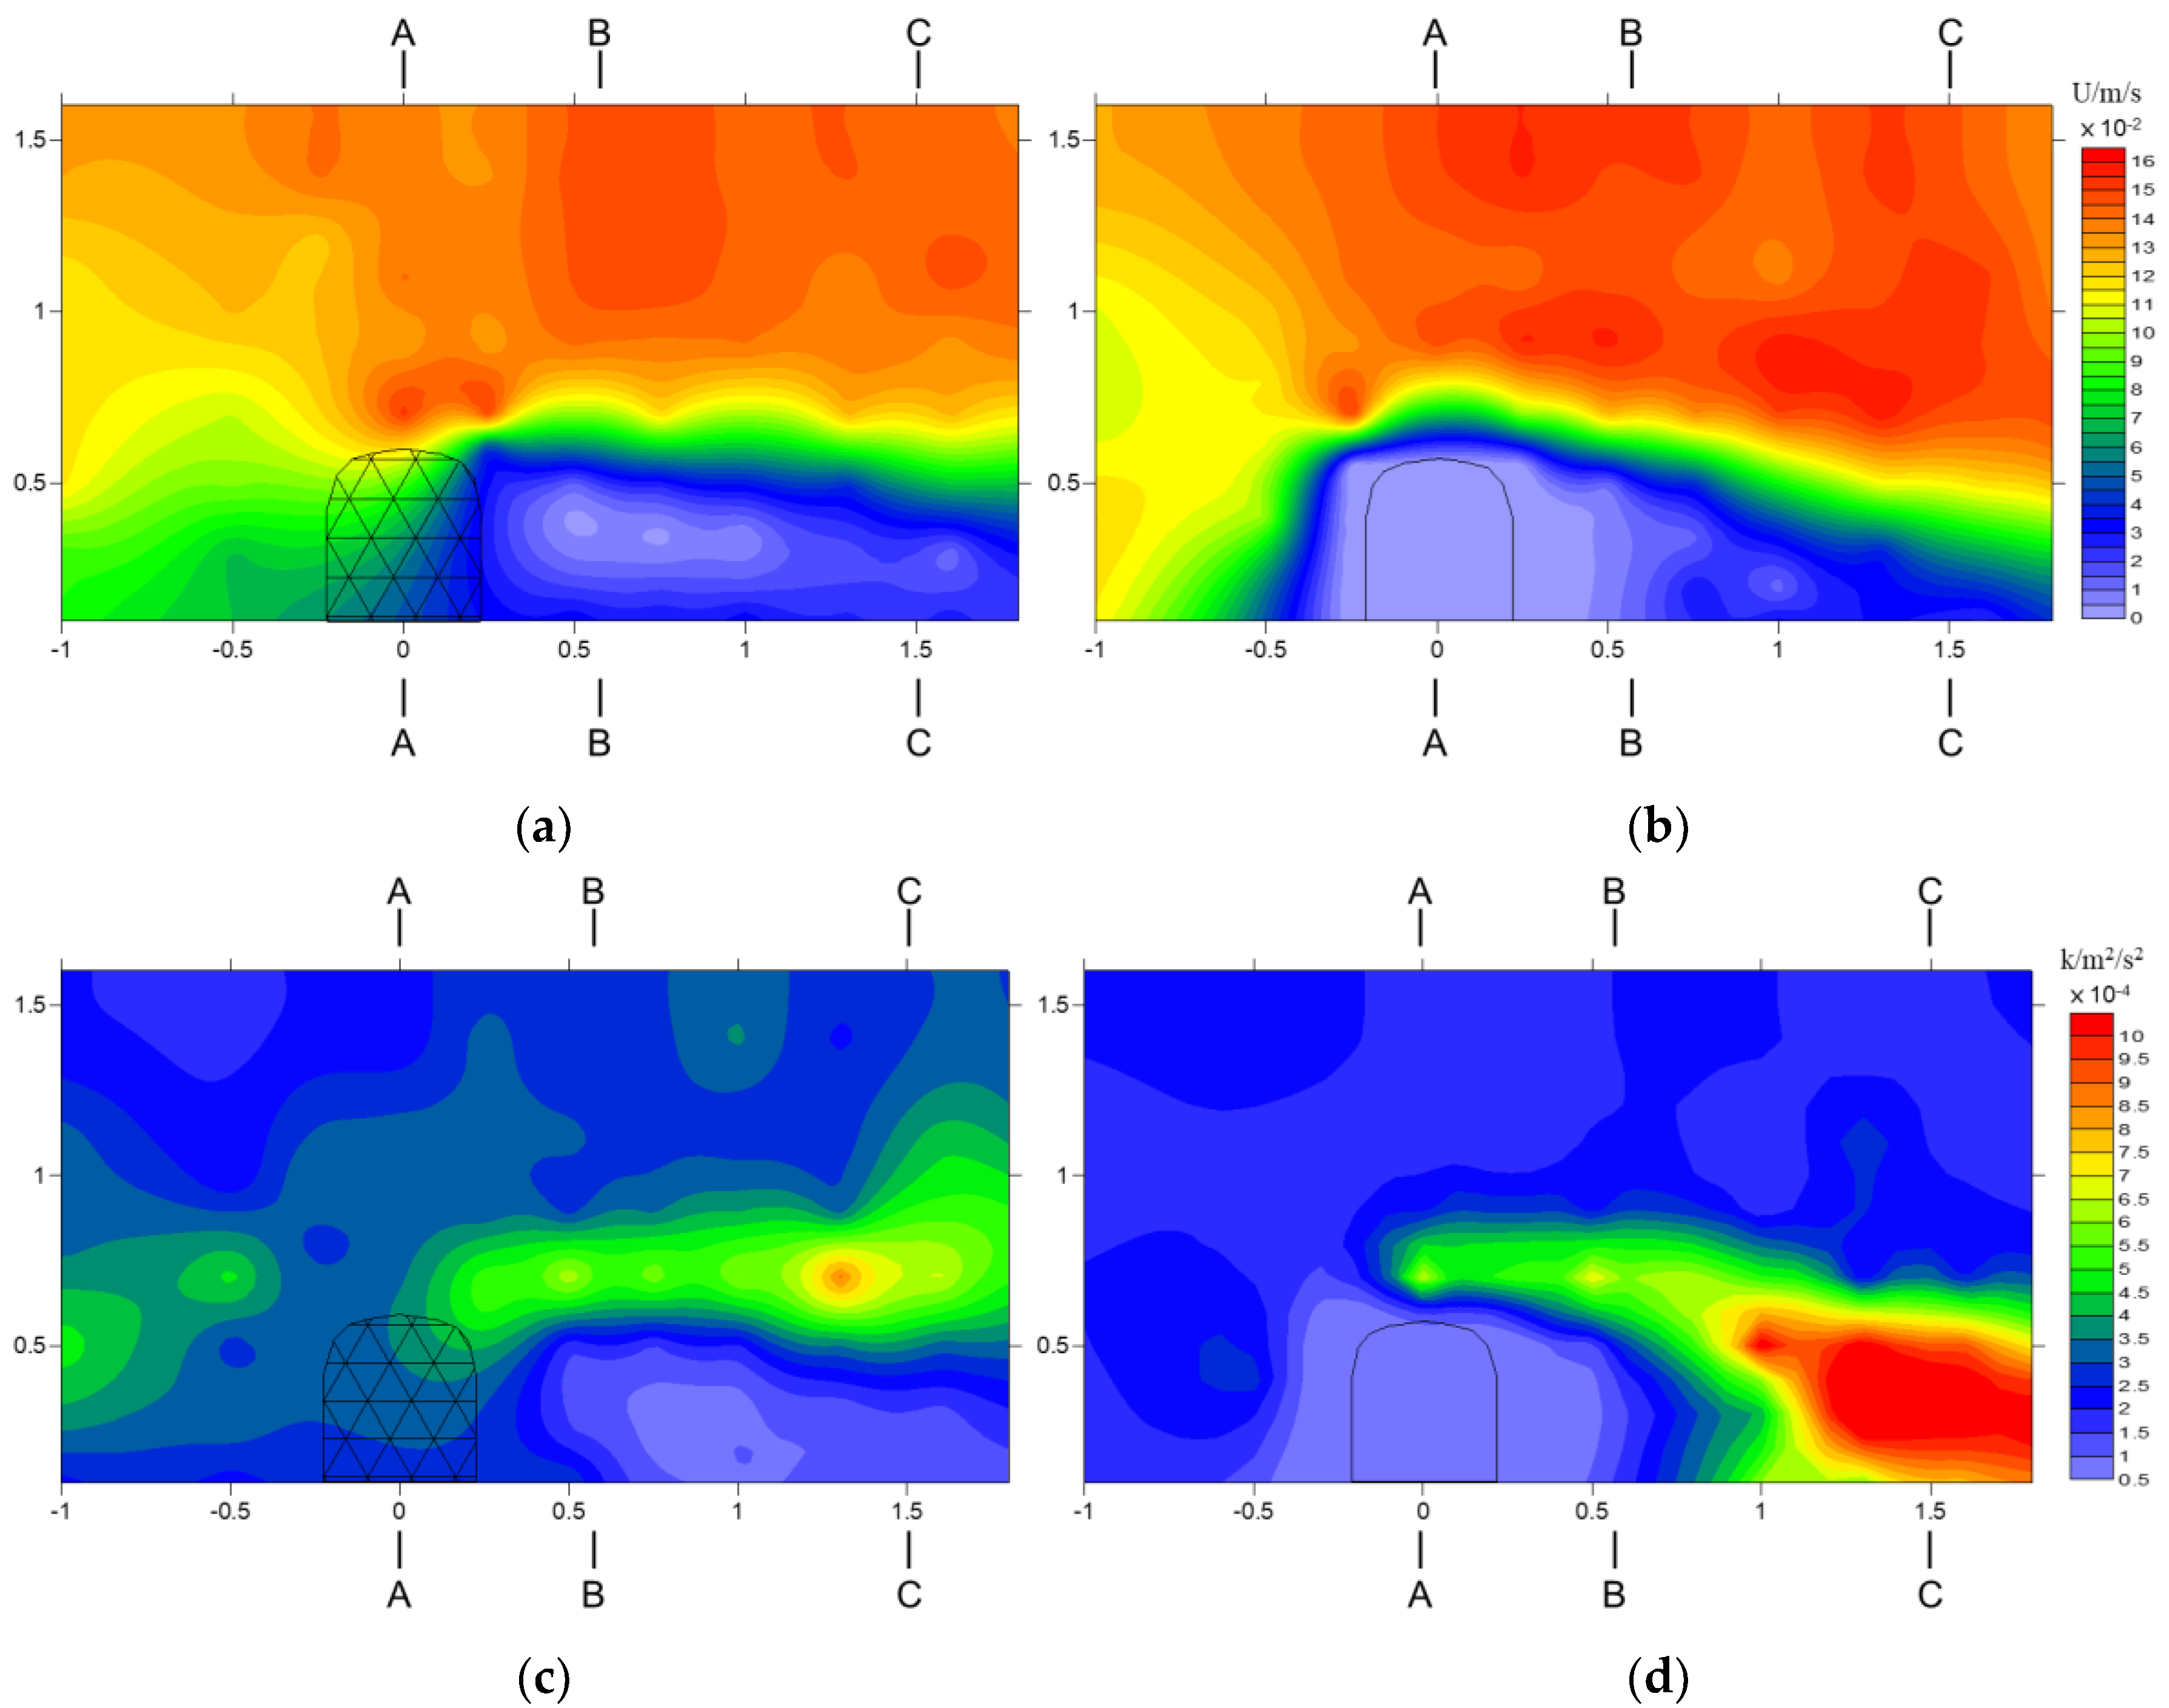
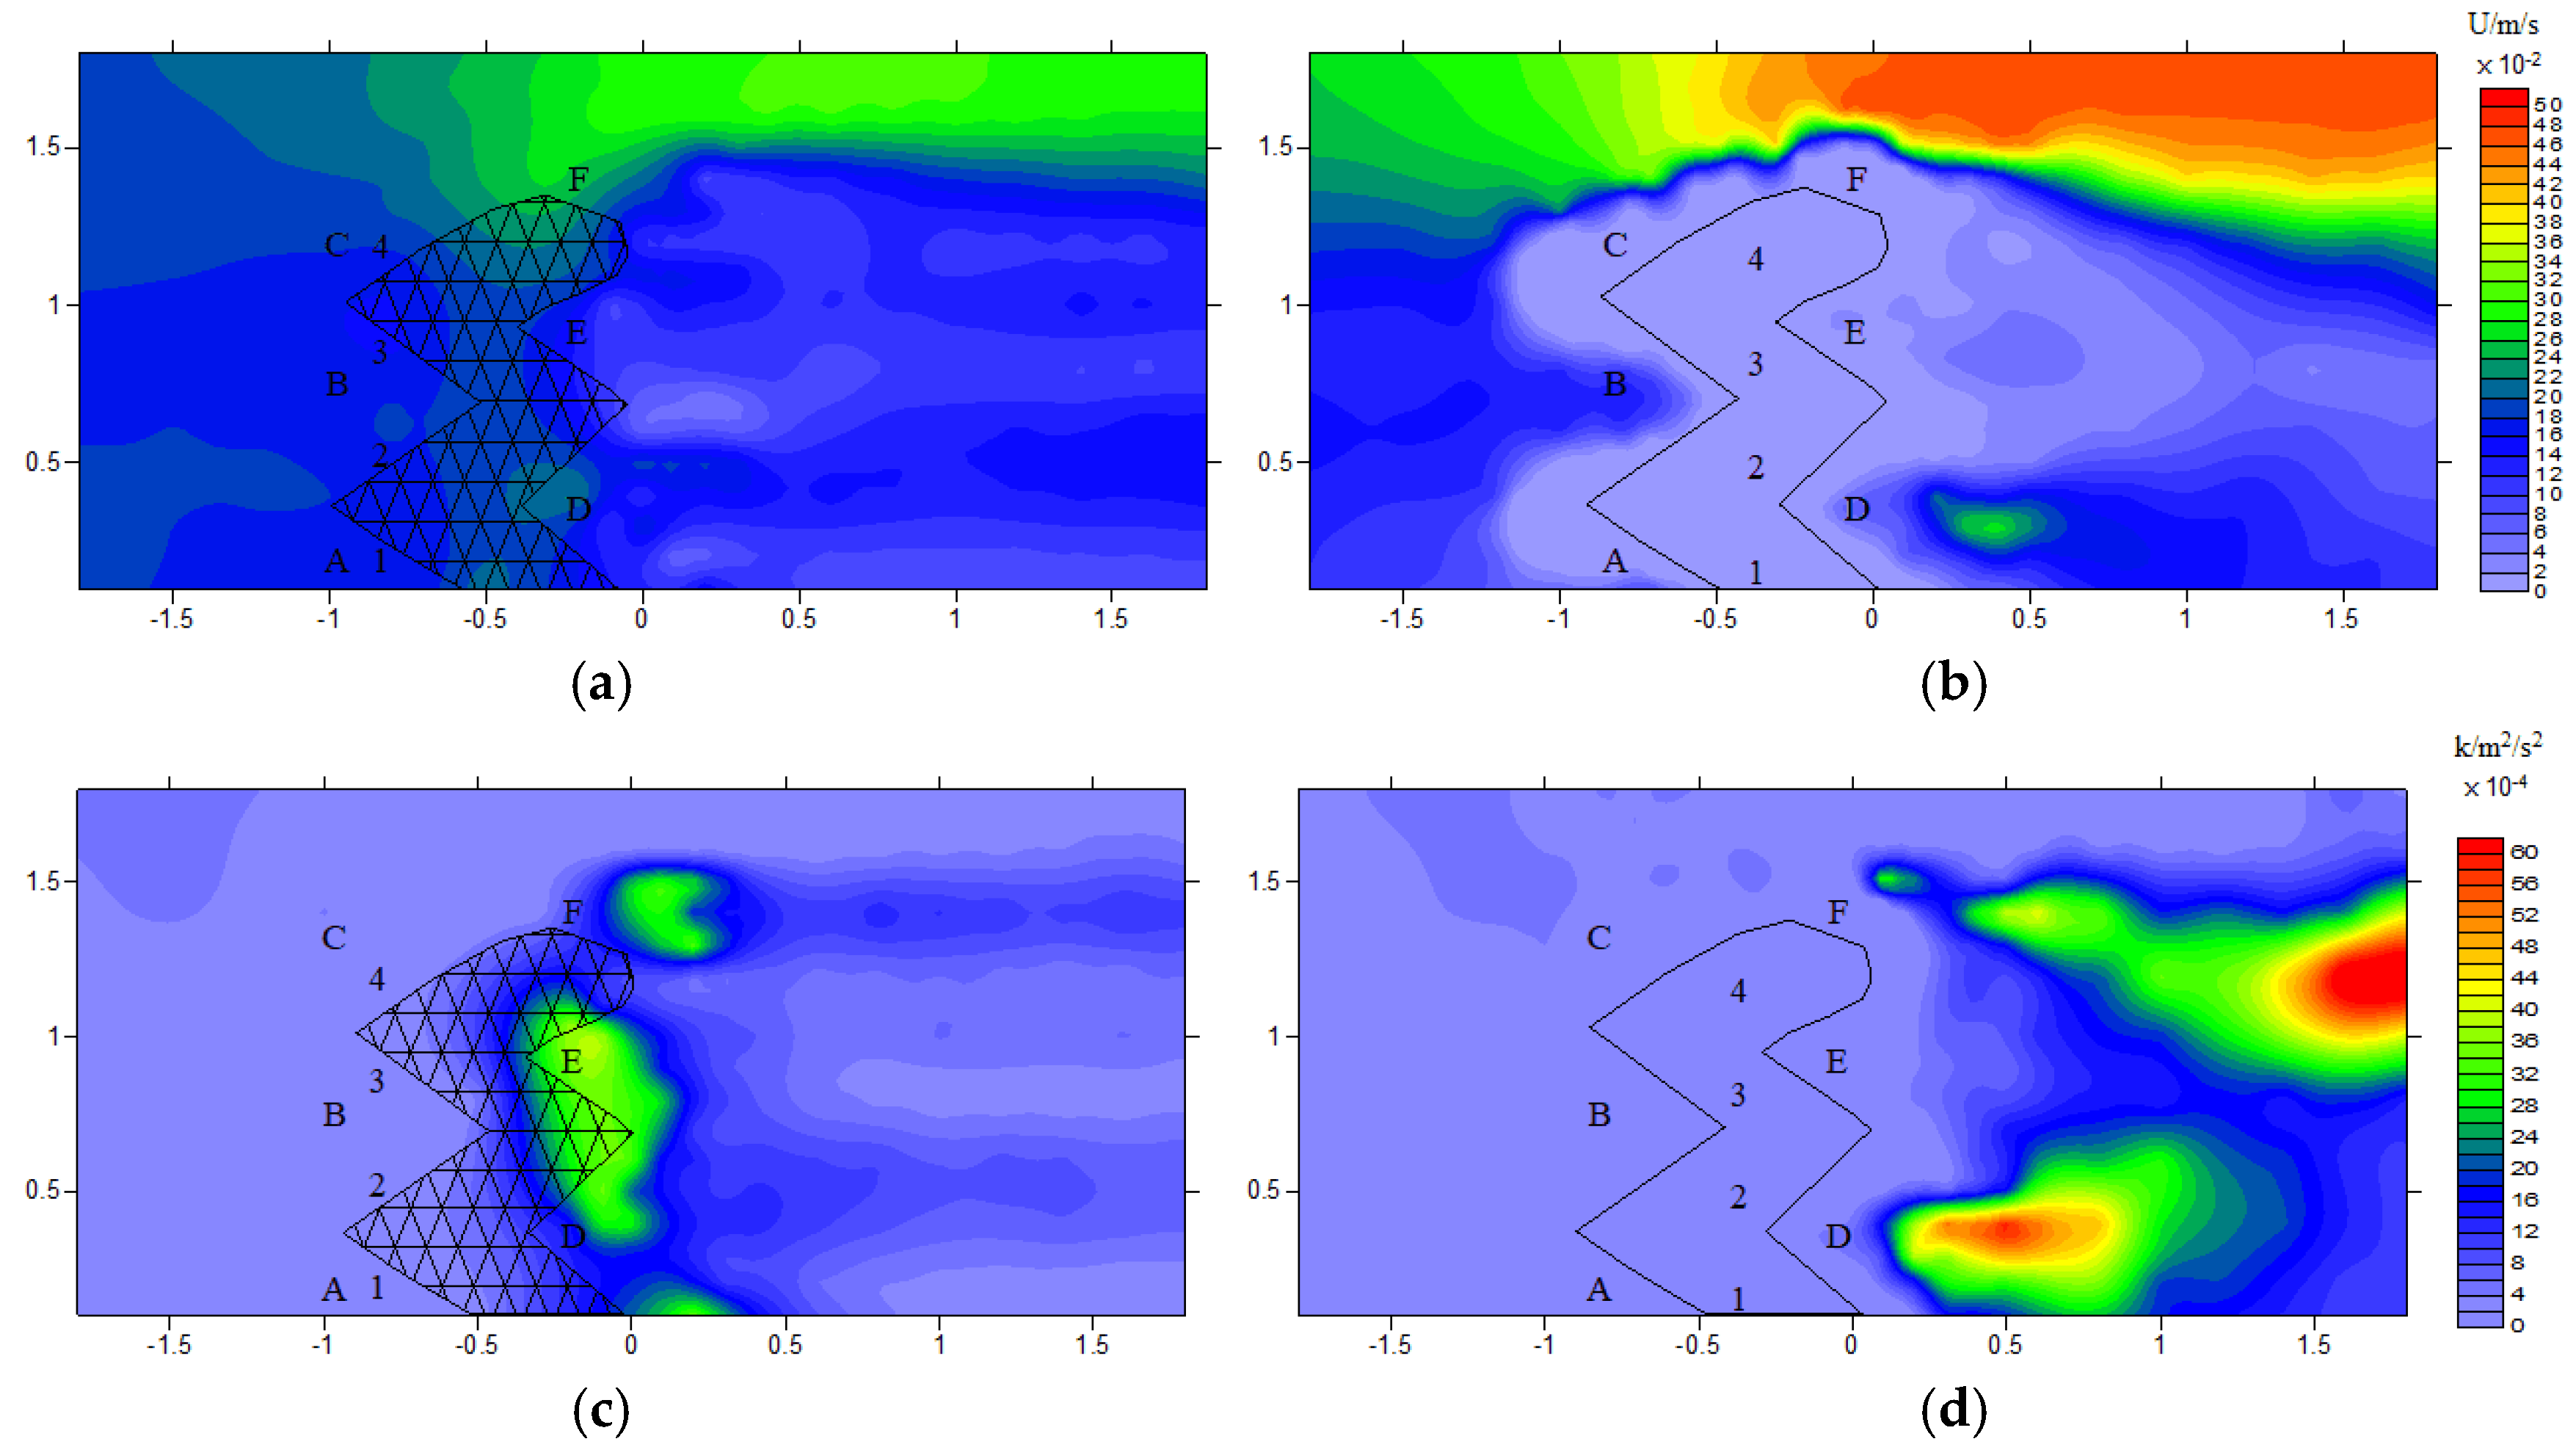
Figure 2 shows the flow velocity and turbulent kinetic energy distribution around the rock-fill spur dike and permeable spur dike at a discharge of 0.18 m3/s and average depth of 0.60 m. Figure 3 shows the flow velocity and turbulent kinetic energy distribution around the w-shaped rock-fill spur dike and w-shaped permeable spur dike at a discharge of 0.20 m3/s and average depth of 0.40 m. Four types of spur dike are submerged in water.
When water flows through the rock-fill spur dike (Figure 2b), the flow velocity on the water-facing side of the dike body gradually decreases due to water-blocking by the dike body. The upstream is restricted and moves towards another side of the flume. After passing the head of the spur dike, the narrowest main flow cross-section will be formed due to inertia (A-A in Figure 2b). Then, the main flow diffuses gradually along the flume. Meanwhile, a very small flow velocity region is formed on the backwater side. The flow boundary lay behind the spur dike sperate from the groin when flow is passing the groin head. Eddies are formed downstream of the separated point and move forward one by one. The moving eddies collide, break and merge with each other, and the corresponding turbulent kinetic energy is large. However, the turbulent kinetic energy in other areas is low, and in the vicinity of the dike body it is almost zero.
The permeable spur dike can divert flow and narrow flow area as well as rock-fill spur dike. At the same time, as the permeable spur dike had good water permeability, the narrowest main flow cross-section moves down (B-B in Figure 2a), the flow mixing area with high turbulent kinetic energy move towards the main flow. Flow velocity and turbulent kinetic energy in the vicinity of the dike body was low—but not zero. The zone with low flow velocity and low turbulence was diminished compared with the rock-fill spur dike. The gradient of flow velocity and turbulent kinetic energy is lower than that of the rock-fill spur dike, as the disturbance on flow of permeable spur dike is reduced.
The w-shaped spur dike preserves the water flow characteristics of the spur dike, but there are differences as well—mainly in the vicinity of the dike. Oblique dikes (1, 2, 3, 4 in Figure 2b) of the w-shaped rock-fill spur dike are inclined, which causes large flow velocity at the two junctions on the lower side of the dike (area around A and B in Figure 3b). After flow passes over the first two straight-line dike (1 and 2 in Figure 3b), flow from two directions come across and mix in the downstream area of the spur dike (area around D in Figure 3b), where flow velocity and turbulent kinetic energy are very high (area around D in Figure 3d). A similar area around E (in Figure 3b) is affected by flow around the groin head as well as the mix effect of flow from dike 3 and dike 4 (in Figure 3b), which makes flow velocity and turbulent kinetic energy small.
The w-shaped permeable spur dike has a similar diversion function as the w-shaped rock-fill spur dike, which causes flow to come across and mix around the two junctions on the lower side of the dike (the area around A and B in Figure 3a). However, as the w-shaped permeable spur dike has large porosity, flow velocity of the main flow (the area around F in Figure 3a) is smaller than that of the w-shaped rock-fill spur dike, and opposite in the vicinity of the dike (the area around A, B, D, F in Figure 3a). Frames of w-shaped permeable spur dike have excellent energy dissipation capacity. Flow run through those frames would generating high level turbulent kinetic energy in the vicinity areas downstream of the w-shaped dike (D, E, and C in Figure 3c).
3.2. Water Flow Diversity
Entropy is a measure of system disorder, which is an extensive property of a thermodynamics system. In 1948, Shannon introduced the notion of entropy to information theory in order to measure the quantity of information contained in a message [38]. Entropy is a fundamental concept linking together information theory and statistical physics [39]. For a set of possible events {, , …, } whose probabilities of occurrence are , , …, . The information entropy or Shannon’s entropy is expressed by:
The more uncertain and heterogeneous the possible event, the greater Shannon’s entropy; the more certain and homogeneous the possible event, the smaller Shannon’s entropy. For only one type in the data set, Shannon’s entropy equals zero. Therefore, high Shannon’s entropy stands for high diversity, low Shannon’s entropy for low. The Shannon’s entropy equation provides a way to quantifies the randomness of probability laws and is a measure of heterogeneity commonly applied in the fields of statistical physics, information theory, ecology [39,40].
The spur dike is a permanent disturbance for a river flow system at reach scale. In order to eliminate the disturbance, the river flow regime is changed and spatial distribution, range of mean velocity and turbulent kinetic energy are modified (analyzed in Section 3.1), which can be used to describe flow diversity around the spur dike. Mean velocity and turbulent kinetic energy are important parameters reflecting the engineer effect, structure stability as well as the habitat quality. Based on Shannon’s entropy, we devised a water flow diversity index , to measure the diversity of water flow around the spur dike. It is defined as the product of the regional flow velocity diversity index and the turbulent kinetic energy diversity index , which can be expressed by:
where n is the level of flow velocity and turbulent kinetic energy. n is 10, meaning that the measured flow velocity and turbulent kinetic energy are divided into 10 levels after standardization, which is from 0.1 to 1.0. and are the ratios of i-th flow velocity and turbulent kinetic energy to the total area of the studied area, respectively. According to Equation (6), for the present study, reaches a maximum when , and . Namely, the more uniform the area ratio of flow velocity and turbulent kinetic energy, the larger the , indicating a higher water flow diversity around the spur dike. The area ratio of some level(s) of the flow velocity (turbulent kinetic energy) is not zero—however, it is extremely small, making it impossible to provide an effective habitat for fish. Therefore, the flow velocity and turbulent kinetic energy with an area ratio of less than 5% was excluded in actual calculations. Additionally, gaps among gravels of flume experiments are too small to use for fish, so this area was excluded in the statistics when calculating the water flow diversity index.
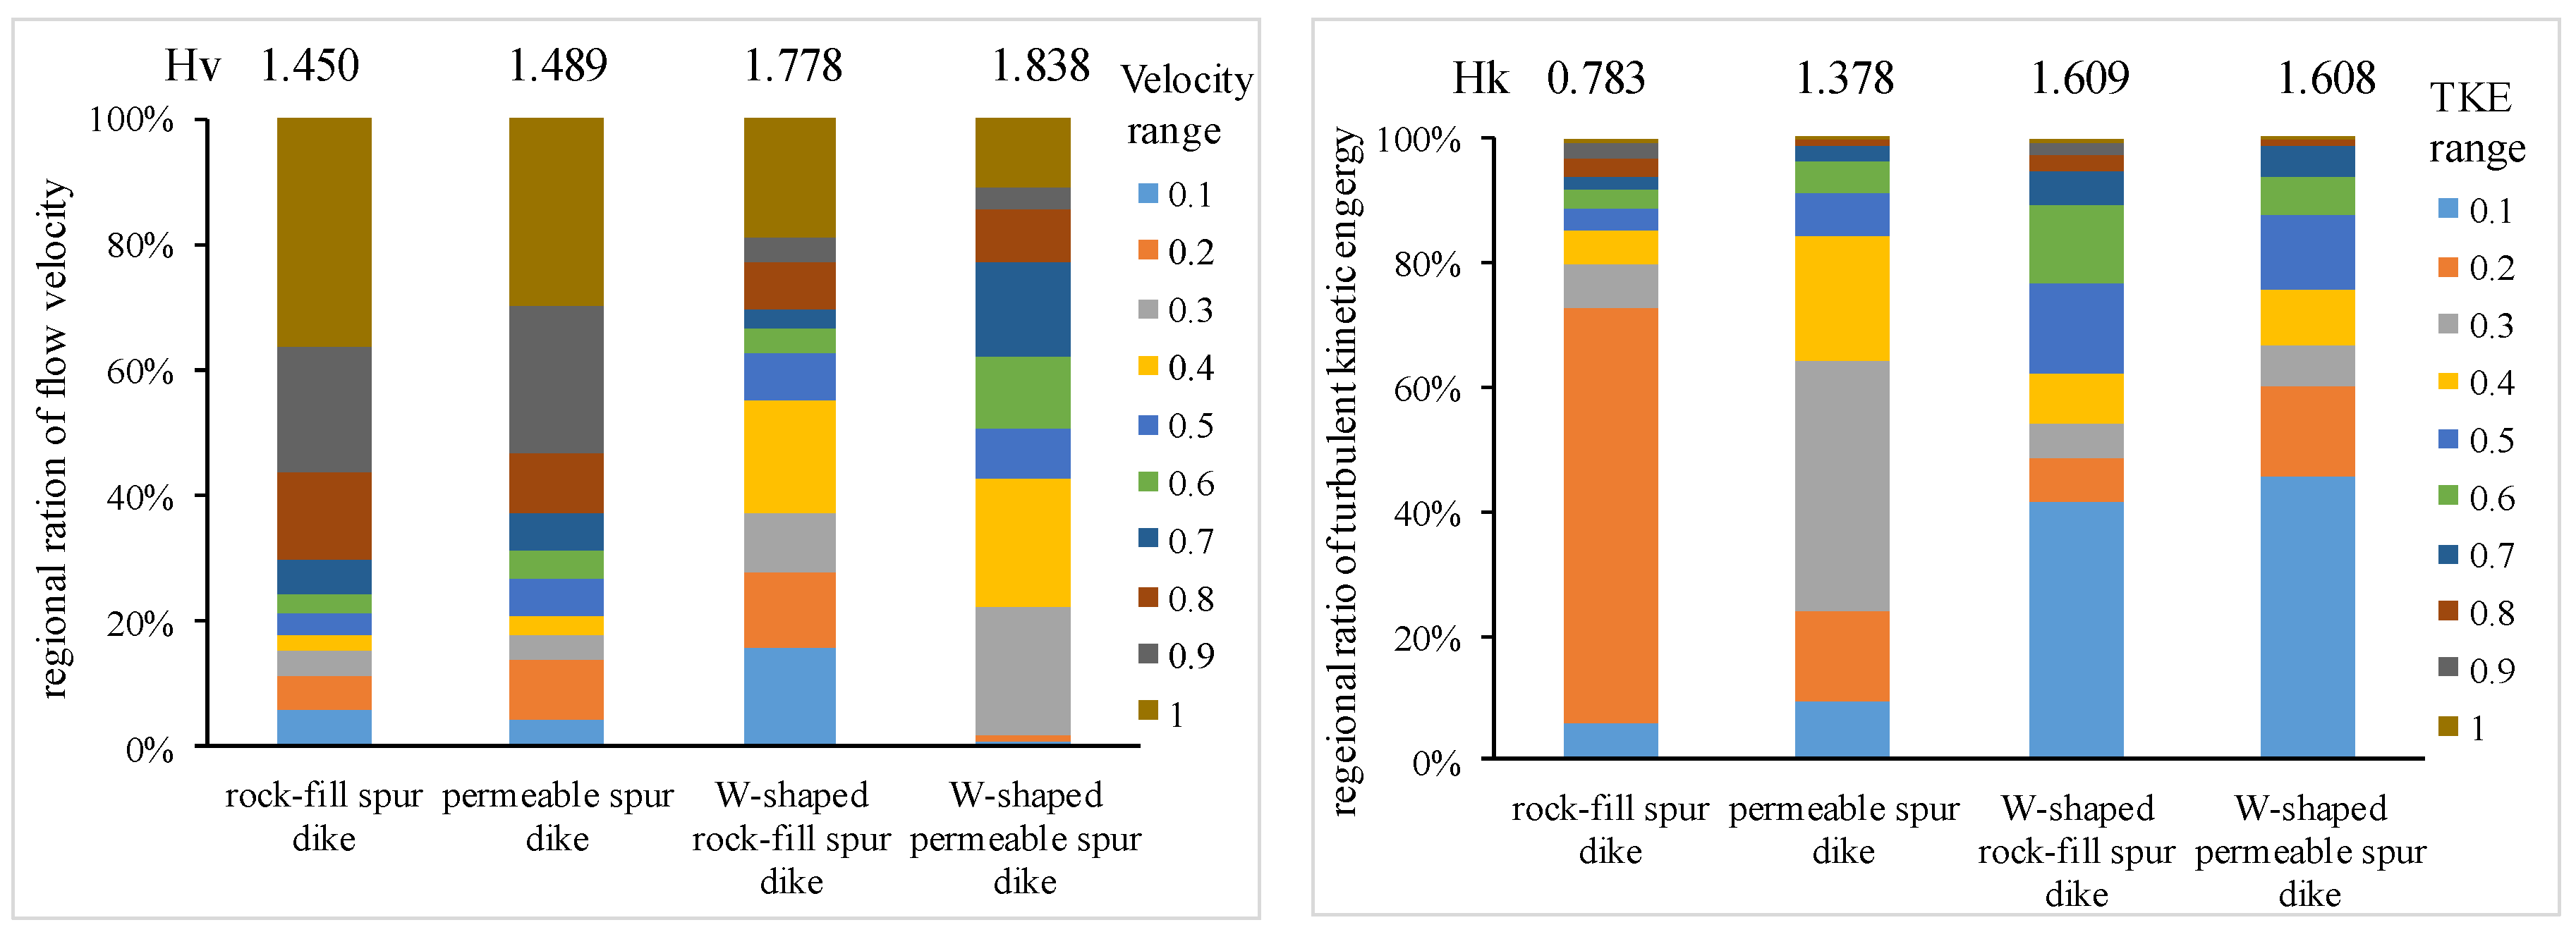
According to Equations (6)–(8), the water flow diversity index around the spur dikes for each working condition were calculated and the results are shown in Table 1. Under the different waterflow conditions, the values and distribution of flow velocity and turbulent kinetic energy are different. However, the water flow diversity index calculated after the nondimensionalization fluctuates within a certain range, which means the water flow diversity around a particular spur dike structure can be represented by a constant, such as the rock-fill spur dike, where the mean is 1.19 ± 0.05. According to the analysis above, the larger the constant—the higher the diversity of the water flow. Based on our calculations, the water flow diversity index around the four spur dikes ranged from 1.13 to 2.896, in the order (from high to low): w-shaped permeable > w-shaped rock-fill > permeable > rock-fill spur dike. The regional ratio of standardized velocity and standardized turbulent kinetic energy of different spur dikes is shown in Figure 4. Flow conditions are the same as discussed in Section 3.1. Under the same water flow conditions, the flow velocity and turbulent kinetic energy around the rock-fill spur dike was higher than that of the permeable spur dike, but the area of particularly large flow velocity and turbulent kinetic energy is small, and the area of slow flow zone is large, which makes small parts of standardized velocity and turbulent kinetic energy account for most of the area. The rock-fill spur dike, with a standardized velocity of 0.8, 0.9 and 1.0 accounts for 70% of the area, and the standardized turbulent kinetic energy of 0.2 takes up 67% of the area. The flow velocity and turbulent kinetic energy area ratios around the rock-fill spur dike are quite different at each level, while those around the permeable spur dike are relatively uniform. The corresponding water flow diversity index value is relatively high as well. For the w-shaped spur dike, its structural design increases the complexity of the water flow in the adjacent area of the dike (refer to the analysis above). As shown in Figure 4, subsequently, the corresponding water flow diversity index increases as well.
3.3. Relationships between Fish Aggregation and Water Flow Diversity Index
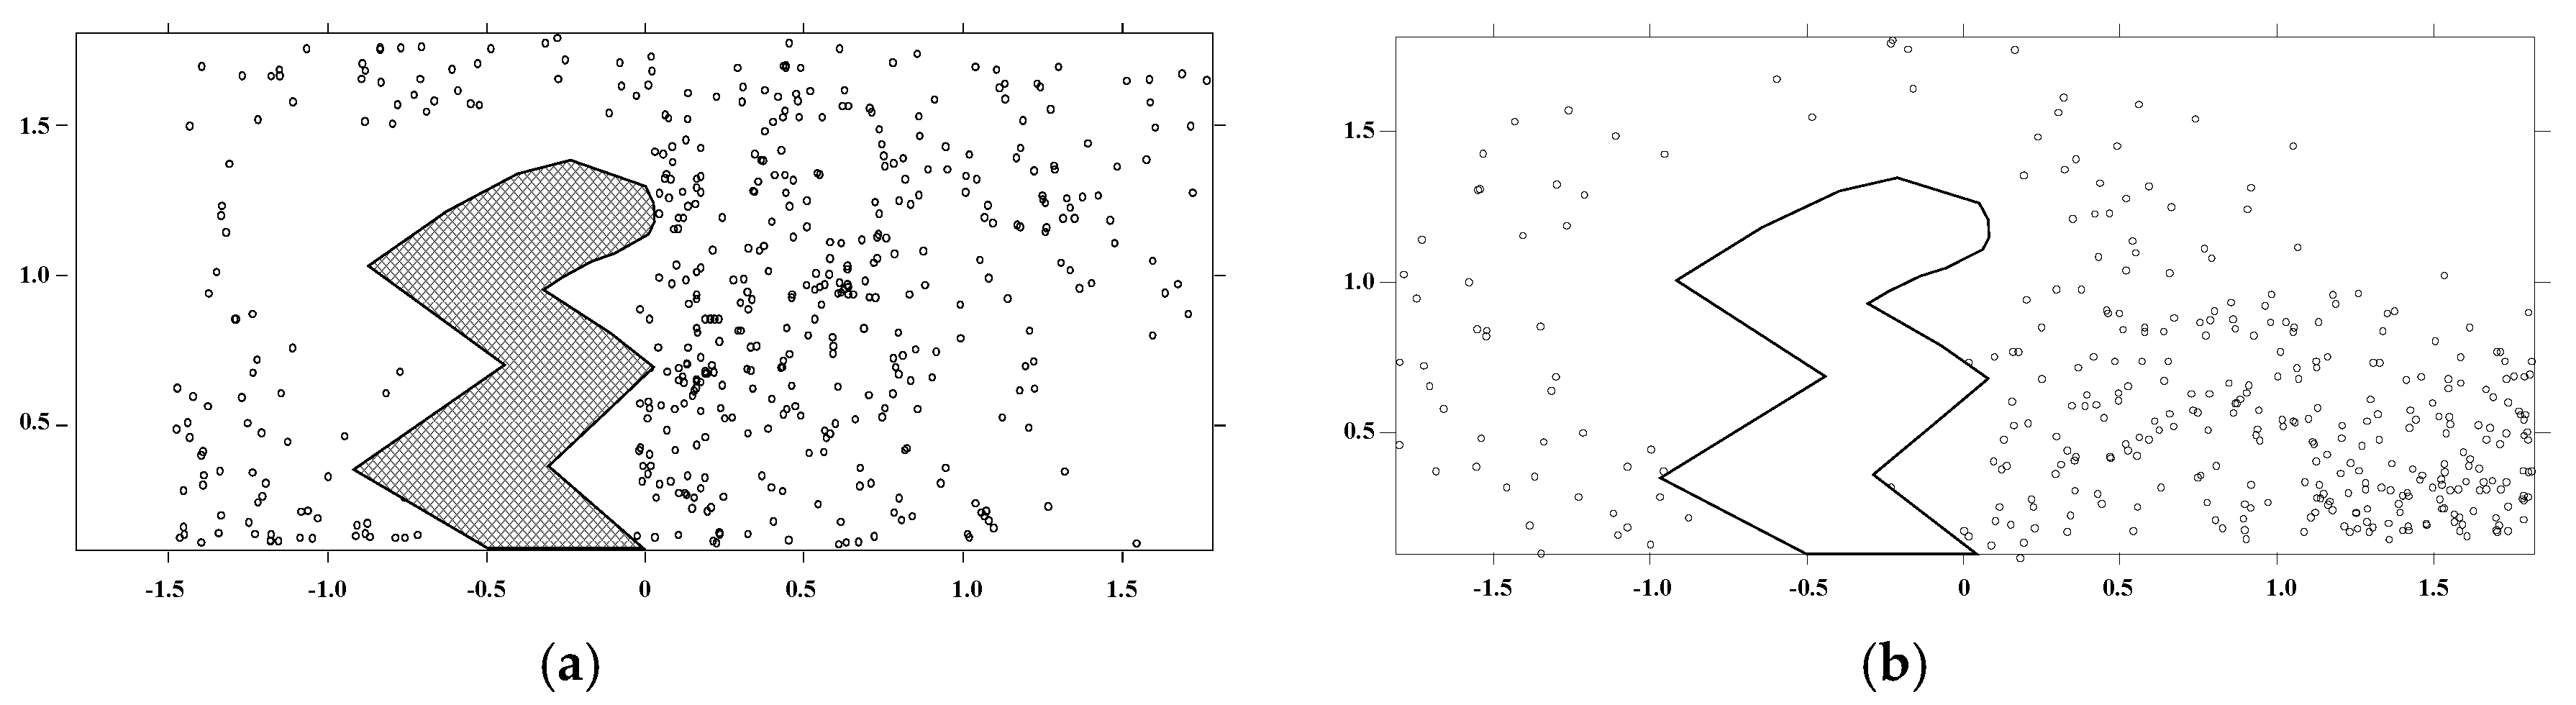
The aggregation of the test fish around the rock-fill spur dike and permeable spur dike at discharge of 0.18 m3/s are shown in Figure 5, and the gathering of the test fish around the w-shaped rock-fill spur dike and the w-shaped permeable spur dike at discharge of 0.20 m3/s are shown in Figure 6. Overall, the test fish mainly gathered in the slow-flow area on the back side of the spur dike where flow velocity are nearly the lowest (Figure 2, Figure 3, Figure 5 and Figure 6). For spur dikes of the same shape, the average aggregation rate of the test fish around the permeable spur dike was higher, and the aggregation range larger than that of the rock-fill spur dike. The test fish in the w-shaped spur dike would gather in the slow-flow area on the back side of the dike, but gathered in the slow-flow area on the water-facing side of the dike as well—especially for the W-shaped permeable spur dike. This can be explained by the following: the water-blocking effect of the rock-fill spur dike reduces flow velocity on the back side of the dike to extremely low levels, and the flow velocity and turbulent kinetic energy in the water flow mixing zone vary greatly. Additionally, the test fish need to use more energy if they want to stay, and the drastic change of the water flow environment makes it difficult for them to maintain their stability as well. However, the volume velocity of the slow-flow zone on the backwater side of the permeable spur dike is not zero—and there is a certain pulsation. In the water flow mixing zone behind the spur dike, flow velocity and turbulent kinetic energy vary only slightly so fish can gain power from the turbulence to reduce their own energy loss. Additionally, compared with the rock-fill spur dike, the structural design of the w-shaped rock-fill spur dike makes water flow around the spur dike more complex. The flow velocity and the turbulent kinetic energy gradient around the w-shaped permeable spur dike are lower than that of the w-shaped rock-fill spur dike as permeability of the permeable spur dike, which is easier for fish to maintain their stability. Besides, compared with the rock-fill spur dikes, cavity within the permeable spur dikes provides refuge for fish, which is an important factor for fish gathering and is widely applied in artificial reef design.
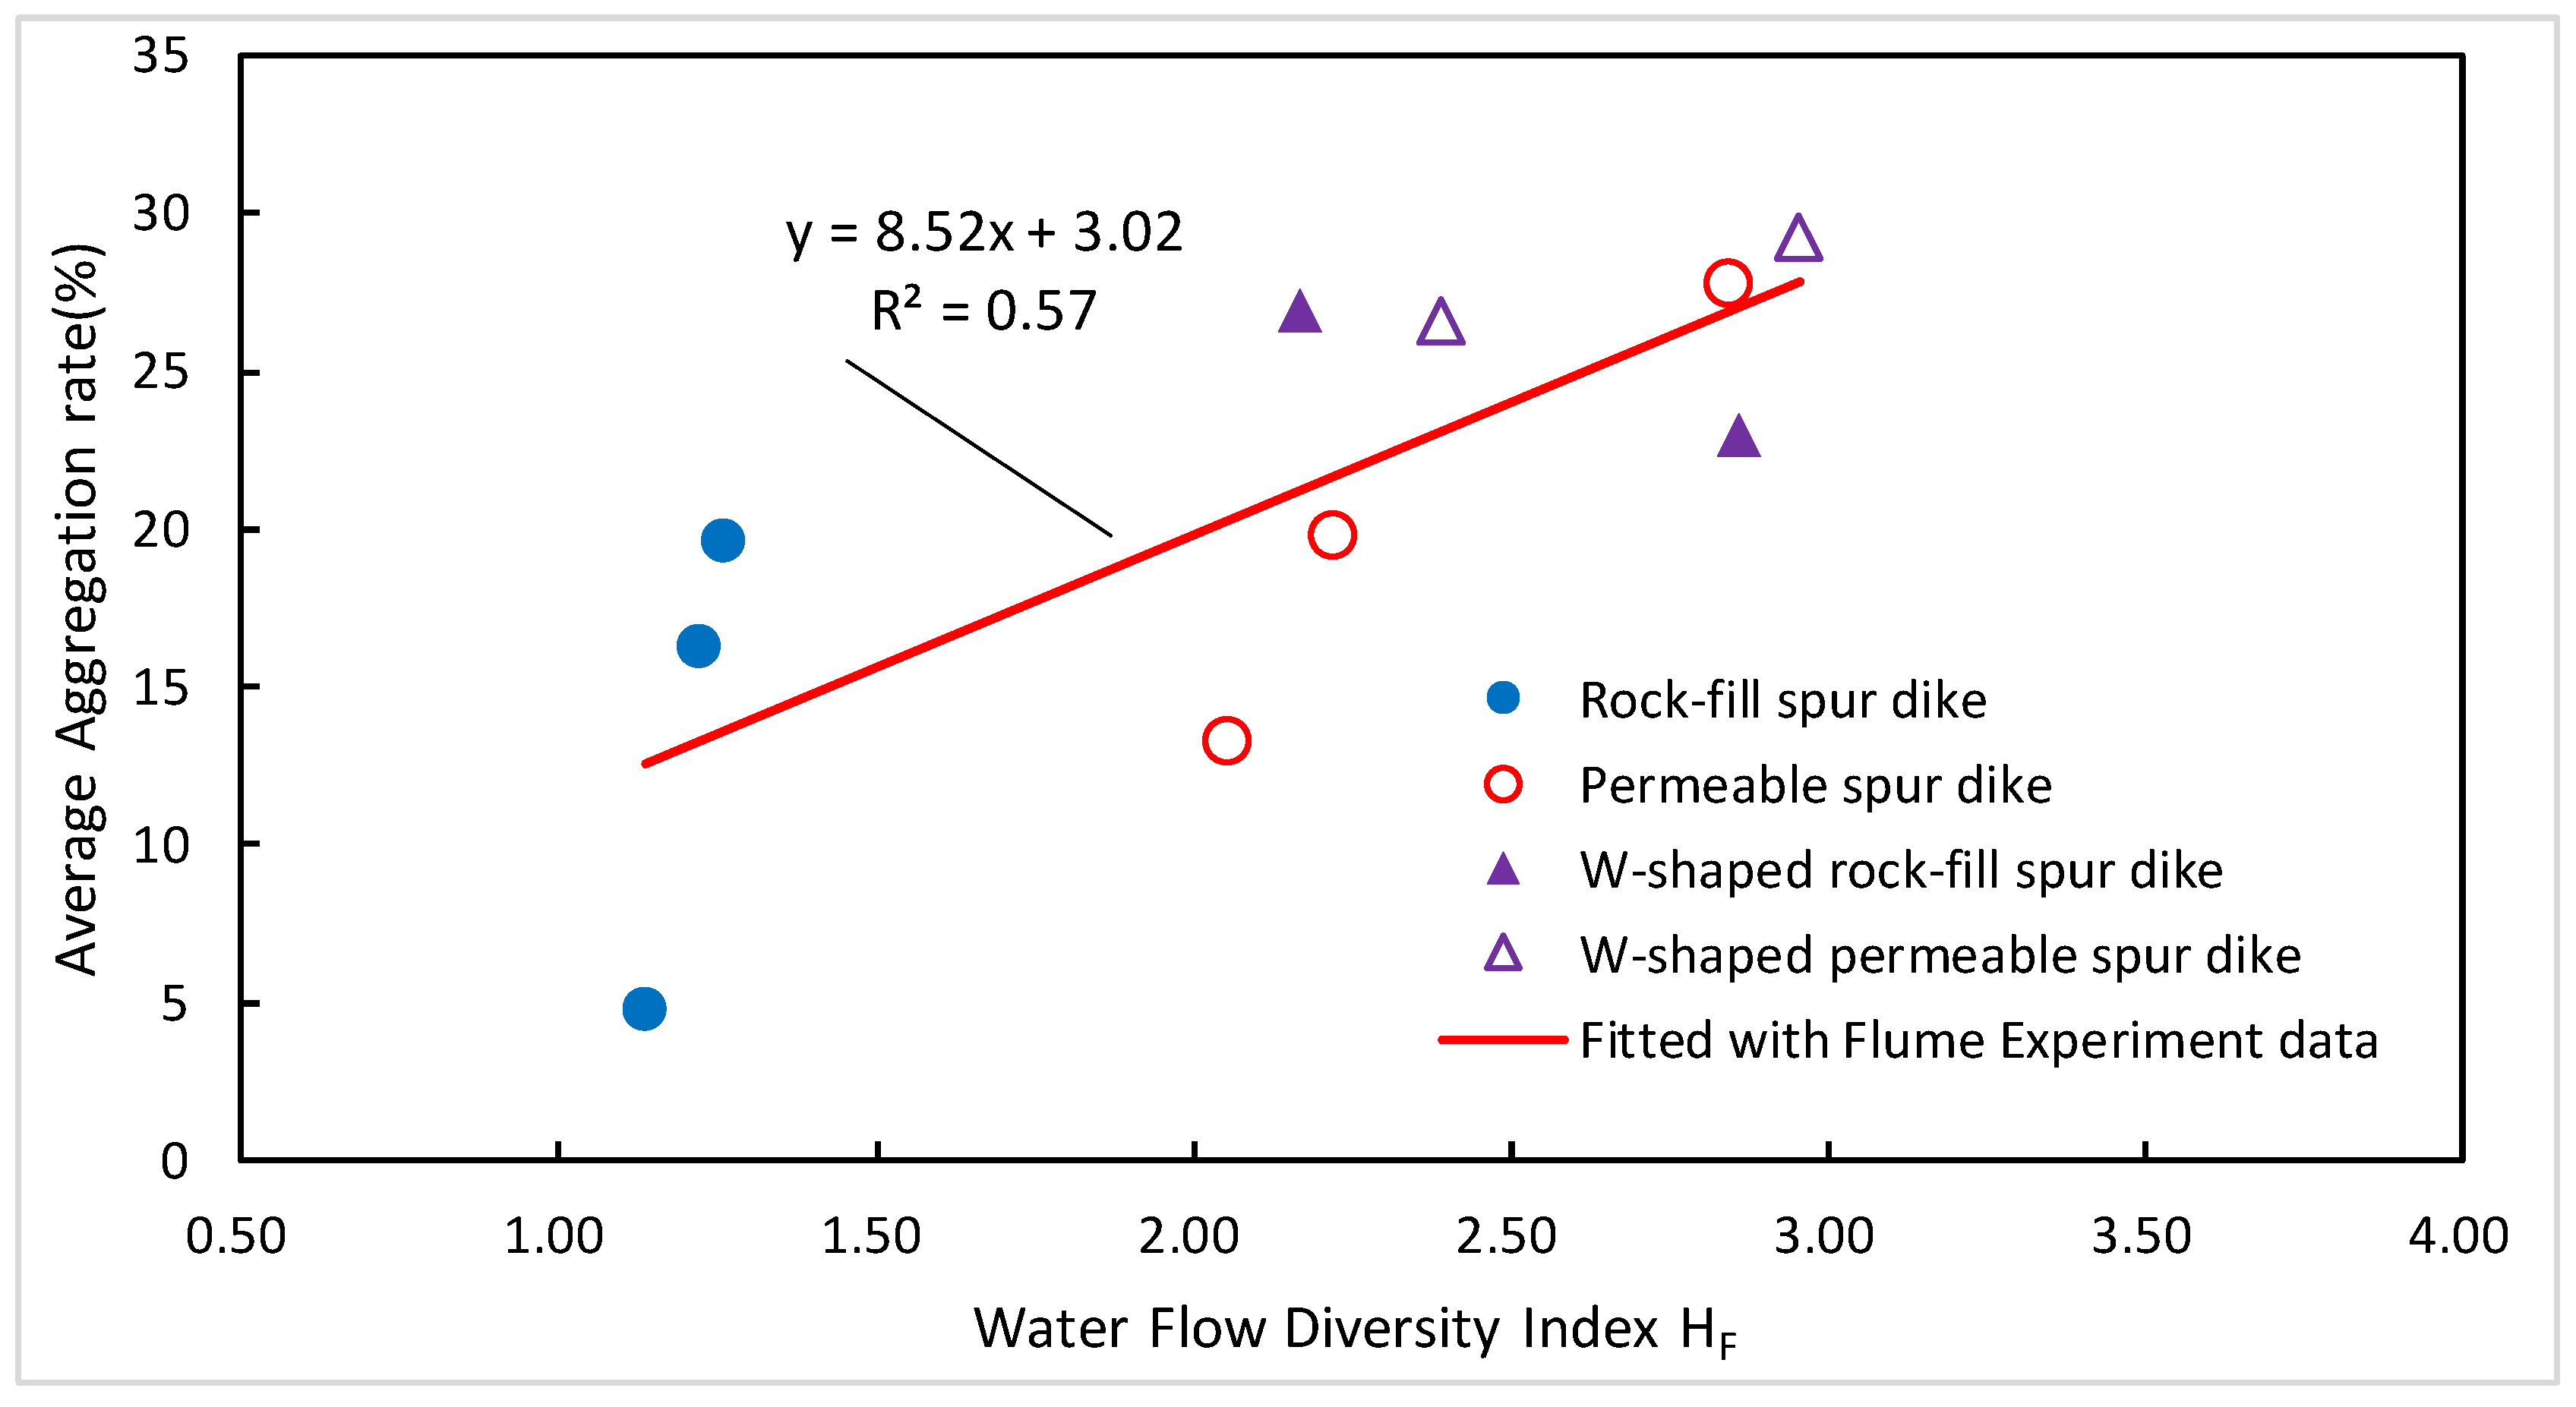
Test fish average aggregation rate around the spur dike of each test was listed in Table 1. The average aggregation rate of the test fish around the w-shaped permeable spur dike was the highest (about 28%), while around the rock-fill spur dike it was the lowest (about 14%). Figure 7 shows the relationship between the test fish average aggregation rate and the water flow diversity index. It is not difficult to conclude that for a certain type of spur dike under different flow conditions, fish average aggregation rate increases with water flow diversity index—except for one group. For different types of spur dikes, average aggregation rate of all test increases with average water flow diversity index. In other way, the aggregation effect of the spur dike is enhanced with an increase in water flow diversity. A relation curve between average aggregation rate and water flow diversity index was plotted with a linear fitting method using experiment data. However, fish movement is random, turbulent flow and its relationship with complex correlations between water flow diversity index and average the fish aggregation is not very high.
At present, before a newly designed structure applied in channel regulation or river restoration, a series of flume experiments and numerical studies have to be conducted to research flow characteristics (mean and turbulent), geomorphologic changes, habitat suitability, which would cost a lot of time and money. Although new layouts or structures of the spur dike were proposed and applied, it’s still difficult to quantified parameters of flow diversity around spur dikes. Studies have demonstrated the importance of turbulence on fish swimming [30,41] and habitat selection [11,26,27,32]. However, fish movement is random, different fish have their own habits, and the complexity of turbulence and mechanisms of fish assemblage in a turbulent environment is still not clear, all these factors increase the difficulty of quantified research on fish responses to turbulent flow. The new relationship between structure and water flow complexity, average aggregation rate of test fish and water flow complexity in our research can provide a tool and a new method to determine which type of structure to be chosen and how to optimize the structure.
However, flow characteristic of spur dikes is affected not only by layouts and made-up elements, but also by parameters of spur dikes (such as length, height, porosity), their relative relations with flow (like ratio of height of spur dike to depth), which may change water flow diversity. Besides, as mention above, different fish (including different species and a specie of different age) have different habits. More research needs to be conducted—especially quantitative studies on flow characteristics and flow diversity of different spur dikes and studies on the relationship between more fish (different species, a specie of different life stage) aggregation and turbulent flow characteristics.
4. Hydroacoustic Investigation of Laohutan Fish-Bone Dike, the Dongliu Reach and the Yangtze River
4.1. Project Background and Investigation Techniques
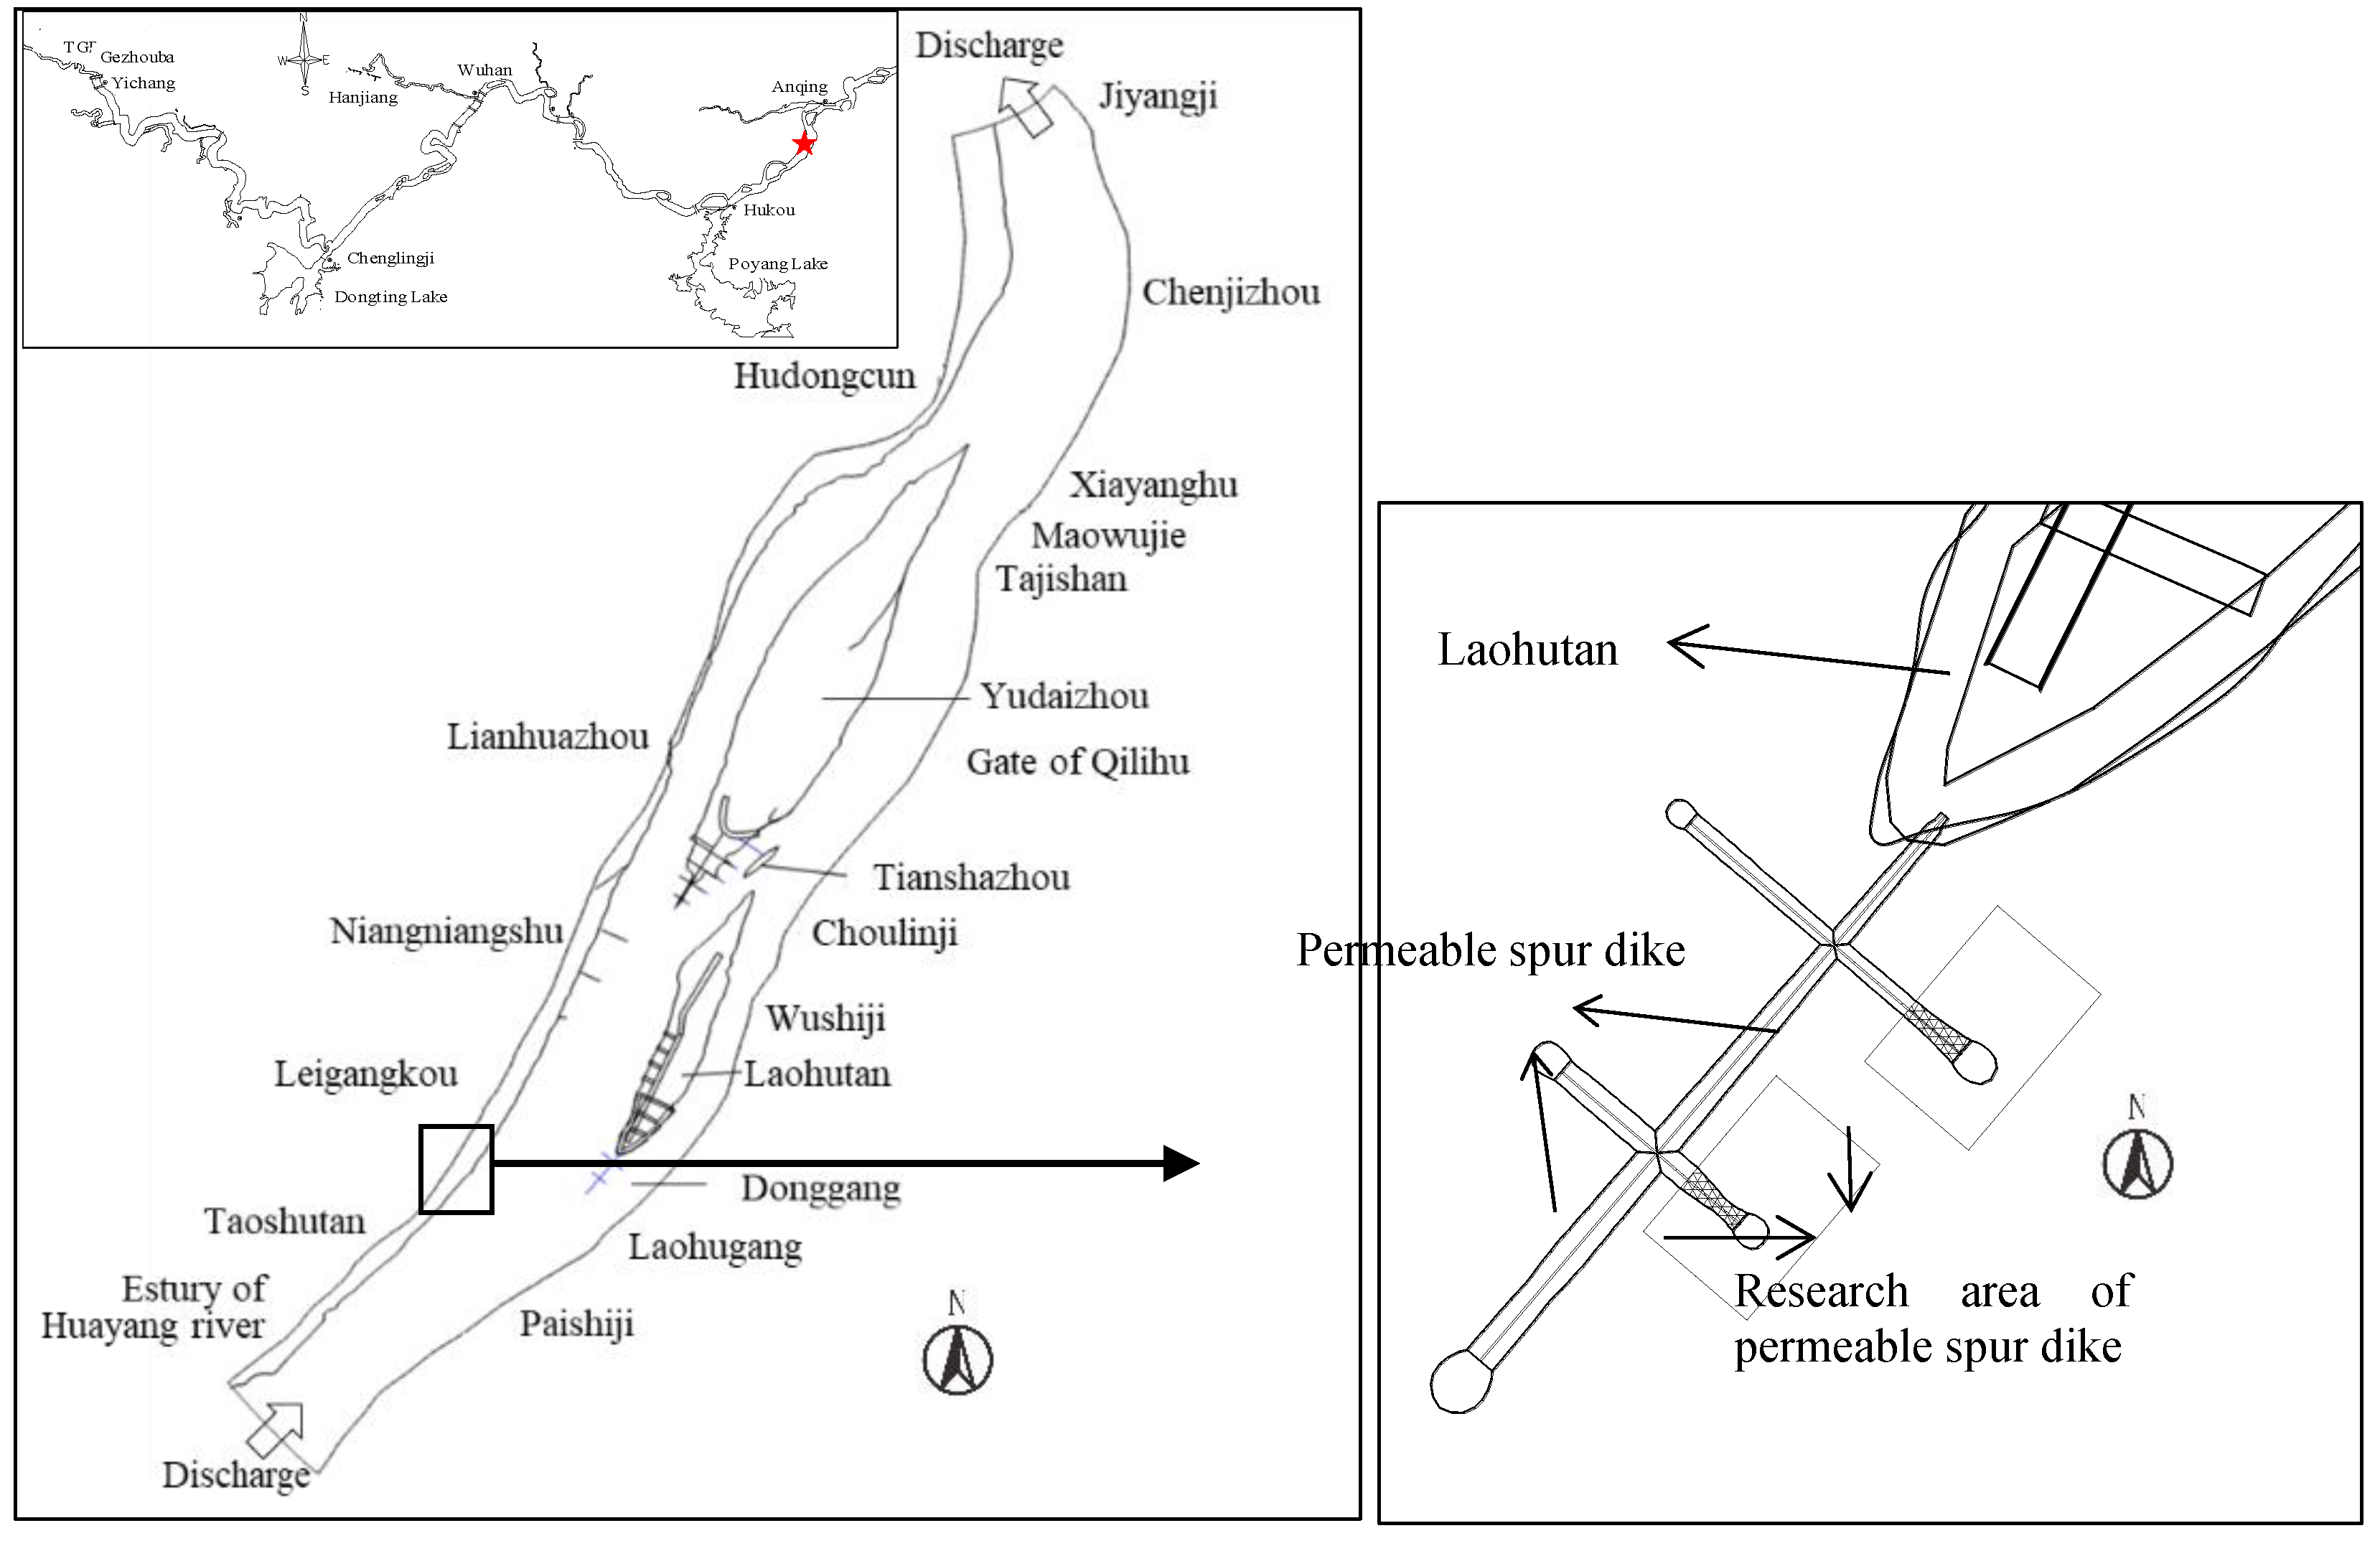
The Dongliu reach is located between Jiujiang and Anqing in the downstream part of the Yangtze River (Figure 8). The waterway is complex and variable in the dry season with poor navigation conditions. It has always been one of the key shallow waterways of the Yangtze River. To limit the development of Donggang, control the width of the left-hand rectification line of Laohutan, increase the flow velocity of the left-hand of Laohutan, and improve the water depth of the left-hand waterway, the Yangtze River Waterway Bureau built a fish-bone dike at the head of Laohutan. The project began in November, 2012 and was completed in April, 2014. The fish-bone dike consists of a 1050 m ridge dike and two thorn dikes (342 and 521 m, respectively). The first 100 m in front of the right side of the thorn dike is a four-side six-edge permeable dike, and the other part is a rock-fill structure. Two investigations were carried out for the water flow during the season, using the flow of the Datong Station which can be used to represent the flow of the Dongliu reach as it is located 120 km downstream, with no large tributaries in between. During the dry season in 7 December 2016 the flow at the Dantong station was 13,022 m3/s and the flood flow there on 8 August 2017 was 46,190 m3/s.
A BioSonics-DT-X-Digital Scientific Echosounder (BioSonics, Inc., Seattle, WA, USA) was used to investigate the distribution of fish around the fish-bone dike. Its transducer has an operational frequency of 208 khz and split-beam of 6.5°. The investigation time was from 9:00 a.m. to 16:00 p.m. The transducer of the Biosonics DT-X echo detector (BioSonics, Inc., Seattle, WA, USA) was fixed to the trimaran and the trimaran was tied to the fishing boat’s head by a rope. The transducer was about 0.4 m into the water and inclined at 45° to the water surface. Multiple navigation measurements were conducted around the fish-bone dike to cover as much of the dike as possible. Hydroacoustic data acquisition was performed using BioSonics Acquisition 6.0 software (BioSonics, Inc., Seattle, WA, USA). The pulse frequency of the transducer was 8 pps, the pulse width was 0.5 ms, the data acquisition threshold was −130 dB, and the data acquisition distance was 1–30 m. Using a Garmin GPS 17x HVS, GPS data was synchronously collected and stored as well. The instrument was calibrated in the field using a 36 mm tungsten carbide standard ball prior to measurement. Hydroacoustic data collected from on-site observations were analyzed using BioSonics Visual Analyzer 4.3 (BioSonics, Inc., Seattle, WA, USA) to identify fish location and to record fish frequency of occurrence. The data analysis started from the 1 m position of the beam and synchronously outputted the monomer echo recognition result. The single echo recognition parameters were as follows: the echo threshold was −60 dB, the correlation coefficient was 0.90, the minimum pulse width coefficient was 0.75, the maximum pulse width coefficient was 3, the termination pulse width was −12 dB and the time-varying gain (TVG) was 40 lgR.
Field velocity in large river are usually measured with ADCP (Acoustic Doppler Current Profilers, produced by Teledyne RD Instruments, Poway California, CA, USA), and Vector Current Meter (point measure) (Nortek AS, Rud, Norway). Flow turbulent characteristics can be derived from the measured data of ADV (Nortek AS, Rud, Norway), or ADCP (Teledyne RD Instruments, Poway California, CA, USA) measure data [42,43], but the velocity measured devices need to be held still for a certain period. It means the devices must be fastened to a holder that can be fixed on the riverbed. According to the physical model research results, velocity around heads of the fish-bone is about 1.5 m/s, and D-shaped mattress and four-side six-edge permeable frames were placed around the dike to protect the structure [44]—which makes it difficult and dangerous to set a holder to fix ADCP and ADV. Besides, flow characteristic of rock-fill spur dike and permeable were measured and analyzed using experiment data. Flow around the rock-fill dikes and the permeable in Dongliu reach were not measured.
4.2. Results
During on-site observation, it was difficult to accurately determine the total fish nN due to the ship's disturbance and limited measurement coverage. Therefore, the total number of fish observed was taken as the total fish nN. The permeable spur dike area was 200 m × 300 m and surrounded by the 100 m of water-permeable dike facing the water side, the 100 m in front of the dike head, and the 200 m backwater side of the dike. The counting range of the rock-fill dike was the left-hand area of the fish-bone dike. The habitat selection of fish is affected by many factors, including hydrological, hydraulic, biological and the life stage of the fish. In our research, permeable spur dike and rock-fill spur dike are adjacent, and flow discharge, sediment size, temperature, fish composition are almost the same. The difference is the range and spatial distribution of velocity and turbulence, mainly caused by makeup of the spur dike, which affect fish aggregation of the spur dike. In other words—the fish aggregation rate in the Dongliu reach is comparable.
During water flow in the dry season on 7 December 2016, there were 65 fish observed in the fish-bone dike, including eight fish in the rock-fill spur dike and 17 fish in the permeable spur dike. The corresponding average aggregation rates were 12% and 26%, respectively. During flood flow on 8 August 2017, there were 69 fish observed in the fish-bone dike, including 11 fish in the rock-fill spur dike and 19 fish in the permeable spur dike. The corresponding average aggregation rates were 16% and 28%. Thus, it can be concluded that fish aggregation was better in the permeable spur dike than the rock-fill spur dike.
The permeable spur provides more heterogeneous flow environment than rock-fill spur dike (analyzed above), which is attractive for different fish (different species and a species of different life stage). Flow velocity in downstream of Yangtze River is very fast, which make it difficult for plankton and macroinvertebrate survive as their weak swimming ability. The flow velocity behind the permeable spur dike is slow but not almost still as where of the rock-fill spur dike, which provides a stable habitat for plankton and macroinvertebrate, increases feeding potential for fish. Besides, cavities with the permeable spur dike provide refuge for fish larvae and other small dwellers from rapid flow and predators [3,45,46]. In some degree, the permeable spur dikes work as an artificial reef applied to increase reef fish habitat quantity and quality, protect marine life, reduce user conflicts, and so on [47]. The artificial reef-like permeable spur dike makes it more attractive for fish than the rock-filled spur dike and has a greater fish aggregative rate.
In this section, hydraulic parameters were not measured for the complex flow environment. But Hydraulic characteristics are a key factor affecting habitat use of fish, and a link between results of flume experiments and field. Systematically monitors and analysis on hydraulic distribution, geomorphic change, dwellers (plankton, macroinvertebrate and fish) diversity around the permeable and rock-fill spur dikes in Laohutan, Dongliu are necessary in the future.
5. Conclusions
Rock-fill, permeable, w-shaped rock-fill, and w-shaped permeable spur dikes were selected for flume experiments to investigate their influence on water flow diversity and the relationship between water flow diversity and fish aggregation. Additionally, a fish hydroacoustic study was conducted on the Laohutan fish-bone dike in the Dongliu reach of the Yangtze River to investigate fish aggregation effects around rock-fill and permeable spur dikes in the field.
(1) Based on Shannon’s entropy theory, a water flow diversity index, HF was proposed to calculate water flow diversity.
(2) The water flow diversity index values of different types of spur dikes under different flow condition were calculated, reflecting the degree of water flow diversity around the different spur dikes. The water flow diversity index values of the four different types of spur dikes are 1.13–2.96, and from high to low are: w-shaped permeable > w-shaped rock-fill > permeable > rock-fill spur dike.
(3) The test fish gathered in the backwater side slow-flow area of the spur dike, and the average aggregation rate was 5% to 28%. The attraction effect of the spur dike to fish increases with an increasing water flow diversity. The relationship between water flow diversity index and average fish aggregation rate was plotted, which provides a new method to assess the environmental effects of spur dikes.
(4) The permeable spur dike had a better fish aggregation effect than the rock-fill spur dike in the field at Laohutan fish-bone dike of the Dongliu reach Waterway in dry and flood seasons.
(5) The permeable spur dike works as a river training structure as well as an artificial reef: it alters hydrodynamic conditions, the sediment transport regime, and at the same time generates more heterogeneous flow than rock-fill spur dike, providing shelter for fish and other small organism, increasing fish habitat quantity and quality and reducing conflicts of river training and river protection.
The research results of this paper could provide theoretical support for the evaluation and analysis of habitat water flow diversity, as well as ecologically optimal design of spur dikes.
These results derive from some certain types of spur dikes among different river training structures and a limited number of individuals—all of the same species. Future works should expand this work with more river training structures and fish across different species and life stages.
Author Contributions
Flume experiments, T.H.; hydroacoustic investigation, Y.L., T.H., H.L.; writing-original draft preparation, T.H.; writing-review and editing, Y.L., H.L.; supervision, Y.L.
Funding
This research was funded by the National Key Research and Development Program of China (Grant No. 2016YFC0402108) and Hydraulic Science and Technology Program of Jiangsu Province, China (No. 2017044 and 2018038).
Acknowledgments
We are particularly grateful to Dingan Zhang, Yi Liu and Weixu Wang for assisting on experiments and the hydroacoustic investigation.
Conflicts of Interest
The authors declare no conflict of interest.
References
- Walker, J. Geomorphological considerations for the introduction of boulders and groynes for fisheries enhancement: Assessment of River Eden at Carhead. J. Phycol. 1998, 38, 862–871. [Google Scholar]
- Pinn, E.H.; Mitchell, K.; Corkill, J. The assemblages of groynes in relation to substratum age, aspect and microhabitat. Estuar. Coast. Shelf Sci. 2005, 62, 271–282. [Google Scholar] [CrossRef]
- Lu, Y.; Lu, Y.; Li, S.; Ding, J.; Liu, H. Study on Process of Flow and Sediment and Ecological Effects on River with Waterway Regulation; Nanjing Hydraulic Research Institute: Nanjing, China, 2011. (In Chinese) [Google Scholar]
- Lacey, R.W.J.; Neary, V.S.; Liao, J.C.; Enders, E.C.; Tritico, H.M. The IPOS Framework: Linking Fish Swimming Performance in Altered Flows from Laboratory Experiments to Rivers. River Res. Appl. 2012, 28, 429–443. [Google Scholar] [CrossRef]
- Kang, J.G.; Yeo, H.K.; Jung, S.H. Flow characteristic variations on groyne types for aquatic habitat. Engineering 2012, 4, 811–812. [Google Scholar] [CrossRef]
- Erick, D.; Thiel, R. Key environmental variables affecting the ichthyofaunal composition of groyne fields in the middle Elbe River, Germany. Limnol. Ecol. Manag. Inland Waters 2013, 43, 297–307. [Google Scholar]
- Pan, B.; Wang, Z.; Li, Z.; Yong-Jun, L.; Wen-Jun, Y.; Yi-Ping, L. Macroinvertebrate assemblages in relation to environments in the West River, with implications for management of rivers affected by channel regulation projects. Quat. Int. 2015, 384, 180–185. [Google Scholar] [CrossRef]
- Wang, W.; Yin, C.; Lu, J.; Wang, H. Application of submerged groin systems in the ecological restoration of littoral zones. Chin. J. Environ. Eng. 2007, 1, 135–138. (In Chinese) [Google Scholar]
- Wang, Z.; Wu, B.; Wang, G. Fluvial processes and morphological response in the Yellow and Weihe Rivers to closure and operation of Sanmenxia Dam. Geomorphology 2007, 91, 65–79. [Google Scholar] [CrossRef]
- Allan, J.D.; Castillo, M.M. Stream Ecology: Structure and Function of Running Waters, 2nd ed.; Springer: Dordrecht, The Netherlands, 2007. [Google Scholar]
- Enders, E.C.; Roy, M.L.; Ovidio, M.; Hallot, E.J.; Boyer, C.; Pettit, F. Habitat Choice by Atlantic Salmon Parr in Relation to Turbulence at a Reach Scale. North Am. J. Fish. Manag. 2009, 29, 1819–1830. [Google Scholar] [CrossRef] [Green Version]
- Burch, C.W.; Abell, P.R.; Stevens, M.A.; Dolan, R.; Dawson, B.; Shields, F.D., Jr. Environmental Guidelines for Dike Fields. In Proceedings of the Conference River 83, ASCE, New Orleans, LA, USA, 24–26 October 1983. [Google Scholar]
- Rosgen, D. Applied River Morphology; Wildland Hydrology: Pagosa Springs, CO, USA, 1996. [Google Scholar]
- Joseph, W.J. River Training structures and Secondary Channel Modifications. In U.S. Army Corps of Engineers, Rock Island District; Upper Mississippi River Restoration—Environmental Management Program’s (UMRR-EMP) Environmental Design Handbook: Rock Island, IL, USA, 2012. [Google Scholar]
- Martin, G.; Kurt, G.; Michael, T.; Liederman, M.; Habersack, H. Hydrodynamic and morphodynamic sensitivity of a river’s main channel to groyne geometry. J. Hydraul. Res. 2018, 56, 714–726. [Google Scholar]
- Zheng, J.; Lei, G.; Zhu, W.; Gu, Z.; Yu, Z. Comparative analysis of layout and structure of filter dam at Zhangjiawan of Zhougongdi waterway. Port Waterw. Eng. 2014, 3, 130–133. (In Chinese) [Google Scholar]
- Li, Y.; Ma, Y. Research on the Development of New Spur Dike Applied in the Taicang–Nantong Reach [R]; CCCC First Harbor Consultants Co Ltd.: Tianjin, China, 2014. (In Chinese) [Google Scholar]
- Liu, H. Ecological measures and technology prospect for trunk waterway management in the Yangtze River. Port Waterw Eng. 2016, 1, 114–118. (In Chinese) [Google Scholar]
- Chang, L.; Xu, B.; Xiao, Z.; Zhang, P. Experimental study on permeability characteristics of hollow trapezoidal block spur dike. Chin. J. Hydrodyn. 2019, 34, 103–109. (In Chinese) [Google Scholar]
- Milhous, R.T.; Wegner, D.L.; Waddle, T. User Guide to the Physical Habitat Simulation System (PHABSIM)[R]; Fish and Wildlife Service: Washington, DC, USA, 1984. [Google Scholar]
- Bovee, K.D. Development and Evaluation of Habitat Suitability Criteria for Use in the Instream Flow Incremental Methodology; Fish and Wildlife Service: Washington, DC, USA, 1986. [Google Scholar]
- McVicar, B.J.; Roy, A.G. Hydrodynamics of a forced riffle pool in a gravel bed river: 1. Mean velocity and turbulence intensity. Water Resour. Res. 2007, 43, W12401. [Google Scholar] [CrossRef]
- McVicar, B.J.; Roy, A.G. Hydrodynamics of a forced riffle pool in a gravel bed river: 2. Scale and structure of coherent turbulent events. Water Resour. Res. 2007, 43, W12402. [Google Scholar] [CrossRef]
- Liao, J.C.; Beal, D.N.; Lauder, G.V.; Triantafyllou, S.M. Fish Exploiting Vortices Decrease Muscle Activity. Science 2003, 302, 1566–1569. [Google Scholar] [CrossRef] [PubMed]
- Liao, J.C.; Beal, D.N.; Lauder, G.V.; Triantafyllou, M.S. The Karman gait: Novel body kinematics of rainbow trout swimming in a vortex street. J. Exp. Biol. 2003, 206, 1059–1073. [Google Scholar] [CrossRef] [PubMed]
- Smith, D.L.; Brannon, E.L.; Shafii, B.; Odeh, M. Use of the Average and Fluctuating Velocity Components for Estimation of Volitional Rainbow Trout Density. Trans. Am. Fish. Soc. 2006, 135, 431–441. [Google Scholar] [CrossRef]
- Smith, D.L.; Goodwin, R.A.; Nestler, J.M. Relating Turbulence and Fish Habitat: A New Approach for Management and Research. Rev. Fish. Sci. Aquac. 2014, 22, 123–130. [Google Scholar] [CrossRef]
- Enders, E.C.; Buffin, B.T.; Boisclair, D.; Roy, A.G. The feeding behavior of juvenile Atlantic salmon in relation to turbulent flow. J. Fish Biol. 2005, 66, 242–253. [Google Scholar] [CrossRef]
- Cotel, A.J.; Webb, P.W.; Tritico, H. Do brown trout choose locations with reduced turbulence? Trans. Am. Fish. Soc. 2006, 135, 610–619. [Google Scholar] [CrossRef]
- Tritico, H.M.; Cotel, A.J. The effects of turbulent eddies on the stability and critical swimming speed of creek chub (Semotilus atromaculatus). J. Exp. Biol. 2010, 213, 2284–2293. [Google Scholar] [CrossRef] [PubMed] [Green Version]
- Webb, P.W.; Cotel, A.J. Assessing possible effects of fish–culture systems on fish swimming: The role of stability in turbulent flows. Fish Physiol. Biochem. 2011, 37, 297–305. [Google Scholar] [CrossRef] [PubMed]
- Tullos, D.; Walter, C. Fish use of turbulence around wood in winter: Physical experiments on hydraulic variability and habitat selection by juvenile coho salmon, Oncorhynchus kisutch. Env. Biol. Fishes 2015, 98, 1339–1353. [Google Scholar] [CrossRef]
- Crowder, D.W.; Diplas, P. Using two-dimensional hydrodynamic models at scales of ecological importance. J. Hydrol. 2000, 230, 172–191. [Google Scholar] [CrossRef]
- Crowder, D.W.; Diplas, P. Vorticity and circulation: Spatial metrics for evaluating flow complexity in stream habitats. Can. J. Fish. Aquat. Sci. 2002, 59, 633–645. [Google Scholar] [CrossRef]
- Dong, Z.; Sun, Y. Principals and Technologies of Eco-Hydraulic Engineering; China Water & Power Press: Beijing, China, 2007; pp. 285–287. (In Chinese) [Google Scholar]
- Lu, Y.; Lu, Y.; Huang, T. Interim Report of Waterway Regulation Technology and Demonstration in Typical Ecological Protection reach of the Yangtze River; Nanjing Hydraulic Research Institute: Nanjing, China, 2018. (In Chinese) [Google Scholar]
- Chen, Y.; Liu, X.-D.; Wu, X.-Y.; Shi, G.-F. Distribution of schlegel's rockfish (Sebastes schlegeli Hilgendorf) in different artificial reef models. J. Dalian Fish. Univ. 2006, 21, 153–157. [Google Scholar]
- Shannon, C.E. A Mathematical Theory of Communication. Bell Syst. Tech. J. 1948, 27, 379–423. [Google Scholar] [CrossRef] [Green Version]
- Jaynes, E.T. Information Theory and Statistical Mechanics. Phys. Rev. 1957, 106, 620–630. [Google Scholar] [CrossRef]
- Margalef, R. La Teoría de la Información en Ecología. Memorias de la Real Academia de Cienciasy Artes de Barcelona 1957, 32, 373–449. (In Spanish) [Google Scholar]
- Enders, E.C.; Boisclair, D.; Roy, A.G. The effect of turbulence on the cost of swimming for juvenile Atlantic salmon (Salmo salar). Can. J. Fish. Aquat. Sci. 2003, 60, 1149–1160. [Google Scholar] [CrossRef]
- Lohrmann, A.; Hackett, B.; Røed, L.P. High Resolution Measurements of Turbulence, Velocity and Stress Using a Pulse-to-Pulse Coherent Sonar. J. Atmos. Ocean. Technol. 1990, 7, 19–37. [Google Scholar] [CrossRef] [Green Version]
- Lu, Y.; Lueck, R.G. Using a Broadband ADCP in a Tidal Channel. Part II: Turbulence. J. Atmos. Ocean. Technol. 1999, 16, 1568–1579. [Google Scholar] [CrossRef]
- Li, G.; Xu, H.; Gao, Y.; Song, D.; Zhu, Z.; Zhao, J. Flood Control Evaluation of the Second Phase of Waterway Regulation of Dongliu Reach Downstream of the Yangtze River; Nanjing Hydraulic Research Institute: Nanjing, China, 2011. (In Chinese) [Google Scholar]
- Li, S.; Xiong, F.; Wang, G.; Duan, X.; Liu, S.; Chen, D. Effect of Tetrahedron Permeable Frames on the Community Structure of Benthic Macroinvertebrates in the Middle Yangtze River. J. Hydroecol. 2015, 36, 72–79. (In Chinese) [Google Scholar]
- Guo, J.; Wang, K.; Duan, X.; Chen, D.; Fang, D.; Liu, S. Effect of Tetrapod Clusters on Fish Assemblage in Channel Improvement Projects. J. Hydroecology 2015, 36, 29–35. (In Chinese) [Google Scholar]
- Seaman, J.W. Artificial Reef Evaluation with Application to Natural Marine Habitats; CRC Press: New York, NY, 2000. [Google Scholar]
Figure 1.
Test layout: (a) experimental layout of the rock-fill spur dike and the permeable spur dike, (b) test layout of the w-shaped rock-fill spur dike and the w-shaped permeable spur dike and (c) pictures of spur dikes. The unit in the figure is m. The grid points around the spur dike are the measurement points.

Figure 2.
Hydrodynamic distribution of permeable spur dike and rock-fill spur dike (flow velocity is 0.18 m3/s, water depth is 0.60 m; flow direction is from left to right, distance unit in the figure is m, same as below); (a) Average flow velocity distribution of permeable spur dike; (b) Average flow velocity distribution of rock-fill spur dike; (c) The turbulent kinetic energy distribution of permeable spur dike; (d) The turbulent kinetic energy distribution of rock-fill spur dike .

Figure 3.
Hydrodynamic distribution of w-shaped permeable spur dike and rock-fill spur dike and aggregation of test fish (flow velocity is 0.20 m3/s, water depth is 0.40 m). (a) Average flow velocity distribution of w-shaped permeable spur dike; (b) Average flow velocity distribution of w-shaped rock-fill spur dike; (c) The turbulent kinetic energy distribution of w-shaped permeable spur dike; (d) The turbulent kinetic energy distribution of w-shaped rock-fill spur dike.

Figure 4.
Regional ratio of velocity and turbulent kinetic energy (flow condition is the same as Figure 2 and Figure 3).

Figure 5.
Aggregation of test fish of permeable spur dike and rock-fill spur dike (flow velocity is 0.18 m3/s, water depth is 0.60 m; “” represents fish location, flow direction is from left to right, distance unit in the figure is m, same as below). (a) Test fish distribution of permeable spur dike; (b) Test fish distribution of rock-fill spur dike.

Figure 6.
Aggregation of test fish of w-shaped permeable and rock-fill spur dikes (flow velocity is 0.20 m3/s, water depth is 0.40 m). (a) Test fish distribution of w-shaped permeable spur dike; (b) Test fish distribution of w-shaped rock-fill spur dike.
Figure 6.
Aggregation of test fish of w-shaped permeable and rock-fill spur dikes (flow velocity is 0.20 m3/s, water depth is 0.40 m). (a) Test fish distribution of w-shaped permeable spur dike; (b) Test fish distribution of w-shaped rock-fill spur dike.

Figure 7.
Relationship between water flow diversity and average aggregation rate.

Figure 8.
Fish-bone dike Project at Laohutan of the Dongliu reach Waterway.


Table 1.
Test conditions and water flow diversity.
| Spur Dikes | Q (L/s) | H (m) | U(m/s) Min–Average–Max | Min–Average–Max | HF | AAR (%) |
|---|---|---|---|---|---|---|
| rock-fill spur dike | 0.12 | 0.60 | 0–0.09–0.14 | 0.2–2.1–6.6 | 1.25 | 20 |
| 0.18 | 0.60 | 0–0.13–0.18 | 0.0–2.9–12.5 | 1.13 | 5 | |
| 0.24 | 0.60 | 0–0.18–0.25 | 0.0–5.2–24.0 | 1.19 | 16 | |
| permeable spur dike | 0.12 | 0.60 | 0–0.08–0.11 | 1.0–1.8–4.9 | 2.21 | 20 |
| 0.18 | 0.60 | 0–0.12–0.16 | 0.8–3.0–8.8 | 2.05 | 13 | |
| 0.24 | 0.60 | 0–0.17–0.24 | 0.9–5.2–13.9 | 2.89 | 28 | |
| w-shaped rock-fill spur dike | 0.18 | 0.35 | 0–0.21–0.46 | 0–19.4–84.5 | 2.86 | 23 |
| 0.20 | 0.40 | 0–0.19–0.48 | 0–12.1–70.3 | 2.17 | 27 | |
| w-shaped permeable spur dike | 0.18 | 0.35 | 0.01–0.18–0.31 | 1.6–8.5–58.1 | 3.07 | 29 |
| 0.20 | 0.40 | 0.04–0.17–0.30 | 1.4–7.0–39.5 | 2.68 | 27 |
© 2019 by the authors. Licensee MDPI, Basel, Switzerland. This article is an open access article distributed under the terms and conditions of the Creative Commons Attribution (CC BY) license (http://creativecommons.org/licenses/by/4.0/).
Share and Cite
MDPI and ACS Style
Huang, T.; Lu, Y.; Liu, H. Effects of Spur Dikes on Water Flow Diversity and Fish Aggregation. Water 2019, 11, 1822. https://doi.org/10.3390/w11091822
AMA Style
Huang T, Lu Y, Liu H. Effects of Spur Dikes on Water Flow Diversity and Fish Aggregation. Water. 2019; 11(9):1822. https://doi.org/10.3390/w11091822
Chicago/Turabian StyleHuang, Tingjie, Yan Lu, and Huaixiang Liu. 2019. "Effects of Spur Dikes on Water Flow Diversity and Fish Aggregation" Water 11, no. 9: 1822. https://doi.org/10.3390/w11091822
Note that from the first issue of 2016, this journal uses article numbers instead of page numbers. See further details here.