Comparisons of Local Scouring for Submerged Square and Circular Cross-Section Piles in Steady Currents

College of Engineering Ocean University of China, Qingdao 266100, China
*
Author to whom correspondence should be addressed.
Water 2019, 11(9), 1820; https://doi.org/10.3390/w11091820
Submission received: 12 July 2019
/
Revised: 27 August 2019
/
Accepted: 29 August 2019
/
Published: 31 August 2019
(This article belongs to the Section Hydraulics and Hydrodynamics)
Abstract
:The local scouring that occurs around submerged vertical piles in steady currents was studied experimentally in this paper. Three experiments were carried out for square cross-section (SC) piles and a circular cross-section (CC) pile with the same width. The key point scour depths, including the center of the upstream boundary point (KC) and the two upstream corners (KM), were observed over time. The two-dimensional profiles and the three-dimensional topography around each pile were measured using a Seatek. The different scouring characteristics of the SC and CC piles were investigated. The experiment results show that the scour depth at KC is much smaller than that of KM. The equilibrium scour depth of the CC pile is far less than that of the SC piles. The scour and deposition distributions were different between the CC and SC piles. The maximum scour depth was found at the lateral rear of the CC pile, and the maximum deposition was observed in sections of the SC piles. The evolutions of the scour depths at KM are predicted using a developed exponential equation.
1. Introduction
Local scouring is a morphodynamic process generated by the presence of the obstacles in currents, waves, or currents plus waves. As it is an interdisciplinary subject, research studies are usually based on the theories of hydraulic and sediments transport in literature, such as [1,2,3,4,5]. In the hydraulic engineering of bridge piers and subsea structures, local scouring is a hidden danger that affects the safe or normal use of such structures. Unsubmerged bridge piers and submerged pipelines in offshore engineering projects have been studied extensively [6,7,8,9,10,11]. Nevertheless, reports on the local scouring of submerged piles, especially in clear-water scour conditions, are rare. Tsutsui [12] found that an arch-shaped reverse flow and a separation bubble occur on the top of the submerged pile, but no vortex street appears in the wake when the pile height-to-width ratio is smaller than 1. The absence of an anti-clockwise damming in front of the submerged pile, along with additional water down wash on the side and behind the submerged pile, will change the horseshoe and wake vortex significantly. Thus, the main dynamics of sediment transport, including the horseshoe vortex, concentrated streamlines, and wake vortex will be changed [13]. Dey et al. [14] conducted a series of experiments to study the influences of circular cross-section (CC) pile submergence on the scour depth under clear-water scour conditions. They stated that the horseshoe vortex circulations and scour depth decrease with an increase in submergence. Using experiment and numerical methods, Zhao et al. [15] investigated the submerged vertical CC piles under live-bed scour conditions. Their experiments demonstrated that the scour depth is related to the pile height hc. When the pile height-to-width ratio hc/D exceeds 2, the scour depth will be independent from hc. By comparing the flow fields of hc/D = 0.5 and hc/D = 2.5, they found that the horseshoe vortex in front of the pile and the near-bed shear stress around the longer pile are stronger and wider in size, respectively. Moreover, there is an absence of vortex shedding for the shorter pile of hc/D = 0.5. For the square cross-section (SC) piles, Zhao et al. [13] observed that the scouring always starts at the two corners of the pile, and the bed level at the center of the upstream boundary remains almost unchanged before the scour pits extend there. Sarkar and Ratha [16] investigated the local scouring of non-uniform sediment beds around submerged CC and SC piles experimentally, but did not compare the different characteristics of the two pile shapes. Yao et al. [17] provided a relatively systematic report under live-bed scour conditions by carrying out a number of experiments. They found that the height-to-width ratio hc/D has a significant effect on the equilibrium scour depth and equilibrium time scale for the SC piles when hc/D is smaller than 4. Under their clear-water conditions, the Shields number was slightly smaller than the critical Shields number. The equilibrium time scale was found to reduce with an increase in the height-to-width ratio. Since the widths were not the same for the CC and SC piles, comparisons of the CC and SC piles were mainly conducted on the equilibrium time scale. Owing to the high flow intensity of the Shields number, the distributions of scouring and deposition for the two pile shapes did not show clear differences. Euler and Herget [18] stated that the size of the submerged piles and the approach flow velocity have significant effects on the scour hole shape and depth.
Motivated by (i) the necessity of further research into the local scouring of submerged vertical piles, (ii) the significant effect of the flow intensity and pile height on local scouring, and (iii) a lack of comparisons between CC and SC piles, in this study, three experiments were conducted to determine the local scouring of two representative SC piles and one CC pile. Emphasis was given to the evolutions of the key points of the scour depths, bed profile elevations, scour and deposition distributions, and streamlines around the piles.
2. Methodology
2.1. Experimental Tests
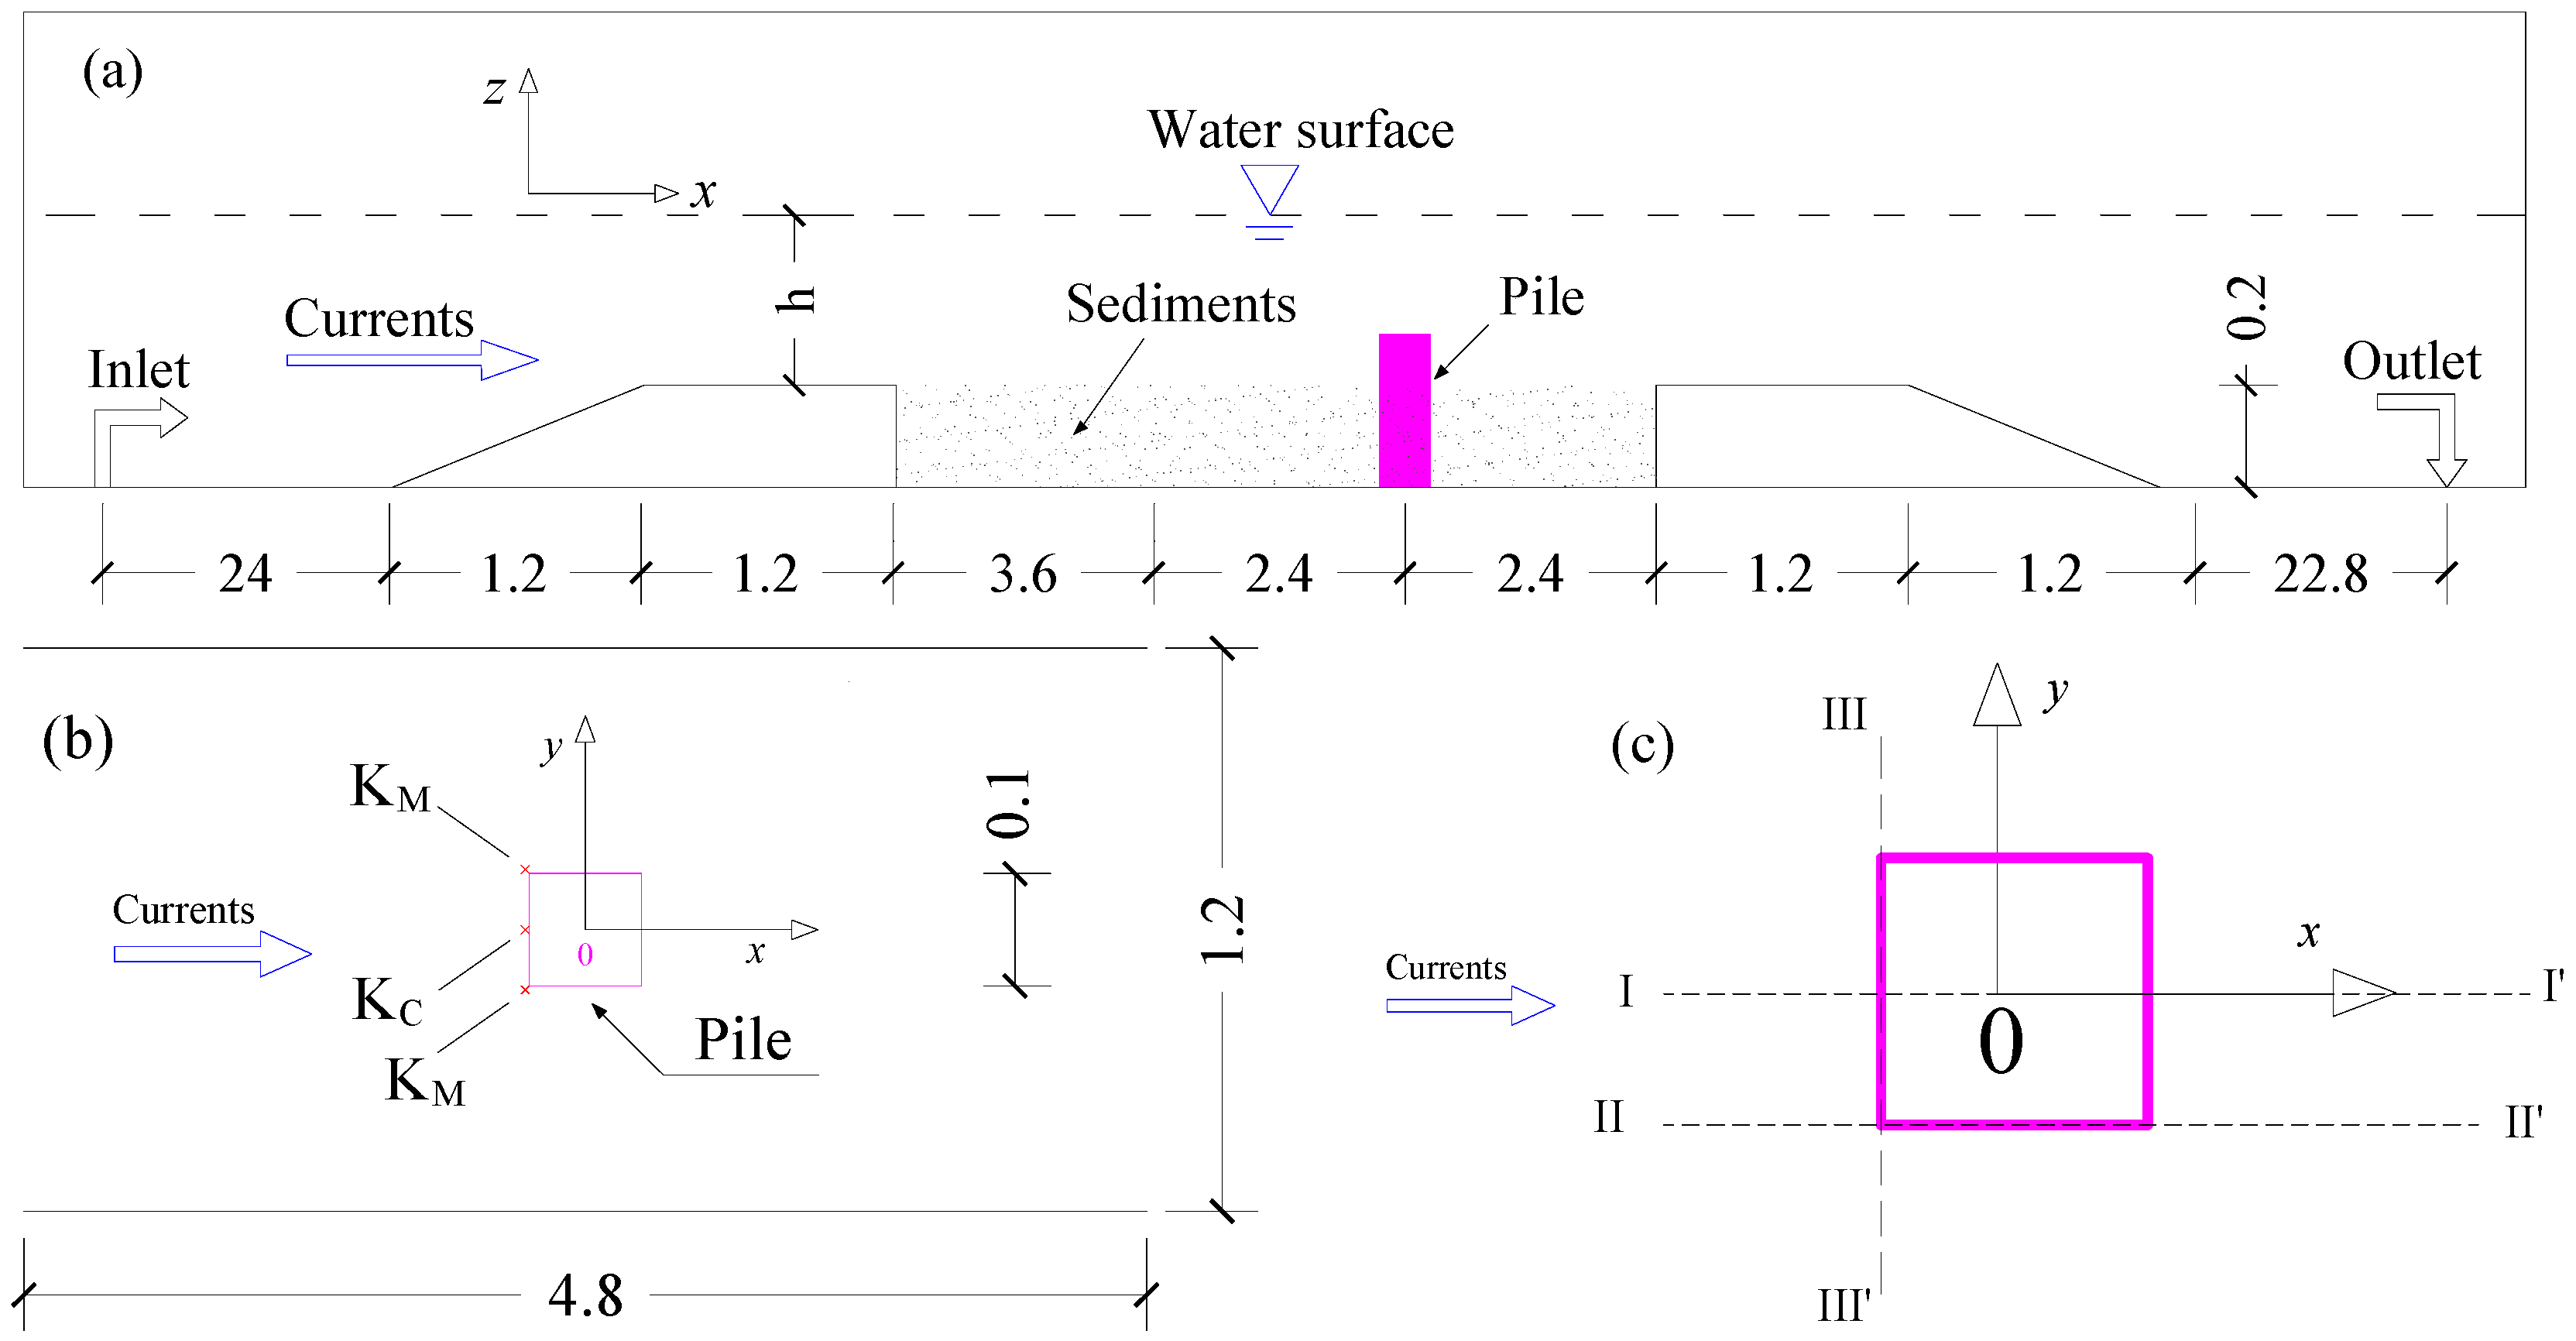
The experiments were conducted in a water flume that was 60 m long, 1.2 m wide, and 1.5 m deep in the Hydraulic Modeling Laboratory at ShanDong JiaoTong University, China. The open channel flume is equipped with a pump with a capacity of 0.64 m3/s. The currents were pumped from left to right and circled the pipeline. The test section was in the middle of the flume, as shown in Figure 1a. A slope of 1:6 was designed to decrease the unsteadiness of the flow when it was pumped. The test section was 8.4 m long, 1.2 m wide, and 0.2 m in height with a 7.2 m sediment bed in front of the pile to provide a stable boundary layer. As is seen in Figure 1b, a coordinate system, whose origin was in the center of the model, was established. The upstream corner point (KM) and upstream symmetry center point (KC) were defined, too. To avoid the contraction effect, the pile width was designed for less than 10% of the flume width [19]. In the process of the experimental tests, the bed profiles in Figure 1c were measured.
Only one type of sediment particle was used in this study. The median grain size d50 was 0.65 mm, and the uniformity parameter σg was . The ratio of sediment grain density to water density S is 2.65, and the porosity is 0.4. Calculated using the equation from [20], the angle of the static repose is 36°. Two SC piles and one CC pile with an outer diameter of D = 10 cm were used in the experiments. All the piles were made of acrylic block materials. Each pile was embedded into the bottom of the flume bed such that it would remain stable when testing. The pile height was defined as the height above the sediment bed.
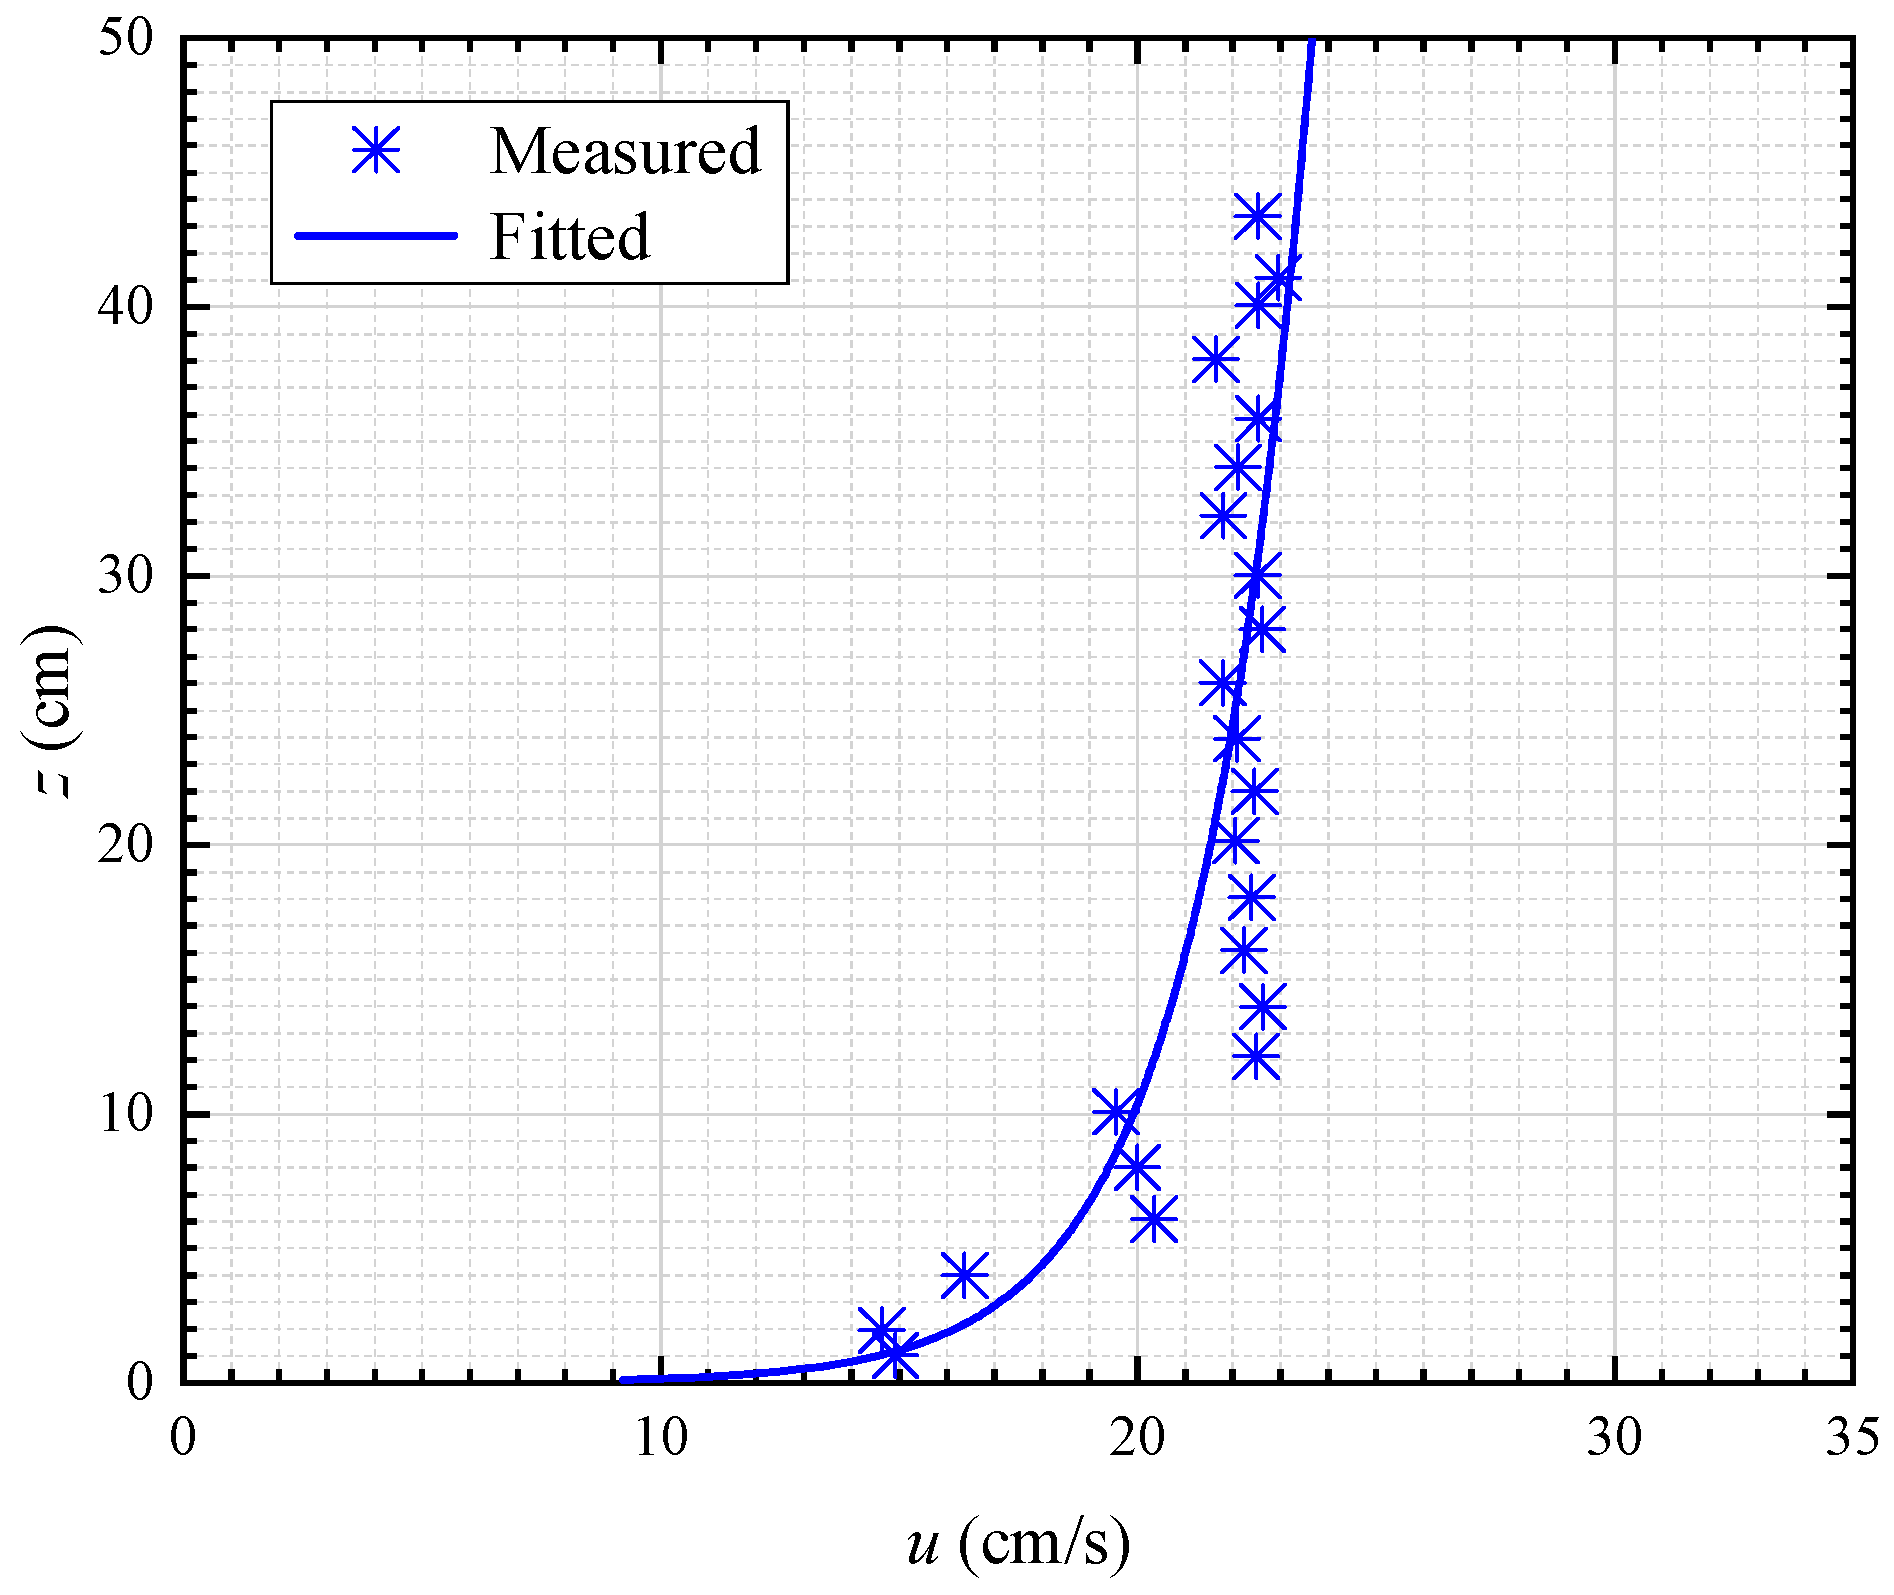
Before the local scour experiments started, the velocity distributions were measured using a Nortek Vectrino II Acoustic Doppler Velocimeter (ADV) along the flow depth at the position where the models would be set. The ADV can measure velocities 5 cm below the probe. After the approach velocity was observed to be stable based on the interface of the ADV-related software, all the data in Figure 2 were averaged for a period of 5 min with a sampling frequency of 20. All the tests were conducted with the same pump frequency and the same flow depth of h = 50 cm. The key points of the scour depths were measured using the distance function of the ADV. Bed profiles and topography around the piles were measured using a Seatek with an accuracy of ±0.1 mm. A Seatek is a topographic measuring instrument with 32 transducers that could work in water. The measurements were conducted without draining out the water. This avoided a sediment backfill effect when measuring the scour depths. The parameters used in the three tests are summarized in Table 1. The flow intensity used in this study is the Shields number θ, which is a non-dimensional bed shear stress proposed by Shields in 1936, and can be calculated with Equation (1). The critical Shields parameter was calculated using the improved Equation (2) by [5]. For sediment transport, the bed shear stress was calculated using Equation (3) by [5]. The flow velocity measured along the flow depth could be fitted as a logarithmic law using Equation (4). Since the approaching flow was not observed to mobilize the sediment particles, the total bed shear stress, which equals the bed shear stress, is related to the skin friction. The boundary layer thickness δ is defined as 99%Vmax, with Vmax being the velocity at the top of the water surface. Based on the velocity distributions (Figure 2), such thickness is observed to be within a range of 40 to 46 cm. In this study, its averaged value of 43 cm is applied as the boundary layer thickness.
where is the bed shear stress, is the friction velocity, is the sediment density, ρ is the flow density, g is acceleration from gravity, and is the median sediment particle size.
where is the non-dimensional sediment particle size, ν is the kinematic viscosity of water, and is the specific gravity of the sediment.
where is the skin friction produced by the sediment particles, is the form drag produced by the pressure field associated with the flow over the ripples and/or larger features on the bed, and is the sediment transport contribution, which is caused by the momentum transfer used to mobilize the particles.
where is the friction velocity, is the shear stress with , h is the water depth, z is the distance upon the sediment bed, is the Nikurase roughness, is the roughness height related to the skin friction, is the skin Nikuradse roughness, and κ is the von Kármán constant.
The experiment parameters are listed in Table 2. The structures for tests 1 and 2 are SC piles with heights hc of 10 and 20 cm, whereas test 3 is a CC pile with a height of 10 cm. During the three tests, scour depths at KM and KC were observed. In accordance with [13], the maximum scour depths throughout the tests were found at the upstream corners of the piles. As the local scour depth evolution is asymptotic [6], the tests were stopped when dM and dC grew only slightly. In addition, the scour depths in Table 2 are considered the equilibrium scour depths. To avoid an incompleteness of the scour process, a criterion for the equilibrium of the scour should be established. Unfortunately, despite years of research into unsubmerged piles, a unified standard for such experiments has yet to be developed. To guarantee that all tests would attain equilibria, the maximum scour depth and bed profile around the pile were observed throughout the experiments. When the changes were less than 1D% for 3 h, the equilibrium was considered to be reached.
2.2. Uncertainties in Measurements
Experimental uncertainty includes random uncertainty and systematic (bias) uncertainty [21]. Random uncertainties are related to inherent random variations in a physical process [22]. Systematic uncertainties are inevitable, and will create an unknown bias in the tests. According to Coleman and Steele [23], the random standard uncertainty can be calculated by Equation (6). As is stated by [22], the effect of systematic uncertainty on the uncertainty of the response variable of interest must be obtained through uncertainty propagation. The combinations of the random and systematic uncertainties are in the form of Equation (7):
where is the standard deviation of the measured quantity over N repeated tests.
The random standard uncertainties for velocity measured at each point are presented in Appendix A. The maximum and minimum of are calculated as 2.43 × 10⁻³ at z = 1.03 cm and 6.60 × 10⁻⁴ at z = 40.06 cm separately. The accuracies of ADV distance and velocity measurements are ±0.1 mm and ±0.1 mm/s. As the smallest distance between the ADV probe and the sediments bed in velocity measurement was 1.06 cm with an averaged velocity of 14.93 cm/s, the maximum errors of distance and velocity are 0.94% and 0.1%. Thus, the systematic errors are neglected, and is thought to be equal to . The Nikurase roughness in Equation (4) obtained from Figure 2 is 0.06 cm, which is a little smaller than the medium sediment particle size , and indicates that the total error of is −7.7%. Since scouring depths at points KM and KC were measured by ADV, their errors are ±0.1 mm. The maximum systematic error from the smallest scouring depth in test 3 is ±10%, as shown in Table 2. It is considered that the sizes of sediment particles will have an effect on scouring depths measurements. When they are assumed to be spherical, it is identical to say that the measured values of scouring depths included an error of its diameter. At this point, the maximum systematic error of scouring depth is 65%. However, the equilibrium scouring depths of and in Table 2 were the maximum scouring depths measured in test 3, so as to present the most disadvantageous situation in local scouring.
3. Results and Discussion
3.1. Key Points Scour Depths Evolutions
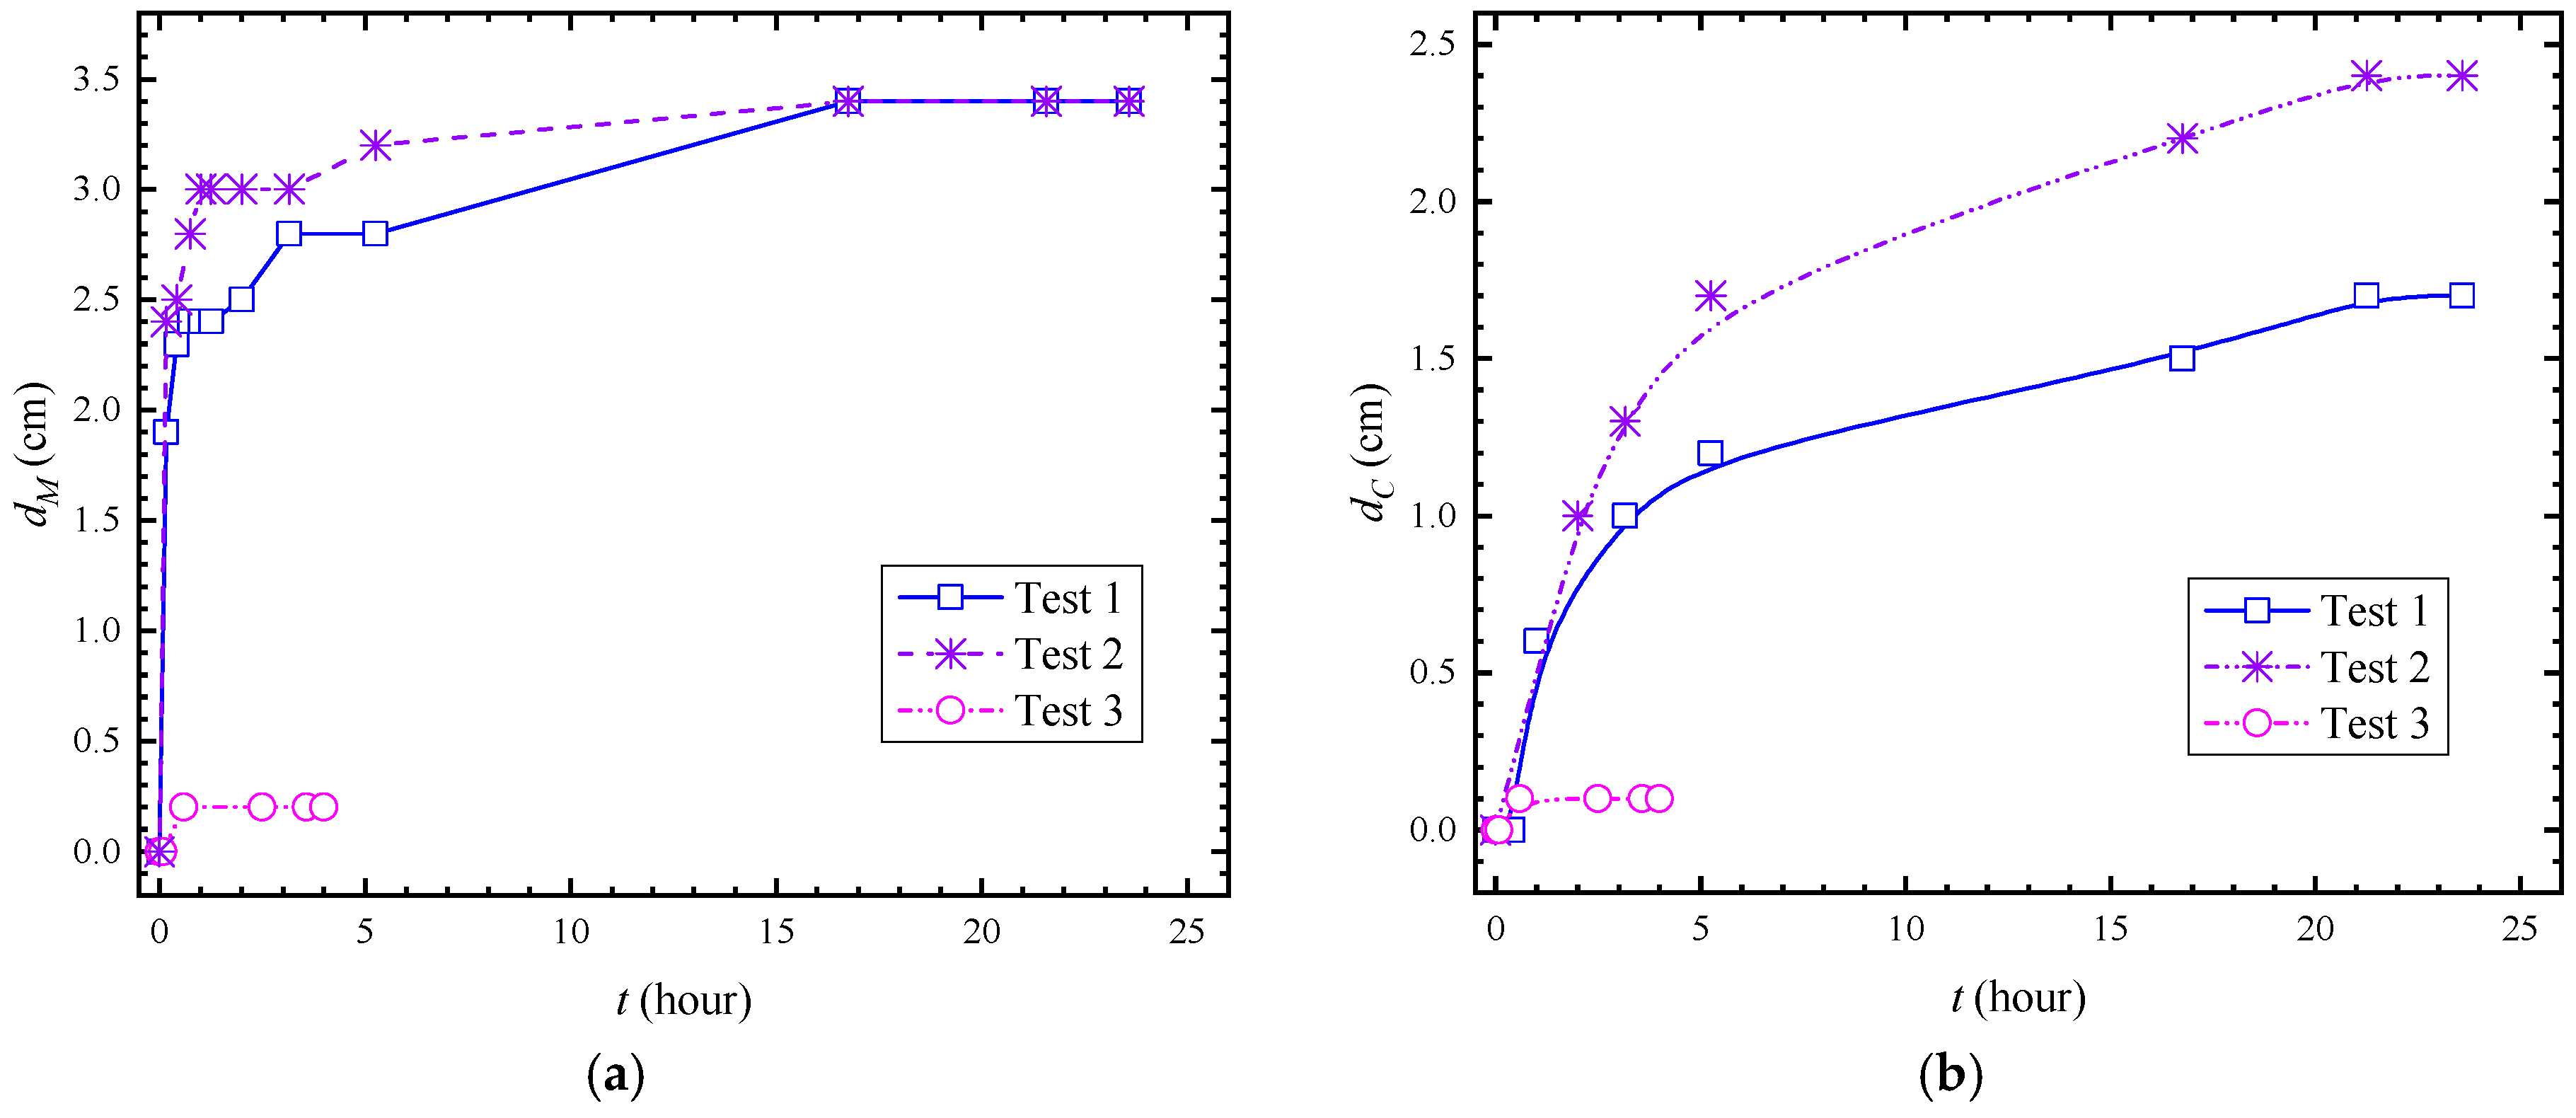
Under live-bed scour conditions, the maximum scour depth is often observed at the center of the symmetry pile [15,16,17]. Under clear-water scouring conditions, the maximum scour depth has usually occurred at the two upstream corners [13,18,24]. Knowing this, the evolutions of the key point scour depths (scour depths at KM and KC) were studied. As shown in Figure 3a, the averaged scour depths of the two upstream corners for the three piles increased rapidly in the first hour. Then, the scouring rate gradually slowed down. Finally, after 16 h of scouring for the SC piles (tests 1 and 2), the scour depth was kept at a constant value. The scour depths for the CC pile (test 3) in Figure 3a,b show a far smaller value compared to the SC piles. The three phases of the scour evolutions are in accord with those by [25]. However, due to the small scour depth, it is not obvious for the scour depth of the CC pile. This indicates that the more streamlined shape of the CC pile will be scoured far less than that of the piles with sharp corners. It should be noted that the maximum scour depths for the two SC piles in Figure 3a are the same at 3.4 cm, whereas the KC scour depth for the higher SC pile (test 2) is 41% larger than that of the shorter SC pile (test 1).
The equilibrium time scale of the CC pile is far smaller than that of the SC pile, although the smallest was found for the SC piles under the live-bed scour conditions described by [17]. This indicates that the regulations are extremely different between clear-water scouring and live-bed scouring. As shown in Figure 3a,b, deeper scour depths, which would induce larger scour holes, were found in the SC pile tests. More sediment particles need to be transported from scour holes, and thus more time was needed. It is known that under clear-water scour conditions, no supplements of the sediment particles were transported into the scour hole around the pile [6]. This was in accord with the observations in the process of local scouring tests in this paper. Although the bluntness factors defined in [26] were not initially part of our experiment, they were found to have effects on decreasing the scour depths at KC when the pile cross-sections varied from a flat-nose square pile to circular-nose pile by [27]. The mechanisms of scour depths at KC (Figure 3b) for the SC pile and CC pile given by [28] were worth mentioning here. With large eddy simulations of three-dimensional flow around the SC and CC piles, they found that the downflow along the vertical line upstream of the pile and the domains of the horseshoe vortex for the SC pile were greater and larger than that of the CC pile.
3.2. Formula Fitting
Similar to local scouring of the vertical piles in unsubmerged cases, the scour depth evolutions curves in Figure 3a,b appear to be asymptotic. To predict the scour depths over time, exponential functions were adopted, as described in the following section.
Sumer and Fredsøe [8] used Equation (8) to estimate the development of the scour depth at KC in an infinite CC pile. The least equilibrium scour time for the three tests is calculated for T = 2.25 h with Equation (9). It can be observed from Figure 3a,b that the equilibrium time for test 3 (CC pile) is approximately 0.5 h, whereas the SC piles of tests 1 and 2 are within a range of 5 to 16 h. According to Equation (8), it takes approximately 1.33 h for the scour depth to attain 95%dse. This is more applicable to the CC pile than the SC piles applied in this study.
where is the equilibrium scour depth, is the time scale of the scouring, is the non-dimensional time scale of the scouring, is the Shields parameter from skin friction, is the friction velocity associated with skin friction, is the shear stress from the skin friction, and δ is the boundary layer thickness.
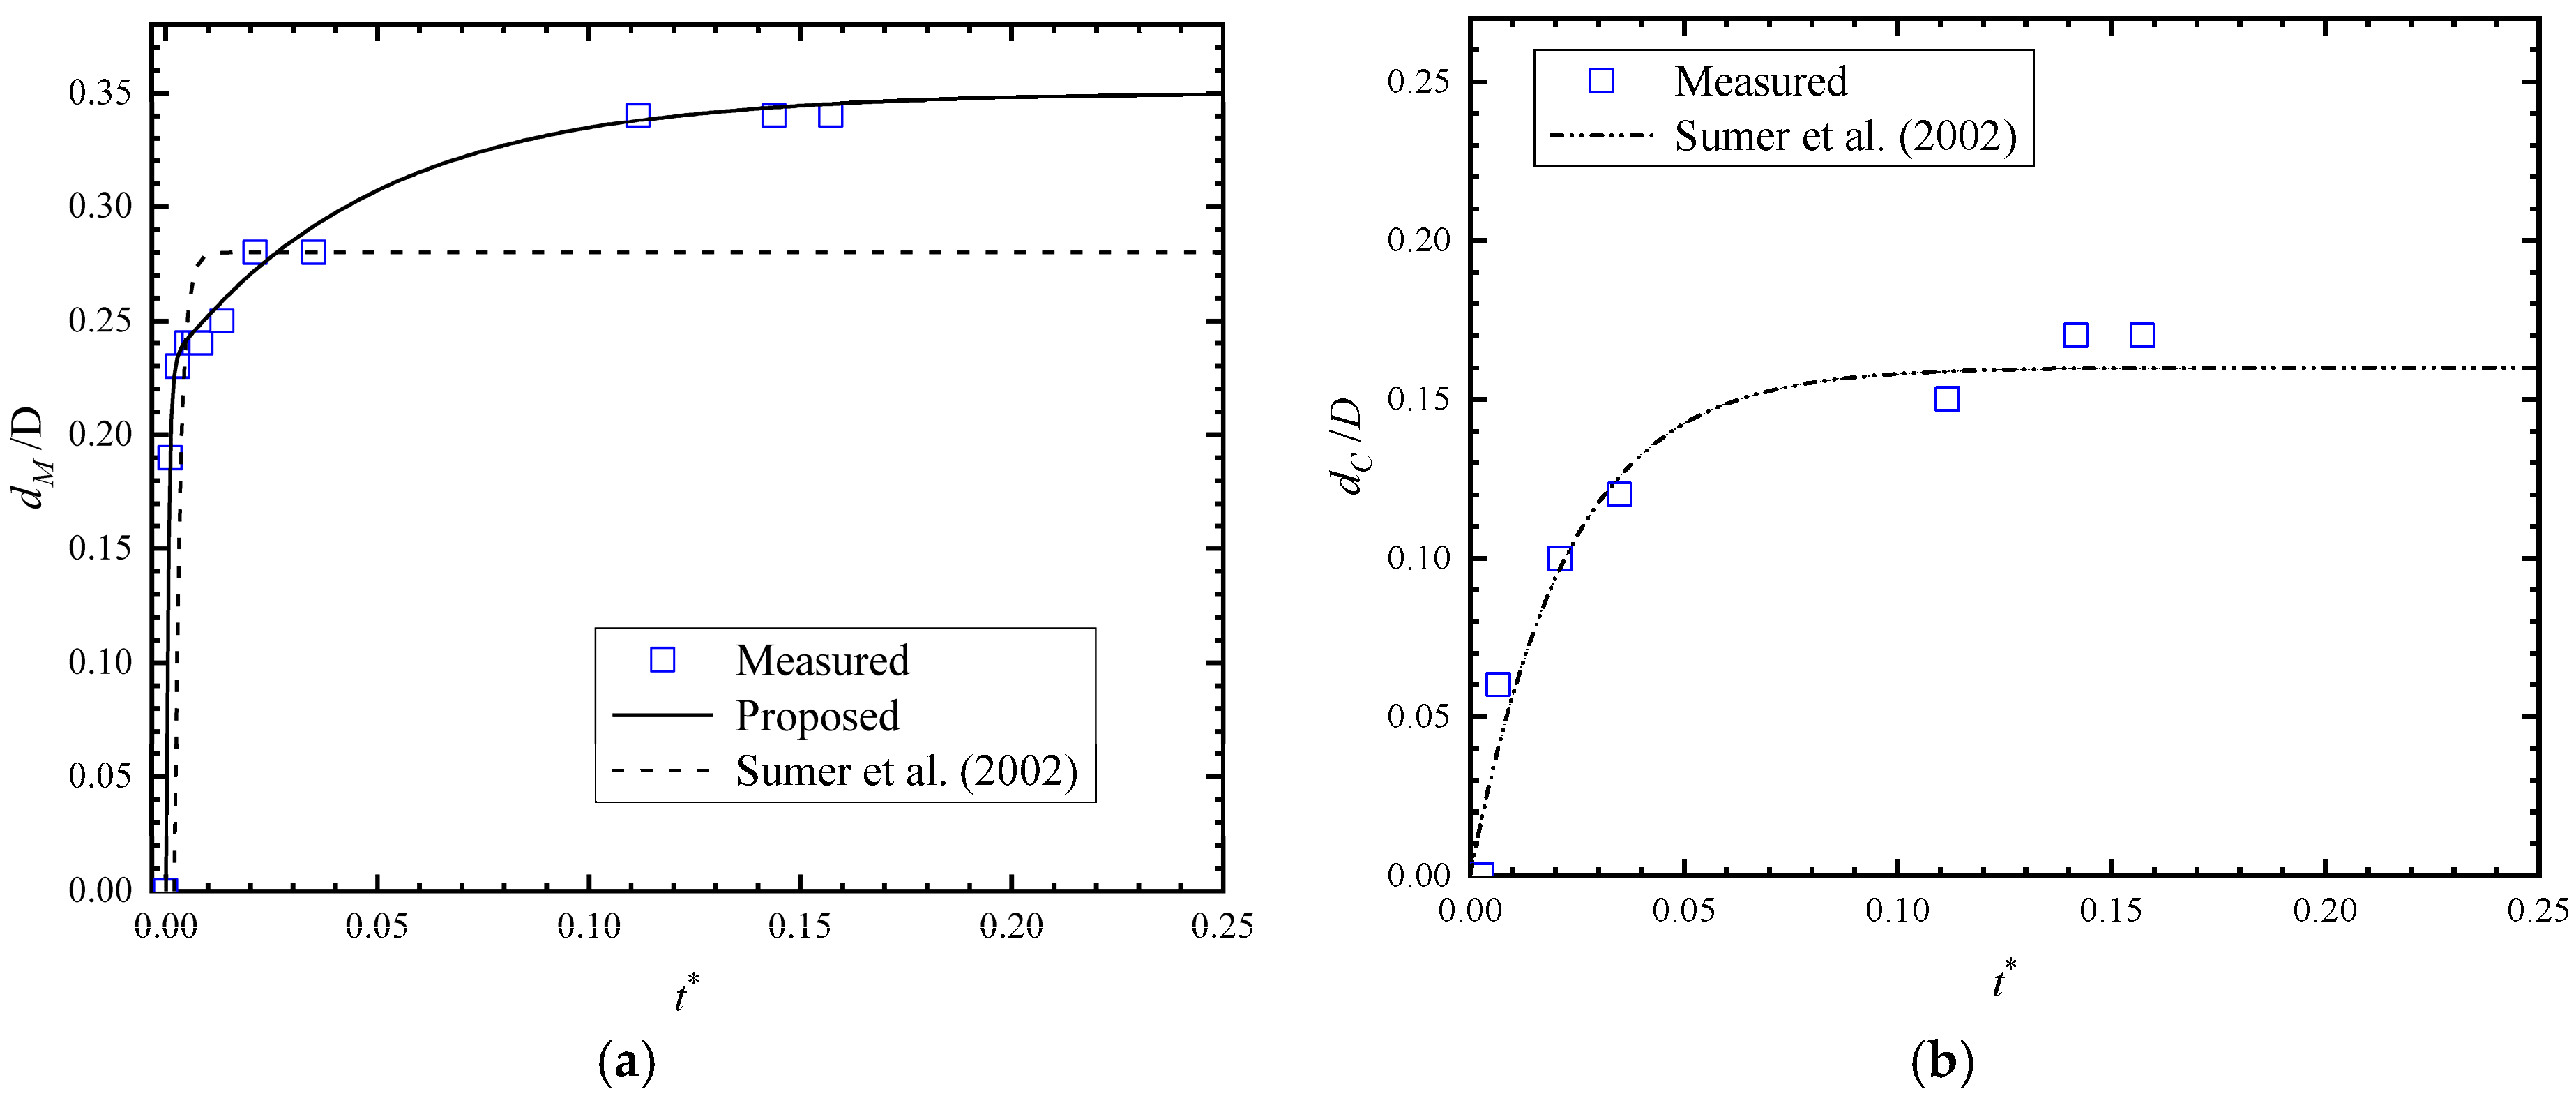
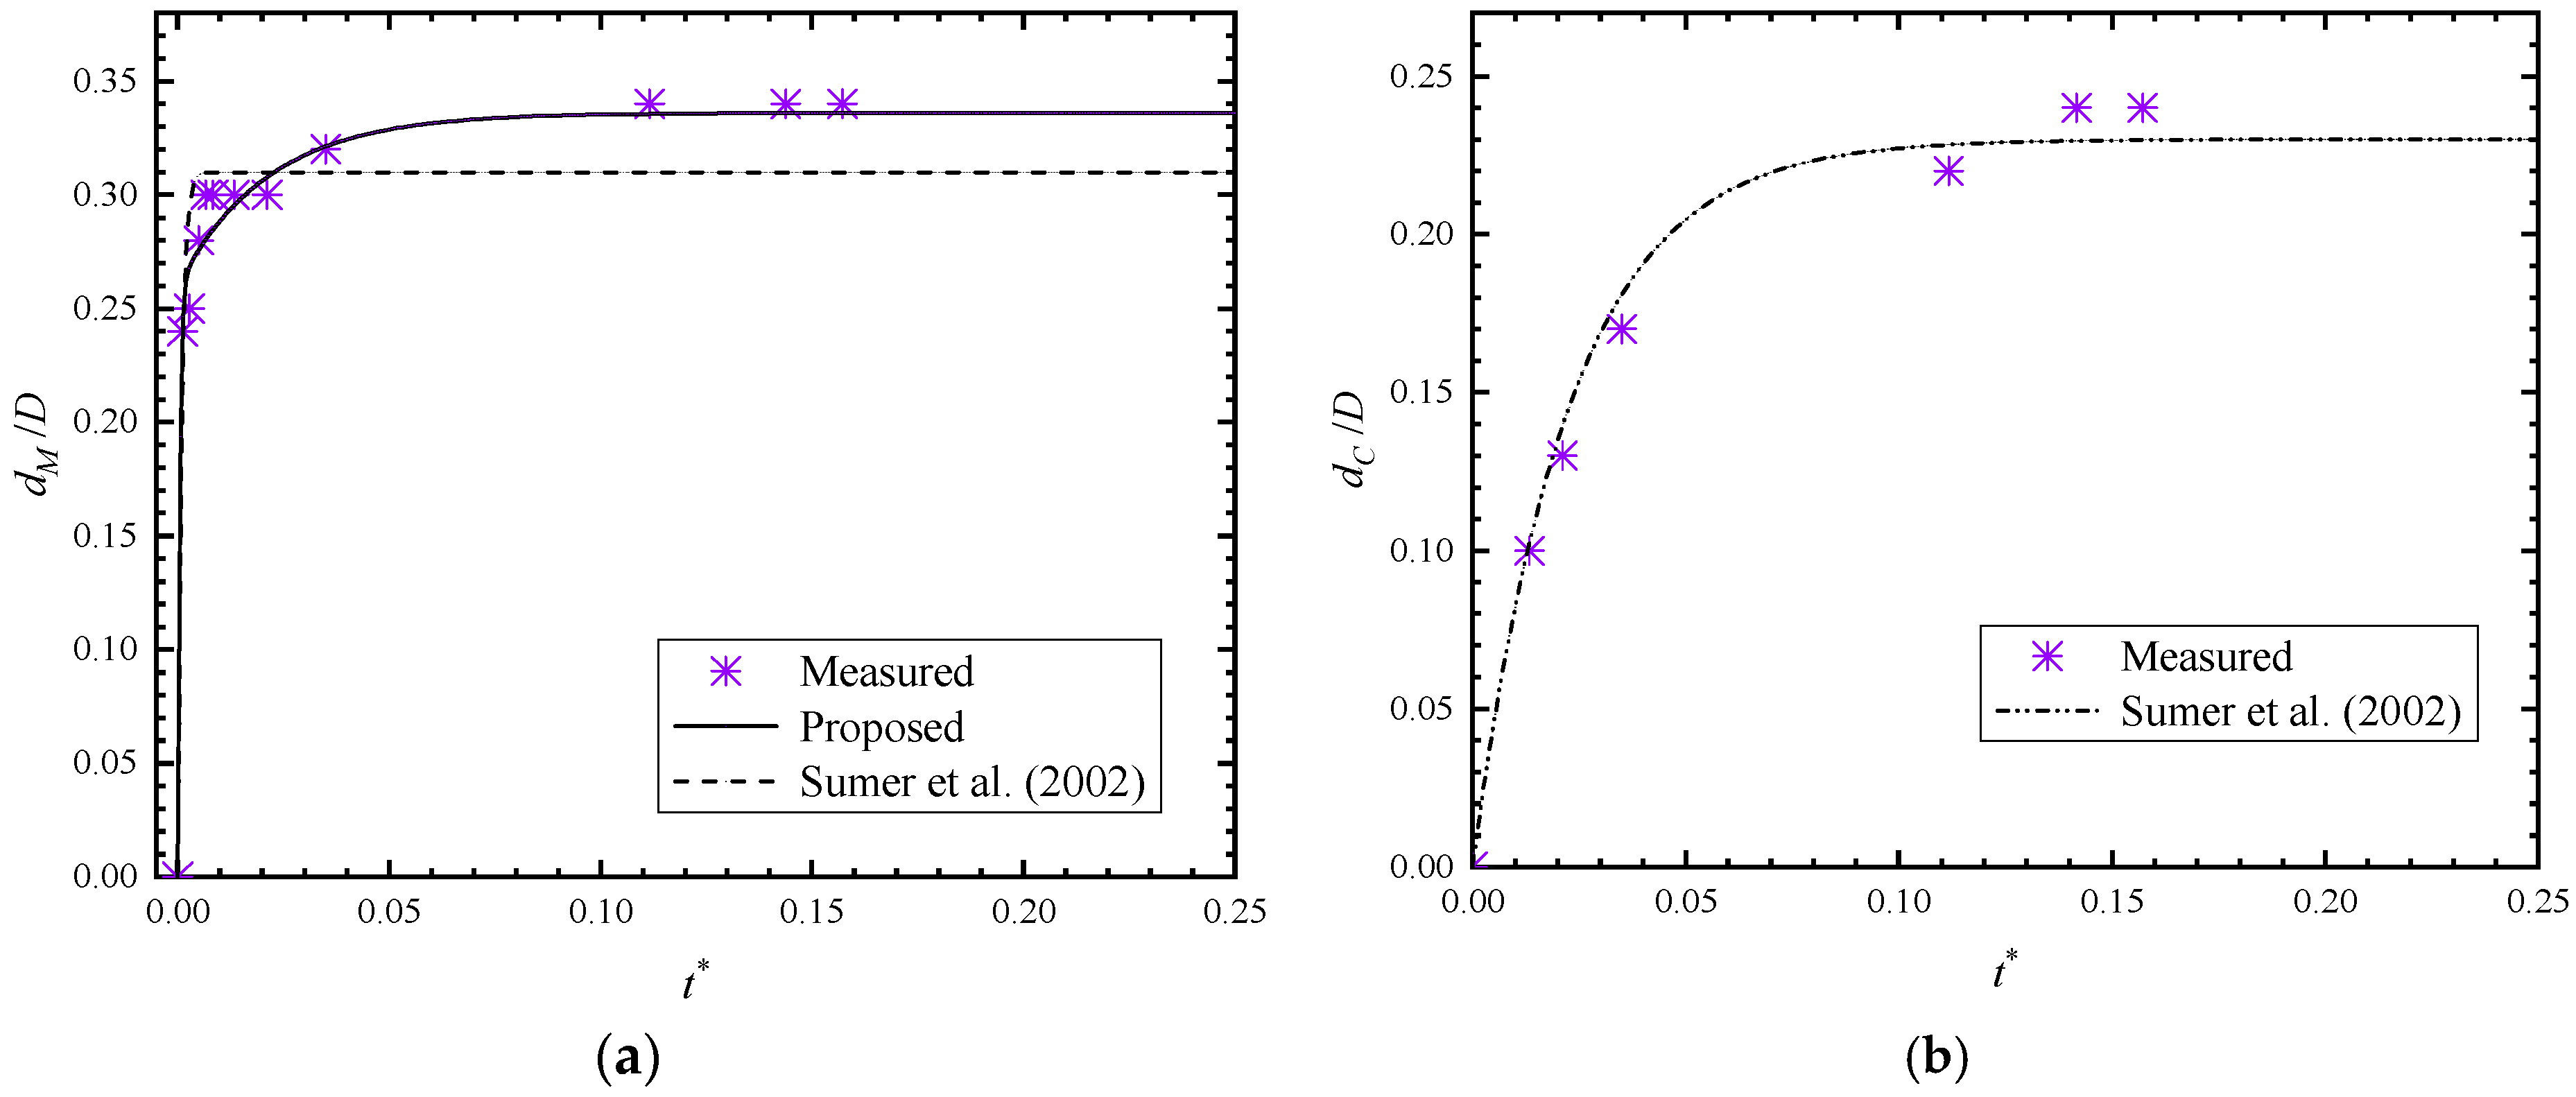
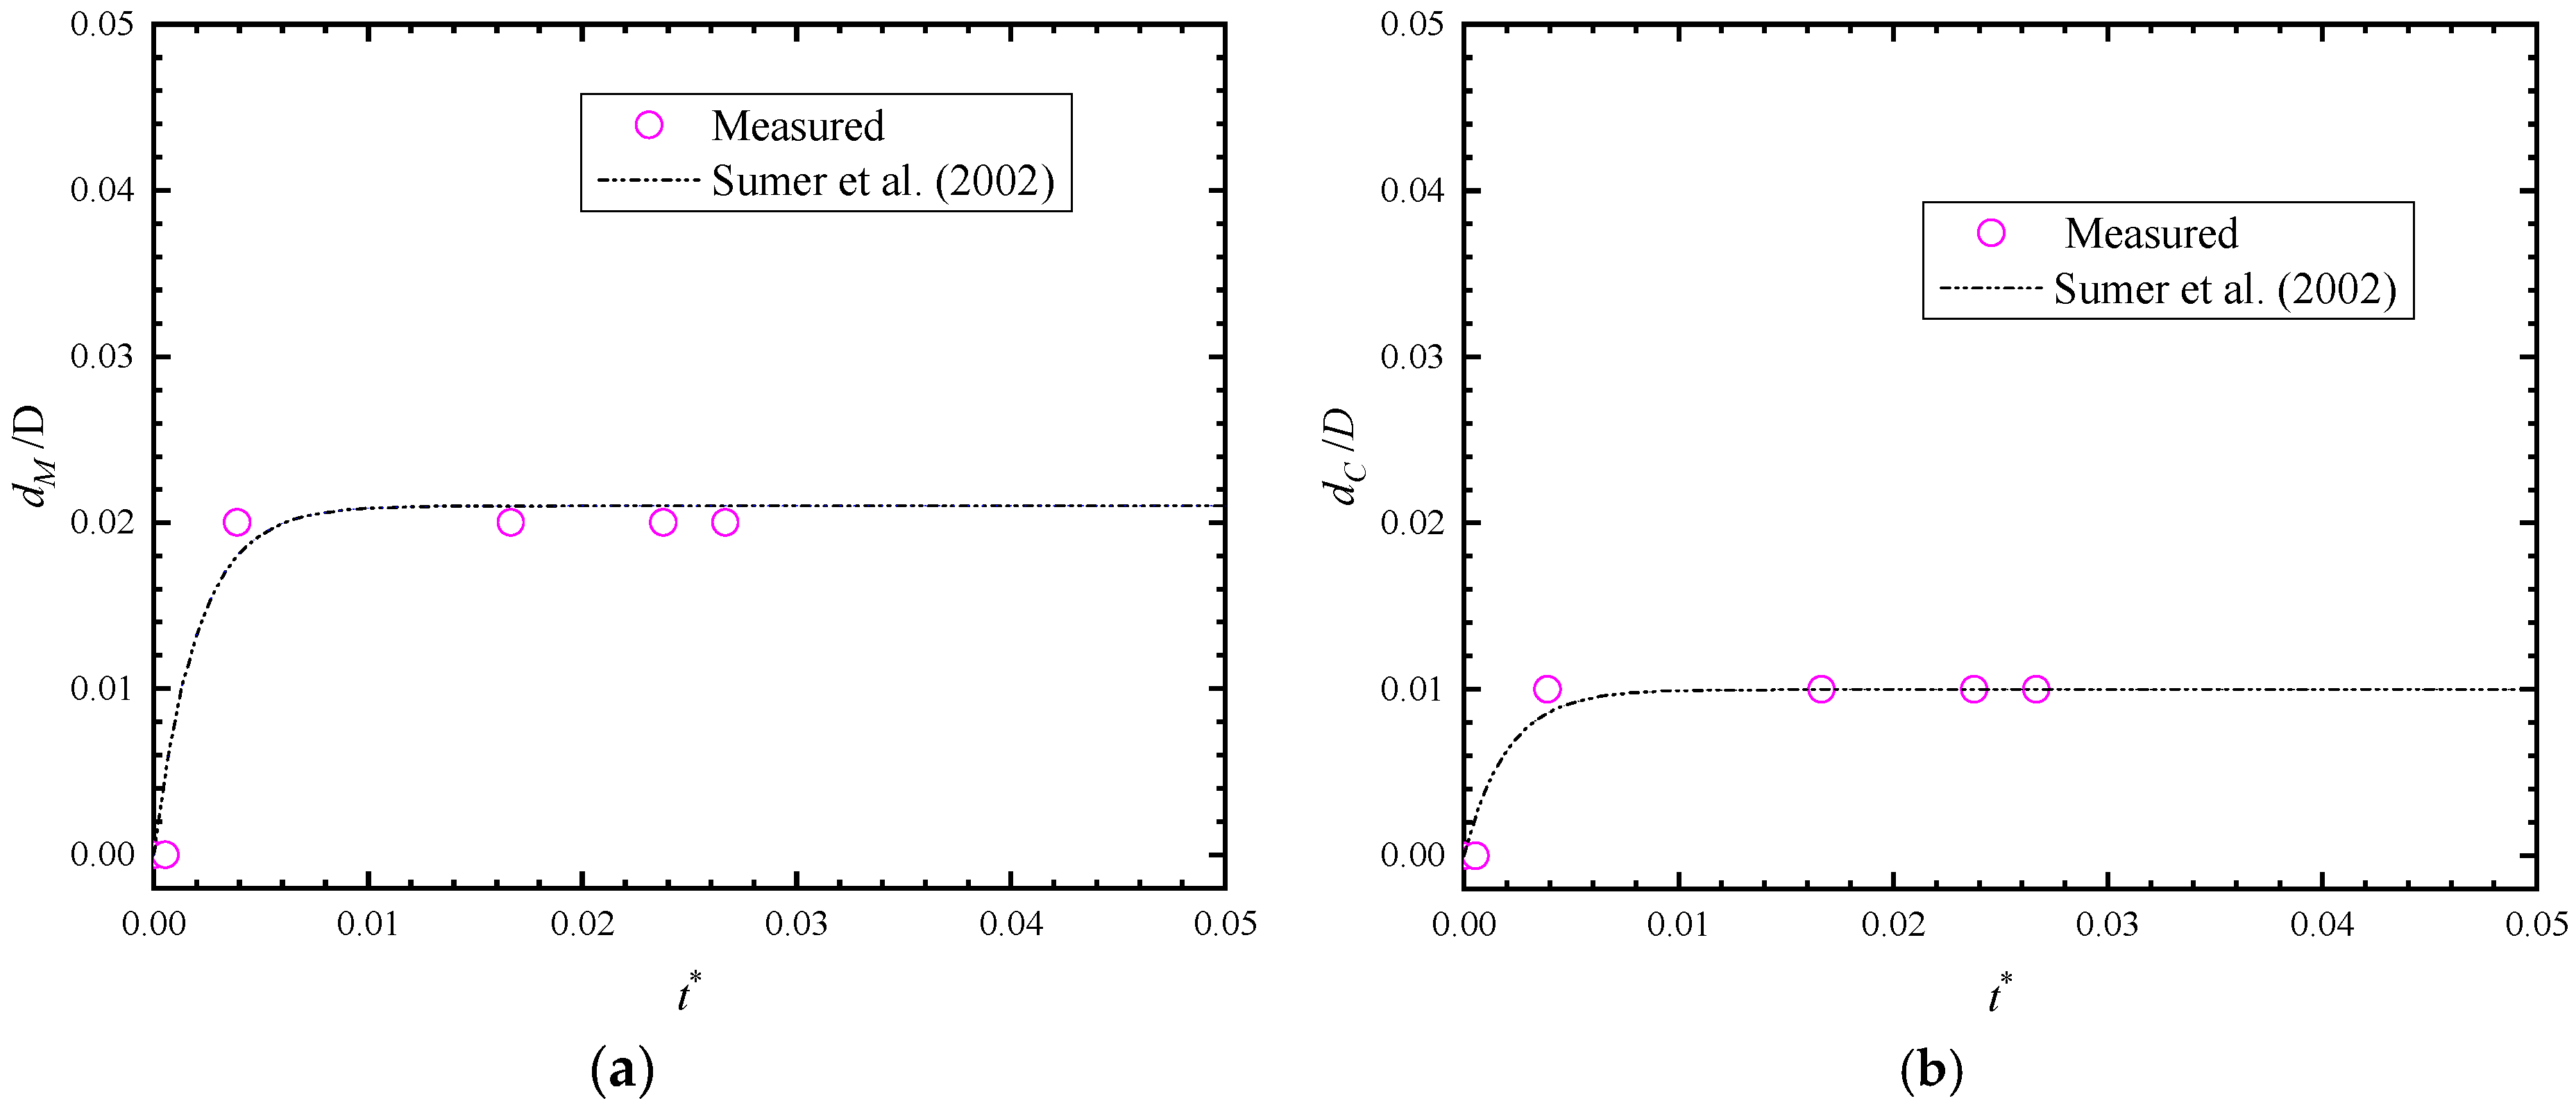
Based on Equations (8) and (9), in this study, a better fitted equation, i.e., Equation (10), is proposed to predict the SC piles. In addition, Equation (11) was introduced from [13] to non-dimensionalize the time factor. Ettema [25] divided the evolutions of the scour depth into three phases: an initial rapidly scouring phase, a gradually decreasing scouring phase, and an equilibrium phase. In Equation (10), the scouring time for the initial phase is far less than that of the second phase. Figure 4a,b shows the non-dimensional evolutions of the scour depths at KM and KC. It is clear that the proposed Equation (10) fits the measured data better than Equation (8). A similar trend is found in Figure 5. For test 3 (CC pile), the scour depths at KM and KC developed much too quickly with extremely small values. Relatively little experiment data are shown in the second scouring phase. The curves in Figure 6 fit well with those of [8]. Thus, there is no need to use the proposed equation.
where is the equilibrium scour depth, is initial scouring time for the first phase, and is the second scouring phase with .
3.3. Profiles and Topographies
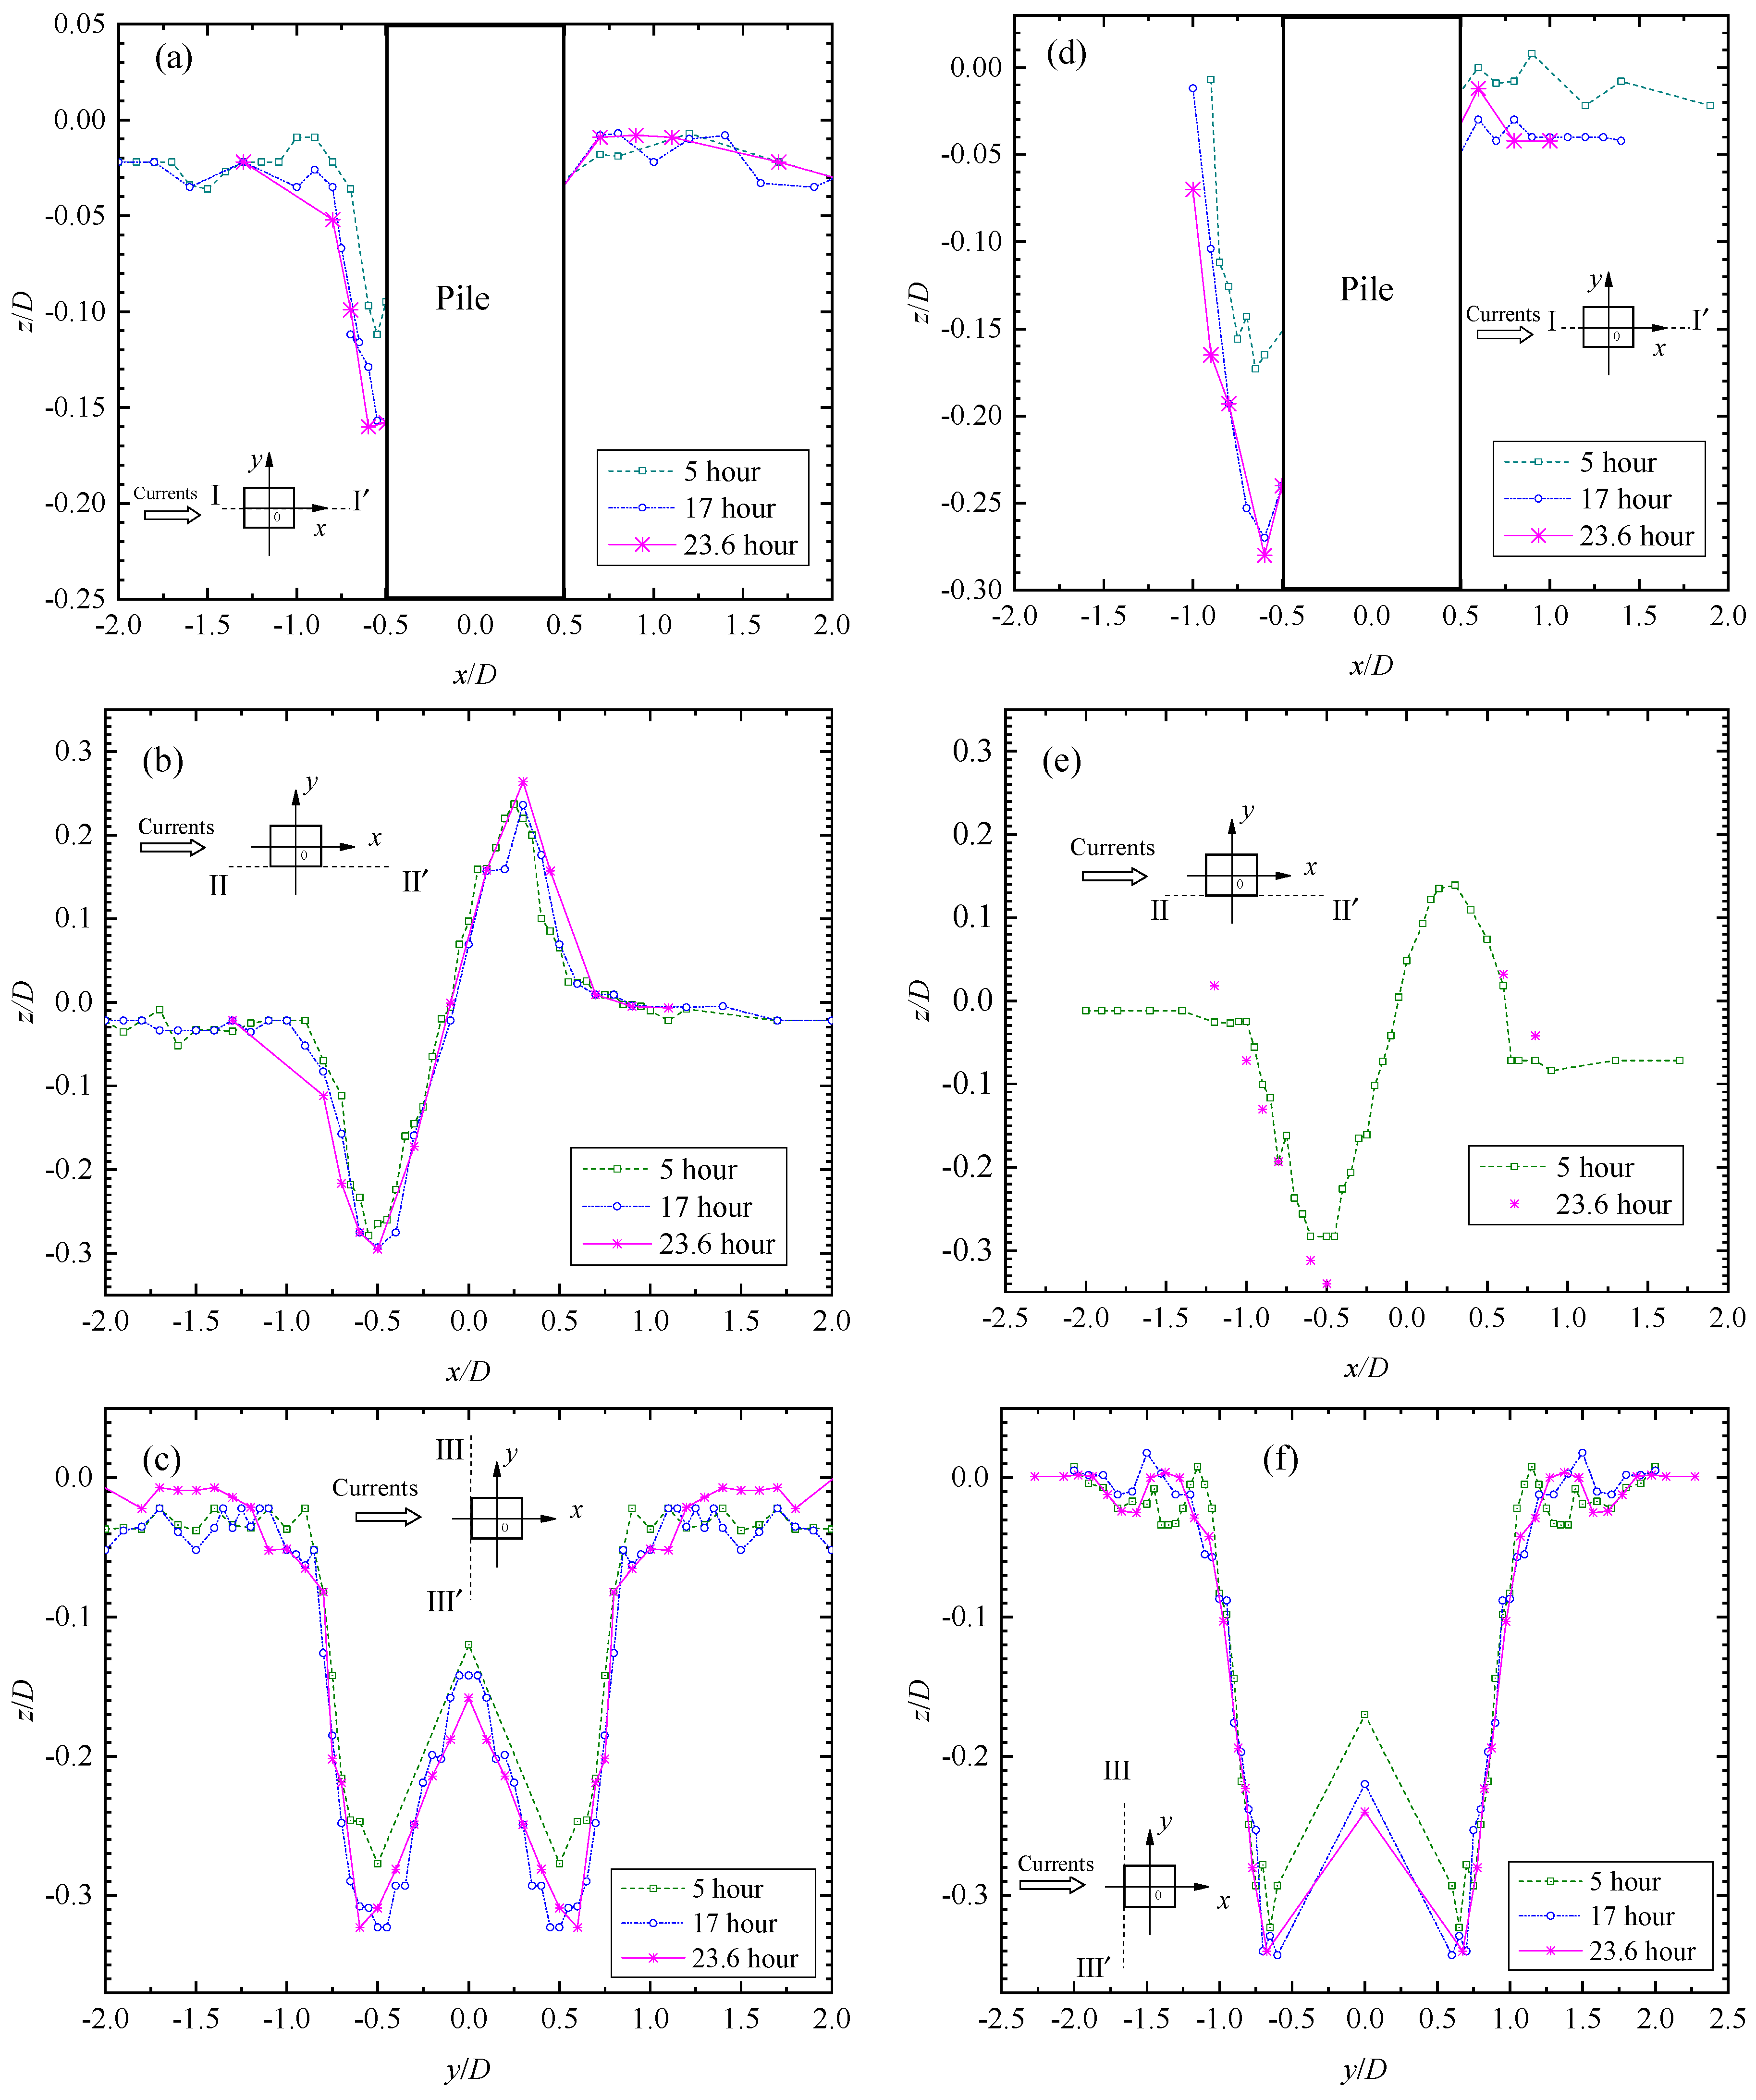
Before the topographies of the three tests were measured, the equilibrium states of the local scour experiments were determined. These determinations were the results of comparing the measured scour depth evolutions in Figure 3 and the evolutions of the bed profiles around the piles in Figure 7. For the SC piles of test 1 and test 2, the scour profiles aligned with the sections are almost coincident at 17 h and 23.6 h. For the CC pile of test 3, the scour depths were extremely small and little change was shown during a 4-h period. Judging from these data, the scouring and deposits around the piles were thought to be at equilibrium.
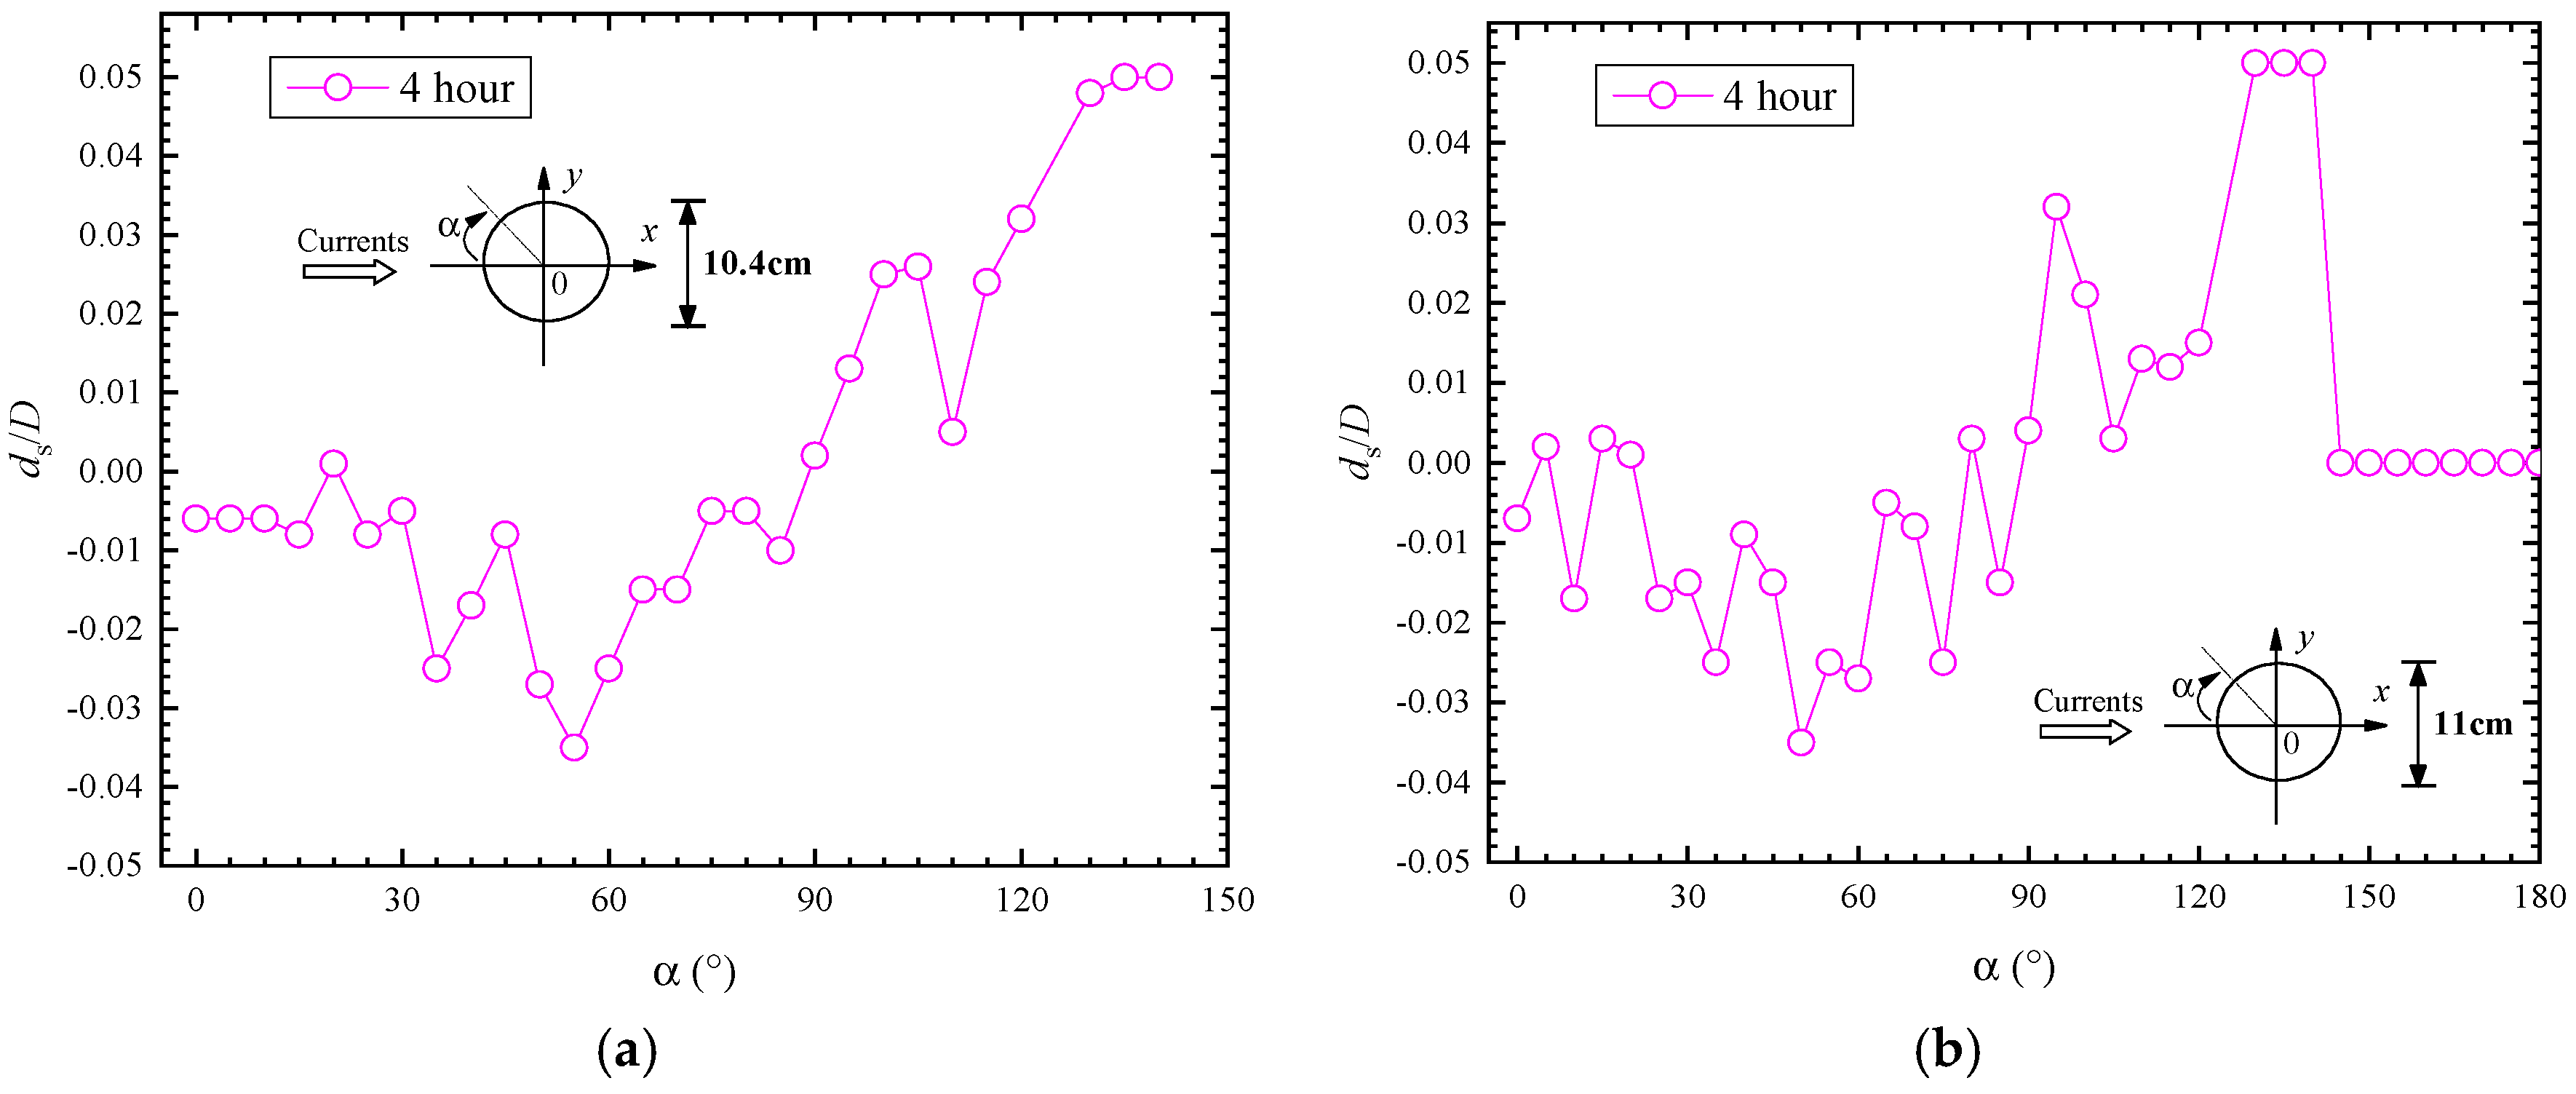
During the three tests, local scouring around the piles was observed, but little suspended sediment transport was seen. Scouring was found to start at the two upstream corners of the piles during the three tests. The settlement deposition height was observed to reach approximately 1 cm at the lateral sides of the piles within 10 min for test 1. In addition, the deposition height for test 2 was much higher. After 25 min, scouring was not observed at KC for the two SC piles either. As stated by [13], this indicates that the horseshoe vortex in front of the piles is insufficiently strong to roll up the sediment particles. However, the extension from the upstream corner to the upstream symmetry boundary of test 2 was found to be faster than that of test 1. The maximum scour depths close to the CC pile (test 3) were at a position of 50° to 55°, as shown in Figure 8. Zhao et al. [13] found that the concentrated streamlines had more of an effect than the horseshoe vortex at a relatively low current velocity (slightly higher than the critical velocity) for the SC piles. According to the experiment results, this conclusion is also suitable for the clear-water scouring conditions and CC piles. However, it cannot be concluded that no sediment particles were scoured by the horseshoe vortex. Guan et al. [29] found that the size of the horseshoe vortex increased with the scour hole. It is believed that the horseshoe vortex in front of the pile took part in the scouring as soon as the upstream corner extended to the upstream symmetry boundary. This was determined through observations during the scouring and the slopes in front of the SC piles, as shown in Figure 7a (−0.55 < x/D < −0.5) and Figure 7e (−0.6 < x/D < −0.5).
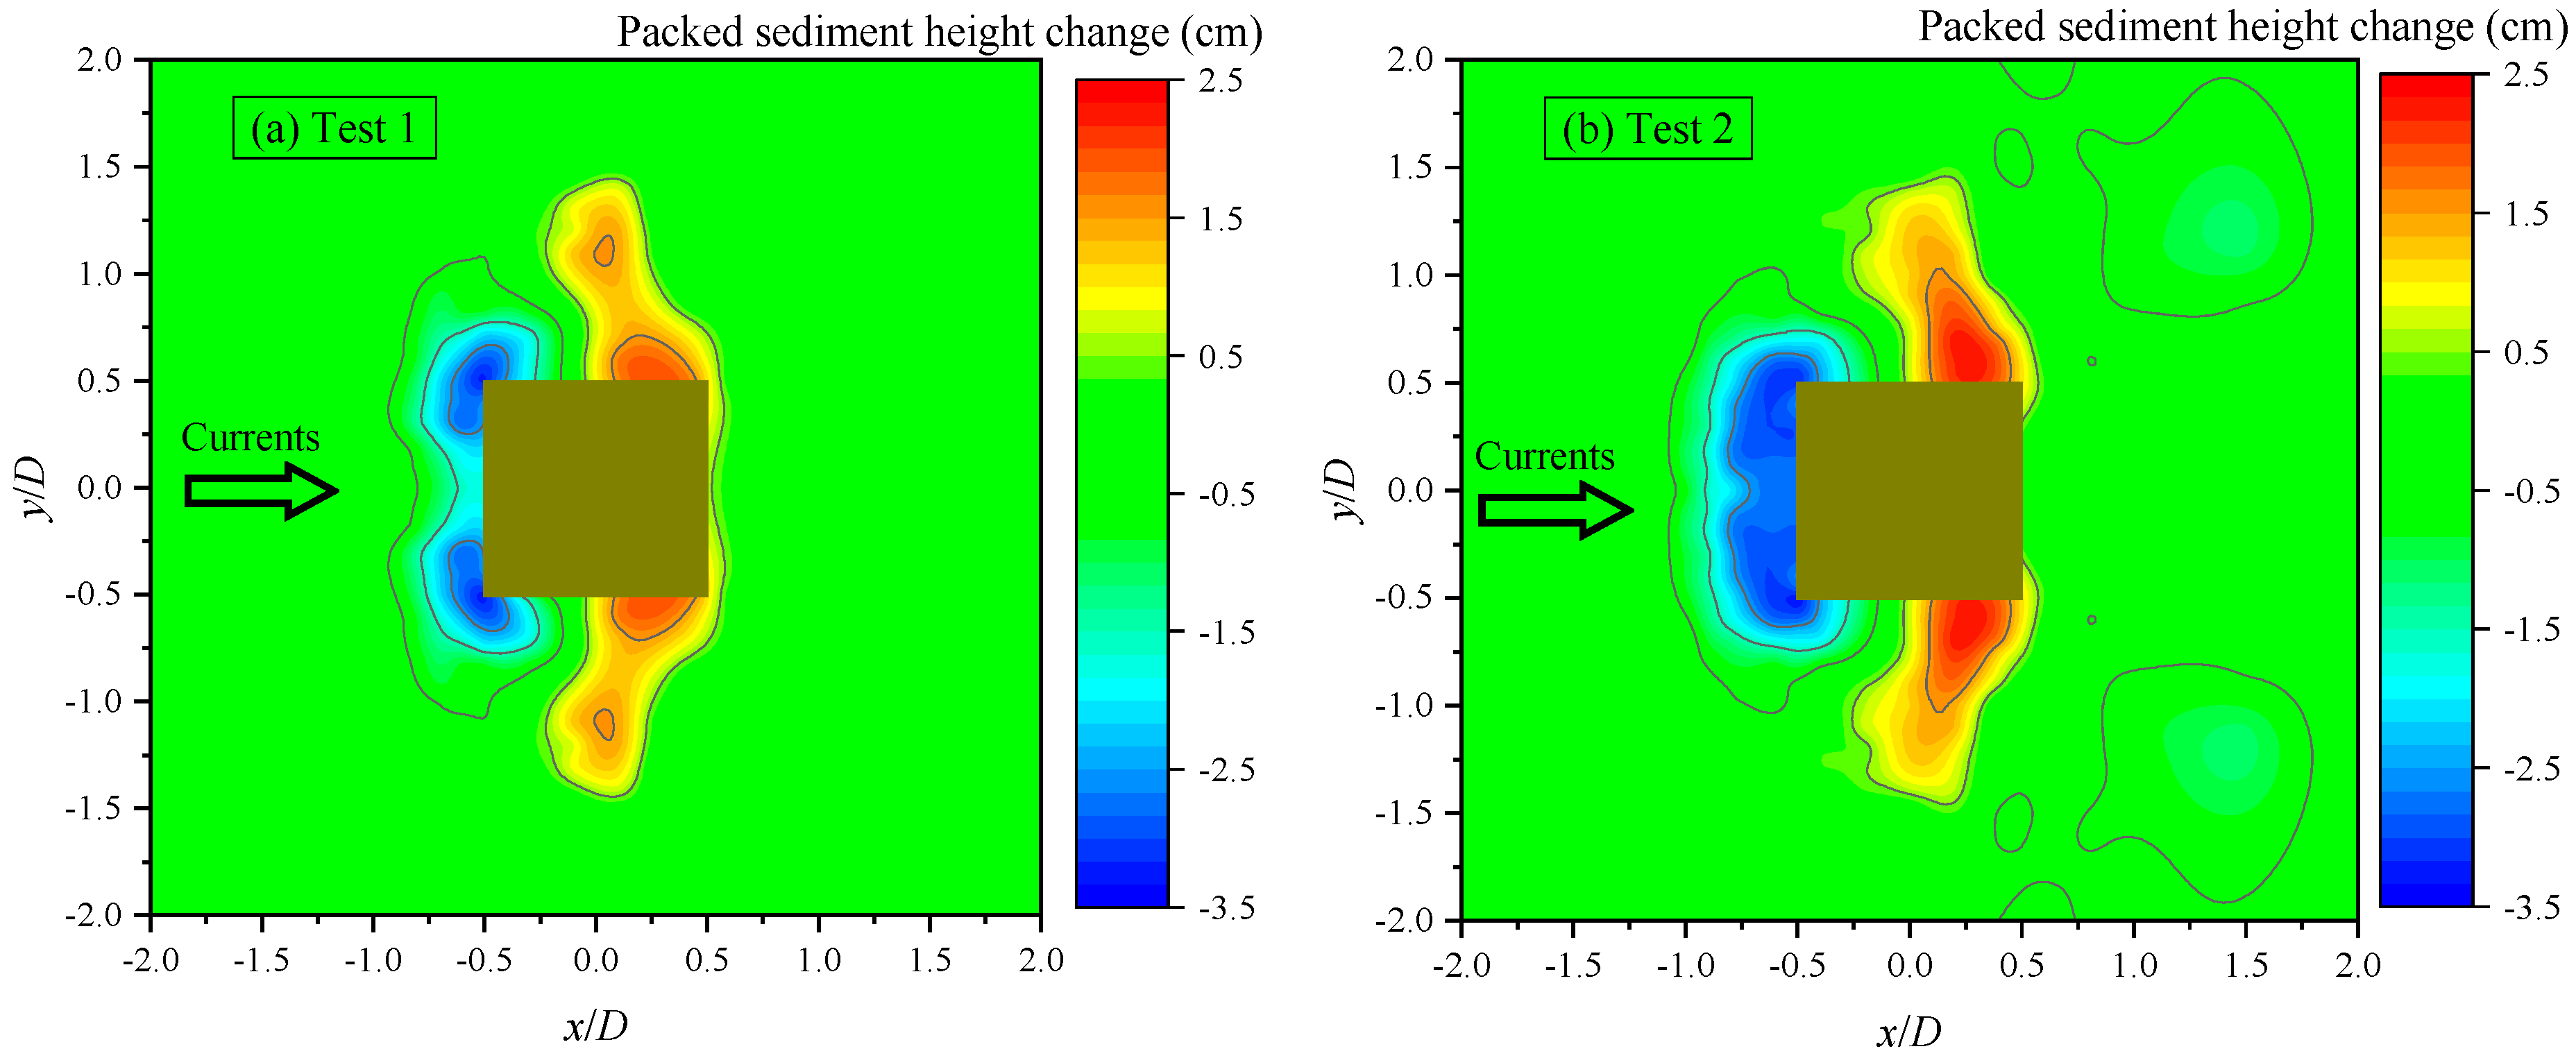
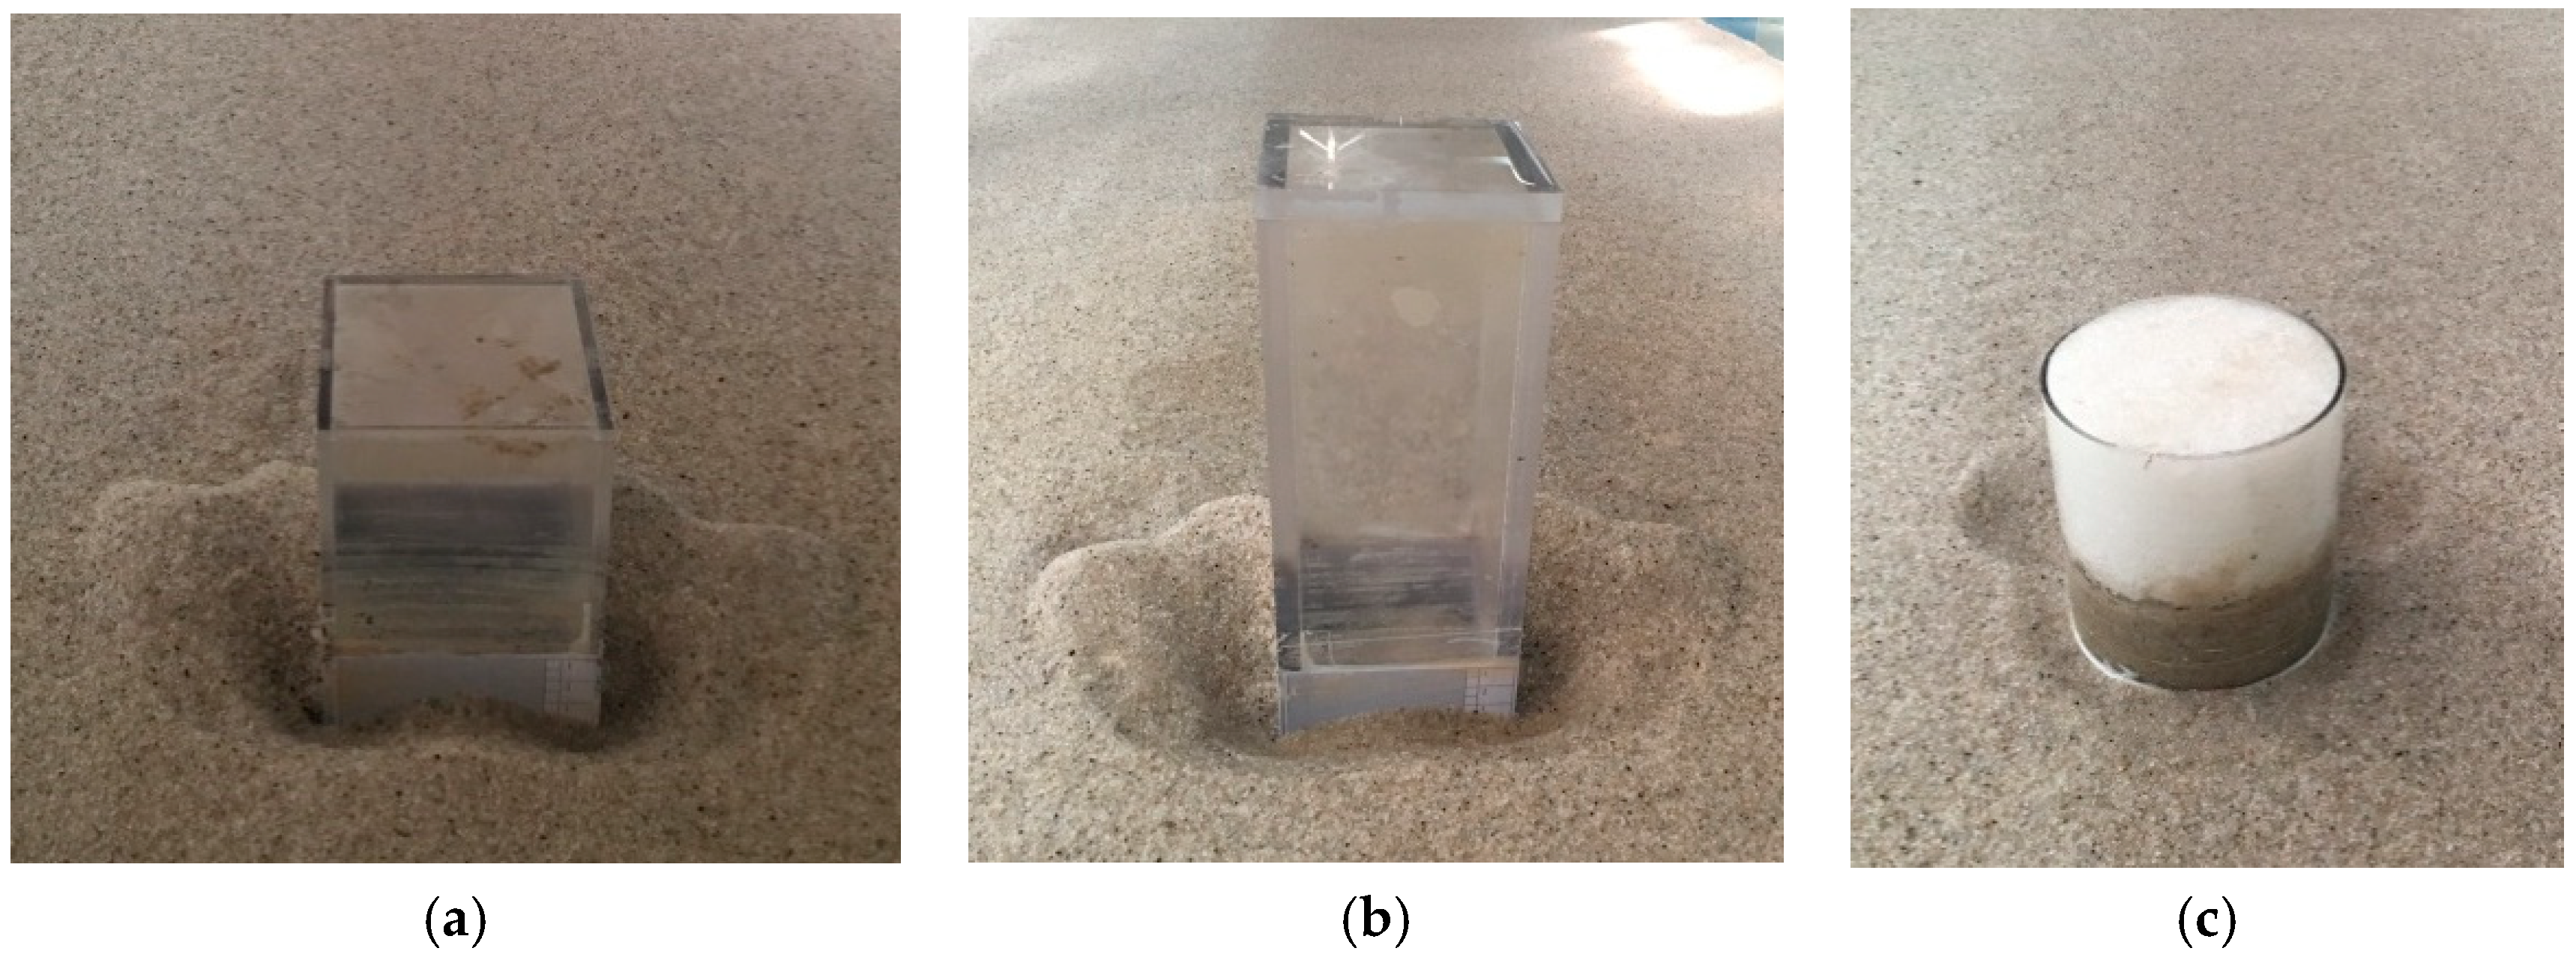
The ultimate topographies and photographs of the three tests are shown in Figure 9 and Figure 10. For the SC piles of tests 1 and 2, the scouring and deposit distributions were similar (Figure 9a,b). Maximum scour depths were seen at two upstream corners. The depositions were mainly at two mid-rear sides. Owing to the larger and wider extension of the concentrated streamlines for the higher SC pile (test 2), the scour holes sizes and the maximum deposition height were larger than that of test 1. The sediment deposition behind the SC pile in Figure 9a was found to be higher than that of Figure 9b. However, the same values of the maximum scour depths for tests 1 and 2 indicate that the amplified shear stress at the upstream corners was dependent on the pile cross-section rather than on the pile height. This conclusion is applicable for a pile width to flume width ratio that is smaller than 1/12.
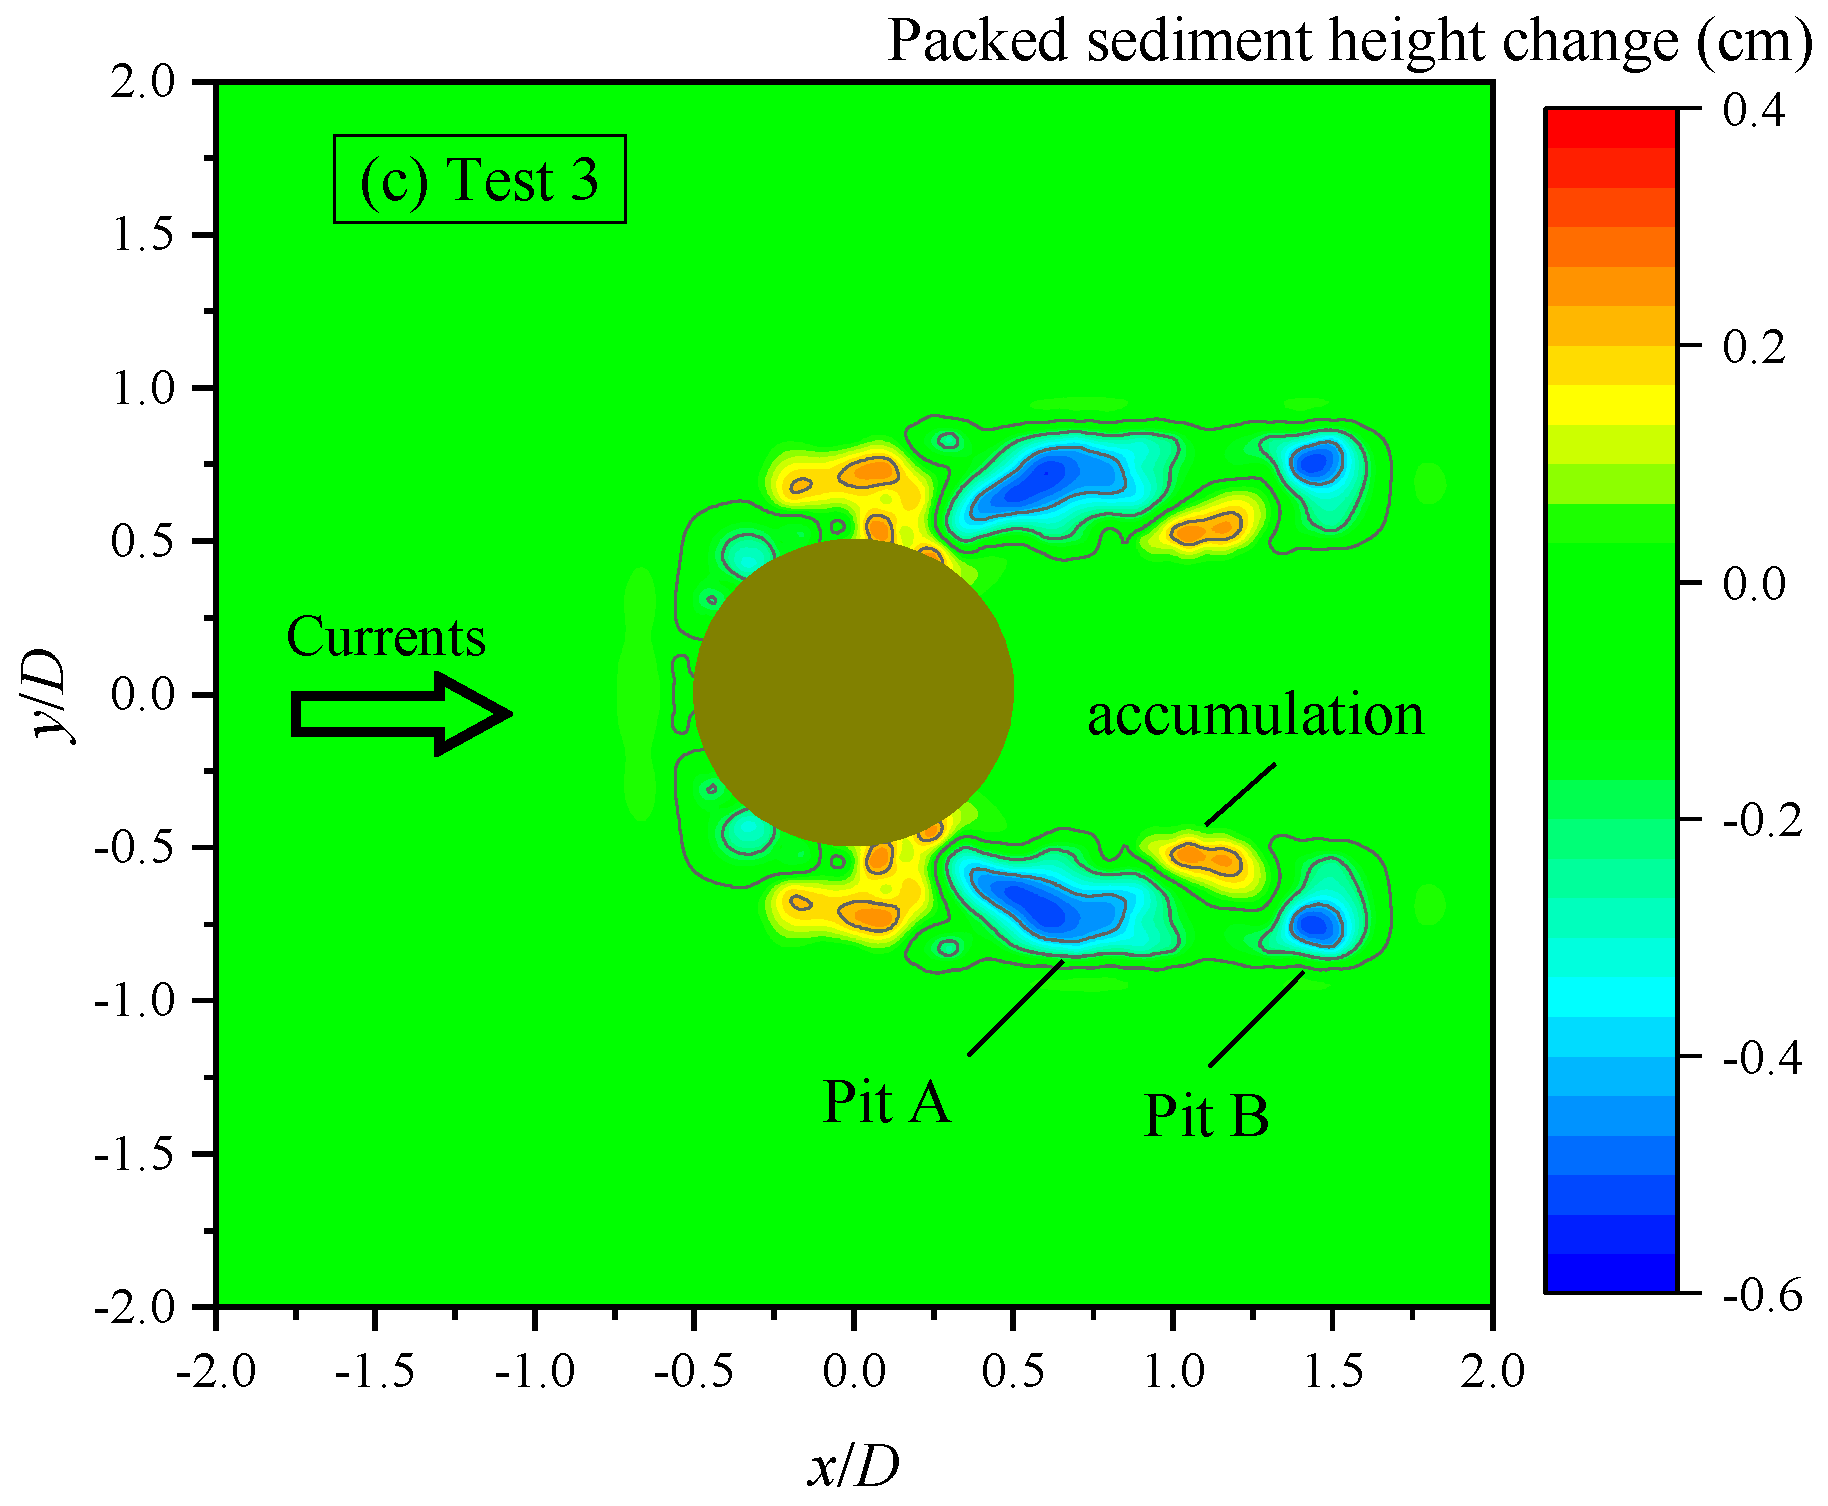
For the CC pile (Figure 9c and Figure 10c), the distributions of scouring were quite different from the SC piles. Apart from the far shallower scour depth upstream of the pile, the volume of the sediment deposition close to the lateral sides of the pile was lower. Moreover, the maximum scour depth was found at the scour pits downstream of the CC pile (Figure 9c). It is notable to point out that the shapes of these scour pits were almost identical to the wake vortex that was experimented by [30]. According to [31], the wake scouring was caused by the primary wake vortices and concentrated streamlines. Also, he pointed out that upstream and wake scouring interactions were through the action of the three-dimensional horseshoe vortexes. Thus, the interactions of the wake vortex and the concentrated streamlines flowing down with the currents were thought to be responsible for these scour pits. Sediments were accumulated owing to the interactions of the two opposite vortexes.
4. Conclusions
Experimental tests of local scouring around the submerged vertical SC and CC piles under steady currents were carried out. All tests were conducted under clear-water scour conditions with a relative Shields parameter of . Comparisons of three different piles including the evolutions of the key points scour depths, equations for the scour depth prediction, scouring, and the deposition distributions were conducted. The main conclusions in this paper are as follows:
(1) Under clear-water scour conditions, scouring started at the two upstream corners of the SC pile or CC piles. When the scour hole extended to the upstream symmetry boundary of the pile, a horseshoe vortex in front of the pile took part in scouring the sediments.
(2) The concentrated streamlines were the main mechanisms of the upstream scouring under low flow intensities. The horseshoe vortex together with the wake vortex was found to play a minor role in the local scouring. The downflow in front of the pile increased with the pile height, producing a larger horseshoe vortex.
(3) For the SC piles, maximum scour depths were found at KM and were dependent on the cross-section when the pile width to flume ratio was smaller than 1/12. For the CC pile, the scour depth at KM (50° to 55°) was also larger than that of KC. The scour depths of the SC piles at KM and KC were far larger than those of the CC pile. The rounded CC pile could significantly reduce the scour depth compared to the sharp SC piles.
(4) The proposed Equation (11) predicted the scour depths well at KM for the SC piles. The exponential Equation (8) developed by [8] can be used to predict the scour depth at KC for the SC and CC piles.
(5) The scour distributions were quite different between the SC piles and the CC pile. The maximum scour depth of the CC pile, which was due to the interactions between the concentrated streamlines and the wake vortex, occurred downstream from the pile.
Author Contributions
Data curation, formal analysis, investigation, methodology, resources, software, validation and writing—original draft were contributed by S.D. Data curation, formal analysis, funding acquisition, investigation, methodology, supervision and writing—review and editing were contributed by B.L.
Funding
This research was funded by the National Science Fund grant number [51679223, 51739010], the 111 Project grant number [B14028] and a grant from the 7th Generation Ultra-Deep-water Drilling Rig Innovation Project.
Acknowledgments
The authors would like to acknowledge the support of the National Science Fund (Grant No. 51679223, 51739010), the 111 Project (No. B14028), and a grant from the 7th Generation Ultra-Deep-water Drilling Rig Innovation Project. The authors would like to acknowledge the editor and three reviewers for their constructive advices.
Conflicts of Interest
The authors declare no conflict of interest.
Appendix A

Table A1.
Random standard uncertainties in velocity measurements.
| z (cm) | ||
|---|---|---|
| 40.06 | 22.54 | 0.000659 |
| 41.08 | 22.94 | 0.000709 |
| 38.07 | 21.65 | 0.000728 |
| 21.98 | 22.46 | 0.000728 |
| 43.37 | 22.51 | 0.000803 |
| 12.15 | 21.48 | 0.000901 |
| 32.23 | 21.80 | 0.000903 |
| 18.05 | 22.40 | 0.000935 |
| 26.04 | 21.79 | 0.000945 |
| 13.99 | 22.63 | 0.001003 |
| 34.03 | 22.10 | 0.001022 |
| 20.15 | 22.05 | 0.00104 |
| 30.01 | 22.52 | 0.001047 |
| 23.93 | 22.08 | 0.001057 |
| 16.08 | 22.23 | 0.001097 |
| 35.84 | 22.53 | 0.001309 |
| 10.06 | 19.55 | 0.00131 |
| 6.09 | 20.34 | 0.001353 |
| 4 | 16.38 | 0.001699 |
| 28.01 | 22.62 | 0.001844 |
| 8.01 | 19.99 | 0.001896 |
| 1.94 | 14.64 | 0.002259 |
| 1.03 | 14.93 | 0.00243 |
References
- Gaissinski, I.; Rovenski, V. Modeling in Fluid Mechanics: Instabilities and Turbulence; Chapman and Hall: NewYork, NY, USA, 2018; p. 513. [Google Scholar]
- Longo, S. Two-Phase Flow Modeling of Sediment Motion in Sheet-Flows above Plane Beds. J. Hydraul. Eng. 2005, 131, 366–379. [Google Scholar] [CrossRef] [Green Version]
- Longo, S.; Valiani, A.; Lanza, L.; Liang, D. Experimental study of the grain-water mixture flow past a cylinder of different shapes. Eur. J. Mech. B Fluids 2013, 38, 101–113. [Google Scholar] [CrossRef]
- Ribberink, J.S.; Katopodi, I.; Ramadan, K.A.H.; Koelewijn, R.; Longo, S. Sediment Transport Under (NON)-Linear Waves and Currents. In Proceedings of the 24th International Conference on Coastal Engineering, Kobe, Japan, 23–28 October 1994; pp. 2527–2541. [Google Scholar]
- Soulsby, R. Dynamics of Marine Sands: A Manual for Practical Applications; Thomas Telford: London, UK, 1997; p. 246. [Google Scholar]
- Ettema, R.; Constantinescu, G.; Melville, B.W. Flow-field complexity and design estimation of pier-scour depth: sixty years since Laursen and Toch. J. Hydraul. Eng. 2017, 143, 03117006. [Google Scholar] [CrossRef]
- Sui, T.T.; Zhang, C.; Jeng, D.; Guo, Y.; Zheng, J.; Zhang, W.; Shi, J. Wave-induced seabed residual response and liquefaction around a mono-pile foundation with various embedded depth. Ocean Eng. 2019, 173, 157–173. [Google Scholar] [CrossRef]
- Sumer, B.M.; Fredsøe, J. The Mechanics of Scour in the Marine Environment; World Scientific: Singapore, 2002; p. 536. [Google Scholar]
- Yang, L.P.; Guo, Y.K.; Shi, B.; Kuang, C.P.; Xu, WL.; Cao, S.Y. Study of scour around submarine pipeline with a rubber plate or rigid spoiler in wave conditions. J. Waterw. Port Coastal Ocean Eng. 2012, 138, 484–490. [Google Scholar] [CrossRef]
- Yang, Y.F.; Melville, B.W.; Macky, H.G.; Shamseldin, A.Y. Local Scour at Complex Bridge Piers in Close Proximity under Clear-Water and Live-Bed Flow Regime. Water 2019, 11, 1530. [Google Scholar] [CrossRef]
- Zhang, Q.; Draper, S.; Cheng, L.; Zhao, M.; An, H. Experimental Study of Local Scour Beneath Two Tandem Pipelines in Steady Current. Coastal Eng. J. 2017, 59, 1. [Google Scholar] [CrossRef]
- Tsutsui, T. Flow around a cylindrical structure mounted in a plane turbulent boundary layer. J. Wind Eng. Ind. Aerodyn. 2012, 104, 239–247. [Google Scholar] [CrossRef]
- Zhao, M.; Zhu, X.; Cheng, L.; Teng, B. Experimental study of local scour around subsea caissons in steady currents. Coastal Eng. 2012, 60, 30–40. [Google Scholar] [CrossRef]
- Dey, S.; Raikar, R.V.; Roy, A. Scour at submerged cylindrical obstacles under steady flow. J. Hydraul. Eng. 2008, 134, 105–109. [Google Scholar] [CrossRef]
- Zhao, M.; Cheng, L.; Zang, Z. Experimental and numerical investigation of local scour around a submerged vertical circular cylinder in steady currents. Coastal Eng. 2010, 57, 709–721. [Google Scholar] [CrossRef]
- Sarkar, A.; Ratha, D. Flow around submerged structures subjected to shallow submergence over plane bed. J. Fluids Struct. 2014, 44, 166–181. [Google Scholar] [CrossRef]
- Yao, W.D.; An, H.W.; Draper, S.; Cheng, L.; Harris, J.M. Experimental investigation of local scour around submerged piles in steady current. Coastal Eng. 2018, 142, 27–41. [Google Scholar] [CrossRef]
- Euler, T.; Herget, J. Obstacle-Reynolds-number based analysis of local scour at submerged cylinders. J. Hydraul. Res. 2011, 49, 267–271. [Google Scholar] [CrossRef]
- Chavan, R.; Kumar, B. Prediction of scour depth and dune morphology around circular bridge piers in seepage affected alluvial channels. Environ. Fluid Mech. 2018, 18, 923–945. [Google Scholar] [CrossRef]
- Cheng, N.S.; Zhao, K. Difference between static and dynamic angle of repose of uniform sediment grains. Int. J. Sediment Res. 2017, 32, 149–154. [Google Scholar] [CrossRef]
- Hills, R.G.; Maniaci, D.C.; Naughton, J.W. V and V Framework, Sandia National Laboratories. Available online: https://prod-ng.sandia.gov/techlib-noauth/access-control.cgi/2015/157455.pdf (accessed on 29 August 2019).
- Bachynski, E.; Thys, M.; Delhaye, V. Dynamic response of a monopile wind turbine in waves: Experimental uncertainty analysis for validation of numerical tools. Appl. Ocean Res. 2019, 89, 96–114. [Google Scholar] [CrossRef]
- Coleman, H.W.; Steele, W.G. Experimentation, Validation, and Uncertainty Analysis for Engineers; Wiley: Hoboken, NJ, USA, 2018; p. 376. [Google Scholar]
- Guo, J.K. Time-dependent clear-water scour for submerged bridge flows. J. Hydraul. Res. 2011, 49, 744–749. [Google Scholar] [CrossRef]
- Ettema, R. Scour at Bridge Piers. Ph.D. Thesis, University of Auckland, Auckland, New Zealand, 1980. [Google Scholar]
- Simpson, R.L. Junction flows. Ann. Rev. Fluid Mech. 2001, 33, 415–443. [Google Scholar] [CrossRef]
- Khosronejad, A.; Kang, S.; Sotiropoulos, F. Experimental and computational investigation of local scour around bridge piers. Adv. Water Res. 2012, 37, 73–85. [Google Scholar] [CrossRef]
- Tseng, M.H.; Yen, C.L.; Song, C.C.S. Computation of three-dimensional flow around square and circular piers. Int. J. Numer. Methods Fluids 2000, 34, 207–227. [Google Scholar] [CrossRef]
- Guan, D.W.; Chiew, Y.M.; Wei, M.X.; Hsieh, S.C. Characterization of horseshoe vortex in a developing scour hole at a cylindrical bridge pier. Int. J. Sediment Res. 2019, 34, 118–124. [Google Scholar] [CrossRef]
- Ozgoren, M. Flow structure in the downstream of square and circular cylinders. Flow Meas. Instrum. 2006, 17, 225–235. [Google Scholar] [CrossRef]
- Dargahi, B. Controlling mechanism of local scouring. J. Hydraul. Eng. 1990, 116, 1197–1214. [Google Scholar] [CrossRef]
Figure 1.
A brief view of the test flume. (a) Side view of the flume; (b) Top view of the test section; (c) Definitions of the profiles.
Figure 1.
A brief view of the test flume. (a) Side view of the flume; (b) Top view of the test section; (c) Definitions of the profiles.

Figure 2.
Velocity distributions along the flow depth.

Figure 3.
Key points’ scour depths evolutions over time. (a) Upstream corner scour depth evolution; (b) Center of upstream scour depth evolution.
Figure 3.
Key points’ scour depths evolutions over time. (a) Upstream corner scour depth evolution; (b) Center of upstream scour depth evolution.

Figure 4.
Non-dimensional scour depth evolutions for test 1. (a) Upstream corner scour depth evolution; (b) Center of upstream scour depth evolution.
Figure 4.
Non-dimensional scour depth evolutions for test 1. (a) Upstream corner scour depth evolution; (b) Center of upstream scour depth evolution.

Figure 5.
Non-dimensional scour depth evolutions for test 2. (a) Upstream corner scour depth evolution; (b) Center of upstream scour depth evolution.
Figure 5.
Non-dimensional scour depth evolutions for test 2. (a) Upstream corner scour depth evolution; (b) Center of upstream scour depth evolution.

Figure 6.
Non-dimensional scour depth evolutions for test 3. (a) Upstream corner scour depth evolution; (b) Center of upstream scour depth evolution.
Figure 6.
Non-dimensional scour depth evolutions for test 3. (a) Upstream corner scour depth evolution; (b) Center of upstream scour depth evolution.

Figure 7.
Evolutions of bed profiles. (a–c) are sections of test 1; (d–f) are sections of test 2.

Figure 8.
Scour depths close to the CC pile (test 3). (a) On a circle with a diameter of 10.4 cm; (b) On a circle with a diameter of 11 cm.
Figure 8.
Scour depths close to the CC pile (test 3). (a) On a circle with a diameter of 10.4 cm; (b) On a circle with a diameter of 11 cm.

Figure 9.
Contours of bed levels around the piles. (a) Test 1; (b)Test 2; (c) Test 3.


Figure 10.
Photographs of scour holes after scouring. (a) Test 1; (b) Test 2; (c) Test 3.

Table 1.
Test parameters.
| Parameters | Values |
|---|---|
| Median particle size of sand d50 (mm) | 0.65 |
| Sediment’s non-uniformity σ = (d85/d15)0.5 | 1.27 |
| Sediment’s density ρs (kg/m3) | 2650 |
| Water depth h (cm) | 50 |
| Water gravity g (m2/s) | 9.8 |
| Water density ρ (kg/m3) | 1000 |
| Kinematic viscosity of water ν (m2/s) | 10−6 |
| Critical Shields parameter | 0.03 |
| Depth averaged velocity U (cm/s) | 23.0 |
| Shields parameter from skin friction θs | 0.01 |
| Total Shields parameter θ | 0.01 |
| Skin Nikuradse roughness (mm) | 1.625 |
| Nikuradse roughness (mm) | 0.6 |
| Boundary layer thickness δ (cm) | 43 |
Table 2.
List of tests.
| Test | Pile Type | D (cm) | hc (cm) | t (hour) | dCe (cm) | dMe (cm) |
|---|---|---|---|---|---|---|
| 1 | SC | 10 | 10 | 23.6 | 1.7 | 3.4 |
| 2 | SC | 10 | 20 | 23.6 | 2.4 | 3.4 |
| 3 | CC | 10 | 10 | 4 | 0.1 | 0.2 |
Note: dMe is the equilibrium of the averaged scour depth of the two upstream corners (KM), and dCe is the equilibrium of the scour depth at the center of the upstream boundary point (KC). CC: circular cross-section, SC: square cross-section.
© 2019 by the authors. Licensee MDPI, Basel, Switzerland. This article is an open access article distributed under the terms and conditions of the Creative Commons Attribution (CC BY) license (http://creativecommons.org/licenses/by/4.0/).
Share and Cite
MDPI and ACS Style
Du, S.; Liang, B. Comparisons of Local Scouring for Submerged Square and Circular Cross-Section Piles in Steady Currents. Water 2019, 11, 1820. https://doi.org/10.3390/w11091820
AMA Style
Du S, Liang B. Comparisons of Local Scouring for Submerged Square and Circular Cross-Section Piles in Steady Currents. Water. 2019; 11(9):1820. https://doi.org/10.3390/w11091820
Chicago/Turabian StyleDu, Shengtao, and Bingchen Liang. 2019. "Comparisons of Local Scouring for Submerged Square and Circular Cross-Section Piles in Steady Currents" Water 11, no. 9: 1820. https://doi.org/10.3390/w11091820
Note that from the first issue of 2016, this journal uses article numbers instead of page numbers. See further details here.